
Sample Category Title
Dollar Continues to Slide as FOMC Minutes Confirm September Rate Cut Likely
Dollar extended its broad decline overnight following release of FOMC minutes, which confirmed that a vast majority of Fed members see a rate cut in September as appropriate. However, the market reaction was relatively muted, as this outcome has already been largely priced in by traders. The real uncertainty centers on the size of the rate cut—whether Fed will opt for a modest 25bps reduction or take a more aggressive stance with 50bps cut. Current market pricing suggests about 35% probability of the latter.
Attention is now turning to Fed Chair Jerome Powell’s speech at the Jackson Hole Symposium on Friday, where investors will be keen to glean any hints about Fed’s upcoming decision. However, it’s unlikely that Powell will commit to a definitive course of action, given that Fed will have another set of key economic data, including CPI and NFP reports, before its next meeting.
For the week so far, Dollar remains the weakest performer, continuing to struggle amid expectations of an imminent rate cut. Canadian Dollar and Australian Dollar are also under pressure. In contrast, Swiss Franc has emerged as the strongest currency, followed by New Zealand Dollar and Japanese Yen. Euro and British Pound are positioning in the middle of the currency performance spectrum.
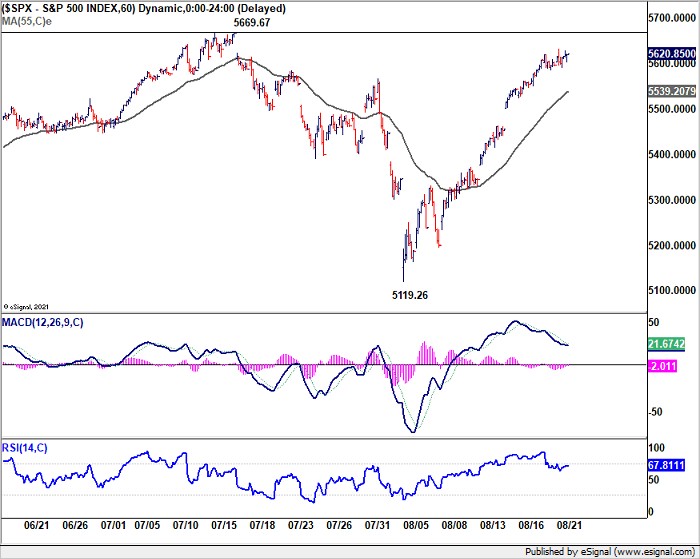
One notable development is Australian Dollar's loss of upside momentum, which seems to be mirroring the slowdown in US stock market rally, as major indexes approach the record highs set in July.
Technically, S&P 500's rally from 5119.26 has been losing steam as seen in H MACD. Break of 55 H EMA (now at 5539.20) will indicate initial rejection by 5669.67 high, and bring deeper pullback. Aussie could follow lower if that materializes.
In Asia, at the time of writing, Nikkei is up 0.63%. Hong Kong HSI is up 0.11%. China Shanghai SSE is down -0.01%. Singapore Strait Times is down -0.14%. Japan 10-year JGB yield is up 0.0110 at 0.877. Overnight, DOW rose 0.14%. S&P 500 rose 0.42%. NASDAQ rose 0.57%. 10-year yield fell -0.0400 to 3.778.
FOMC minutes: Vast majority see September rate cut as likely
Minutes from FOMC meeting held on July 30-31 reveal that a "vast majority" of participants believe it would likely be appropriate to ease monetary policy "at the next meeting" if incoming data aligns with expectations. This signals a strong possibility of a rate cut in September.
The minutes highlighted that economic activity had shown solid growth, inflation had made some further progress toward the target, and labor market conditions had eased. However, the Committee emphasized the importance of maintaining a "data-dependent" approach. Decisions, they noted, are based on the "evolution of the economy" rather than following a "preset path," and depend on the "totality of the incoming data" rather than any single data point.
In terms of risk management, the majority of participants acknowledged that risks to the employment goal had increased, while many noted that risks to the inflation goal had decreased. Some expressed concern that gradual easing in labor market conditions could lead to a "more serious deterioration."
On the other hand, several participants cautioned against reducing policy restraint too quickly or excessively, warning that it could lead to resurgence in aggregate demand and potentially undo progress on inflation. They pointed to risks such as economic shocks that could drive inflation higher or the possibility that inflation could be more persistent than currently anticipated.
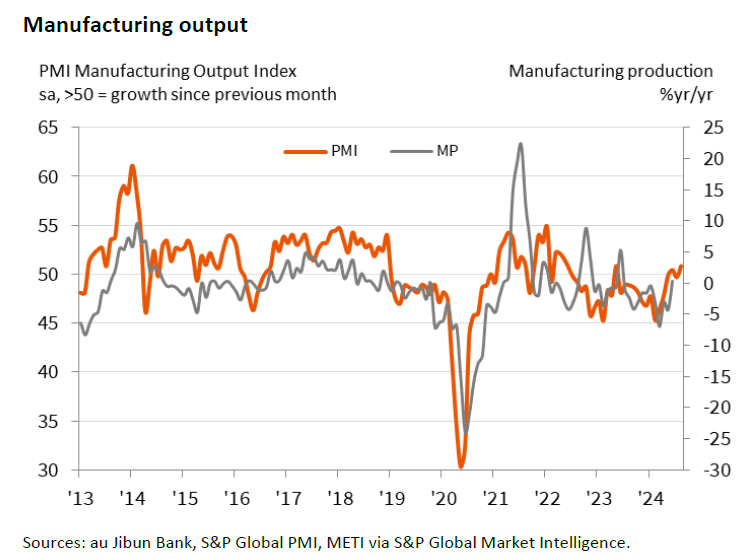
Japan's PMI composite rises to 53.0, increasing margin pressures
Japan's PMI data for August revealed a mixed yet overall positive picture for the economy. PMI Manufacturing inched up from 49.1 to 49.5, still indicating contraction but showing improvement. PMI Services increased from 53.7 to 54.0, signaling continued strong expansion in the service sector. As a result, PMI Composite, which combines both manufacturing and services, rose from 52.5 to 53.0, reflecting sustained overall growth.
Jingyi Pan, Economics Associate Director at S&P Global Market Intelligence, noted that the solid expansion of business activity at Japanese private sector firms continued into Q3. She highlighted that growth was largely driven by an acceleration in services activity, while manufacturing output returned to positive growth after a brief decline in July.
Pan pointed out that "overall optimism levels remained above average," suggesting that firms are confident about growth in the months ahead. However, she also warned of rising "margin pressures" across both manufacturing and service sectors. This concern arises as overall selling price inflation dropped to its lowest level since November 2023, even though average input costs rose at the fastest pace in 16 months.
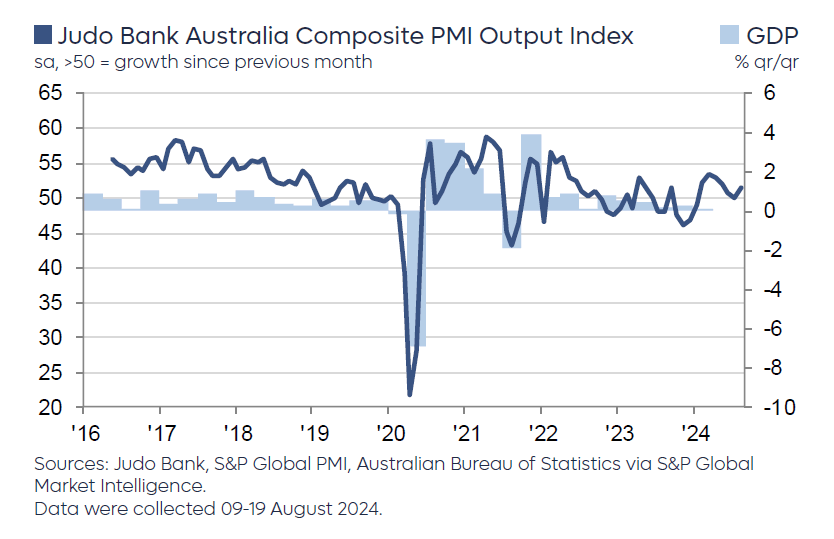
Australia's PMI composite rises to 51.4, inflation risks remain
Australia's PMI data for August revealed a slight uptick in economic activity, with Manufacturing PMI rising from 47.5 to 48.7, Services PMI increasing from 50.4 to 52.2, and Composite PMI climbing from 49.9 to 51.4.
Warren Hogan, Chief Economic Advisor at Judo Bank, noted "improvement in activity indicators," coupled with "further upward pressure on business costs," and "weakening in final prices." Hogan emphasized that the Australian economy continues to expand in the third quarter, with rising demand for labor being a positive sign.
Meanwhile, the final prices index dipped, indicating that Australian businesses are struggling to pass on higher costs to consumers. Hogan warned that if this trend continues, it could signal some easing of inflation pressures, but at the expense of business margins and profitability.
Hogan also expressed caution regarding the outlook for inflation, pointing out that the ongoing rise in business costs and improving economic activity—likely boosted by the tax cuts implemented in July—underscore the continued inflation risks in the economy.
He questioned the financial markets' certainty in pricing the next move in RBA's cash rate as a cut, stating, "There is nothing in these results that allows us to reduce the probability that the RBA may still have to raise the cash rate further before a concerted easing cycle can begin."
Looking ahead
Eurozone and UK PMI flash will be released in European session, along with ECB meeting accounts. Later in the day, US will release jobless claims, PMI flash and existing home sales.
EUR/AUD Daily Outlook
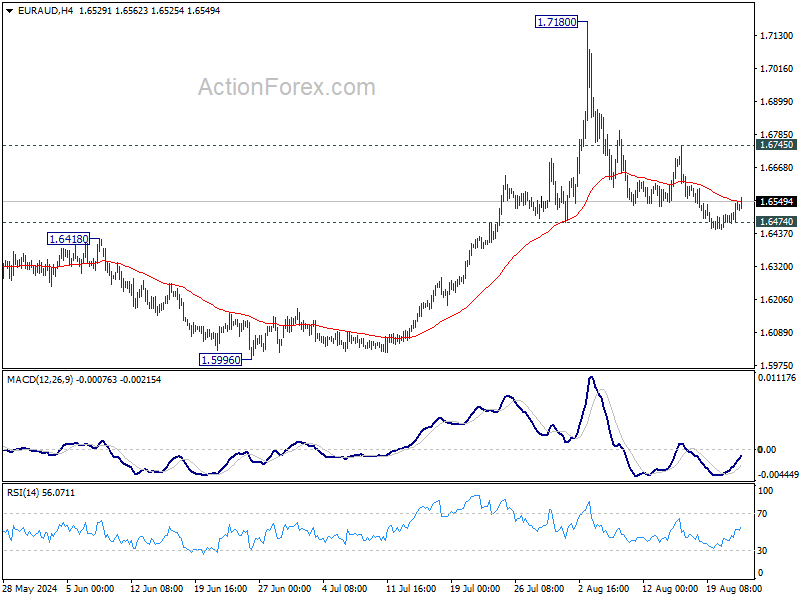
Daily Pivots: (S1) 1.6489; (P) 1.6518; (R1) 1.6564; More...
EUR/AUD recovered after failing to sustain below 1.6474 support, but stays below 1.6745 resistance. Intraday bias remains neutral first, and rise from 1.5996 is still in favor to continue. On the upside, break of 1.6745 resistance will suggest that pullback from 1.7180 has completed, and retain near term bullishness. Further rise should then be seen back to retest 1.7180 high. However, decisive break of 1.6474 will argue that rise from 1.5996 has completed, and dampen the larger bullish view.
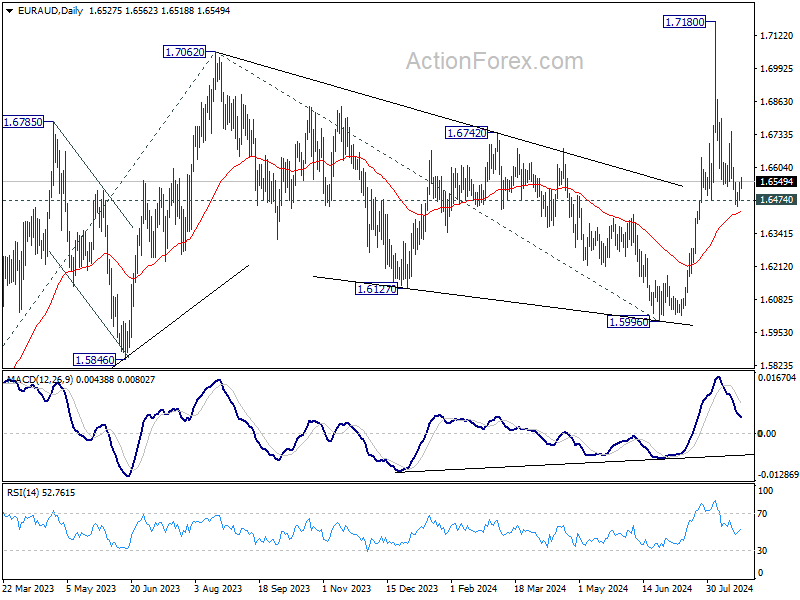
In the bigger picture, corrective fall from 1.7062 medium term top should have completed at 1.5996. Larger up trend from 1.4281 (2022 low) is resuming. Next target is 61.8% projection of 1.4281 to 1.7062 from 1.5996 at 1.7715. This will now remain the favored case as long as 1.6474 support holds. However, decisive break of 1.6474 will argue that EUR/AUD is still engaging in medium term range trading.
Economic Indicators Update
| GMT | Ccy | Events | Actual | Forecast | Previous | Revised |
|---|---|---|---|---|---|---|
| 23:00 | AUD | Manufacturing PMI Aug P | 48.7 | 47.5 | ||
| 23:00 | AUD | Services PMI Aug P | 52.2 | 50.4 | ||
| 00:30 | JPY | Manufacturing PMI Aug P | 49.5 | 49.8 | 49.1 | |
| 00:30 | JPY | Services PMI Aug P | 54.0 | 53.7 | ||
| 07:15 | EUR | France Manufacturing PMI Aug P | 44.6 | 44 | ||
| 07:15 | EUR | France Services PMI Aug P | 50.5 | 50.1 | ||
| 07:30 | EUR | Germany Manufacturing PMI Aug P | 43.5 | 43.2 | ||
| 07:30 | EUR | Germany Services PMI Aug P | 52.4 | 52.5 | ||
| 08:00 | EUR | Eurozone Manufacturing PMI Aug P | 46.1 | 45.8 | ||
| 08:00 | EUR | Eurozone Services PMI Aug P | 52.2 | 51.9 | ||
| 08:30 | GBP | Manufacturing PMI Aug P | 52.2 | 52.1 | ||
| 08:30 | GBP | Services PMI Aug P | 52.8 | 52.5 | ||
| 11:30 | EUR | ECB Meeting Accounts | ||||
| 12:30 | USD | Initial Jobless Claims (Aug 16) | 230K | 227K | ||
| 13:45 | USD | Manufacturing PMI Aug P | 49.4 | 49.6 | ||
| 13:45 | USD | Services PMI Aug P | 54.2 | 55 | ||
| 14:00 | USD | Existing Home Sales Jul | 3.89M | 3.89M | ||
| 14:00 | EUR | Eurozone Consumer Confidence Aug P | -11 | -13 | ||
| 14:30 | USD | Natural Gas Storage | 26B | -6B |
Japan’s PMI composite rises to 53.0, increasing margin pressures
Japan's PMI data for August revealed a mixed yet overall positive picture for the economy. PMI Manufacturing inched up from 49.1 to 49.5, still indicating contraction but showing improvement. PMI Services increased from 53.7 to 54.0, signaling continued strong expansion in the service sector. As a result, PMI Composite, which combines both manufacturing and services, rose from 52.5 to 53.0, reflecting sustained overall growth.
Jingyi Pan, Economics Associate Director at S&P Global Market Intelligence, noted that the solid expansion of business activity at Japanese private sector firms continued into Q3. She highlighted that growth was largely driven by an acceleration in services activity, while manufacturing output returned to positive growth after a brief decline in July.
Pan pointed out that "overall optimism levels remained above average," suggesting that firms are confident about growth in the months ahead. However, she also warned of rising "margin pressures" across both manufacturing and service sectors. This concern arises as overall selling price inflation dropped to its lowest level since November 2023, even though average input costs rose at the fastest pace in 16 months.
Australia’s PMI composite rises to 51.4, inflation risks remain
Australia's PMI data for August revealed a slight uptick in economic activity, with Manufacturing PMI rising from 47.5 to 48.7, Services PMI increasing from 50.4 to 52.2, and Composite PMI climbing from 49.9 to 51.4.
Warren Hogan, Chief Economic Advisor at Judo Bank, noted "improvement in activity indicators," coupled with "further upward pressure on business costs," and "weakening in final prices." Hogan emphasized that the Australian economy continues to expand in the third quarter, with rising demand for labor being a positive sign.
Meanwhile, the final prices index dipped, indicating that Australian businesses are struggling to pass on higher costs to consumers. Hogan warned that if this trend continues, it could signal some easing of inflation pressures, but at the expense of business margins and profitability.
Hogan also expressed caution regarding the outlook for inflation, pointing out that the ongoing rise in business costs and improving economic activity—likely boosted by the tax cuts implemented in July—underscore the continued inflation risks in the economy.
He questioned the financial markets' certainty in pricing the next move in RBA's cash rate as a cut, stating, "There is nothing in these results that allows us to reduce the probability that the RBA may still have to raise the cash rate further before a concerted easing cycle can begin."
FOMC minutes: Vast majority see September rate cut as likely
Minutes from FOMC meeting held on July 30-31 reveal that a "vast majority" of participants believe it would likely be appropriate to ease monetary policy "at the next meeting" if incoming data aligns with expectations. This signals a strong possibility of a rate cut in September.
The minutes highlighted that economic activity had shown solid growth, inflation had made some further progress toward the target, and labor market conditions had eased. However, the Committee emphasized the importance of maintaining a "data-dependent" approach. Decisions, they noted, are based on the "evolution of the economy" rather than following a "preset path," and depend on the "totality of the incoming data" rather than any single data point.
In terms of risk management, the majority of participants acknowledged that risks to the employment goal had increased, while many noted that risks to the inflation goal had decreased. Some expressed concern that gradual easing in labor market conditions could lead to a "more serious deterioration."
On the other hand, several participants cautioned against reducing policy restraint too quickly or excessively, warning that it could lead to resurgence in aggregate demand and potentially undo progress on inflation. They pointed to risks such as economic shocks that could drive inflation higher or the possibility that inflation could be more persistent than currently anticipated.
(FED) Minutes of the Federal Open Market Committee
July 30–31, 2024
A joint meeting of the Federal Open Market Committee and the Board of Governors of the Federal Reserve System was held in the offices of the Board of Governors on Tuesday, July 30, 2024, at 10:00 a.m. and continued on Wednesday, July 31, 2024, at 9:00 a.m.1
Developments in Financial Markets and Open Market Operations
The manager turned first to a review of developments in financial markets. Financial conditions eased modestly over the intermeeting period, reflecting lower long-term interest rates and higher equity prices. The manager noted that current financial conditions appeared to be providing neither a headwind nor tailwind to growth.
Nominal Treasury yields declined over the period, with shorter-term yields having decreased by more than longer-term yields, leading to a steepening of the yield curve. Treasury yields remained sensitive to surprises in economic data, particularly consumer price index releases and employment reports. While near-term inflation compensation fell over the intermeeting period, longer-term forward measures were little changed. Measures of inflation expectations obtained from term structure models were modestly lower. The policy rate path derived from futures prices and the modal path derived from options prices both declined over the intermeeting period and had come into closer alignment with the median of the modal responses from the Open Market Desk's Survey of Primary Dealers and Survey of Market Participants. Policy expectations, however measured, pointed to a first rate cut at the September FOMC meeting, at least one more cut later in the year, and further policy easing next year.
In the equity markets, the high perceived likelihood of a September cut in the target range for the policy rate induced a notable appreciation in the stocks of firms with small and medium capitalization, which tend to be more sensitive to interest rates. Stocks of larger companies, especially those in the technology sector, underperformed. Second-quarter earnings reports received before the meeting had been slightly above analysts' expectations, although some companies noted a softening in consumer spending.
Expectations for policy rates in most advanced foreign economies (AFEs) declined, as recent data generally pointed to continued progress on inflation. Although most AFE central banks had cut their policy rates or were expected to do so soon, the manager noted that market participants continued to expect the Bank of Japan to tighten policy this year. The sudden announcement of a French election contributed to some short-term market volatility early in the intermeeting period, including a widening between yields of French and German 10-year sovereign bonds and a widening in spreads for off-the-run U.S. Treasury securities, but the effects on U.S. Treasury markets were short lived.
The effective federal funds rate remained unchanged over the intermeeting period, but the manager noted that rates on repurchase agreements (repo) had edged higher, reflecting increased demand for financing Treasury securities as well as the expected effects of gradual balance sheet normalization. Use of the overnight reverse repo (ON RRP) facility declined slightly over the intermeeting period. The staff projected that ON RRP usage would decline more noticeably over the remainder of the year, particularly as issuance of Treasury bills increases. However, the manager noted that it was possible that idiosyncratic factors specific to some ON RRP participants might support ON RRP balances in the months ahead. Looking at a range of money market indicators, the manager concluded that reserves remained abundant but indicated that the staff would continue to closely monitor developments in money markets. Finally, the manager described a set of technical adjustments to the production of the Secured Overnight Financing Rate that the Federal Reserve Bank of New York had proposed in a recent public consultation.
By unanimous vote, the Committee ratified the Desk's domestic transactions over the intermeeting period. There were no intervention operations in foreign currencies for the System's account during the intermeeting period.
Staff Review of the Economic Situation
The information available at the time of the meeting indicated that U.S. economic activity had advanced solidly so far this year, but at a markedly slower pace than in the second half of 2023. Labor market conditions continued to ease: Job gains moderated, and the unemployment rate moved up further but remained low. Consumer price inflation was well below its year-earlier pace but remained somewhat elevated.
Consumer price inflation—as measured by the 12-month change in the price index for personal consumption expenditures (PCE)—was about the same in June as it was at the start of the year, though the month-over-month changes in May and June were smaller than those seen earlier in the year. Total PCE price inflation was 2.5 percent in June, and core PCE price inflation—which excludes changes in energy prices and many consumer food prices—was 2.6 percent.
Recent data suggested that labor market conditions had eased further. Average monthly nonfarm payroll gains in the second quarter were smaller than the average pace seen in the first quarter and over the previous year. The unemployment rate moved up further in June to 4.1 percent; the labor force participation rate ticked up as well, and the employment-to-population ratio was unchanged. The unemployment rate for African Americans rose in June, while the rate for Hispanics declined slightly; both rates were above that for Whites. The ratio of job vacancies to unemployment remained at 1.2 in June, about the same as its pre-pandemic level. Measures of nominal wages continued to decelerate: Average hourly earnings for all employees rose 3.9 percent over the 12 months ending in June, down 0.8 percentage point relative to a year earlier, and the 12-month change in the employment cost index of hourly compensation of private industry workers was 3.9 percent in June, down 0.6 percentage point from its year-earlier pace.
According to the advance release, real gross domestic product (GDP) rose solidly in the second quarter after a modest gain in the first quarter. Over the first half of the year, GDP growth was noticeably slower than its average pace in 2023. However, real private domestic final purchases (PDFP)—which comprises PCE and private fixed investment and which often provides a better signal than GDP of underlying economic momentum—posted a solid second-quarter increase that was in line with its first-quarter pace and only moderately slower than its average rate of increase in 2023.
As in the first quarter, net exports subtracted from U.S. GDP growth in the second quarter. Growth in real exports of goods and services remained tepid overall, as gains in exports of capital goods and consumer goods were partly offset by declines in exports of foods and industrial supplies. By contrast, real imports continued to rise at a brisk pace, driven by further increases in imports of capital goods.
Foreign economic growth was estimated to have been subdued in the second quarter, held down by a sharp deceleration in economic activity in China amid ongoing property-sector woes. In Europe and Latin America, output likely expanded below its trend pace, as restrictive monetary policy continued to be a drag on activity.
Recent global inflation developments were mixed. In the AFEs, headline inflation edged down in the second quarter but generally remained above target levels. In emerging market economies, headline inflation rose a touch overall, reflecting, in part, run-ups in food prices in some countries. The Bank of Canada and the Swiss National Bank cut their policy rates further, in part citing easing inflation pressures. The People's Bank of China also lowered some key policy rates amid ongoing property-sector woes and weak consumer sentiment.
Staff Review of the Financial Situation
The market-implied path for the federal funds rate moved down over the intermeeting period. Options on interest rate futures suggested that market participants were placing higher odds on a larger policy easing by early 2025 than they did just before the June meeting. Consistent with the downward shift in the implied policy path, nominal Treasury yields moved down, on net, with the most pronounced declines at shorter horizons driven largely by decreases in inflation compensation.
Broad stock price indexes rose slightly on net. Yield spreads on investment- and speculative-grade corporate bonds were little changed and remained at about the lowest decile of their respective historical distributions. The one-month option-implied volatility on the S&P 500 index rose moderately and was somewhat elevated by historical standards, suggesting that investors perceived some, but not outsized, risks to the economic outlook.
Market-based measures of the expected paths of policy rates and sovereign bond yields in most AFEs fell notably, largely in response to declines in U.S. rates. Following the surprise announcement of parliamentary elections in France, the spread between yields of French and German 10-year sovereign bonds widened to its highest level since 2012 but then partially retraced on the outcome of no clear parliamentary majority. The broad dollar index was little changed over the intermeeting period. On balance, moves in foreign risky asset prices were mixed and modest.
Overnight secured rates edged up over the intermeeting period, but conditions in U.S. short-term funding markets remained stable, with typical dynamics observed surrounding quarter-end. Average usage of the ON RRP facility declined slightly. Banks' total deposit levels increased modestly, as large time deposits displayed moderate inflows.
In domestic credit markets, borrowing costs remained elevated over the intermeeting period despite modest declines in some markets. Rates on 30-year conforming residential mortgages declined, on net, over the intermeeting period but stayed near recent high levels. Interest rates on new credit card offers increased slightly, while rates on new auto loans were little changed. Interest rates on small business loans remained elevated. Yields on an array of fixed-income securities—including commercial mortgage-backed securities (CMBS), investment- and speculative-grade corporate bonds, and residential mortgage-backed securities—moved lower to still-elevated levels relative to recent history. The declines were largely driven by decreases in Treasury yields.
Financing through capital markets and nonbank lenders was readily accessible for public corporations and large and middle-market private corporations, and credit availability for leveraged loan borrowers remained solid over the intermeeting period. For smaller firms, however, credit availability remained moderately tight. In the July Senior Loan Officer Opinion Survey on Bank Lending Practices (SLOOS), banks reported modestly tighter standards and lending terms for commercial and industrial (C&I) loans, on net, while reported demand for C&I loans remained about unchanged. Meanwhile, C&I loan balances increased in the second quarter. Regarding commercial real estate (CRE) loans, banks in the July SLOOS reported tightening standards for all loan categories. Nonetheless, bank CRE loan balances increased over the second quarter, albeit at a diminished pace relative to the previous quarter.
Credit remained available for most consumers over the intermeeting period, though credit growth showed signs of moderating. Credit card balances slowed in June, and SLOOS respondents indicated that standards for credit cards tightened moderately in the second quarter. Although banks reported in the SLOOS that lending standards on auto loans were unchanged in the second quarter, growth in auto lending at both banks and nonbanks contracted further. In the residential mortgage market, access to credit was little changed overall and continued to depend on borrowers' credit risk attributes.
Credit quality remained solid for large and midsize firms, home mortgage borrowers, and municipalities but continued to deteriorate in other sectors. The credit quality of nonfinancial firms borrowing in the corporate bond and leveraged loan markets remained stable. Delinquency rates on loans to small businesses remained slightly above pre-pandemic levels. Credit quality in the CRE market deteriorated further, with the average delinquency rate for loans in CMBS and the share of nonperforming CRE loans at banks both rising further. Regarding household balance sheets, delinquency rates on most residential mortgages remained near pre-pandemic lows. Though consumer delinquency rates had increased, particularly among nonprime borrowers, the rise in delinquency rates for both credit cards and auto loans slowed in the second quarter.
The staff provided an update on its assessment of the stability of the U.S. financial system and, on balance, continued to characterize the system's financial vulnerabilities as notable. The staff judged that asset valuation pressures remained elevated, with estimates of risk premiums across key markets low compared with historical standards. House prices remained elevated relative to fundamentals. CRE prices continued to decline, especially in the multifamily and office sectors, and vacancy rates in these sectors continued to increase.
Vulnerabilities associated with business and household debt were characterized as moderate. Nonfinancial business leverage was high, but the ability of public firms to service their debt remained solid, in large part due to strong earnings. The fraction of private firms with low debt-servicing ability continued to move up and remained at high levels compared with the past decade. Household balance sheets remained strong overall, as aggregate home equity stayed quite high and delinquencies on mortgage loans remained low.
Leverage in the financial sector was characterized as notable. Regulatory capital ratios in the banking sector remained high. The fair value of bank assets, however, remained low. For the nonbank sector, leverage at hedge funds was at its highest recorded level based on data since 2013, partly due to the prevalence of the cash–futures basis trade. Leverage at life insurers was somewhat elevated, and their holdings of risky and illiquid securities continued to grow.
Funding risks were also characterized as notable. Assets in prime money market funds and other runnable cash-management vehicles remained near historical highs. Life insurers' greater reliance on nontraditional liabilities, coupled with their increasing holdings of risky corporate debt, suggested that adverse shocks to the industry could trigger substantial funding pressures at these firms.
Staff Economic Outlook
The economic forecast prepared by the staff for the July meeting implied a lower rate of resource utilization over the projection period relative to the forecast prepared for the previous meeting. The staff's outlook for growth in the second half of 2024 had been marked down largely in response to weaker-than-expected labor market indicators. As a result, the output gap at the start of 2025 was somewhat narrower than had been previously projected, although still not fully closed. Over 2025 and 2026, real GDP growth was expected to rise about in line with potential, leaving the output gap roughly flat in those years. The unemployment rate was expected to edge up slightly over the remainder of 2024 and then to remain roughly unchanged in 2025 and 2026.
The staff's inflation forecast was slightly lower than the one prepared for the previous meeting, reflecting incoming data and the lower projected level of resource utilization. Both total and core PCE price inflation were expected to decline further as demand and supply in product and labor markets continued to move into better balance; by 2026, total and core inflation were expected to be around 2 percent.
The staff continued to view the uncertainty around the baseline projection as close to the average over the past 20 years. Risks to the inflation forecast were still seen as tilted to the upside, albeit to a smaller degree than at the time of the previous meeting. The risks around the forecast for real activity were viewed as skewed to the downside, both because more-persistent inflation could result in tighter financial conditions than in the baseline and because the recent softening in some indicators of labor market conditions might be pointing to a larger-than-anticipated slowdown in aggregate demand growth.
Participants' Views on Current Conditions and the Economic Outlook
Participants observed that inflation had eased over the past year but remained elevated and that, in recent months, there had been some further progress toward the Committee's 2 percent inflation objective. Participants noted that the recent progress on disinflation was broad based across the major subcomponents of core inflation. Core goods prices were about flat from March through June after having risen during the first three months of the year. Price inflation in June for housing services showed a notable slowing, which participants had been anticipating for some time. In addition, core nonhousing services prices had decelerated in recent months. Some participants noted that the recent data corroborated reports from their business contacts that firms' pricing power was waning, as consumers appeared to be more sensitive to price increases. Various contacts had also reported that they had cut prices or were offering discounts to stay competitive, or that declines in input costs had helped reduce pressure on retail prices.
With regard to the outlook for inflation, participants judged that recent data had increased their confidence that inflation was moving sustainably toward 2 percent. Almost all participants observed that the factors that had contributed to recent disinflation would likely continue to put downward pressure on inflation in coming months. These factors included a continued waning of pricing power, moderating economic growth, and the runoff in excess household savings accumulated during the pandemic. Many participants noted that the moderation of growth in labor costs as labor market conditions rebalanced would continue to contribute to disinflation, particularly in core nonhousing services prices. Some participants noted that the lags in the time it takes for housing rental conditions for new tenants to show through to aggregate price data for housing services meant that the disinflationary trend in this component would likely continue. Participants also observed that longer-term inflation expectations had remained well anchored and viewed this anchoring as underpinning the disinflation process. A couple of participants noted that inflation pressures might persist for some time, as they assessed that the economy had considerable momentum, and that, even with some easing of the demand for labor, the labor market remained strong.
Participants assessed that supply and demand conditions in the labor market had continued to come into better balance. The unemployment rate had moved up but remained low, having risen 0.7 percentage point since its trough in April 2023 to 4.1 percent in June. The monthly pace of payroll job gains had moderated from the first quarter but had been solid in recent months. However, many participants noted that reported payroll gains might be overstated, and several assessed that payroll gains may be lower than those needed to keep the unemployment rate constant with a flat labor force participation rate. Participants observed that other indicators also pointed to easing in labor market conditions, including a lower hiring rate and a downtrend in job vacancies since the beginning of the year. Participants noted that the rebalancing of labor market conditions over the past year was also aided by an expansion of the supply of workers, reflecting increases in the labor force participation rate among individuals aged 25 to 54 and a strong pace of immigration. Participants noted that, with continued rebalancing of labor market conditions, nominal wage growth had continued to moderate. Many participants cited reports from District contacts that supported the view that labor market conditions had been easing. In particular, contacts reported that they had been experiencing less difficulty in hiring and retaining workers and that they saw limited wage pressures. Participants generally assessed that, overall, conditions in the labor market had returned to about where they stood on the eve of the pandemic—strong but not overheated.
Regarding the outlook for the labor market, participants discussed various indicators of layoffs, including initial claims for unemployment benefits and measures of job separations. Some participants commented that these indicators had remained at levels consistent with a strong labor market. Participants agreed that these and other indicators of labor market conditions merited close monitoring. Several participants said that their District contacts reported that they were actively managing head counts through selective hiring and attrition.
Participants noted that real GDP growth was solid in the first half of the year, though slower than the robust pace seen in the second half of last year. PDFP growth, which usually gives a better signal than GDP growth of economic momentum, also moderated in the first half, but by less than GDP growth. PDFP expanded at a solid pace, supported by growth in consumer spending and business fixed investment. Participants viewed the moderation in the growth of economic activity to be largely in line with what they had anticipated.
Regarding the household sector, participants observed that consumer spending had slowed from last year's robust pace, consistent with restrictive monetary policy, easing of labor market conditions, and slowing income growth. They noted, however, that consumer spending had still grown at a solid pace in the first half of the year, supported by the still-strong labor market and aggregate household balance sheets. Some participants observed that lower- and moderate-income households were encountering increasing strains as they attempted to meet higher living costs after having largely run down savings accumulated during the pandemic. These participants noted that such strains were evident in indicators such as rising credit card delinquency rates and an increased share of households paying the minimum due on balances, and warranted continued close monitoring. Several participants cited reports that consumers, especially those in lower-income households, were shifting away from discretionary spending and switching to lower-cost food items and brands. A couple of participants remarked that spending by some higher-income households was likely being bolstered by wealth effects from equity and housing price appreciation. Participants noted that residential investment was weak in the second quarter, likely reflecting the pickup in mortgage rates from earlier in the year.
Regarding the business sector, participants noted that conditions varied by firm size, sector, and region. A couple of participants noted that their District contacts had reported larger firms as having a generally stable outlook, while the outlook for smaller firms appeared more uncertain. A few participants said that their contacts reported that conditions in the manufacturing sector were somewhat weaker, while the professional and business services sector and technology-related sectors remained strong. A few participants noted that the agricultural sector continued to face strains stemming from low food commodity prices and high input costs.
Participants discussed the risks and uncertainties around the economic outlook. Upside risks to the inflation outlook were seen as having diminished, while downside risks to employment were seen as having increased. Participants saw risks to achieving the inflation and employment objectives as continuing to move into better balance, with a couple noting that they viewed these risks as more or less balanced. Some participants noted that as conditions in the labor market have eased, the risk had increased that continued easing could transition to a more serious deterioration. As sources of upside risks to inflation, some participants cited the potential for disruptions to supply chains and a further deterioration in geopolitical conditions. A few participants noted that an easing of financial conditions could boost economic activity and present an upside risk to economic growth and inflation.
In their discussion of financial stability, participants who commented noted vulnerabilities to the financial system that they assessed warranted monitoring. Some participants observed that the banking system was sound but noted risks associated with unrealized losses on securities, reliance on uninsured deposits, and interconnections with nonbank financial intermediaries. In their discussion of bank funding, several participants commented that, because the discount window is an important liquidity backstop, the Federal Reserve should continue to improve the window's operational efficiency and to communicate effectively about the window's value. Participants generally noted that some banks and nonbank financial institutions likely have vulnerabilities associated with high CRE exposures through loan portfolios and holdings of CMBS. Most of these participants remarked that risks related to CRE exposures depend importantly on the property type and the local market conditions of the properties involved. A couple of participants noted concerns about asset valuation pressures in other markets as well. Many participants commented on cyber risks that could impair the operation of financial institutions, financial infrastructure, and, potentially, the overall economy. Many participants remarked that because a few firms play a substantial role in the provision of information technology services to the financial sector and because of the highly interconnected nature of some firms in the financial industry itself, there was an increased risk that significant cyber disruptions at a small number of key firms could have widespread effects. Several participants noted that leverage in the Treasury market remained a risk, that it would be important to monitor developments regarding Treasury market resilience amid the move to central clearing, or that it is valuable to communicate about the Federal Reserve's standing repo facility as a liquidity backstop. A couple of participants commented on the financial condition of low- and moderate-income households that have exhausted their savings and the importance of monitoring rising delinquency rates on credit cards and auto loans.
In their consideration of monetary policy at this meeting, participants observed that recent indicators suggested that economic activity had continued to expand at a solid pace, job gains had moderated, and the unemployment rate had moved up but remained low. While inflation remained somewhat above the Committee's longer-run goal of 2 percent, participants noted that inflation had eased over the past year and that recent incoming data indicated some further progress toward the Committee's objective. All participants supported maintaining the target range for the federal funds rate at 5-1/4 to 5-1/2 percent, although several observed that the recent progress on inflation and increases in the unemployment rate had provided a plausible case for reducing the target range 25 basis points at this meeting or that they could have supported such a decision. Participants furthermore judged that it was appropriate to continue the process of reducing the Federal Reserve's securities holdings.
In discussing the outlook for monetary policy, participants noted that growth in economic activity had been solid, there had been some further progress on inflation, and conditions in the labor market had eased. Almost all participants remarked that while the incoming data regarding inflation were encouraging, additional information was needed to provide greater confidence that inflation was moving sustainably toward the Committee's 2 percent objective before it would be appropriate to lower the target range for the federal funds rate. Nevertheless, participants viewed the incoming data as enhancing their confidence that inflation was moving toward the Committee's objective. The vast majority observed that, if the data continued to come in about as expected, it would likely be appropriate to ease policy at the next meeting. Many participants commented that monetary policy continued to be restrictive, although they expressed a range of views about the degree of restrictiveness, and a few participants noted that ongoing disinflation, with no change in the nominal target range for the policy rate, by itself results in a tightening in monetary policy. Most participants remarked on the importance of communicating the Committee's data-dependent approach and emphasized, in particular, that monetary policy decisions are conditional on the evolution of the economy rather than being on a preset path or that those decisions depend on the totality of the incoming data rather than on any particular data point. Several participants stressed the need to monitor conditions in money markets and factors affecting the demand for reserves amid the ongoing reduction in the Federal Reserve's balance sheet.
In discussing risk-management considerations that could bear on the outlook for monetary policy, participants highlighted uncertainties affecting the outlook, such as those regarding the amount of restraint currently provided by monetary policy, the lags with which past and current restraint have affected and will affect economic activity, and the degree of normalization of the economy following disruptions associated with the pandemic. A majority of participants remarked that the risks to the employment goal had increased, and many participants noted that the risks to the inflation goal had decreased. Some participants noted the risk that a further gradual easing in labor market conditions could transition to a more serious deterioration. Many participants noted that reducing policy restraint too late or too little could risk unduly weakening economic activity or employment. A couple participants highlighted in particular the costs and challenges of addressing such a weakening once it is fully under way. Several participants remarked that reducing policy restraint too soon or too much could risk a resurgence in aggregate demand and a reversal of the progress on inflation. These participants pointed to risks related to potential shocks that could put upward pressure on inflation or the possibility that inflation could prove more persistent than currently expected.
Committee Policy Actions
In their discussions of monetary policy for this meeting, members agreed that economic activity had continued to expand at a solid pace. Job gains had moderated, and the unemployment rate had moved up but remained low. Inflation eased over the past year but remained somewhat elevated. Members concurred that, in recent months, there had been some further progress toward the Committee's 2 percent inflation objective. Members judged that the risks to achieving the Committee's employment and inflation goals had continued to move into better balance. Members viewed the economic outlook as uncertain and agreed that they were attentive to the risks to both sides of the Committee's dual mandate.
In support of the Committee's goals to achieve maximum employment and inflation at the rate of 2 percent over the longer run, members agreed to maintain the target range for the federal funds rate at 5-1/4 to 5-1/2 percent. Members concurred that, in considering any adjustments to the target range for the federal funds rate, they would carefully assess incoming data, the evolving outlook, and the balance of risks. Members agreed that they did not expect that it would be appropriate to reduce the target range until they had gained greater confidence that inflation is moving sustainably toward 2 percent. In addition, members agreed to continue to reduce the Federal Reserve's holdings of Treasury securities and agency debt and agency mortgage‑backed securities. All members affirmed their strong commitment to returning inflation to the Committee's 2 percent objective.
Members agreed that, in assessing the appropriate stance of monetary policy, they would continue to monitor the implications of incoming information for the economic outlook. They would be prepared to adjust the stance of monetary policy as appropriate if risks emerged that could impede the attainment of the Committee's goals. Members also agreed that their assessments would take into account a wide range of information, including readings on labor market conditions, inflation pressures and inflation expectations, and financial and international developments.
Members agreed that to appropriately reflect developments since the previous meeting related to their maximum-employment objective, they should note in the statement that "job gains have moderated, and the unemployment rate has moved up but remains low." Similarly, to appropriately reflect developments related to their price-stability objective, they agreed to note that "there has been some further progress toward the Committee's 2 percent inflation objective." Members also agreed to reflect the shifting balance of risks by stating that "the Committee judges that the risks to achieving its employment and inflation goals continue to move into better balance" and that "the Committee is attentive to the risks to both sides of its dual mandate."
At the conclusion of the discussion, the Committee voted to direct the Federal Reserve Bank of New York, until instructed otherwise, to execute transactions in the System Open Market Account in accordance with the following domestic policy directive, for release at 2:00 p.m.:
"Effective August 1, 2024, the Federal Open Market Committee directs the Desk to:
- Undertake open market operations as necessary to maintain the federal funds rate in a target range of 5-1/4 to 5-1/2 percent.
- Conduct standing overnight repurchase agreement operations with a minimum bid rate of 5.5 percent and with an aggregate operation limit of $500 billion.
- Conduct standing overnight reverse repurchase agreement operations at an offering rate of 5.3 percent and with a per-counterparty limit of $160 billion per day.
- Roll over at auction the amount of principal payments from the Federal Reserve's holdings of Treasury securities maturing in each calendar month that exceeds a cap of $25 billion per month. Redeem Treasury coupon securities up to this monthly cap and Treasury bills to the extent that coupon principal payments are less than the monthly cap.
- Reinvest the amount of principal payments from the Federal Reserve's holdings of agency debt and agency mortgage-backed securities (MBS) received in each calendar month that exceeds a cap of $35 billion per month into Treasury securities to roughly match the maturity composition of Treasury securities outstanding.
- Allow modest deviations from stated amounts for reinvestments, if needed for operational reasons.
- Engage in dollar roll and coupon swap transactions as necessary to facilitate settlement of the Federal Reserve's agency MBS transactions."
The vote also encompassed approval of the statement below for release at 2:00 p.m.:
"Recent indicators suggest that economic activity has continued to expand at a solid pace. Job gains have moderated, and the unemployment rate has moved up but remains low. Inflation has eased over the past year but remains somewhat elevated. In recent months, there has been some further progress toward the Committee's 2 percent inflation objective.
The Committee seeks to achieve maximum employment and inflation at the rate of 2 percent over the longer run. The Committee judges that the risks to achieving its employment and inflation goals continue to move into better balance. The economic outlook is uncertain, and the Committee is attentive to the risks to both sides of its dual mandate.
In support of its goals, the Committee decided to maintain the target range for the federal funds rate at 5-1/4 to 5-1/2 percent. In considering any adjustments to the target range for the federal funds rate, the Committee will carefully assess incoming data, the evolving outlook, and the balance of risks. The Committee does not expect it will be appropriate to reduce the target range until it has gained greater confidence that inflation is moving sustainably toward 2 percent. In addition, the Committee will continue reducing its holdings of Treasury securities and agency debt and agency mortgage‑backed securities. The Committee is strongly committed to returning inflation to its 2 percent objective.
In assessing the appropriate stance of monetary policy, the Committee will continue to monitor the implications of incoming information for the economic outlook. The Committee would be prepared to adjust the stance of monetary policy as appropriate if risks emerge that could impede the attainment of the Committee's goals. The Committee's assessments will take into account a wide range of information, including readings on labor market conditions, inflation pressures and inflation expectations, and financial and international developments."
Voting for this action:Jerome H. Powell, John C. Williams, Thomas I. Barkin, Michael S. Barr, Raphael W. Bostic, Michelle W. Bowman, Lisa D. Cook, Mary C. Daly, Austan D. Goolsbee, Philip N. Jefferson, Adriana D. Kugler, and Christopher J. Waller.
Voting against this action: None.
Austan D. Goolsbee voted as an alternate member at this meeting.
Consistent with the Committee's decision to leave the target range for the federal funds rate unchanged, the Board of Governors of the Federal Reserve System voted unanimously to maintain the interest rate paid on reserve balances at 5.4 percent, effective August 1, 2024. The Board of Governors of the Federal Reserve System voted unanimously to approve the establishment of the primary credit rate at the existing level of 5.5 percent, effective August 1, 2024.
It was agreed that the next meeting of the Committee would be held on Tuesday–Wednesday, September 17–18, 2024. The meeting adjourned at 10:10 a.m. on July 31, 2024.
Notation Vote
By notation vote completed on July 2, 2024, the Committee unanimously approved the minutes of the Committee meeting held on June 11–12, 2024.
Attendance
Jerome H. Powell, Chair
John C. Williams, Vice Chair
Thomas I. Barkin
Michael S. Barr
Raphael W. Bostic
Michelle W. Bowman
Lisa D. Cook
Mary C. Daly
Philip N. Jefferson
Adriana D. Kugler
Christopher J. Waller
Susan M. Collins, Austan D. Goolsbee, Alberto G. Musalem, Jeffrey R. Schmid, and Sushmita Shukla, Alternate Members of the Committee
Patrick Harker, Neel Kashkari, and Lorie K. Logan, Presidents of the Federal Reserve Banks of Philadelphia, Minneapolis, and Dallas, respectively
Mark Meder, Interim President of the Federal Reserve Bank of Cleveland
Joshua Gallin, Secretary
Matthew M. Luecke, Deputy Secretary
Brian J. Bonis, Assistant Secretary
Michelle A. Smith, Assistant Secretary
Mark E. Van Der Weide, General Counsel
Richard Ostrander, Deputy General Counsel
Trevor A. Reeve, Economist
Stacey Tevlin, Economist
Beth Anne Wilson, Economist
Edward S. Knotek II, David E. Lebow, and William Wascher, Associate Economists
Roberto Perli, Manager, System Open Market Account
Julie Ann Remache, Deputy Manager, System Open Market Account
Stephanie R. Aaronson, Senior Associate Director, Division of Research and Statistics, Board
Jose Acosta, Senior System Administrator II, Division of Information Technology, Board
Alyssa G. Anderson, Principal Economist, Division of Monetary Affairs, Board
Alessandro Barbarino, Special Adviser to the Board, Division of Board Members, Board
David Bowman,2 Senior Associate Director, Division of Monetary Affairs, Board
Fang Cai, Assistant Director, Division of Financial Stability, Board
Mark A. Carlson, Adviser, Division of Monetary Affairs, Board
Stephanie E. Curcuru, Deputy Director, Division of International Finance, Board
Rochelle M. Edge, Deputy Director, Division of Monetary Affairs, Board
Jonas Fisher, Senior Vice President, Federal Reserve Bank of Chicago
Glenn Follette, Associate Director, Division of Research and Statistics, Board
Etienne Gagnon, Associate Director, Division of International Finance, Board
Jenn Gallagher, Assistant to the Board, Division of Board Members, Board
Carlos Garriga, Senior Vice President, Federal Reserve Bank of St. Louis
Michael S. Gibson, Director, Division of Supervision and Regulation, Board
David Glancy, Principal Economist, Division of Monetary Affairs, Board
Joseph W. Gruber, Executive Vice President, Federal Reserve Bank of Kansas City
Christopher J. Gust, Associate Director, Division of Monetary Affairs, Board
Diana Hancock, Senior Associate Director, Division of Research and Statistics, Board
Valerie S. Hinojosa, Section Chief, Division of Monetary Affairs, Board
Colin J. Hottman, Principal Economist, Division of International Finance, Board
Jane E. Ihrig, Special Adviser to the Board, Division of Board Members, Board
Mark J. Jensen, Vice President, Federal Reserve Bank of Atlanta
Benjamin K. Johannsen, Assistant Director, Division of Monetary Affairs, Board
Faten Khoury,2 Senior Financial Institution Policy Analyst, Division of Reserve Bank Operations and Payment Systems, Board
Michael T. Kiley, Deputy Director, Division of Financial Stability, Board
Don H. Kim, Senior Adviser, Division of Monetary Affairs, Board
Anna R. Kovner, Executive Vice President, Federal Reserve Bank of Richmond
Andreas Lehnert, Director, Division of Financial Stability, Board
Kurt F. Lewis, Special Adviser to the Chair, Division of Board Members, Board
Laura Lipscomb, Special Adviser to the Board, Division of Board Members, Board
Rebecca D. McCaughrin,2 Policy and Market Analysis Director, Federal Reserve Bank of New York
Benjamin W. McDonough,3 Deputy Secretary and Ombudsman, Office of the Secretary, Board
Yvette McKnight,4 Senior Agenda Assistant, Office of Secretary, Board
Andrew Meldrum, Assistant Director, Division of Monetary Affairs, Board
Karel Mertens, Senior Vice President, Federal Reserve Bank of Dallas
Thomas Mertens, Vice President, Federal Reserve Bank of San Francisco
Ann E. Misback,5 Secretary, Office of the Secretary, Board
Norman J. Morin, Associate Director, Division of Research and Statistics, Board
Michelle M. Neal, Head of Markets, Federal Reserve Bank of New York
Alyssa O'Connor, Special Adviser to the Board, Division of Board Members, Board
Paolo A. Pesenti, Director of Monetary Policy Research, Federal Reserve Bank of New York
Eugenio P. Pinto, Special Adviser to the Board, Division of Board Members, Board
Odelle Quisumbing,4 Assistant to the Secretary, Office of the Secretary, Board
Andrea Raffo, Senior Vice President, Federal Reserve Bank of Minneapolis
Donald Keith Sill, Senior Vice President, Federal Reserve Bank of Philadelphia
Arsenios Skaperdas, Senior Economist, Division of Monetary Affairs, Board
Gustavo A. Suarez, Assistant Director, Division of Research and Statistics, Board
Manjola Tase, Principal Economist, Division of Monetary Affairs, Board
Thiago Teixeira Ferreira, Special Adviser to the Board, Division of Board Members, Board
Clara Vega, Special Adviser to the Board, Division of Board Members, Board
Jeffrey D. Walker,2 Associate Director, Division of Reserve Bank Operations and Payment Systems, Board
Randall A. Williams, Group Manager, Division of Monetary Affairs, Board
Paul R. Wood, Special Adviser to the Board, Division of Board Members, Board
Egon Zakrajsek, Executive Vice President, Federal Reserve Bank of Boston
Rebecca Zarutskie, Special Adviser to the Board, Division of Board Members, Board
_______________________
Joshua Gallin
Secretary
1. The Federal Open Market Committee is referenced as the "FOMC" and the "Committee" in these minutes; the Board of Governors of the Federal Reserve System is referenced as the "Board" in these minutes. Return to text
2. Attended through the discussion of developments in financial markets and open market operations. Return to text
3. Attended Wednesday's session only. Return to text
4. Attended through the discussion of the economic and financial situation. Return to text
5. Attended Tuesday's session only. Return to text
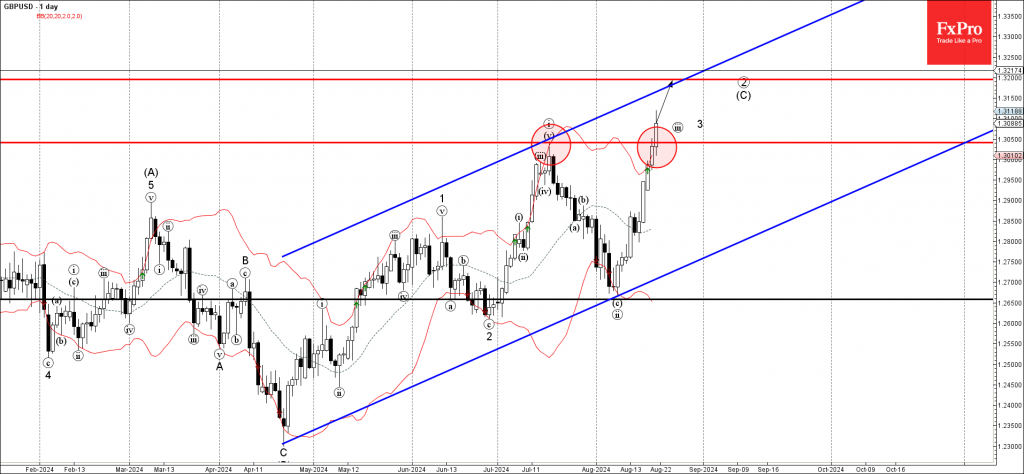
GBPUSD Wave Analysis
- GBPUSD broke key resistance level 1.3040
- Likely to reach resistance level 1.3040
GBPUSD currency pair recently broke above the key resistance level 1.3040 (previous monthly high from the middle of July).
The breakout of the resistance level 1.3040 accelerated the active short-term impulse wave 3 of the higher order impulse wave (C) from the end of April.
Given the clear daily uptrend and the continuation of the widespread US dollar sales, GBPUSD currency pair can be expected to rise further toward the next resistance level 1.3040 (target for the completion of the active impulse wave (C)).
Bitcoins (BTC/USD) Steady Range: Mt Gox Impact and Future Outlook
- Bitcoin prices are currently range-bound, the range between 56,561 and 61,750 is keeping both buyers and sellers cautious.
- Mt. Gox moved 13,265 Bitcoins totaling and estimated $780 million. The first major move by the bankrupt exchange since July 30.
- According to research by investment firm River, 60% of the largest hedge funds in the U.S. have exposure to Bitcoin ETFs.
Bitcoin prices continue to trade sideways as the range high held yesterday before prices slid. The 61600 range high is holding firm but yesterday saw Bitcoin fail at the 50-day MA, languishing around 61400.
Overnight news broke that Mt.Gox had made its first major move in 3 weeks. The bankrupt former exchange moved a total of 13265 Bitcoins, with an estimated value of around $780 million.
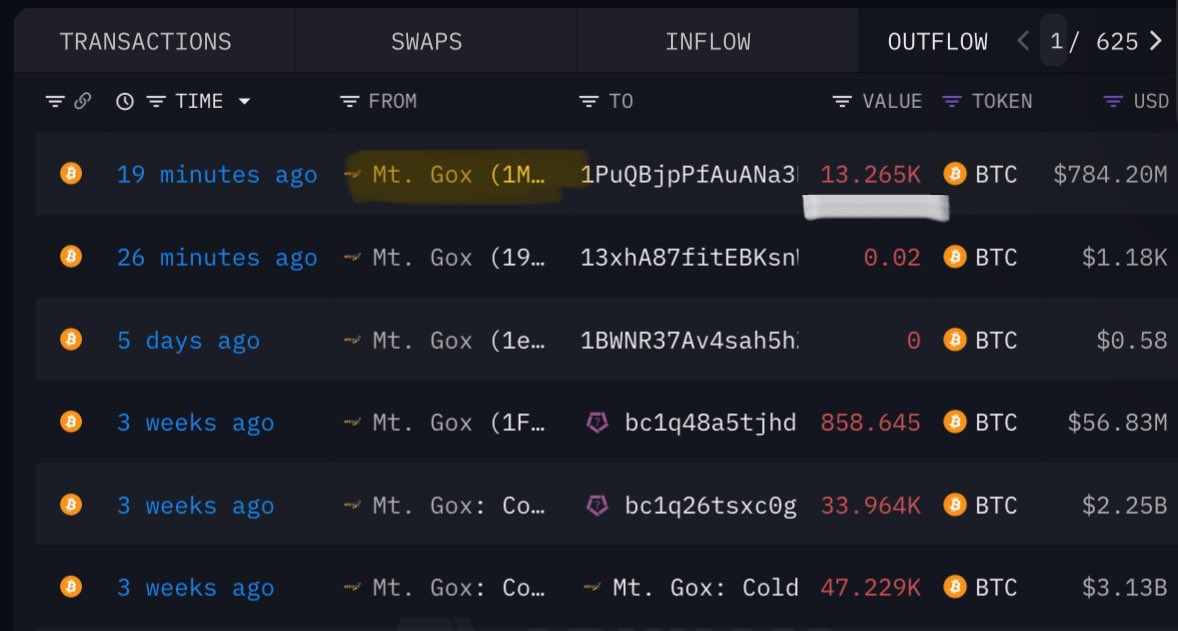
Source: x.com/HODL15Capital/ , On Chain Data
The move could be a precursor to Mt.Gox continuing its repayments to creditors. Mt.Gox had already moved 47229 Bitcoin on July 30th.In a move that has surprised some, Mt. Gox creditors have held onto their Bitcoin instead of selling it.
Bitpanda’s deputy CEO, Lukas Enzersdorfer-Konrad, told Cointelegraph earlier this August that it’s important to remember Mt. Gox was one of the first exchanges. This means its users were among the early adopters of Bitcoin and thus believe in the technology. This could in part explain why they are refusing to sell the world’s largest cryptocurrency.
Bitcoin is trading up around 0.6% on the day but these developments are likely to keep downward pressure on the price of BTC/USD.
Spot Bitcoin ETF Flows
U.S. spot Bitcoin ETFs have had more money coming in than going out for eight of the last ten trading days. On August 20, these ETFs received $88 million, which is the most they’ve gotten in two weeks, according to early data from Farside Investors.
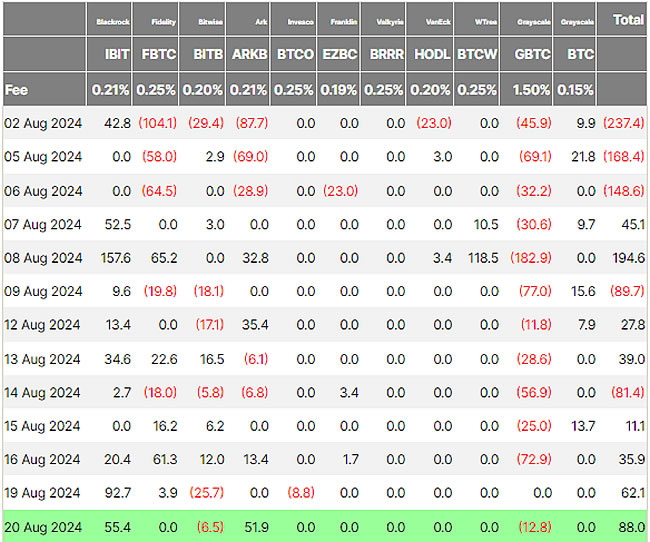
Source: Farside Investors (click to enlarge)
According to a recent report by Sam Baker, Researcher at Investment Firm River, 60% of the largest hedge funds in the United States have exposure to Bitcoin ETFs. This is big for Bitcoin and could explain why despite the massive selloff early in August prices have recovered some sense of stability.
There is a theory that with more institutional adoption Bitcoin may lose some of its volatility, however the drop in early August suggests this may be somewhat misguided. I guess time will tell where this one is concerned.
El Salvador Continues to Innovate
El Salvador’s National Bitcoin Office (ONBTC) is offering Bitcoin training and certifications to 80,000 government workers. The country has started this program to teach public employees about managing and creating policies for Bitcoin.
The training, called Certification in Public Administration 1, lasts 160 hours and is done online. It’s divided into seven parts, each covering different concepts, laws, skills, and management for using Bitcoin as legal money.
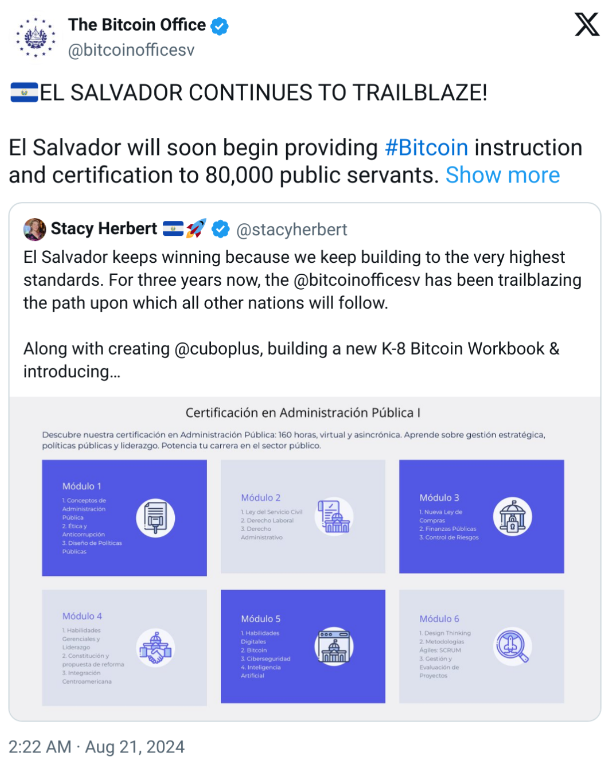
Source: X/Bitcoin Office
This follows El Slavador giving transparency a new meaning earlier this year. The Country launched its own proof-of-reserves website which provides real time data of the countries Bitcoin reserves.
As the week progresses, we do have the FOMC minutes this evening which could provide markets with a shot in the arm and stir up some volatility. Markets are a bit calm at the moment as Jackson Hole beckons with all eyes on Federal Reserve Chair Jerome Powell.
Market participants will be looking for more cues regarding the rate path of the Federal Reserve moving forward and this could have an impact on riskier assets such as Bitcoin
Technical Analysis BTC/USD
From a technical perspective, Bitcoin is currently stuck in a price range, with a recent dip almost breaking out but not succeeding. The range between 56,561 and 61,750 is keeping both buyers and sellers cautious.
The longer Bitcoin stays in this range, the more likely a strong breakout will happen, although it’s uncertain which direction it will take.
Some crypto enthusiasts are predicting a bullish breakout, with some even suggesting a rise to 100,000, though that seems unlikely at this point.
In the short term, resistance is at 60,000, with more challenges at the 50-day moving average and range high around 61,750. Beyond that, there are additional hurdles at the 200 and 100-day moving averages at 62,917 and 63,870 before buyers can take full control.
Support
- 58500
- 56561
- 54000
Resistance
- 60000
- 61750
- 62917
Bitcoin (BTC/USD) Daily Chart, August 21, 2024
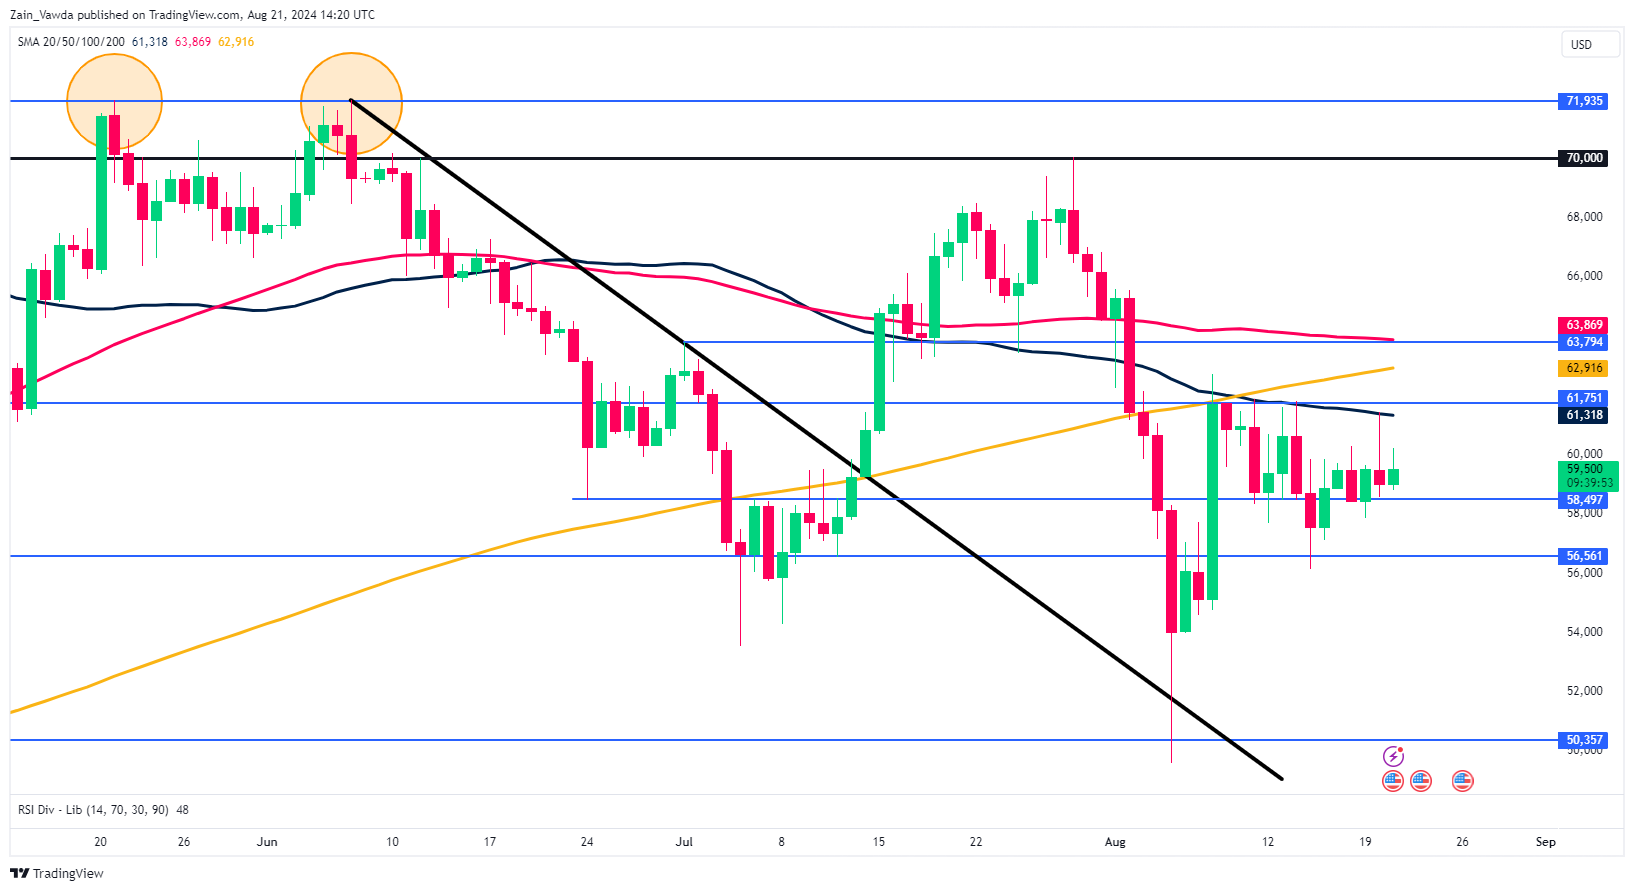
Source: TradingView.com (click to enlarge)
Soft-Landing, or No Soft-Landing, That Is the Question: Part III
Part III: A New Toolkit To Predict Soft-Landings, Stagflation and Recessions
Summary
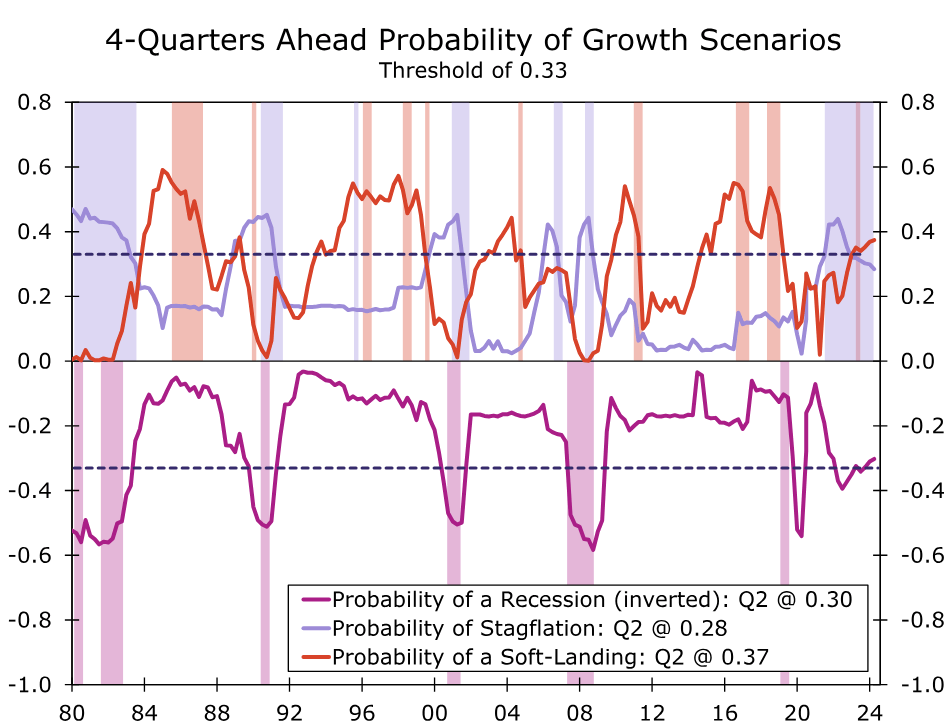
- In the third installment of this series, we introduce a probit framework to generate four-quarter-out probabilities of three scenarios: recession, stagflation and soft-landing.
- Instead of relying on one regression with one set of predictors, we create several regressions with different sets of predictors to capture information from major sectors of the economy. We therefore have better chances of predicting likely growth scenarios.
- Our probit framework accurately predicted periods of recession, stagflation and soft-landings in the post-1980 era using a threshold of 33%.
- As of Q2–2024, the soft-landing probability is the highest, indicating that the chances of a soft-landing are higher during the next four quarters. However, the persistently higher stagflation and recession probabilities of the past few years may cloud the near-term policy path.
- We believe our framework can help decision makers determine the magnitude and duration of upcoming monetary policy by providing the probabilities of different growth scenarios occurring.
- The next installment of the series will provide a framework to predict monetary policy pivots using the probabilities of the three growth scenarios.
The Probit Framework To Predict Four-Quarter-Out Probabilities of Growth Scenarios
Traditionally, a probit approach is utilized to predict the probability of a near-term recession. We have updated the probit framework to generate probabilities of stagflation and soft-landings in addition to predicting the probability of a recession. The new framework is known as the ordered probit approach.1
We deviate from traditional probit modeling in the sense that instead of relying on one regression with one set of predictors, we create several regressions. Multiple sets of predictors allow greater chances of predicting likely growth scenarios—in comparison to just one set of predictors—by capturing more information from major sectors of the economy. Additionally, as the economy evolves, so do economic risks. For example, higher inflation and interest rates are the current cycle’s major risk to the economy, while the housing boom/bust was linked to the Great Recession. Therefore, in our view, different probit regressions more accurately capture the evolving nature of risks than a single regression. Our probit regressions generate the probability of a soft-landing, stagflation and/or recession occurring in the next four quarters. We created eight different regressions using a unique mix of predictors, as described below. Each regression generates a probability of soft-landing, stagflation and recession as determined by the unique set of predictors. We average all the probabilities to represent the chances of a soft-landing, stagflation and recession as predicted by the major sectors of the economy.
(1) Leading Economic Index (LEI), S&P 500, the ISM-M employment index and CPI
(2) Consumer Price Index (CPI) and the LEI
(3) CPI and Yield Spread (between 10-year and one-year Treasury yields)
(4) CPI and the Chicago Fed National Activity Index (CFNAI)
(5) CFNAI and Yield Spread (between 10-year and one-year Treasury yields)
(6) Yield Spread (between 10-year and one-year Treasury yields)
(7) VIX and the S&P 500
(8) Chicago Fed National Activity Index
The Framework in Action: Do Soft-Landings Hold the Ground?
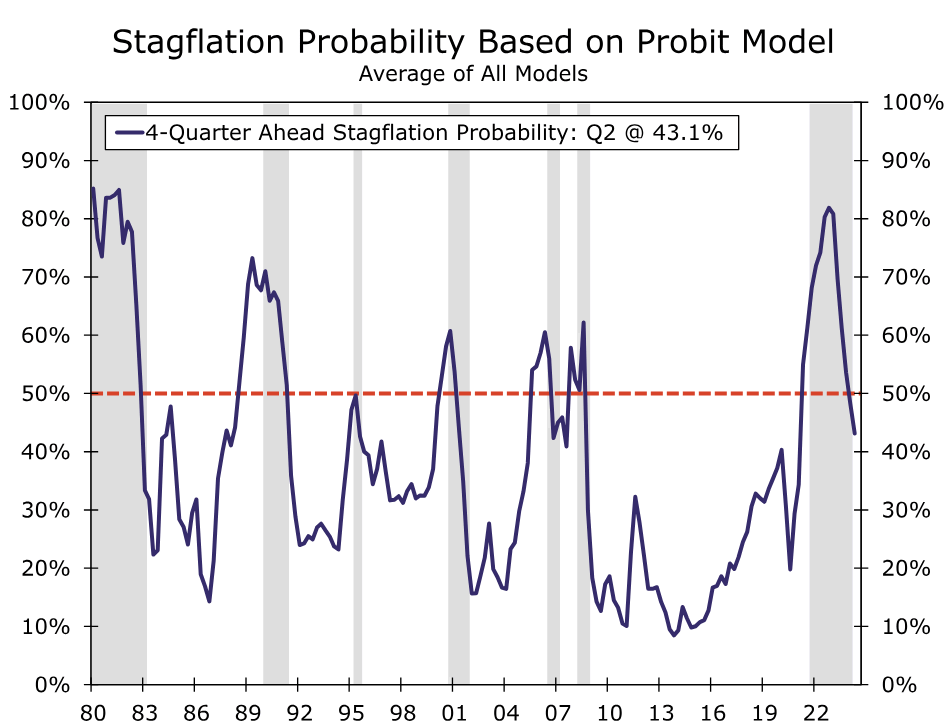
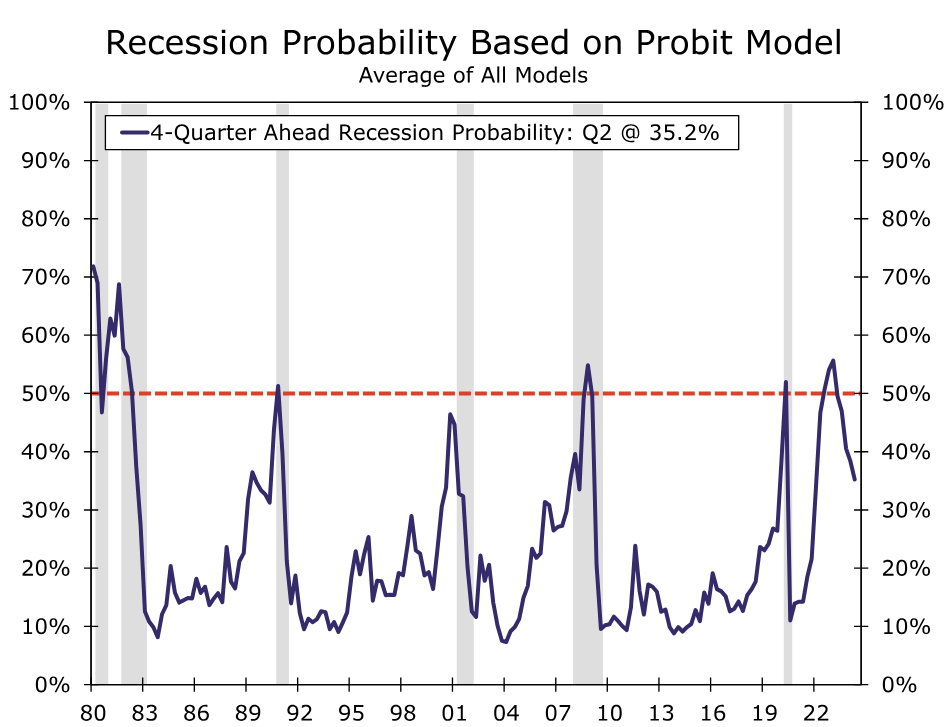
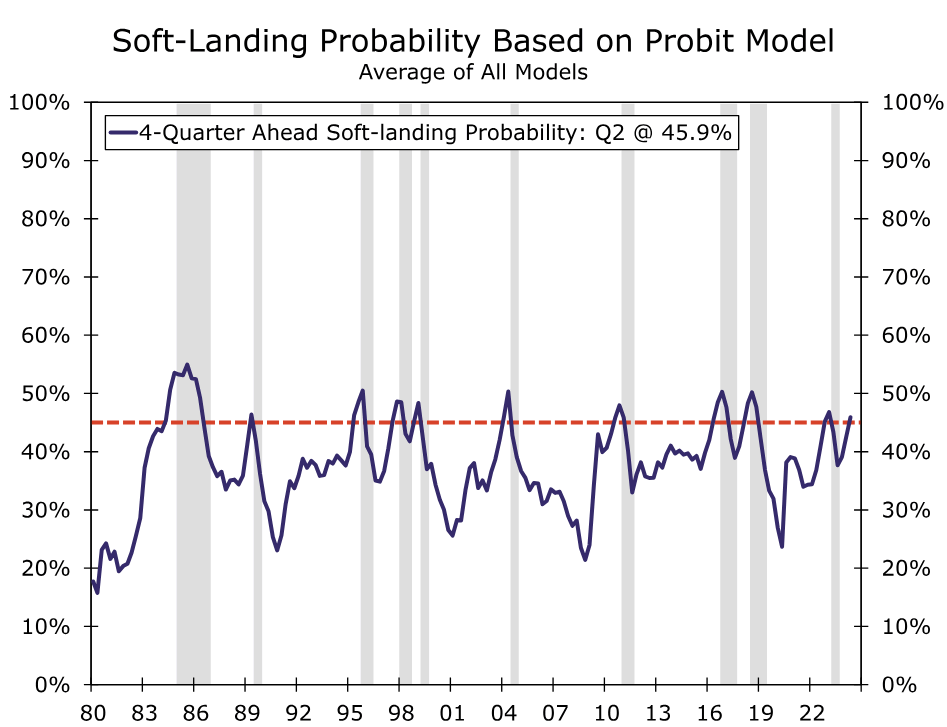
The simulated real-time, out-of-sample probabilities are plotted in Figure 1.2 The purple bars above the zero-line represent actual periods of stagflation, and the red bars show when GDP growth rates were in soft-landing thresholds (our proposed dates for stagflation and soft-landing episodes). The pink bars below the zero line are attached to recessionary periods as defined by the National Bureau of Economic Research (NBER).

The purple line represents a four-quarter-out probability of stagflation, the red line indicates the probability of soft-landing and the pink line indicates the probability of recession. We converted probabilities of recession into a negative series (probabilities multiplied by minus one), so a probability closer to -1 (minus one) indicates a significant risk of recession within the next four quarters.
A threshold of 33% (0.33) is selected based on the average probabilities of the three scenarios, so if the probability of a scenario is greater than the threshold, then the chances of that scenario occurring during the next four quarters are more likely than not. For example, the soft-landing probability based on Q2–2024 is 37% (0.37), so this indicates that the model suggests a soft-landing is the more likely growth scenario for the next four quarters (Figure 2).
The framework predicts all recessionary periods accurately, as the recession probabilities stay above 33% (or 0.33) during all six recessions in our simulated out-of-sample analysis of the post-1980 era. However, the recession probability crossed the threshold back in Q2–2022, but the NBER never declared a recession in that period (as of Q2–2024). The framework’s recession call is consistent with the private sector’s expectations of a recession during that period. The recession probability based on the most recent data (Q2–2024) is 30% (0.30 in Figure 3).
The probit approach accurately predicted periods of stagflation, as the purple line (probability of stagflation) stayed above the threshold during each of the seven episodes of stagflation. In recent years, the stagflation probability line breached the threshold in Q4–2021 and then remained above the threshold until Q4–2022. The Q2–2024 value shows a 28% (0.28) chance of a stagflation episode during the next four quarters (Figure 4).
In sum, the ordered probit framework performed accurately during the post-1980 era. The approach successfully predicted soft-landings, stagflations and recessions using a threshold of 33%. However, the framework inaccurately predicted a recession occurring in recent years, as the economy has yet to fall into a recession as of Q2–2024.
On the other hand, the stagflation probability breached the threshold back in 2021, which turned out to be correct according to our proposed episodes of stagflation. In all, concentrating on more than just the risk of recession would increase the chances to predict potential risks to the near-term economic outlook.
The Three Probabilities To Help Monetary Policy Decisions: An Illustration
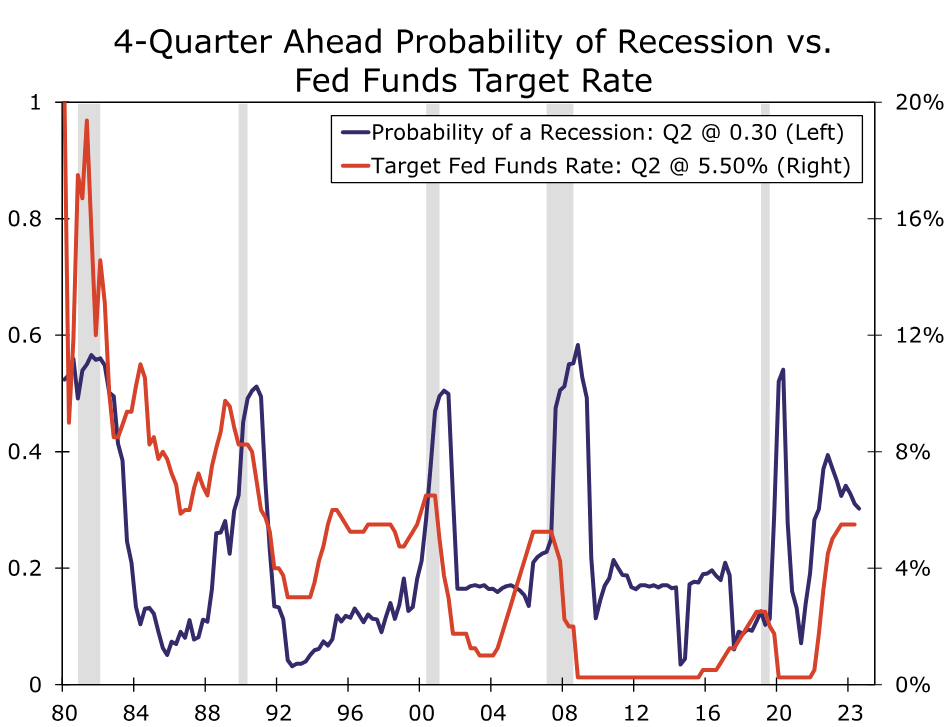
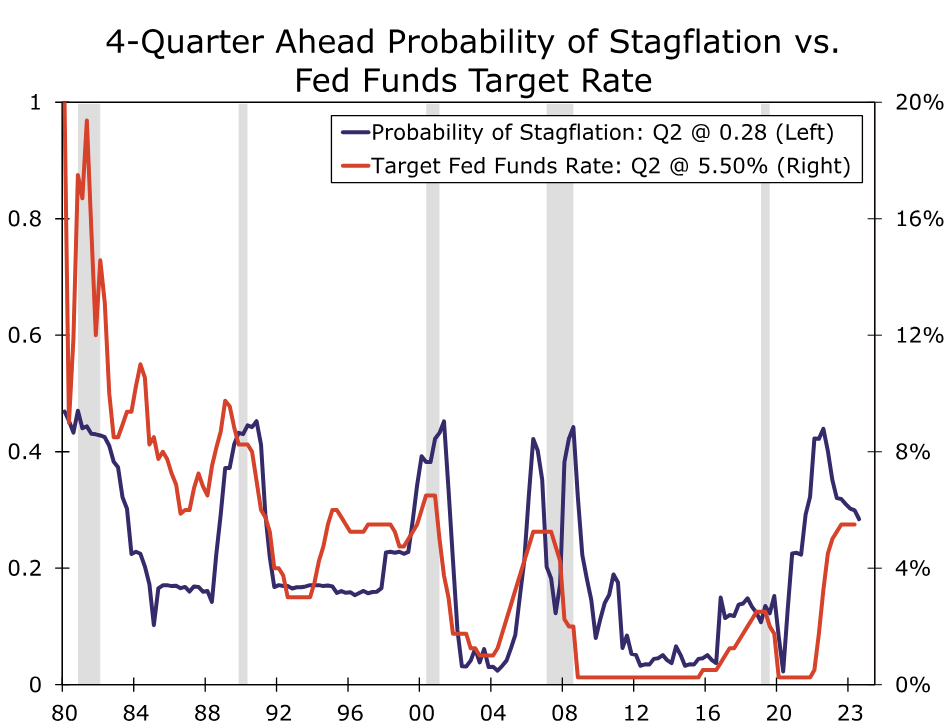
To illustrate some key observations from our analysis for the post-pandemic era, we plot the probabilities of the three growth regimes versus the fed funds target rate in Figures 2, 3 and 4. The three separate charts show each growth scenario probability alongside movements in the fed funds rate. All three probabilities breached the threshold in recent years but at three different points in time. The stagflation probability jumped to 42% in Q4–2021, while the recession probability breached the threshold in Q2–2022 (at 37%) and the soft-landing probability hit the threshold line in Q1–2023 (at 33%).
Why are these three probabilities valuable inputs to monetary policy decisions? We believe our framework can help decision makers by predicting the likelihood of different growth scenarios occurring. For example, in March 2022, the FOMC raised the fed funds rate for the first time in the post-pandemic period to combat higher inflation. In total, the Committee raised rates by 525 bps by year-end 2023, the fastest pace of rate hikes in decades. Some analysts suggest that the faster pace of rate hikes was to compensate for the Committee's misjudgment about inflation, which it initially labeled as "transitory." In hindsight, our framework would have helped analysts better navigate the 2022 policy pivot. As seen in Figure 4, our framework showed stagflation probabilities trending upward in 2021—a sign that the risk of higher inflation was rapidly developing. To combat that risk, the FOMC may have started to raise rates in 2021 rather than 2022, based on our analysis.
Additionally, the framework's elevated stagflation probability in 2022 and 2023 would have affected the FOMC's prediction of four rate cuts in 2024. The stagflation probability has remained at 30% or higher for the 12 consecutive quarters between Q3–2021 and Q2–2024, the longest duration since Q3–1983. This stagflation probability suggests a policy pause may have been needed for a longer duration than the expectations at the time.3
The Elevated Probabilities of Stagflation and Recession Clouds the Near-Term Monetary Policy Path
In summary, the soft-landing probability is the highest, which indicates that the chances of a soft-landing (trend-like growth) are higher during the next four quarters. However, elevated probabilities for all three scenarios would caution analysts to consider more than just two (recession and soft-landing) scenarios.
Taking the last two quarter’s probabilities at face value, both recession and stagflation probabilities trending downward (still elevated, but below the threshold) and the soft-landing probability trending upward (and above the threshold) would suggest a rate cut would be in the picture if the probabilities continue to follow the current trends. However, the persistently higher stagflation and recession probabilities of the last few years may cloud the near-term policy path. Particularly, the pace and magnitude of rate cuts may be different in the current cycle compared to the last business cycle, as the stagflation probability never breached the threshold in the post-Great Recession era. The next installment of the series will provide a framework to predict monetary policy pivots using the probabilities of the three growth scenarios.
Endnotes
1 – Our earlier work has extended the traditional probit approach which forecasts only a binary outcome such as recession and no-recession probability. We have employed an ordered probit framework which allows us to generate simultaneous probabilities of the three scenarios. See wage growth report from July 30, 2021. (Return)
2 – An important note is that we concentrate on the three growth regimes, and thereby, only report probabilities for stagflation, recession and soft-landing. The framework does include options of weak and strong growth periods (as identified by the proposed soft-landing framework, discussed in Part Two). (Return)
3 – It is worth mentioning that the private sector forecasters (using the Blue-Chip consensus as a proxy) were predicting a rate cut by the end of 2023 and four rate cuts throughout 2024. (Return)
Appendix
As a robustness check to our ordered probit framework, we build probit regressions for the three growth scenarios, i.e., three separate sets of probit regressions to generate probabilities of the three growth scenarios. For example, eight different probit regressions are formed to generate a binary outcome for the soft-landing scenario, i.e., predicting the probability of soft-landing and no soft-landing. We repeat the simulation process for recession (recession and no recession) and stagflation (stagflation and no stagflation) scenarios. Moreover, an average of eight probit regressions accurately predicted episodes of soft-landing at a 45% threshold. Average probabilities for recession and stagflation also confirm the accuracy of our proposed ordered probit framework. An important observation from the stagflation probit approach is that the probability hit 80% in Q3–2022, which was the highest probability since Q3–1982. Moreover, the stagflation probability remained above the threshold of 50% for 11 consecutive quarters (from Q2–2021 to Q4–2023) which may cloud the upcoming easing cycle path. The latest stagflation reading (Q2–2024) is 43%, which is below the threshold but still elevated.
US job growth revised down by -818k in largest payroll adjustment dince 2009
According to a report from the US Bureau of Labor Statistics, the economy created -818k fewer jobs than initially reported in the 12-month period through March 2024.
This significant revision means that actual job growth was nearly -30% less than the originally reported figure of 2.9m.
The revision, which amounts to a -0.5% adjustment in total payrolls, marks the largest downward revision since 2009.