Sample Category Title
Payrolls Revision Flagged as Potential Gamechanger
Markets
The recent comeback momentum on US stock markets stalled yesterday with main US benchmarks suffering minor losses (-0.25%) following an astonishing rally over the past two weeks. Other directional trades continued. US Treasuries outperformed German Bunds with daily changes on the US curve ranging between -8.2 bps (2-yr) and -6.2 bps (30-yr) compared with -3.3 bps (5-yr) to -2.7 bps (30-yr) for Germany. US yields started slipping again as US traders joined yesterday’s actions. Fed Bowman said that should the incoming data continue to show that inflation is moving sustainably toward our 2% goal, it will become appropriate to gradually lower the federal funds rate to prevent monetary policy from becoming overly restrictive. The onus of several Fed comments is on gradual contrary to stealth easing discounted by US money markets for this year and next. In the run-up to this afternoon’s BLS payrolls revision, tomorrow’s PMI’s and Friday’s Powell speech in Jackson Hole, interest rate markets are clearly not (yet) backing down from their aggressive Fed easing bets. The US 2-yr yield closed back below 4% and seems drifting back to test the 3.85% support area. Failure to move south on softer data/dovish signals this week or early September (ISM’s & Payrolls) would be a strong signal that sufficient dovishness is discounted by now. The US 10-yr yield is already testing important support at 3.8%. The dollar continues suffering from the interest rate loss. The trade-weighted greenback closed at 101.44 yesterday from a start at 101.88. Key support arrives at 100.62 (Dec23 low), 99.58 (2023 low) and 98.98 (62% retracement on 2021/2022 DXY rally). Similar resistance in EUR/USD (close 1.1130) stands at 1.1139/1.1274/1.1276.
The US Bureau of Labour Statistics today publishes its preliminary annual benchmark revision (using Quarterly Census of Employment and Wages data). The June QCEW suggested that US job growth in the year through March was likely less robust than indicated. Ballpark figures point at a downward revision of about 60k/month on average. Today’s payrolls revision had over the past months been flagged as a potential gamechanger pushing markets and the Fed away from “higher for longer” into more outspoken rate cuts. Since the early August repositioning in US money markets, the BLS update likely lost market impact. From being a potential game changer to more of a confirmation. Nevertheless, any substantial (>50k/month) downward revision won’t go unnoticed and could tip markets more in the direction of a 50 bps rate cut lift-off.
News & Views
PAP newswire reports that National Bank of Poland governor Glapinski indicated that he no longer can rule out a discussion on a monetary policy adjustment before 2026. Last month, he still advocated that view due to reigning uncertainty about the inflation outlook. According to Glapinski’s current assessment, decisions will depend on wage growth, consumption, energy prices and the economic situation of Poland’s trading partners. In this respect, the NBP governor indicated that the risk of higher inflation in Europe and the US was slightly disappearing and that rate cut expectations have increased. The Polish economy has grown more than expected in Q2 (1.5% Q/Q and 3.2% Y/Y) according to preliminary data released last week, Glapinski’s says that it’s not sure this trend will continue. Consumption will probably slow next year due to fading wage growth. This will make the international context a more important factor for Polish growth. Polish inflation reaccelerated in July to 1.5% M/M and 4.2% Y/Y (from 2.6% in June) as the government raised the cap on energy prices. The PLN 2-y swap rate declined from 5.10% to 4.94%.The EUR/PLN cross rate jumped from the 4.265 area to close near 4.276.
Canadian inflation (published yesterday) rose by 0.4% M/M in July causing the Y/Y figure to decelerate further from 2.7% to 2.5%, the slowest pace since March 2021. The monthly details were a bit mixed with goods prices rising a modest 0.2% M/M (0.3% Y/Y), but services reaccelerating 0.7% M/M (slowing to 4.4% Y/Y from 4.8%). Energy prices rose 1.6% M/M. Closely watched core inflation measures (core median 2.4% from 2.6% Y/Y and core trimmed mean 2.7% from 2.8% Y/Y) remain on a downward trajectory. The data are seen as a nihil obstat for the Bank of Canada to further reduce its policy rate (currently 4.5%) when it will meet next on September 4 (25 bps reduction fully discounted). At its July policy meeting, the BoC indicated a growing sensitivity for the risks to growth/excess supply in the economy.
Graphs
GE 10y yield
The ECB cut policy rates by 25 bps in June. Stubborn inflation (core, services) make follow-up moves less evident. Markets nevertheless price in two to three more cuts for 2024 as disappointing US and unconvincing EMU activity data rolled in, dragging the long end of the curve down. The move accelerated during the early August market meltdown.
US 10y yield
The Fed in its July meeting paved the way for a first cut in September. It turned attentive to risks to the both sides of its dual mandate as the economy is continuing to move better in to balance. Money markets tend to err in favour of a 50 bps lift-off. The pivot weakened the technical picture in US yields with another batch of weak eco data pushing the 10-yr sub 4%.
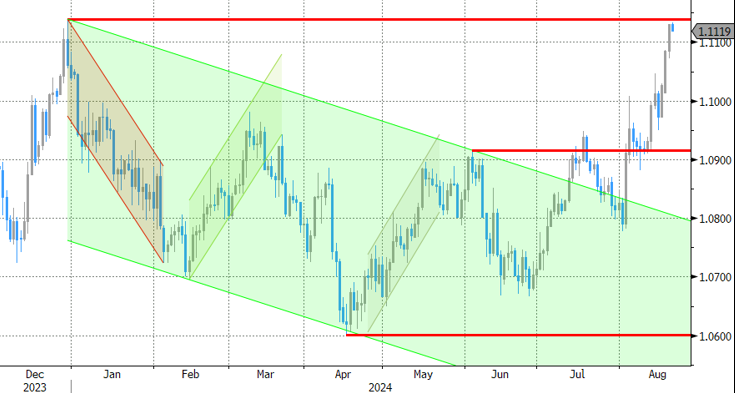
EUR/USD
EUR/USD moved above the 1.09 resistance area as the dollar lost interest rate support at stealth pace. US recession risks and bets on fast and large (50 bps) rate cuts trumped traditional safe haven flows into USD. EUR/USD 1.1139 (Dec 2023 high) and 1.1276 (2023 top) serve as next technical references.
EUR/GBP
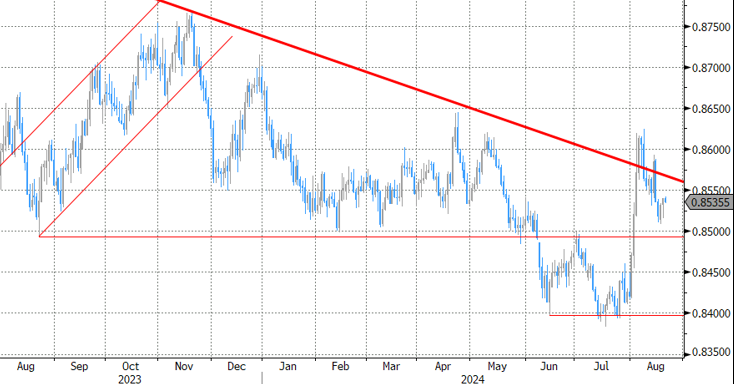
The BoE delivered a hawkish cut in August. Policy restrictiveness will be further unwound gradually 0on a pace determined by a broad range of data. The strategy similar to the ECB’s balances out EUR/GBP in a monetary perspective. Risk-off proved a more important driver of GBP recently, triggering a return from 0.84 towards 0.86.
US Dollar Extends Losses, Gold Shines
There was no major news on the wire to trigger the minor selloff in global equities, so it was nothing else than a correction after a long rally following an ugly meltdown. As such, the S&P500 and Nasdaq were slightly down, by around 0.20% each, the European Stoxx 600 retreated 0.47%, while the Nikkei gave back some of yesterday’s gains in Tokyo, as the USDJPY fell and consolidated near the 145 level.
The US dollar index took another dive, however, and hit the lowest levels since the beginning of January. Citi analysts said that the carry trade is back but not with the Japanese yen but with the US dollar. They say that the positioning comes as a macro risk gauge dipped below neutral, but warned that there is only a small window of opportunity for the strategy to perform well as the election risks are looming. Additionally, the Fed risks are looming as well, and the greenback - now in the oversold territory according to the RSI index - doesn’t look appetizing for further shorting the dollars.
Data-wise, the final inflation numbers from the Eurozone brought no surprise. The headline inflation remained steady at 2.9% and core inflation ticked slightly higher from 2.5% to 2.6%. The numbers were soothing but the slowing disinflation and the strong wages growth in many European countries including France, Spain and Germany, were pointed as ‘worrying signals’ for the European Central Bank’s (ECB) struggle to bring inflation down to its 2% target. The latter cast a shadow over what the ECB could do after the anticipated September cut. The waning dovish expectations gave a boost to the single currency yesterday. As such, the EURUSD spiked past the 1.11 level. The US dollar’s broad-based weakness helped as well.
Now, the EURUSD is in the overbought territory and a downside correction would be healthy. Across the Channel, the weak dollar pushed Cable above an important psychological mark: the 1.30 level. The pair never traded meaningfully above this level since 2022 and a meaningful appreciation above this level means more to sterling bulls than just a policy divergence between the Federal Reserve (Fed) and the Bank of England (BoE).
Elsewhere, though, the tone was mixed. In Sweden, the Riksbank cut its rate by 25bp yesterday and said that it could lower its rate three more times this year. But despite that dovishness, the Swedish krona advanced against the greenback yesterday, and the USDSEK fell to the lowest levels since March. Across the Atlantic, inflation in Canada fell from 2.7% to 2.5% in July as expected and marked the softest increase in consumer prices since March 2021. Core inflation fell to 1.7%. The numbers were aligned with the Bank of Canada’s (BoC) forecasts that inflation would drop toward the 2.5% mark in H2. Although inflation is expected to rebound due to incoming base effects for gasoline prices, the numbers backed the dovish BoC expectations, yet here as well, the Loonie was bid against a widely offered US dollar. Even the selloff in crude oil didn’t give cold feet to the CAD bulls. The USDCAD fell to 1.36 and is about to test the 200-DMA to the downside. Needless to say that the pair is also approaching an overbought territory and should see traders take a break and think what to do next.
In summary, no matter the news flow or the idiosyncratic expectations, the major story is the US dollar’s weakness – that I think has stretched to unfunded levels. Today, the dollar traders will have a close look to the FOMC minutes and the BLS preliminary revision to annual payrolls. I don’t think that we will have anything major from the Fed minutes – plus, so much has changed since the last FOMC meeting with market expectations going to wild places – but the BLS’ revision could be interesting in that, economists at Golman Sachs and Wells Fargo expect that the revisions will show that the payrolls growth in the year through March was at least 600’000 lower than currently forecasted. Goldman says that the revision could be as high as a million lower, while JP thinks that the numbers will be revised by around 360’000 jobs to the downside. The bigger the downside revision, the higher the worries that the Fed has waited too much before normalizing and the crazier the Fed doves will go and the higher the pressure will be on the US dollar.
And of course, the dollar’s misery is making gold shine like a new penny. The precious metal advanced to a fresh record yesterday backed by the rising expectation of Fed cuts and the lower US yields. TD Securities say that the current positioning in gold is more consistent with levels that would suggest recession. If you believe a recession isn't imminent, gold prices may be – perhaps – inflated. It’s true that the EM central bank have been buying gold to diversify against inflation and diversify away from the dollar and the uncertain geopolitical, financial landscape drives capital to the safety of the yellow metal. Yet, Chinese consumers are reportedly cutting back their purchases due to high prices, the dovish Fed expectations look overpriced and the RSI index suggests that gold is about to step into the overbought territory and correction could be healthy at the current levels.
Riksbank Cuts Interest Rates by 25bp and Signals 2-3 More Rate Cuts in 2024
In focus today
In the US, minutes of the Fed's July meeting will be published in the evening. While the focus will naturally be on any clues regarding future rate cuts, the views are likely at least somewhat outdated given that the July jobs report was published only after the meeting. Furthermore, the US Bureau of Labor Statistics will publish revisions to the nonfarm payrolls and there is a very wide estimate for the revisions.
Economic and market news
What happened yesterday
In Sweden, the Riksbank cut policy rate by 25 bp as anticipated by the market. The Riksbank message of "two to three" more rate cuts for 2024 was however a tad on the dovish side to our expectations. In the statement, the bar to change this outlook is also seemingly high as they seem confident that upside risks to inflation have "declined significantly". We adjust our call by adding a 25bp rate cut in September, meaning that we expect 25bp cuts at the three remaining meetings for 2024. For 2025, we expect three cuts during the first half of the year, reaching an endpoint of 2.00% by summer (previously 2.00% by Q4-25).
In the US, Fed's Bowman (voting member) spoke about monetary policy. She sounded rather hawkish, as she warned against overreacting to any single data points, while she remains cautious about making any shifts in rates, as she sees continued upside risks for inflation. By this statement Bowman clearly positions herself as one of the most hawkish voices in the FOMC now. Our expectation is still that we will see a 25bp rate cut at the September meeting.
In the euro area, the final HICP data from July reveals that domestic inflation, measured by the ECB's 'LIMI' indicator, dropped slightly to 4.3% y/y in July from 4.4% in June. The persistently high inflation is crucial to the ECB's policy decisions and has been consistently highlighted in recent monetary statements. With decent demand in services, low unemployment, and high wage growth, domestic inflation is expected to remain strong. Consequently, it is unlikely to dip to 2% over the next year, even as overall HICP may hit that mark later this quarter. Given its importance in ECB policy, we expect continued restrictive measures, with the next policy rate cut in December, bypassing the September meeting, followed by three cuts next year.
In Turkey, The Central Bank of Turkey left the policy rate unchanged at 50% as largely expected. Slowing domestic demand should eventually ease inflationary pressures and the CBRT is expected to kick off the rate cutting cycle later this year. We still think risks are tilted towards higher inflation (and rates) for longer.
In Denmark, GDP grew 0.6% in Q2, mainly because of increased goods export. The Q2 growth was more modest than we expected, however, the Q1 decrease was revised down as well. Danish GDP fluctuates quite a bit now due to production in the pharmaceutical industry causing big movements. We expect growth to continue to spread also outside the pharmaceutical industry, which will help the economy grow for the rest of 2024.
The rebound in Oil prices proved short-lived and prices have slipped towards the low from two weeks ago. Other than reports on the tense geopolitical situation in the Middle East, there has been little news to drive the oil market. We further note that oil prices have failed to find support from the weaker USD. We think the weak sentiment reflects concerns over whether the US economy is slipping into recession and that is unlikely to go away in the near term.
Market movements
Equities: Global equities were lower yesterday, breaking a long streak of gains. There was basically no top-down data to significantly impact the market, so it seems reasonable to attribute the downturn to some investors taking profits after a sustained period of gains.
Notably, the energy sector was the biggest loser yesterday and has been on a downward trend lately, with oil prices declining in five of the last six sessions. Additionally, banks, particularly regional banks in the US, were sold off yesterday. US regional banks lost 2% and continue to be indicative of how investors view the soft-landing and small-cap outlooks. As many people enjoyed vacations in July, it is maybe worth mentioning that July was the peak month for the soft-landing narrative, with US regional banks rising more than 20% during the month. In the US yesterday, Dow was down 0.2%, S&P 500 decreased by 0.2%, Nasdaq dropped by 0.3%, and Russell 2000 fell by 1.2%. The negative sentiment is continuing in Asia this morning with most indices lower. US and European futures are mixed.
FI: Global bond yields declined yesterday, and the US curve steepened ahead of the speech from Fed Chairman Powell at the Jackson Hole conference. Today, we have the minutes from the latest Fed Meeting, which should also confirm that the Federal Reserve is on track to deliver rate cuts. Furthermore, the US Bureau of Labor Statistics will publish revisions to the nonfarm payrolls and there is a very wide estimate for the revisions. A significant downward revision would be supportive for a steeper curve and lower yields.
FX: SEK rallied after the Riksbank delivered the expected 25bp cut and signalled more cuts to come this year. The USD stayed on a weak footing with EUR/USD eclipsing the 1.11 mark.
GBP/USD Gathers Pace, More Gains In Sight?
Key Highlights
- GBP/USD started a fresh increase above the 1.2920 resistance.
- It broke a major bearish trend line with resistance at 1.2765 on the 4-hour chart.
- Gold prices are consolidating gains above the $2,500 resistance.
- EUR/USD surged toward the 1.1120 level and aims for more upsides.
GBP/USD Technical Analysis
The British Pound formed a base above the 1.2750 level and started a decent increase against the US Dollar. GBP/USD cleared 1.2900 to move into a positive zone.
Looking at the 4-hour chart, the pair climbed further above 1.3000 to set a new multi-week high. The pair traded as high as 1.3052 and is currently consolidating gains. It is still above the 1.3000 zone and showing positive signs above the 23.6% Fib retracement of the upward move from the 1.2664 swing low to the 1.3052 high.
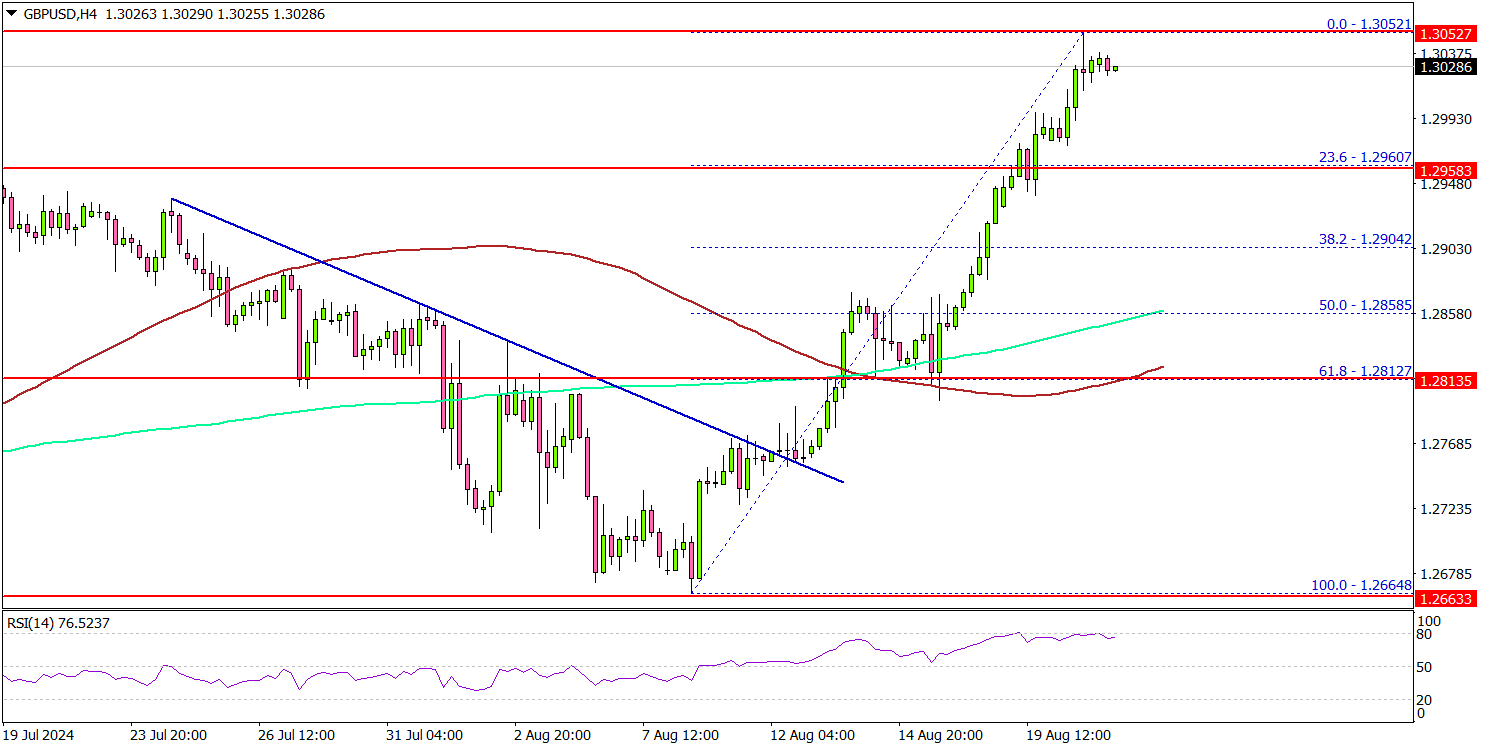
Immediate support is near the 1.3000 level. The first major support is near the 1.2960 level. A downside break below the 1.2960 level could set the pace for a larger decline.
The next major support is near the 1.2860 level or the 50% Fib retracement of the upward move from the 1.2664 swing low to the 1.3052 high. Any more losses might send the pair toward the 1.2820 support level.
On the upside, the pair could face resistance near the 1.3050 level. The first key resistance sits near the 1.3120 level. A clear move above the 1.3120 level could set the pace for a move toward the 1.3200 level.
Looking at EUR/USD, the pair rallied above the 1.1000 level, and seems like the pair could continue to move higher toward the 1.1200 level.
Economic Releases
- FOMC Meeting Minutes.
GBP/JPY Daily Outlook
Daily Pivots: (S1) 188.64; (P) 189.95; (R1) 190.68; More...
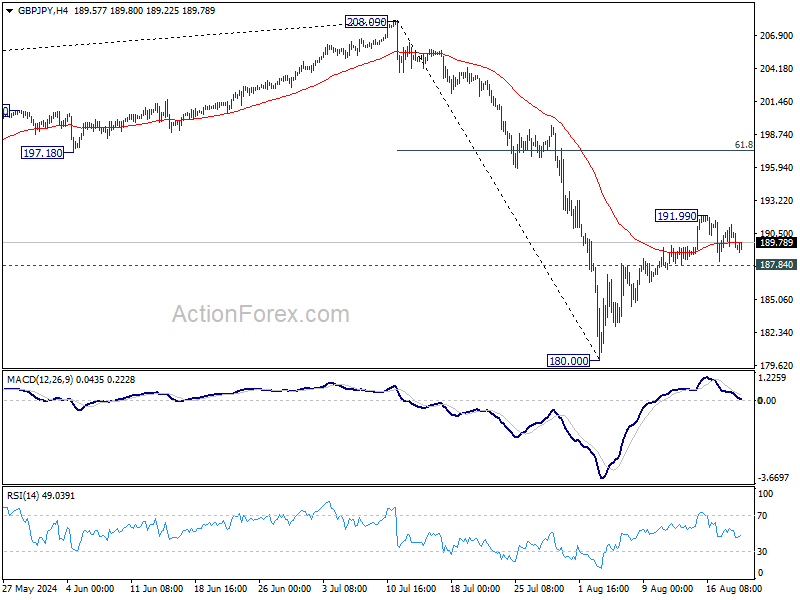
Intraday bias in GBP/JPY remains neutral as range trading continues inside 187.84/191.99.On the upside, above 191.99 will target 61.8% retracement of 208.09 to 180.00 at 197.35, as the second leg of the corrective pattern from 208.09. On the downside, however, firm break of 187.84 support will argue that rebound from 180.00 has completed, and turn bias back to the downside for retesting 180.00 instead.
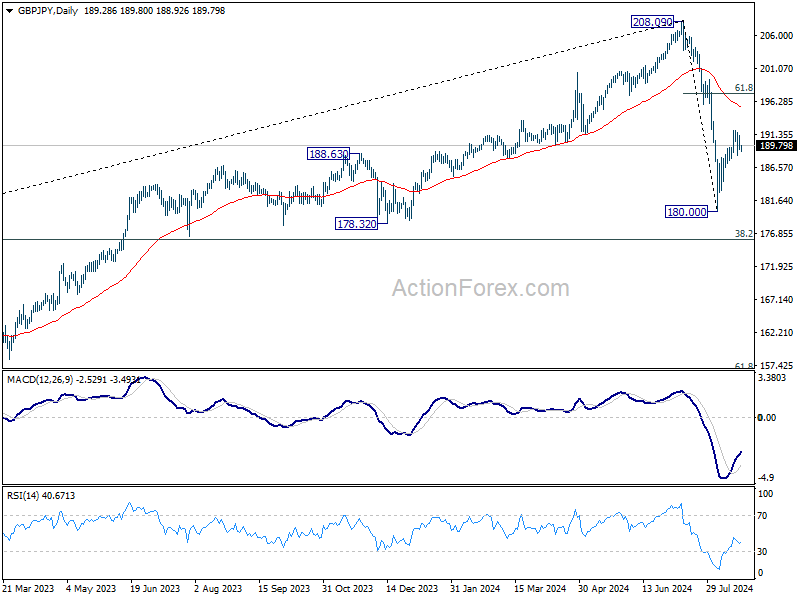
In the bigger picture, price actions from 208.09 are seen as a correction to whole rally from 123.94 (2020 low). Current development suggests that the first leg has completed and the range of medium term consolidation should be set between 38.2% retracement of 123.94 to 208.09 at 175.94 and 208.09.
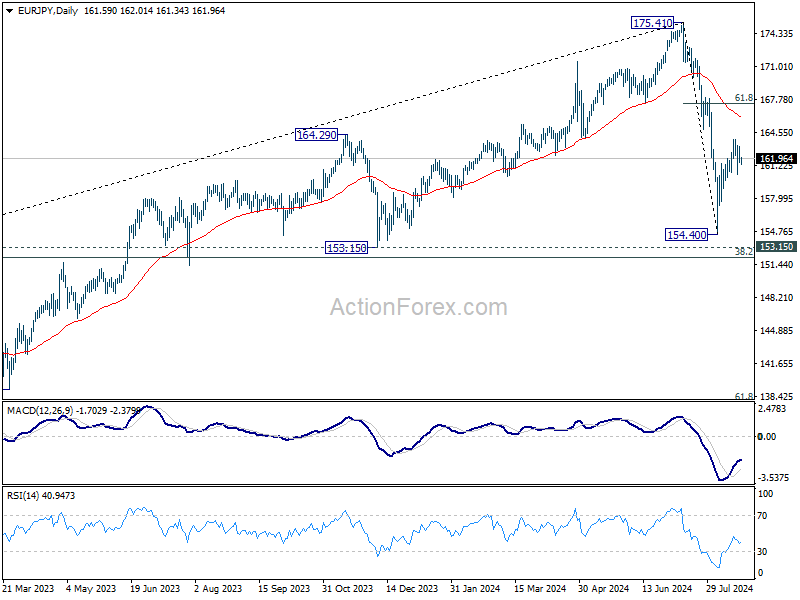
EUR/JPY Daily Outlook
Daily Pivots: (S1) 161.10; (P) 162.14; (R1) 162.75; More....
Intraday bias in EUR/JPY remains neutral and outlook is unchanged. On the upside, break of 163.86 will target 61.8% retracement of 175.41 to 154.40 at 167.38, as the second leg of the corrective pattern from 175.41. On the downside, however, firm break of 160.57 support will suggest that the rebound from 154.40 has completed, and turn bias back to the downside for 154.40 instead.
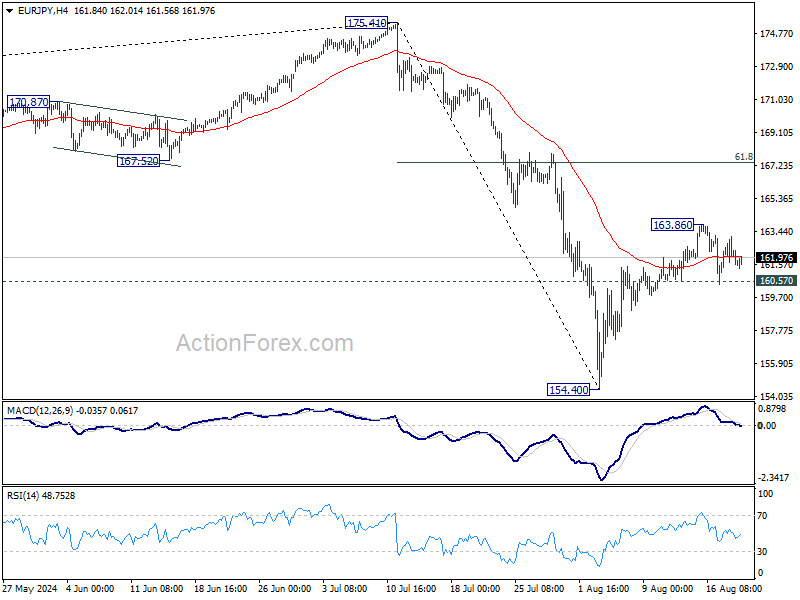
In the bigger picture, price actions from 175.41 are seen as correction to rally from 114.42 (2020 low). Current development suggests that the first leg has completed. The range of consolidation should be seen between 38.2% retracement of 114.42 to 175.41 at 152.11 and 175.41 high.
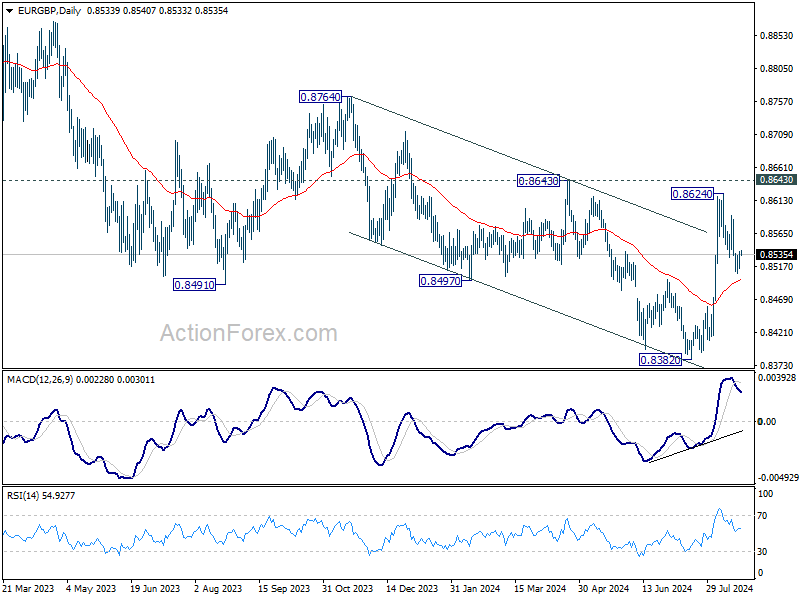
EUR/GBP Daily Outlook
Daily Pivots: (S1) 0.8523; (P) 0.8532; (R1) 0.8547; More....
Intraday bias in EUR/GBP remains neutral for the moment. In case of another fall, strong support should be seen from 55 D EMA (now at 0.8498), to complete the correction from 0.8624. Break of 0.8591 resistance will argue that rise from 0.8382 is ready to resume through 0.8624. However, sustained break of 55 D EMA will bring deeper fall to 61.8% retracement of 0.8382 to 0.8624 at 0.8474.
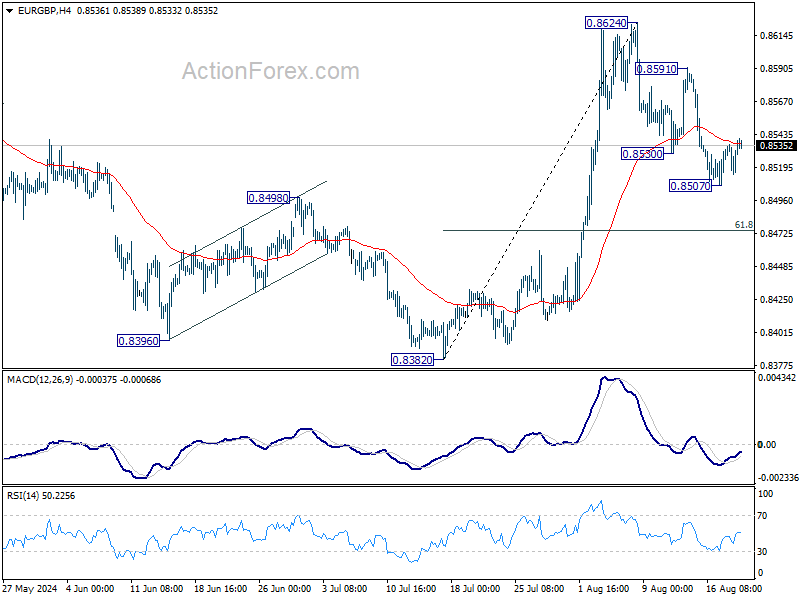
In the bigger picture, while the rebound from 0.8382 is strong, there is no confirmation of trend reversal yet. As long as 0.8643 resistance holds, down trend from 0.9267 could still resume through 0.8382 at a later stage. However, firm break of 0.8643 will indicate that such down trend has completed, and turn outlook bullish for 0.8764 resistance next.
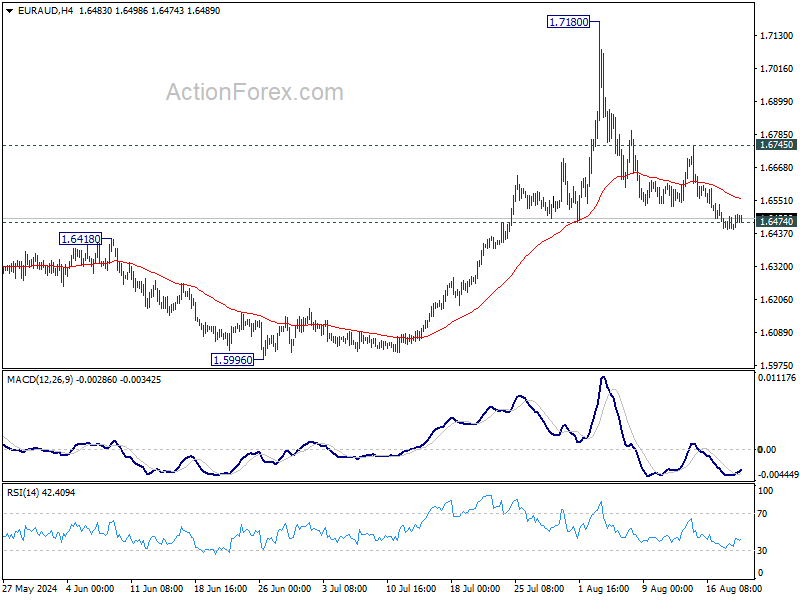
EUR/AUD Daily Outlook
Daily Pivots: (S1) 1.6463; (P) 1.6484; (R1) 1.6517; More...
Focus stays on 1.6474 support in EUR/AUD. Decisive break there will argue that rise from 1.5996 has completed, and dampen the larger bullish view. Intraday bias will be back on the downside for deeper fall towards 1.5996 in this case. Nevertheless, strong rebound from current level, followed by break of 1.6745 resistance, will retain near term bullishness and bring retest of 1.7180 high.
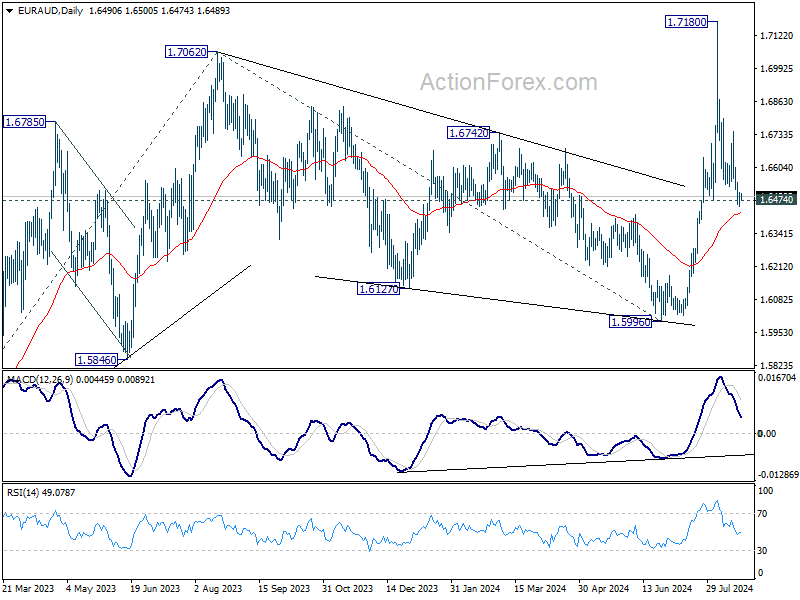
In the bigger picture, corrective fall from 1.7062 medium term top should have completed at 1.5996. Larger up trend from 1.4281 (2022 low) is resuming. Next target is 61.8% projection of 1.4281 to 1.7062 from 1.5996 at 1.7715. This will now remain the favored case as long as 1.6474 support holds. However, decisive break of 1.6474 will argue that EUR/AUD is still engaging in medium term range trading.
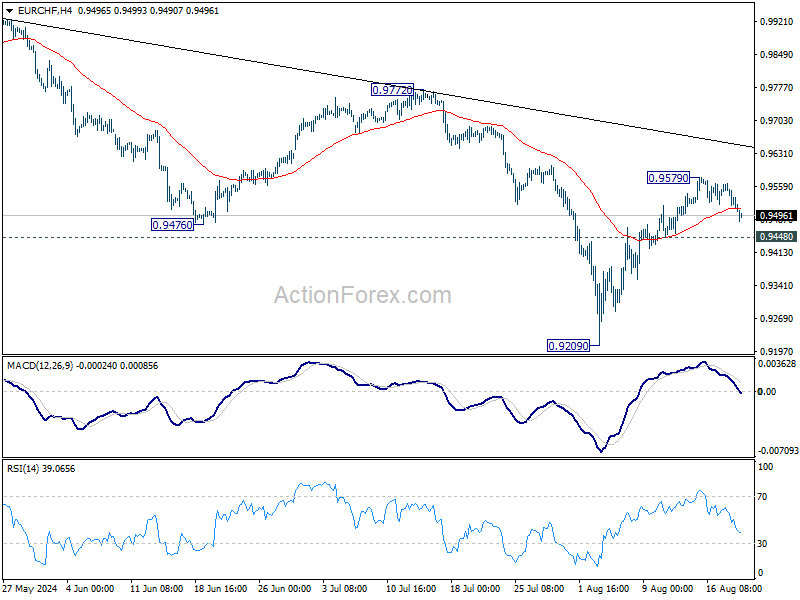
EUR/CHF Daily Outlook
Daily Pivots: (S1) 0.9483; (P) 0.9526; (R1) 0.9549; More....
Intraday bias in EUR/CHF remains neutral as consolidations continues below 0.9579. Further rally is expected as long as 0.9448 support holds. Sustained break of 55 D EMA (now at 0.9584) will pave the way back to 0.9972/0.9928 resistance zone. However, decisive break of 0.9448 will suggest rejection by 55 D EMA, and turn bias back to the downside for 0.9209 low.
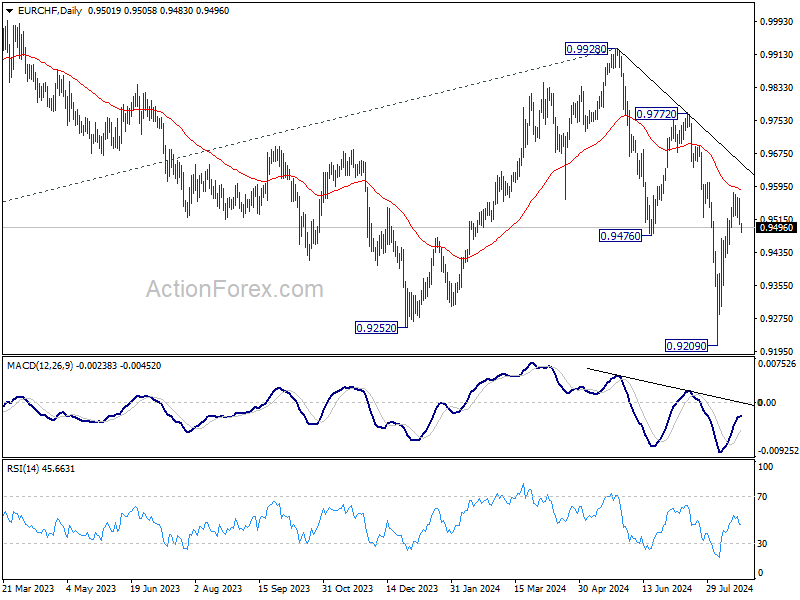
In the bigger picture, medium term corrective pattern from 0.9407 (2022 low) might have completed with three waves to 0.9928. Decisive break of 0.9252 (2023 low) will confirm long term down trend resumption. Next target will be 61.8% projection of 1.1149 to 0.9407 from 0.9928 at 0.8851. For now, outlook will stay bearish as long as 0.9928 resistance holds, even in case of strong rebound.
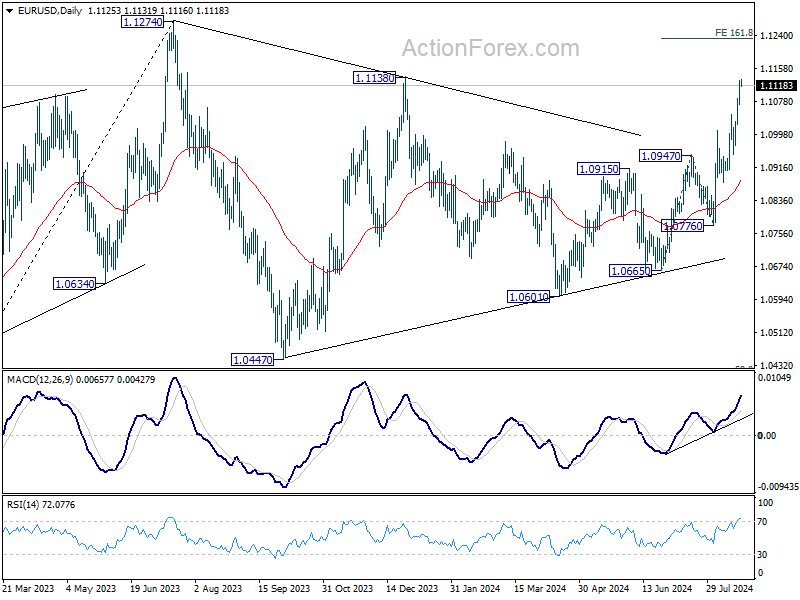
EUR/USD Daily Outlook
Daily Pivots: (S1) 1.1090; (P) 1.1112; (R1) 1.1151; More.....
EUR/USD's rally is still in progress and intraday bias stays on the upside. Firm break of 1.1138 resistance will target 161.8% projection of 1.0665 to 1.0947 from 1.0776 at 1.1232. On the downside, below 1.1071 minor support will turn intraday bias neutral and bring consolidations first. But outlook will now remain bullish as long as 1.0948 support holds.
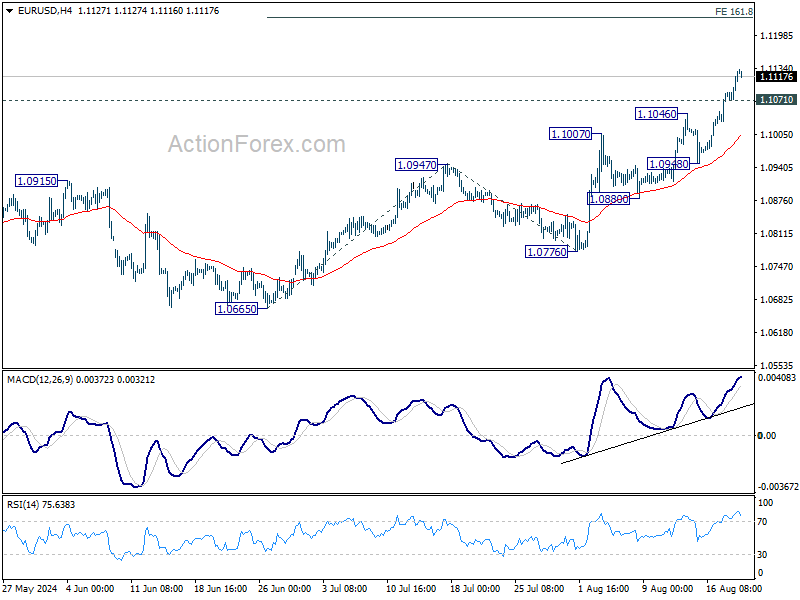
In the bigger picture, price actions from 1.1274 are viewed as a corrective pattern that's could still extend. Break of 1.1138 resistance will be the first signal that rise from 0.9534 (2022 low) is ready to resume through 1.1274 (2023 high). However, break of 1.0776 support will extend the correction with another falling leg back towards 1.0447 support.