
Sample Category Title
Could Fed Chief Powell Finally Reveal His Hand at Jackson Hole?
- The Jackson Hole Symposium will be held on August 22-24
- Fed Chairman Powell speaks on Friday at 14.00 GMT
- Markets expect a dovish tone in support of a September rate cut
- Fed minutes and PMI surveys to set the scene
Markets are gearing up for the Jackson Hole Symposium
The much talked-about Jackson Hole Symposium is just a few days away with the markets anxiously waiting for Fed Chairman Powell’s speech. The overall Fedspeak during this 3-day gathering could determine the Fed’s rate strategy for the rest of 2024, but also set the basis for its monetary policy stance in 2025.
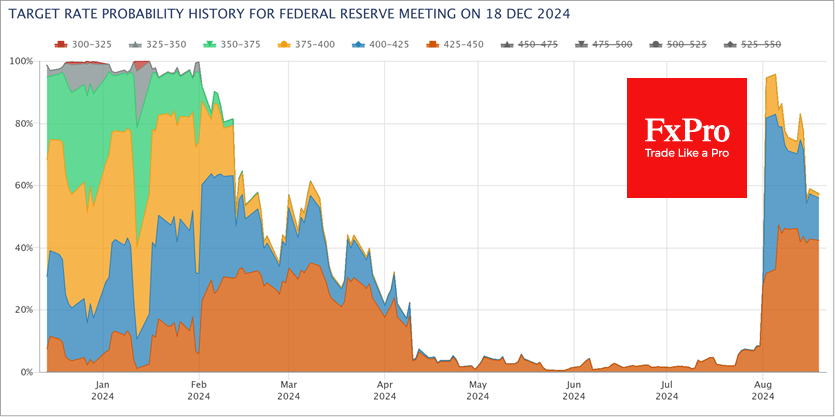
Following the recent stocks’ rout, which was fueled by US recession fears, the market is currently pricing in 95bps of easing in 2024 and another 105bps in 2025. According to the latest Reuters poll, most investment houses expect three rate cuts in 2024, but some diehards continue to talk about a 50bps rate cut in September.
Fed minutes and PMIs to serve as the appetizer
Ahead of the Jackson Hole gathering, and specifically on Wednesday the minutes of the July 31 Fed meeting will be published with the preliminary PMI surveys for August following a day later. Usually, the Fed minutes do not hold surprises. However, they could prove market-moving this time around if a greater appetite for rate cuts is revealed on Wednesday than the one portrayed by Chairman Powell on July 31.
In the meantime, Thursday’s PMI survey prints are expected to show a small improvement for both the services and manufacturing sectors, despite the latter still hovering below the 50 threshold. Such an outcome could serve as another confirmation of Powell’s comment at the last Fed press conference that “the picture is not one of a slowing or really bad economy”.
Powell will speak on Friday at 14.00 GMT
On Friday, Chairman Powell is expected to present his view on the current US economic outlook. He will most likely talk about the ongoing easing in labour market tightness, the growing level of confidence regarding the disinflation process and the Fed’s willingness to cut rates.
It is a crucial test of Powell’s ability to appease Fed members in order to secure strong support going into the September meeting, and to avoid attracting the ire from both US Presidential candidates and especially Donald Trump.
Putting together this week’s events, there are four likely scenarios:
Scenario 1: Dovish minutes, Powell pre-announces a September rate cut at Jackson Hole - 10% probability
This could be the perfect scenario for the market as not only Powell will reveal the worst kept secret that the Fed will cut rates in September, but he could also keep the market hoping for a 50bps rate cut. Barring any comments about an imminent US recession from Powell, equities could enjoy another strong day with the dollar most likely suffering across the board.
Scenario 2: Dovish minutes, Powell is dovish but does not pre-announce a rate cut - 50% probability
Powell confirms expectations by talking about Fed’s willingness to cut rates if the current momentum in the economy is maintained and assuming that no negative surprises come from both the Middle East and Russia-Ukraine conflicts. Stock markets could feel a degree of disappointment, but the recent positive sentiment should linger. The dollar will probably remain under pressure across the board in this scenario.
Scenario 3: Balanced minutes, Powell talks about data dependency – 30% probability
A more balanced speech by Powell, highlighting data dependency, but keeping the door firmly open to rate cuts, if needed, might upset the market and potentially result in a small correction in equities. The recent rally in stocks has been very gradual, potentially reflecting low confidence from investors. The dollar might have the chance for a small rebound, especially against the euro.
Scenario 4: Balanced minutes, Powell appears hawkish - 10% probability
A strong set of PMI surveys on Thursday and Powell appearing more hawkish than anticipated could really result in a sizeable risk-off reaction. Powell could acknowledge the progress made regarding the Fed’s dual mandate but state that the Fed has not reached the point of seriously discussing rate cuts. Equities could be under severe pressure with the dollar potentially recouping most of its losses during August.
GBPCAD Reacted Higher After Ending Double Correction Lower
In this technical blog, we will look at the past performance of the 1-hour Elliott Wave Charts of GBPCAD. In which, the rally from 28 September 2023 low is unfolding as a leading diagonal sequence and called for an extension higher to take place. Therefore, we knew that the structure in GBPCAD should remain supported & extend higher. So, we advised members not to sell the pair & buy the dips in 3, 7, or 11 swings at the blue box areas. We will explain the structure & forecast below:
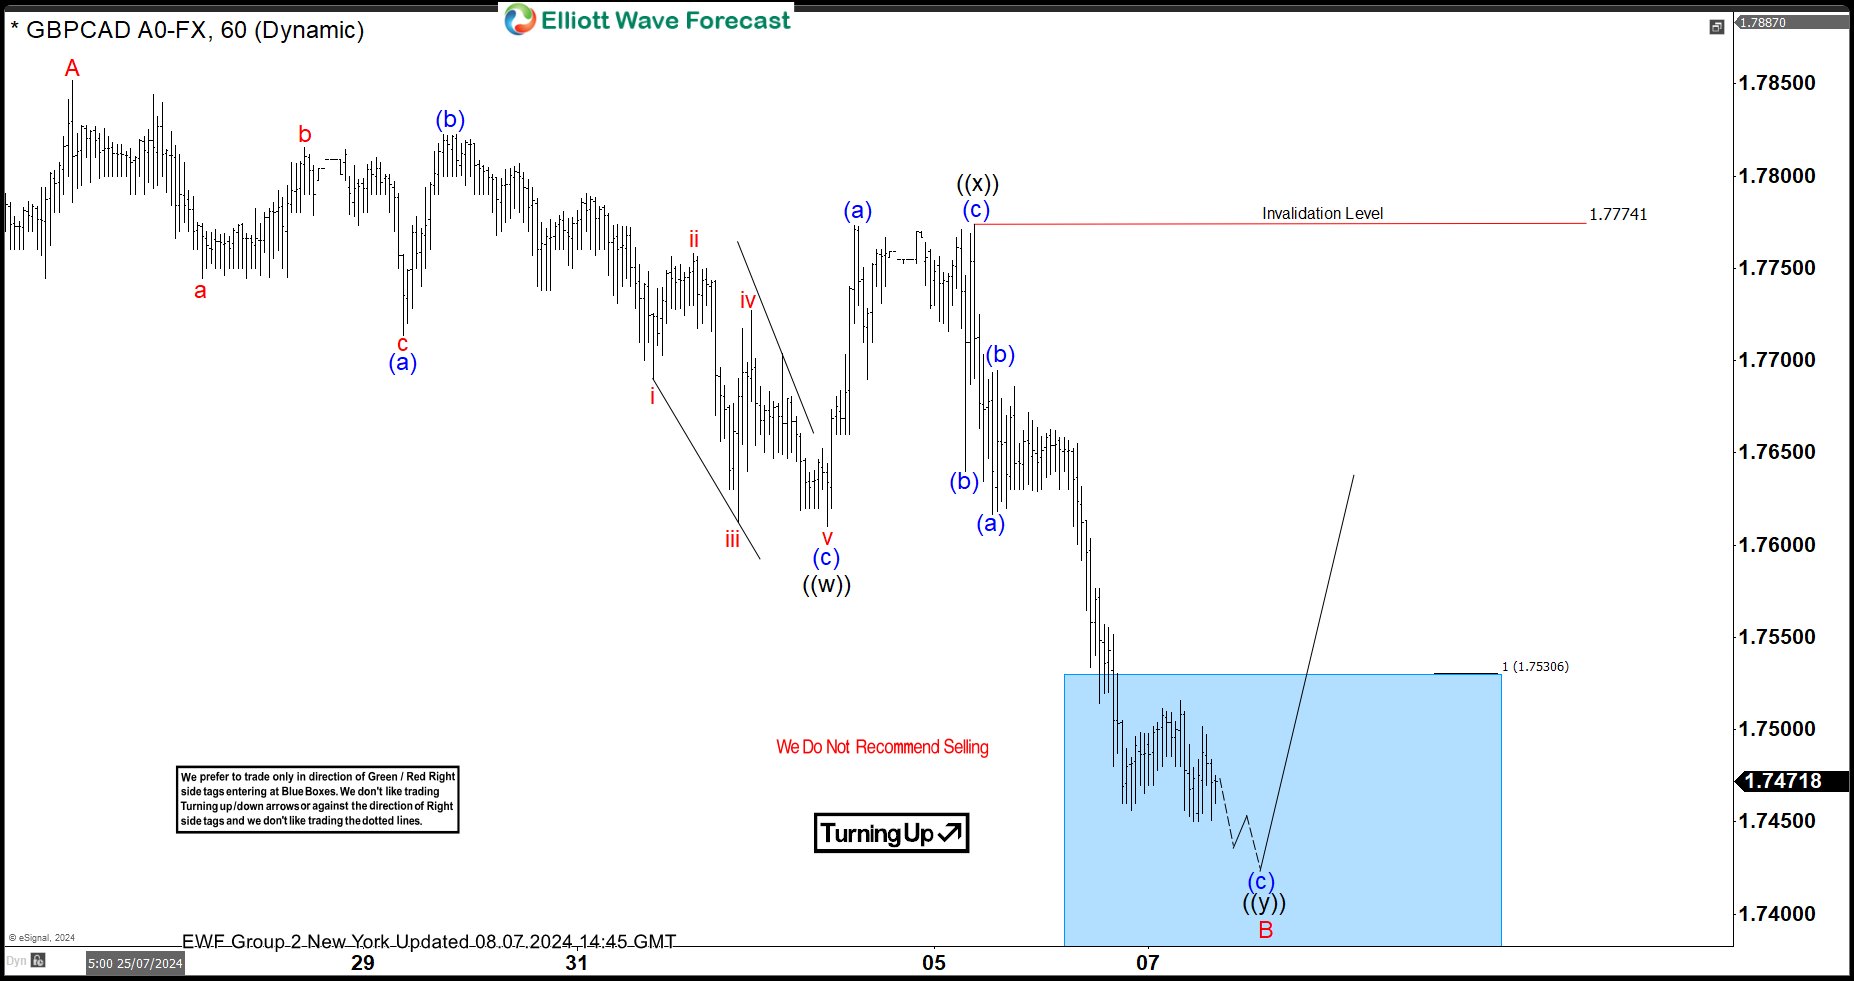
GBPCAD 1-Hour Elliott Wave Chart From 8.07.2024
Here’s the 1-hour Elliott wave Chart from the 8.07.2024 NY update. In which, the rally to 1.7852 high-ended wave A & made a pullback in wave B. The internals of that pullback unfolded as Elliott wave double correction where wave ((w)) ended in 3 swings at 1.7610 low. Then a bounce to 1.7773 high-ended wave ((x)) & started the next leg lower in wave ((y)) towards 1.7530- 1.7378 blue box area. From there, buyers were expected to appear looking for new highs ideally or for a 3-wave bounce minimum.
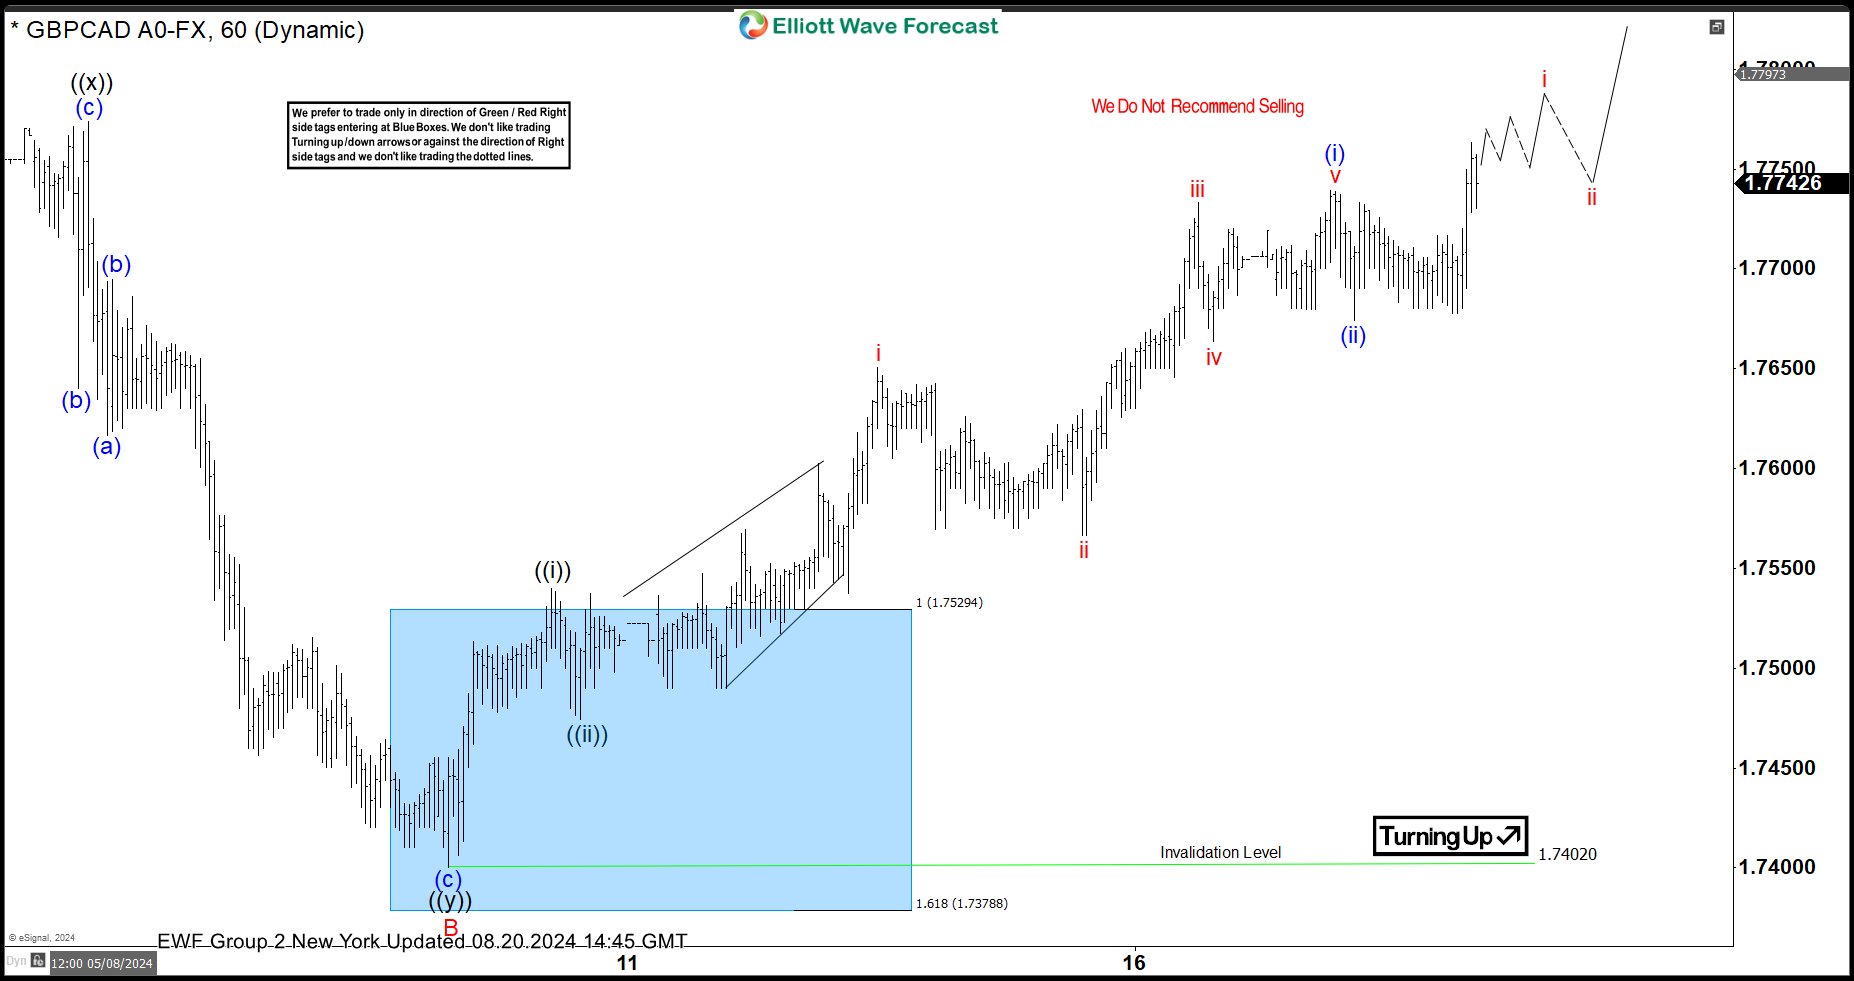
GBPCAD Latest 1-Hour Elliott Wave Chart From 8.20.2024
This is the latest 1-hour Elliott wave Chart from the 8.20.2024 NY update. In which the pair is showing a strong reaction higher taking place, right after ending the double correction within the blue box area. Allowed members to create a risk-free position shortly after taking the long position at the blue box area. However, a break above 1.7852 high is still needed to confirm the next extension higher & avoid deeper pullback.
Elliott Wave Analysis on EURUSD Impulsive Rally Favors the Bull Side
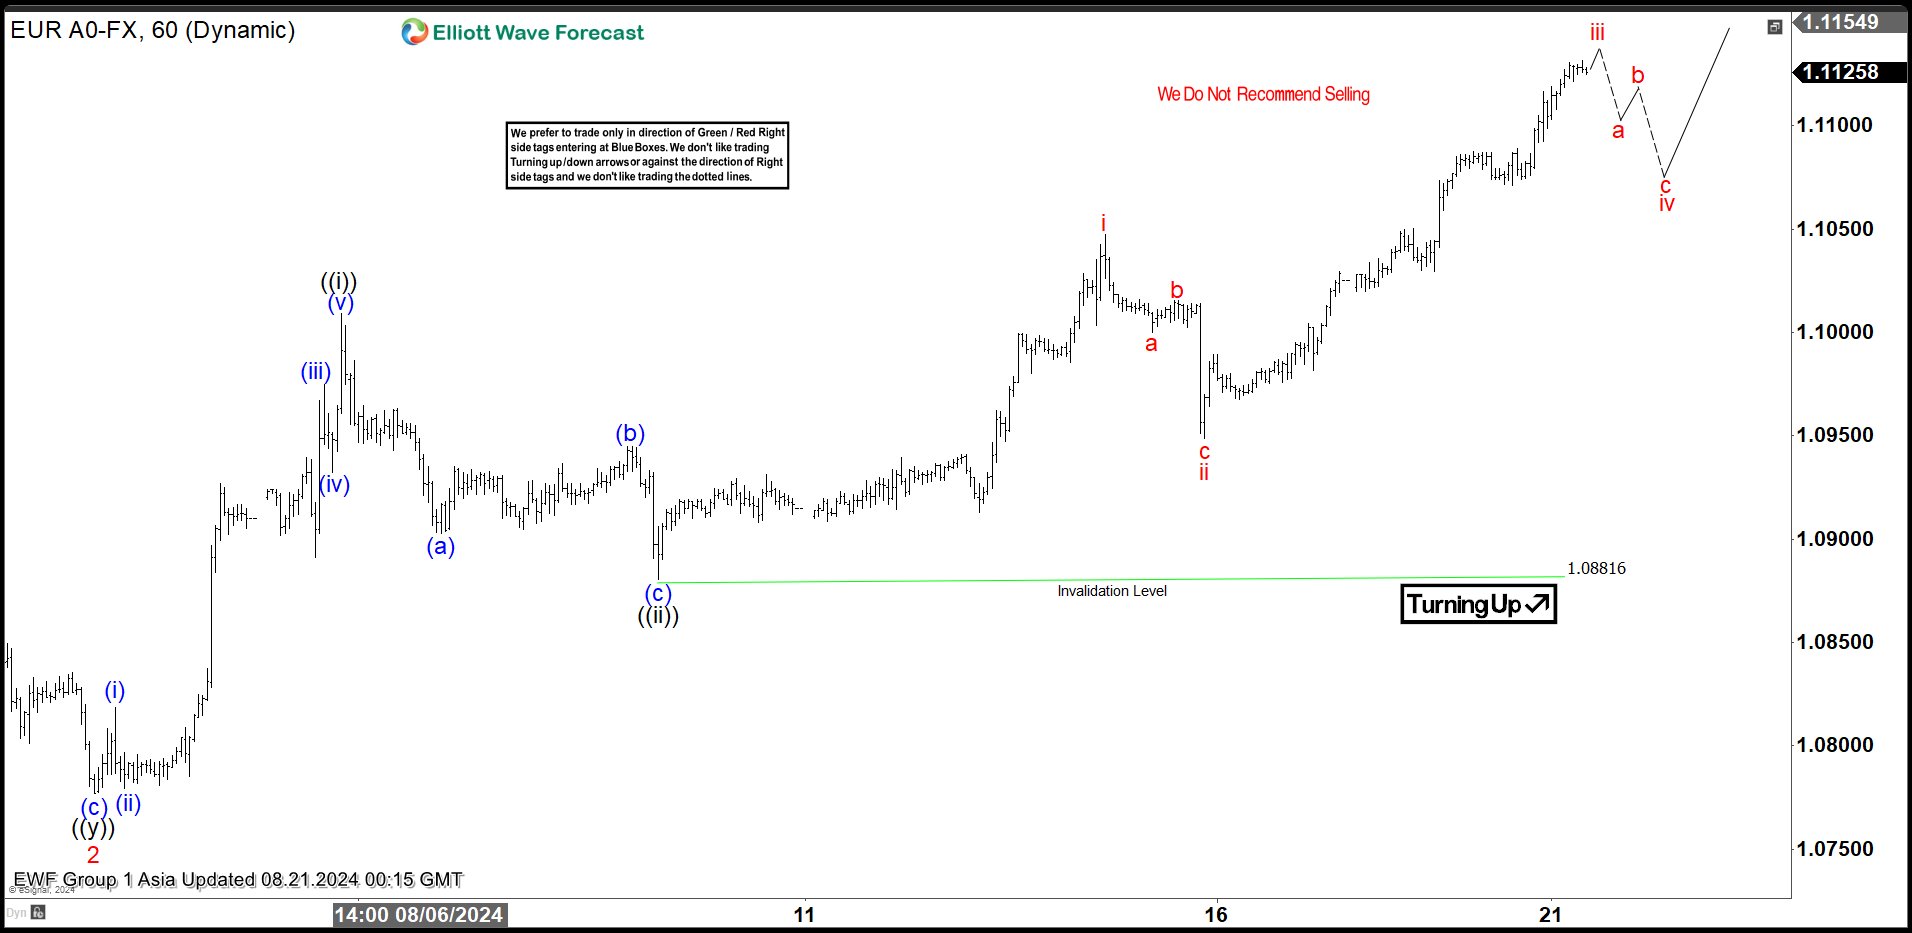
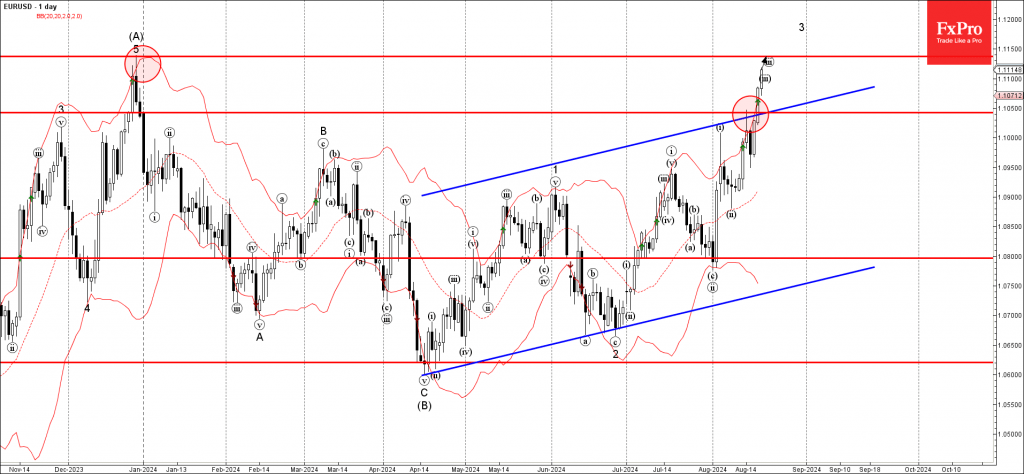
Short Term Elliott Wave View in EURUSD suggests that pair is close to form a bullish sequence. A break above the previous high on 12.28.2023 at 1.1139 suggests the next leg higher has started. Near term, rally from 6.26.2024 low is unfolding as a 5 waves impulsive structure. Up from 6.26.2024 low, wave 1 ended at 1.0948 and pullback in wave 2 ended at 1.0777. Pair has since turned higher in wave 3 which subdivides into another impulsive structure. Up from wave 2, wave ((i)) ended at 1.1 and pullback in wave ((ii)) ended at 1.088.
Pair has resumed higher in wave ((iii)). Up from wave ((ii)), wave i ended at 1.1047 and pullback in wave ii ended at 1.0948. Expect wave iii to end soon, and pair should then pullback in wave iv to correct cycle from 8.15.2024 low in 3, 7, 11 swing before it resumes higher again in wave v of (i). Near term, as far as pivot at 1.088 low stays intact, expect dips to find buyers in 3, 7, or 11 swing for further upside. Break above 12.28.2023 high at 1.1139, and more importantly above 7.17.2023 high at 1.1275 would confirm the bullish sequence and bullish trend.
EURUSD 60 Minutes Elliott Wave Chart
EURUSD Elliott Wave Video
https://www.youtube.com/watch?v=V48UScd1Q14
USDCHF Wave Analysis
- USDCHF reversed from resistance area
- Likely to fall to support level 0.8500
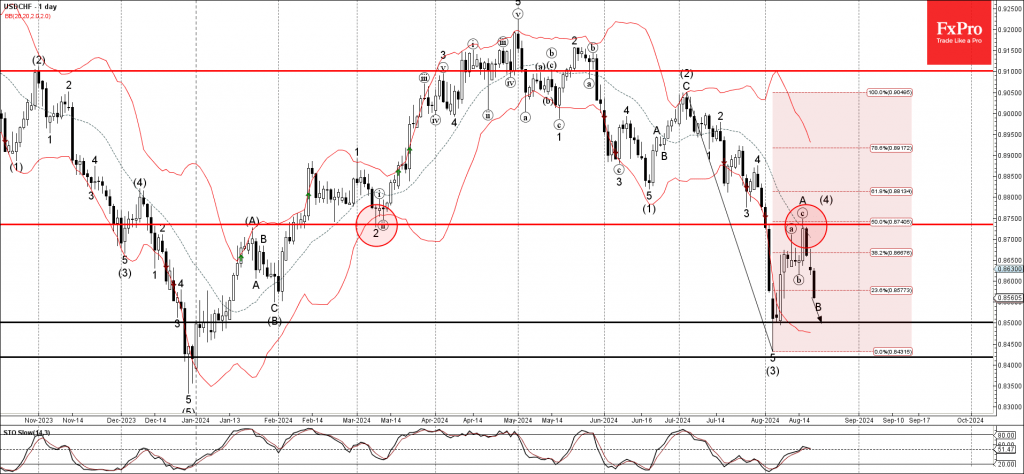
USDCHF currency pair recently reversed down from the resistance area set between the resistance level 0.8735 (former monthly low from March), 20-day moving average and the 50% Fibonacci correction of the downward impulse from the start of July.
The downward reversal from this resistance area started the active minor corrective wave B, which belongs to the ABC correction (4).
Given the widespread US dollar sales and multi-month downtrend, USDCHF currency pair can be expected to fall further toward the next support level 0.8500 (target for the completion of the active wave B).
EURUSD Wave Analysis
- EURUSD broke resistance area
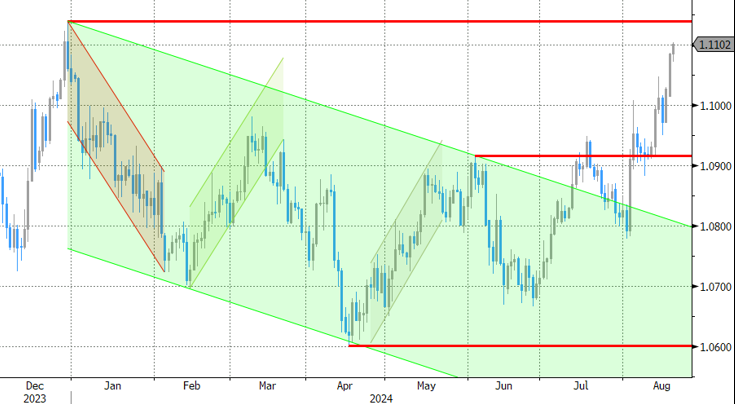
- Likely to rise to resistance level 1.1135
EURUSD currency pair just broke the resistance area located between the resistance level 1.105 (which reversed the price last week) and the resistance trendline of the daily up channel from the middle of April.
The breakout of this resistance area accelerated the active impulse waves iii and 3 – both of which belong to the impulse wave C from April.
Given the strongly bearish US dollar sentiment seen across the FX markets today, EURUSD currency pair can be expected to rise further toward the next resistance level 1.1135 (multi-month high from December) – from where the downward correction is likely.
USDJPY Weakens Amid Rate Cut Speculation
The USDJPY pair dipped near 146.50 as the US Dollar weakened, with markets anticipating Fed rate cuts starting in September. Japan's robust Q2 GDP growth has fueled expectations of more rate hikes by the BoJ. The pair remains within Monday’s range as investors await Fed Chair Jerome Powell’s speech at the Jackson Hole Symposium. The Yen's performance is driven by factors like BoJ policy, yield differentials, and broader market sentiment. BoJ decisions play a crucial role due to its mandate for currency control.
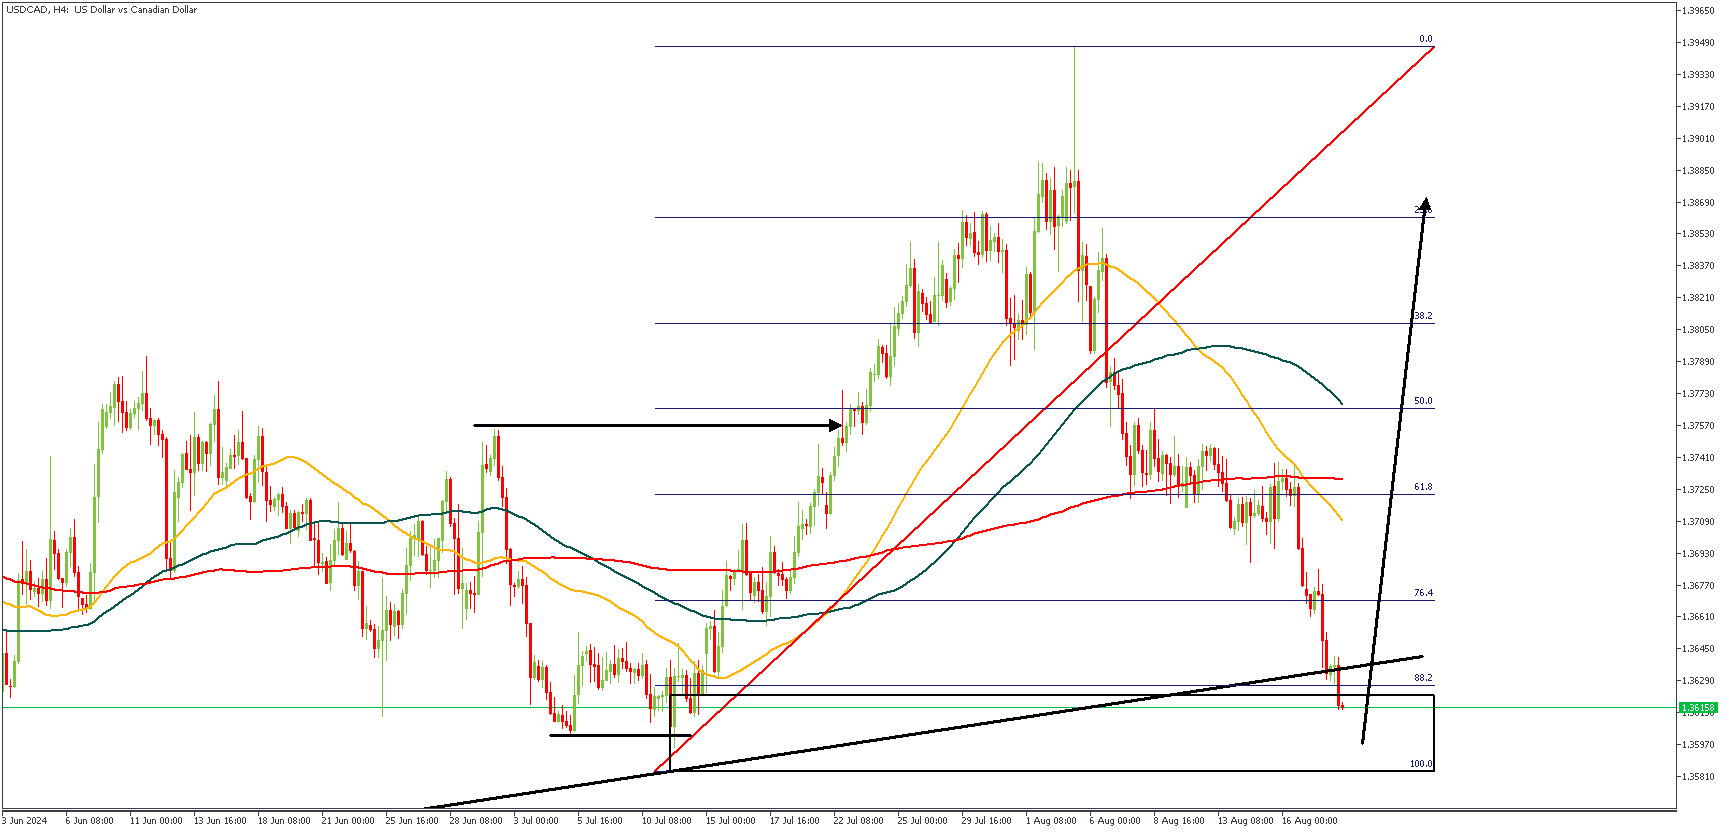
USDCAD – H4 Timeframe
USDCAD seems to be nearing the end of the bearish run, as we can see price currently stalling around the trendline support. Another notable factor at this area of interest is the drop-base-rally demand; as well as the SBR (Sweep-Break-Retest) price action pattern we have so discussed many times already. The 88% of the Fibonacci retracement lends the final piece that bring the bullish sentiment to life. As for my entry, though, the lower timeframe price action will be the judge.
Analyst’s Expectations:
- Direction: Bullish
- Target: 1.38850
- Invalidation: 1.35810
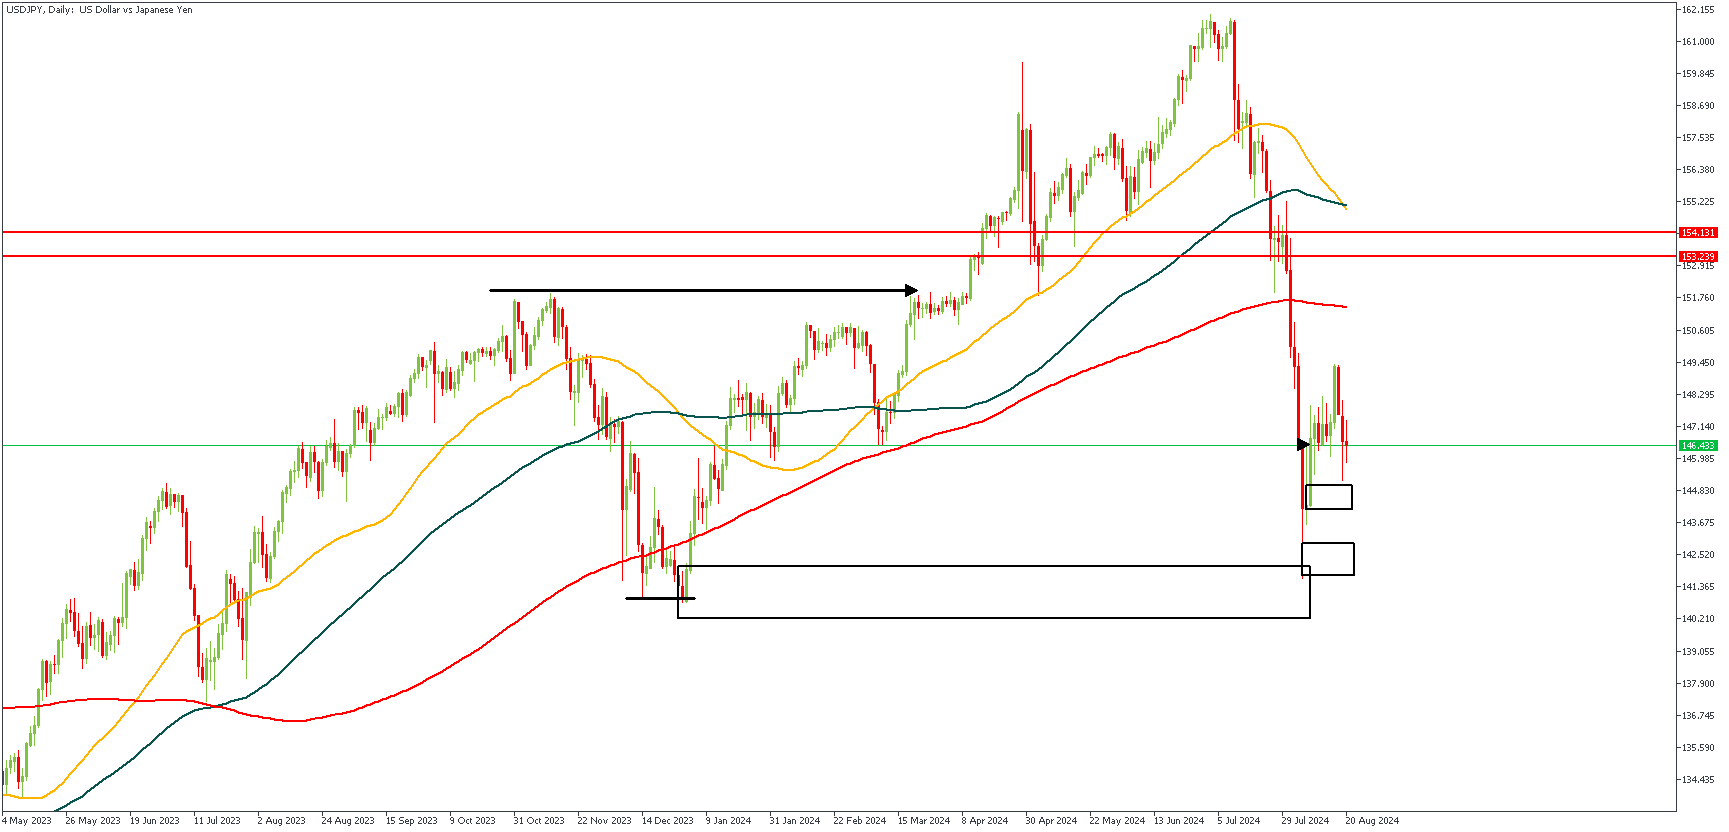
USDJPY – D1 Timeframe
The month-long bearish momentum on USDJPY might just be nearing its end. This sentiment is based off of the SBR price action pattern, the drop-base-rally demand zone, and the bullish array of the moving averages. Due to the lack of any more convincing confluence, I will be patiently waiting for a proper change-of-character of the lower timeframe price action before pulling the trigger for a bullish entry.
Analyst’s Expectations:
- Direction: Bullish
- Target: 153.239
- Invalidation: 141.600
Dollar on the Edge
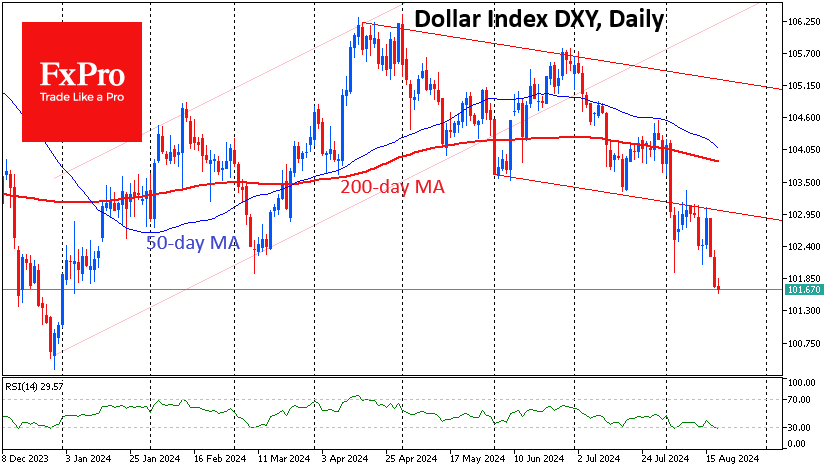
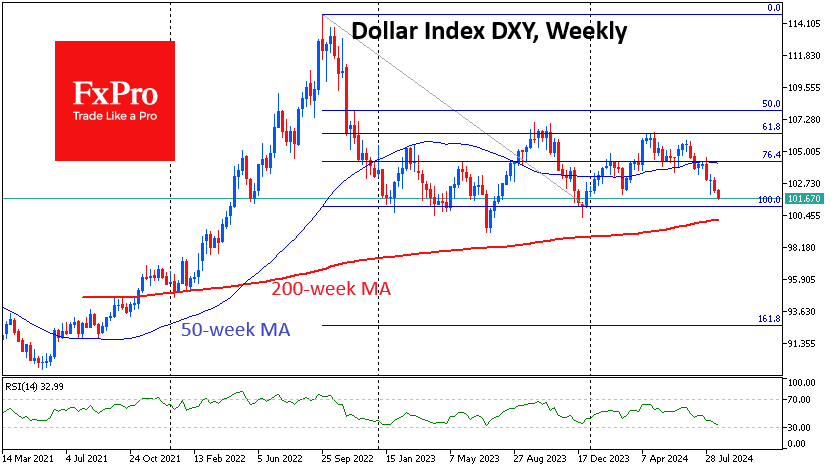
The US dollar has fallen to its lowest levels of the year, losing more than 2.3% from its August peak and around 4% since early July as expectations of a Fed rate cut in September began to be priced in.
The dollar index has retreated to 101.7, reflecting growing expectations of Fed easing. Although the ECB and the banks of Canada, England and New Zealand have already begun their easing cycle, the currency market historically reacts first to changes in US monetary policy and then to others.
Expectations of looser Fed policy in the coming quarters are also undermining the dollar’s position. In the first half of the year, the prevailing narrative was that lower inflation was allowing monetary policy normalisation to begin. In recent weeks, however, the narrative has shifted towards easing to stave off a recession.
The change in sentiment about the economic outlook sets the stage for further rate cuts in the coming quarters. The main scenario has a 60% probability of a cut of 100 basis points or more by the end of the year, including at least one cut of 50 basis points. This is a dramatic change from the 1.5% chance of such an outcome at the beginning of July.
From a technical perspective, the DXY Dollar Index is now near the lower end of its range from early 2023. This range doesn’t have a clear bottom, but dollar reversals to the upside from this point over the past 20 months have triggered corrections in equities, although they haven’t broken the bull market.
Technically, Powell could save the dollar at his Jackson Hole symposium later this week. However, there is an equal chance that his dovish tone, which observers are waiting for, will give the dollar carte blanche to weaken further and break long-term support.
In a bearish scenario, the next important milestone on the way down will be the 99.2-100.4 area (July and December 2023 lows), and the final target could be a pullback to the 90-92.6 area.
If Powell strips the markets of their illusions of a 100-point rate cut by the end of the year, with relatively neutral employment data and inflation at 3% (still above target), it will bring buyers back into the dollar. In such a scenario, we could see the DXY move back towards the upper end of the last two years’ range (106.2-107.0) before the end of the year.
Sunset Market Commentary
Markets
Markets took a breather today during the European session. The dollar (DXY) yesterday closed below 102 for the first time since early January and remains stuck there. The greenback even extends losses as US investors enter the market. European stock markets tread water after completely recovering from the early August meltdown. The same reasoning goes for US stock markets. Core bond yield, if any, slip further away with US Treasuries outperforming German Bunds. The waiting game ends tomorrow with the preliminary annual payrolls benchmark revision by the Bureau of Labour Statistics. Once a year, the BLS benchmarks the March payrolls level to the Quarterly Census of Employment and Wages which is based on state unemployment insurance tax records and covers nearly all US jobs. The QCEW was released back in June and suggested that US job growth in the year through March was likely less robust than indicated. Ballpark figures suggest a downward revision of about 60k/month on average. Some forecasts even go as wild as near 100k/month. In the 12 months through March, net job growth averaged 242k. One of the reasons why the BLS over the past year systematically overstated job growth has to do with the “birth-death model” of businesses they use to adjust data for the net number of businesses opening and closing. This doesn’t correlate that well with reality in the post-pandemic world. Anyway, tomorrow’s payrolls revision had over the past months been flagged as a potential gamechanger pushing markets and the Fed away from “higher for longer” into more outspoken rate cuts. The revision could suggest that the US labour market already tipped somewhere in H2 2023. With inflation printing more benign and making the real policy rate more restrictive, the Fed has more room to act to the second pillar of its dual mandate: aiming for maximum employment. Since the early August repositioning in US money markets, the BLS update likely lost market impact. From being a potential game changer to more of a confirmation. Nevertheless, any substantial (>50k/month) downward revision won’t go unnoticed and could tip markets more in the direction of a 50 bps rate cut lift-off at the September 18 FOMC meeting. Minutes of the July meeting (to be released tomorrow as well) could offer some counterweight to this aggressive market thinking. So far, Fed governors hinted at a 25 bps – if any at all – move with gradualism being the magic word.
News & Views
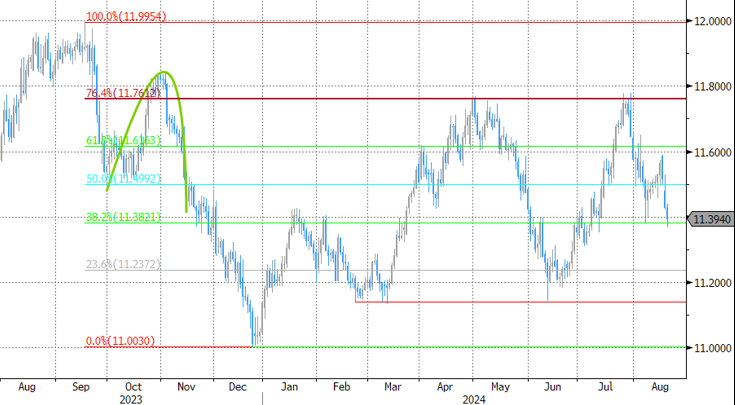
The Swedish Riksbank cut its policy rate again by 25 bps, to 3.5%, continuing the easing cycle it started in May. The RB sees inflation in the process of stabilizing at the target (CPIF inflation 1.7% Y/Y in July, core CPIF 2.2% Y/Y) while activity remains weak. Looking forward, indicators such as producer prices and company pricing plans, have continued to imply that inflationary pressures are compatible with the target. The risk of inflation becoming too high again has declined significantly. Information since the June Monetary Policy Report indicates that the growth outlook in Sweden and abroad is somewhat weaker than expected. In light of this, the RB assesses that the policy rate can be cut somewhat faster than indicated in June. If the inflation outlook remains the same, the policy rate can still be cut two or three more times this year. The RB mentions a weak koruna as a risk factor for inflation, but for now it isn’t a prohibitive factor to step up the pace of easing. The reaction on Swedish interest rate markets was limited (2-y swap 2.33%, +1.5 bps) as markets already discounted the RB policy rate near 2.75% at the end of the year. EUR/SEK even declined slightly to test the 11.40/38 support area as easing global market conditions currently support smaller currencies like the krone despite reduced interest rate support.
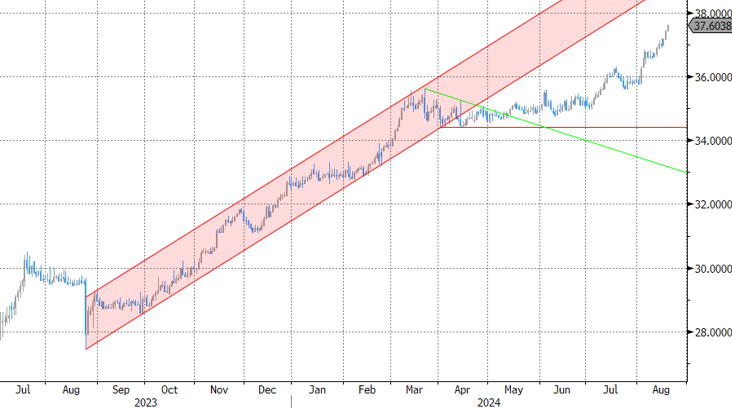
The Central Bank of Turkey (CBRT) kept its policy rate unchanged at 50% for the fifth consecutive month. The underlying trend of monthly inflation rose slightly in July but remained below its Q2 average (July headline inflation 3.23% M/M and 61.78M Y/Y). Q3 indicators suggest that domestic demand continues to slow down with a diminishing inflationary impact. While goods inflation is declining, improvement in services inflation is expected to lag. The Committee emphasized that the alignment of inflation expectations and pricing behavior with projections has gained relative importance for the disinflation process. Earlier this month, the CBRT kept its inflation forecasts for end-2024 and -2025 at 38% and 14% respectively. Analyst forecast see chances of the CBRT gradually reducing the policy rate in Q4. The lira weakens further today to trade at a new all-time low against the euro (EUR/TRY 37.60).
Graphs
EUR/SEK: krone loses interest rate support, but easing global conditions have bigger impact
EUR/USD: dollar weakness still prevails in run-up to this week’s big events, starting with BLS payrolls revision tomorrow
EUR/TRY: not even a 50% policy rate can stop the rot in the Turkish lira
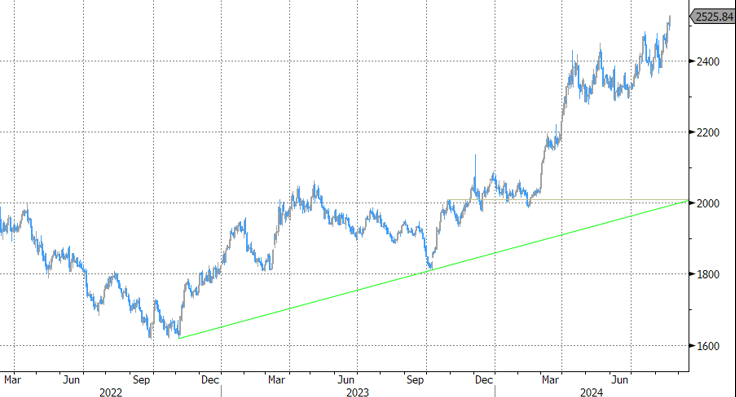
Gold: new all-time high as markets bet on aggressive Fed rate cuts to save the day
Canadian Inflation Eases Further Towards BoC’s Target
Headline CPI inflation edged lower in July to 2.5% year-on-year (y/y), right on consensus expectations. This was the lowest reading since March 2021.
The deceleration was driven by base year effects (lower price growth relative to last July) for items like travel tours (-2.8% y/y), passenger vehicles (-1.4% y/y) and electricity (-0.8% y/y).
Offsetting this was an increase in gasoline prices (+1.9% y/y and +2.4% on the month).
Shelter prices continue to keep overall inflation elevated (+5.7% y/y), with rent costs rising further (+8.5% y/y) and mortgage interest costs remaining in the stratosphere (+21.0% y/y). However, the pace of shelter inflation did ease in July from 6.2% y/y in June.
The Bank of Canada's preferred "core" inflation measures came in at 2.6% y/y in July, down from 2.7% y/y in June. On a three-month annualized basis, the average moved to 2.7% in July from 2.9% in June.
Key Implications
Canadian inflation continues to ease, with headline and core rates stabilizing around the mid-2% level. When stripping out the impact of shelter inflation, price growth is a meager 1.2% y/y. Looking forward, the downward impact of base effects will continue to support lower inflation next month, pushing the headline figure even further towards the BoC's target.
The BoC makes its next rate announcement in two weeks and there is nothing stopping the bank from cutting rates by another 25 basis points. With inflation risks fading, the central bank's focus has pivoted to weakness in the rest of the economy. Indeed, consumer spending looks to have taken a breather alongside a steady deterioration in the jobs market. Given that the policy rate remains at restrictive levels, even after two rate cuts in June/July, there is plenty of room for the BoC to keep cutting over the rest of this year.