
Sample Category Title
Brent Crude – Oil Slides Into Key Support as Geopolitical Risk Takes a Backseat
- Brent crude oil prices continue to fall amidst rumors of a Middle East deal and increased production in Libya.
- US crude stockpiles are expected to have decreased, and insights from the Jackson Hole symposium could impact oil prices.
- Technicals point to a key support are. Will we get a short term bounce in Oil prices?
Oil prices are continuing to fall in early European trading, approaching the August 5 low near the $75.00 mark. Brent crude experienced a drop of approximately 2.5% on Monday, fueled by rumors that a Middle East deal might be imminent.
On Monday, U.S. Secretary of State Antony Blinken announced that Israeli Prime Minister Benjamin Netanyahu had accepted a “bridging proposal” from Washington. This proposal aims to resolve disputes hindering a ceasefire agreement in Gaza, with Blinken urging Hamas to also come on board.
Last week’s analysis suggested that the potential for civil war in Libya could support oil prices. However, a recent Reuters report citing two engineers at the Sharara oilfield revealed that production has increased to about 85,000 barrels per day. This boost in production could alleviate concerns about supply disruptions and could be another factor contributing to the current decline in oil prices.
Last week’s trade and output numbers from China also appear to be on the minds of market participants. The print continued a growing trend of disappointing data from the world’s second largest economy.
Inventory Data and Jackson Hole
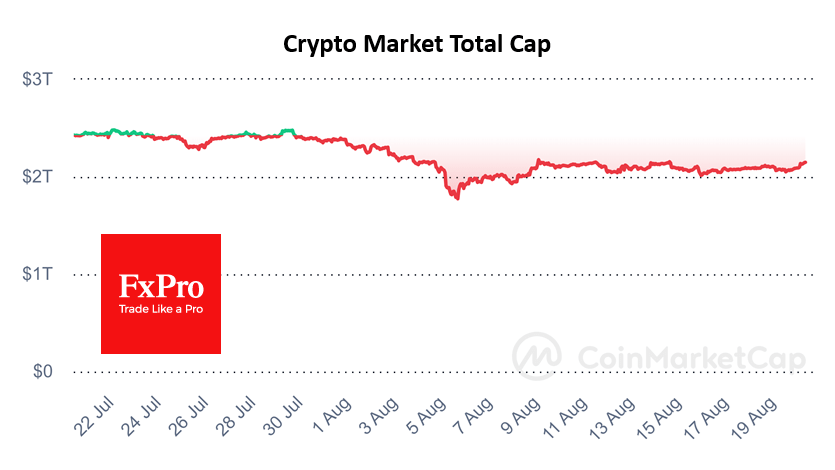
Oil inventory numbers will once again be in the spotlight, with a preliminary Reuters poll indicating that US crude stockpiles are expected to have decreased by 2.9 million barrels last week. However, given the significant discrepancy in last week’s data, the actual figures could differ substantially.
Later this week, the Jackson Hole symposium will capture the attention of global markets as Central Bank Governors from around the world convene. The most anticipated speech will be from Federal Reserve Chair Jerome Powell. Any insights on potential rate cuts from Powell could be viewed as a positive catalyst for oil prices.
Technical Analysis
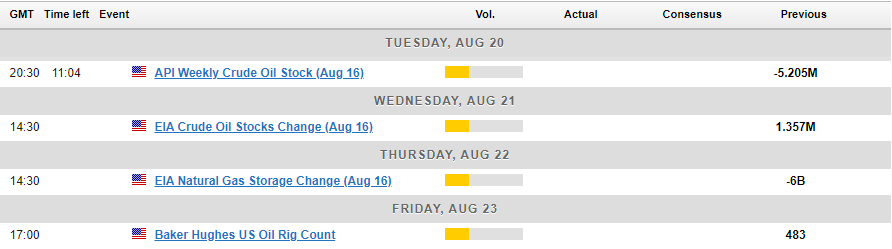
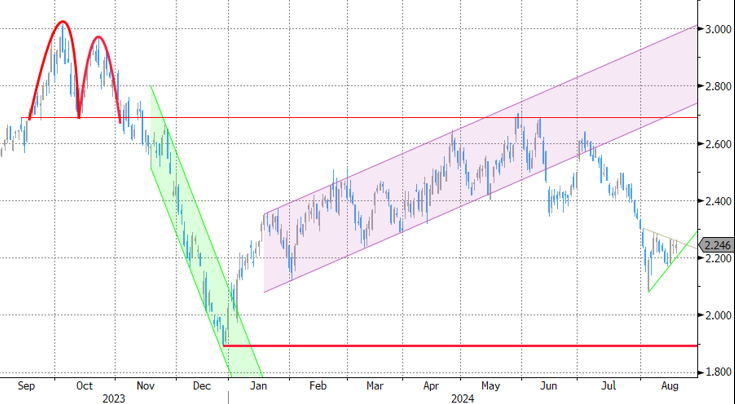
From a technical perspective, oil is currently trading within a crucial support zone extending down to the August 5 low around 75.83. This significant support area on the daily chart could present a formidable challenge to break.
Should oil prices bounce from this support zone, they may encounter resistance around 79.00 before targeting the psychological level of 80.00. At this juncture, the newly drawn trendline is likely to come into play, followed by the resistance area at 81.58.
Conversely, a decline from the current price may find support at 76.50 before testing last week’s lows at 75.83.
Source: TradingView (click to enlarge)
Support
- 76.50
- 75.83
- 75.00
Resistance
- 78.97
- 80.00
- 81.58
Australian Dollar’s Rally Runs Out of Steam
The Australian dollar has steadied after pummeling the US dollar over the past two sessions. AUD/USD is trading at 0.6729 in the European session, down 0.04% on the day at the time of writing.
RBA minutes: Rates will remain steady
The RBA minutes from the meeting earlier this month reiterated that interest rates aren’t expected to fall anytime soon. RBA members considered raising rates at the meeting but decided that the risks were better balanced by maintaining rates. The members expressed concern about the risk of higher inflation and said that a hike would have been justified if the risks to inflation had risen “materially”. The minutes stated that members considered a rate cut unlikely in the short term and that rates would likely have to remain at current levels for an “extended period”.
Governor RBA has expressed the same hawkish sentiment since the meeting, stating that it was unlikely that the central bank would lower rates in the next six months. The central bank has stuck to its “higher for longer” stance and has held the cash rate at 4.35% for seven straight times. The RBA isn’t about to change its tune, which is out of sync with the markets, which has priced in an initial rate cut in November.
China maintained its Loan Prime Rates at 3.35% for the one-year LPR and 3.85% for the five-year LRP. A month ago, China surprised the markets and lowered the LRP rates in a bid to kick-start the limping economy.
AUD/USD Technical
- There is resistance at 0.6761 and 0.6790
- 0.6706 and 0.6677 are the next support levels

EUR/USD Outlook: Bulls Hold Grip for Further Gains, Shallow Correction Likely to Precede Fresh Push Higher
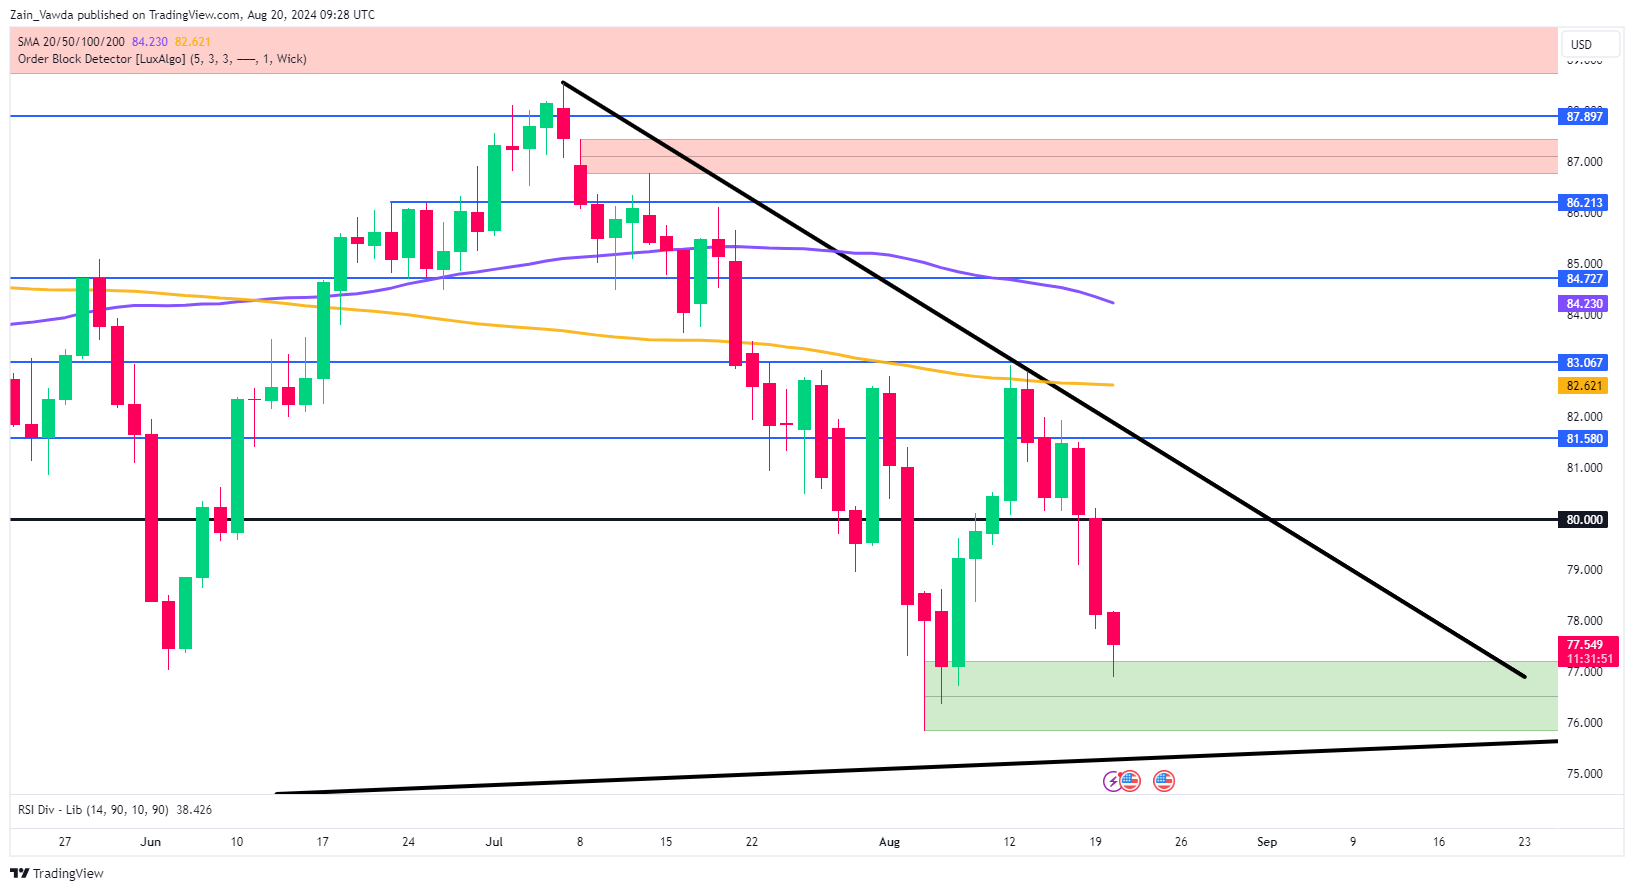
EURUSD ticked to new 2024 high (1.1088) on Tuesday, but bulls show signs of fatigue after strong rally in past two days.
Fundamentals remain supportive as Eurozone trade surplus strongly widened in June and inflation remained elevated in July, signaling further gains after correction.
Bullish daily studies contribute to positive outlook, but overbought conditions and momentum turning south from new highs warn that bulls might be running out of steam.
Dips should be ideally contained by supports at 1.1000/ 1.0985 zone (broken psychological barrier, reverted to support and daily Tenkan-sen) to keep larger bulls intact for acceleration through 1.1105 (55MMA), towards 1.1139 (Dec 2023 high), guarding 1.1220 (100MMA) and 1.1275 (2023 high).
Close above cracked 200WMA (1.1063) to generate fresh bullish signal.
Res: 1.1088; 1.1105; 1.1139; 1.1220.
Sup: 1.1063; 1.1021; 1.1000; 1.0985.
As Crypto Market Tests Resistance, Solana Eyes Support
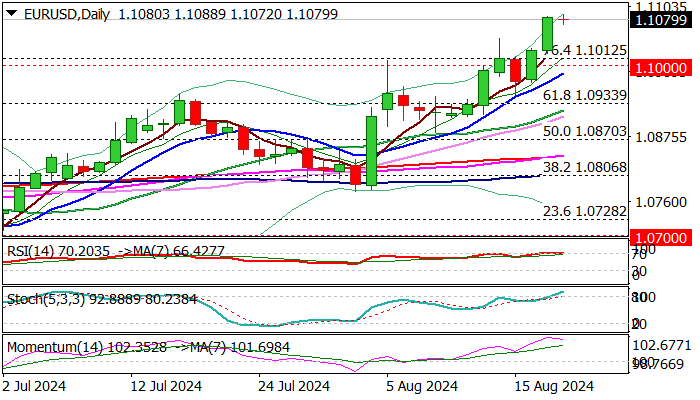
The cryptocurrency market is once again testing the important $2.15 trillion milestone, adding almost 4% in the last 24 hours. Selling pressure has been building near this level since early August. Now, thanks to the impressive recovery in stock indices, cryptocurrency buyers may feel more confident.
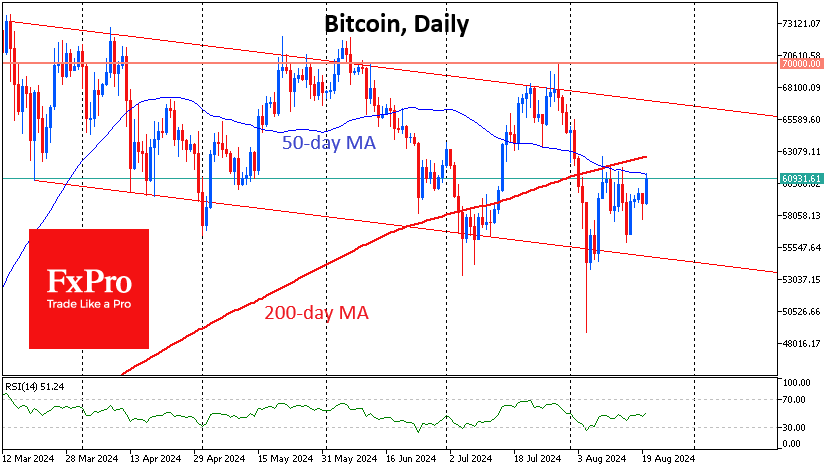
Bitcoin, having added 3.2% since the start of the day and around 4.5% in 24 hours, has once again come close to testing its 50-day moving average, trading just below $61.0K. Overcoming this resistance, from where Bitcoin has been selling off since 9 August, would take it to a test of its 200-day MA near $62.7K. A consolidation above these levels could dramatically improve sentiment in the entire cryptocurrency market and inspire more active buying.
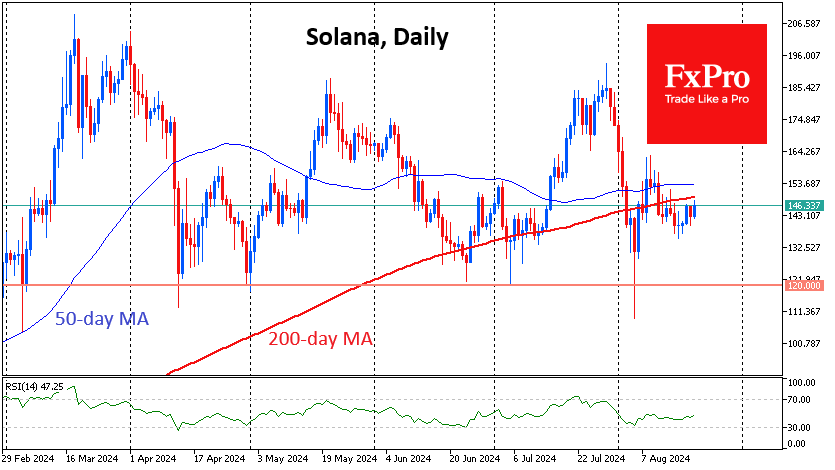
Solana is trading below its 50- and 200-day MAs and near the lower end of its trading range, squeezed by news of the SEC’s doubts about its security status. This reverses the chances that an ETF based on it will be approved soon. Technically, a consolidation under $130 will be an important signal of buyers’ capitulation.
News background
According to CoinShares, crypto fund investments rose by a paltry $30 million last week, following inflows of $176 million the week before. Bitcoin investments rose by $42 million, Ethereum by $4 million, while Solana was hit by a massive outflow of $39 million.
CoinShares noted that Solana is facing its largest outflow of funds amid a sharp decline in trading of the meme coins on which it relies heavily.
BlackRock’s cryptocurrency ETFs have outperformed Grayscale’s products in terms of total assets under management, according to Arkham Intelligence. Just two of BlackRock’s funds – IBIT and ETHA – reached $21.21 billion in AUM, making the largest asset manager the industry leader.
Investment firm Franklin Templeton has filed a Form S-1 with the SEC to launch the Franklin Crypto Index ETF, a combined bitcoin and Ethereum-based exchange-traded fund. Subject to regulatory approval, the firm may add other cryptocurrencies to the product in the future.
Despite Bitcoin falling by a third from its all-time high to its low on 5 August, 74% of coins have not sold or moved in the past six months, according to Glassnode. The holding trend is reducing the available supply, which will lead to higher prices as demand increases.
The Federal Reserve Board of Governors and the Treasury Department’s Financial Crimes Enforcement Network (FinCEN) have proposed amendments to the US Bank Secrecy Act to expand the definition of “money” to include cryptocurrencies and digital assets.
VanEck estimates that Bitcoin miners could generate about $13.9 billion in additional annual revenue by 2027 by shifting 20% of their energy capacity to the AI and high-performance computing sector.
Eurozone CPI finalized at 2.6% in Jul, core CPI at 2.9%
Eurozone CPI was finalized at 2.6% yoy in July, up from June's 2.5% yoy. CPI Core (ex-energy, food, alcohol & tobacco) was finalized at 2.9% yoy, unchanged from June's reading. The highest contribution to the annual inflation rate came from services (+1.82 percentage points, pp), followed by food, alcohol & tobacco (+0.45 pp), non-energy industrial goods (+0.19 pp) and energy (+0.12 pp).
EU CPI was finalized at 2.8% yoy, up from June's 2.6% yoy. The lowest annual rates were registered in Finland (0.5%), Latvia (0.8%) and Denmark (1.0%). The highest annual rates were recorded in Romania (5.8%), Belgium (5.4%) and Hungary (4.1%). Compared with June 2024, annual inflation fell in nine Member States, remained stable in four and rose in fourteen.
EURJPY’s Rebound Falters Ahead of 200-SMA
- EURJPY recovers from its 2024 low posted on August 6
- But the rebound stumbles before testing 200-day SMA
- Oscillators are skewed to the downside
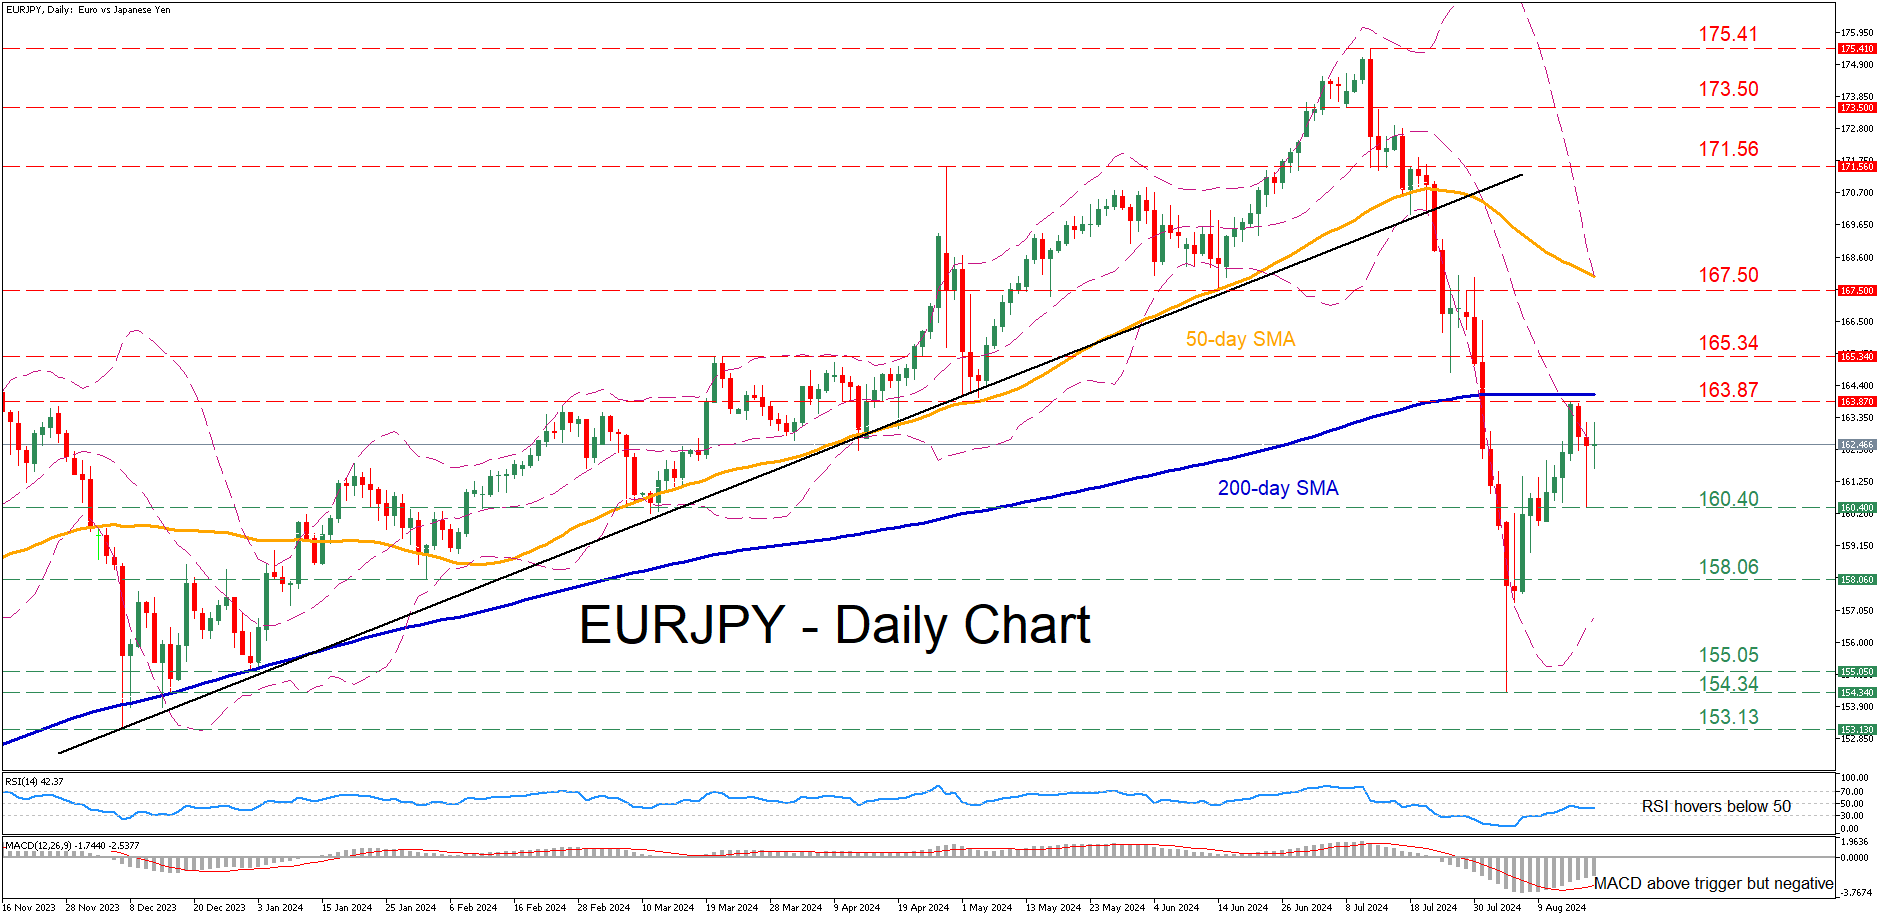
EURJPY experienced a vast selloff in July, dropping from a 32-year peak of 175.41 to as low as 154.34 on August 6, which is also the pair’s 2024 bottom. Since then, the pair has been in a recovery mode, but its rebound seems to have paused for now ahead of the 200-day simple moving average (SMA).
Should the bears attempt to erase the latest uptick, the recent support of 160.40 could prove to be the first obstacle for them to overcome. Further declines may then cease at the February low of 158.06. Failing to halt there, the price may challenge the January bottom of 155.05 ahead of the 2024 low of 154.34, registered on August 6.
Alternatively, if the rebound resumes, initial resistance could be found at the recent rejection region of 163.87, which lies very close to the 200-day SMA. A break above that zone could open the door for the March resistance of 165.34. Conquering this barricade, the bulls might attack the June support of 167.50, which could serve as resistance in the future.
In brief, EURJPY has been attempting to erase its recent slump, but its efforts have met strong resistance near the 200-day SMA. Hence, a break above that crucial hurdle is needed for the bulls to regain confidence for a full-scale recovery.
Pound Near July Highs: What Could Trigger a Breakout?
The slowdown in U.S. inflation and a cooling labour market have rekindled investor confidence that the Federal Reserve may soon begin cutting interest rates. As bearish sentiment towards the dollar dominates the market, key currency pairs have approached critical levels, the breach of which could spark new medium-term trends.
GBP/USD
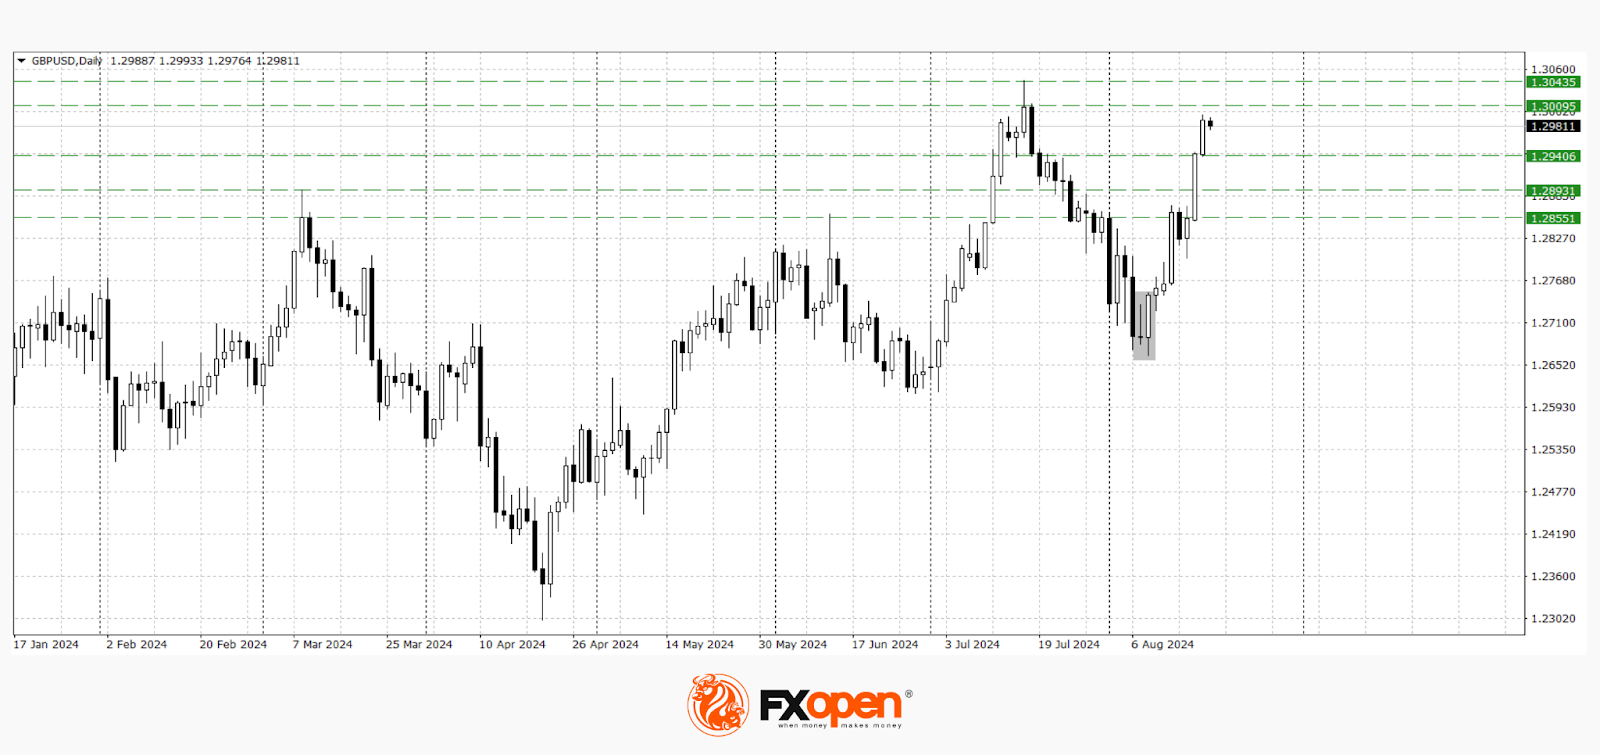
Technical analysis of GBP/USD suggests the possibility of a retest of the July high at 1.3050, as a strong upward momentum has developed on the daily timeframe following a bullish engulfing pattern. If buyers manage to secure a hold above 1.3000, the price could extend towards last year's highs around 1.3140-1.3100. Conversely, a rejection from 1.3000 might lead to a corrective decline towards 1.2900-1.2800.
Key events for GBP/USD pricing include:
- Today at 20:35 (GMT +3:00): Speech by FOMC member Bostic
- Tomorrow at 09:00 (GMT +3:00): UK Public Sector Net Borrowing data
- Tomorrow at 21:00 (GMT +3:00): FOMC meeting minutes release
GBP/JPY
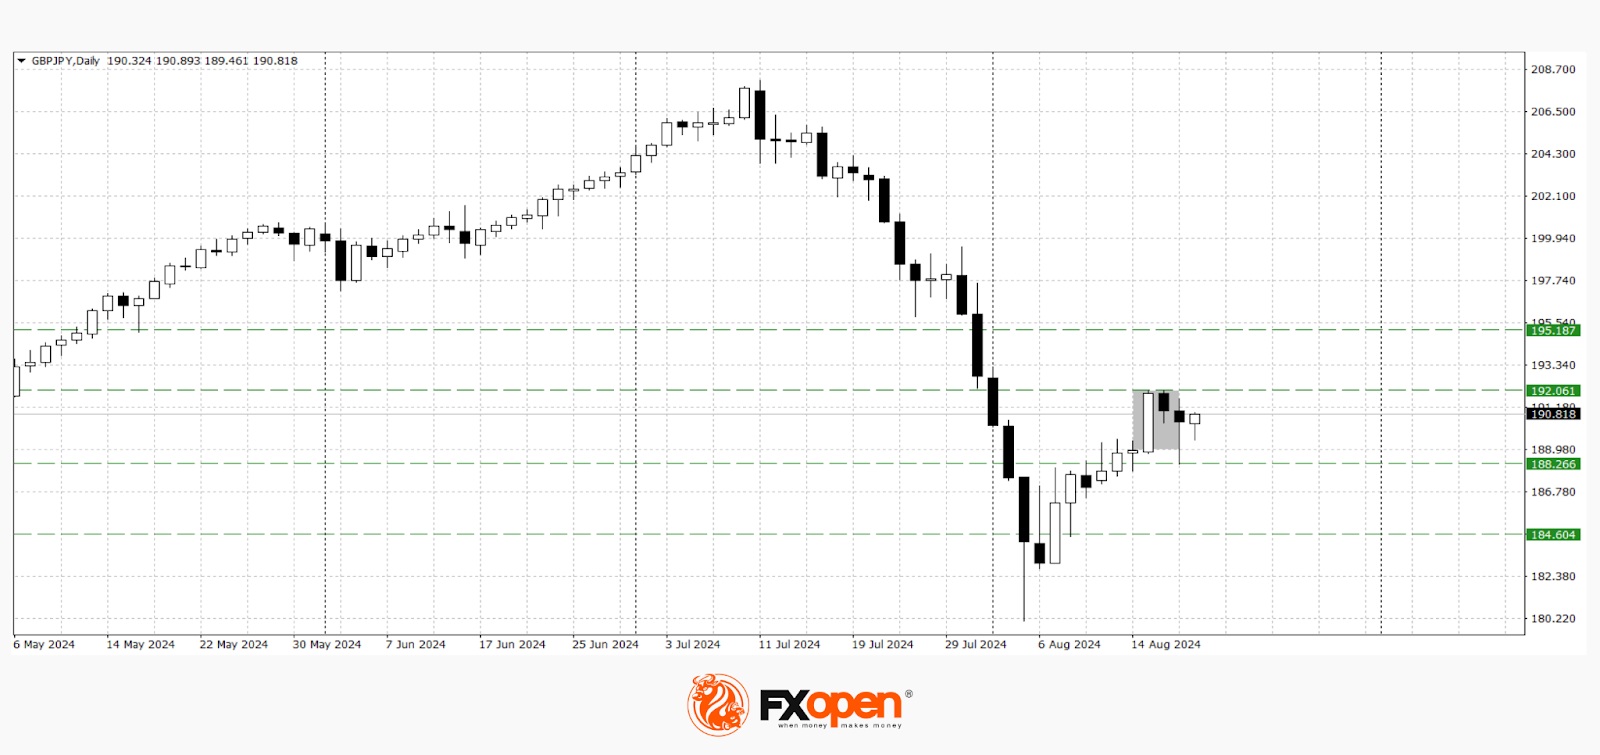
Volatility in yen pairs remains high. After a sharp rise in July, yen sellers have managed to regain some losses. Technical analysis of GBP/JPY indicates the potential for further decline, as a bearish harami pattern has formed following a bounce from 192.00. If yesterday's low at 188.30 is breached, the downtrend may continue towards 186.00-184.00. Should the price rise above 192.00, a deeper upward correction is possible.
Key news impacting GBP/JPY includes:
- Tomorrow at 02:50 (GMT +3:00): Japan’s Trade Balance (seasonally adjusted)
- Tomorrow at 02:50 (GMT +3:00): Japan’s Import and Export figures for July
GBPUSD Awaits Strong Resistance Near 1-Year High
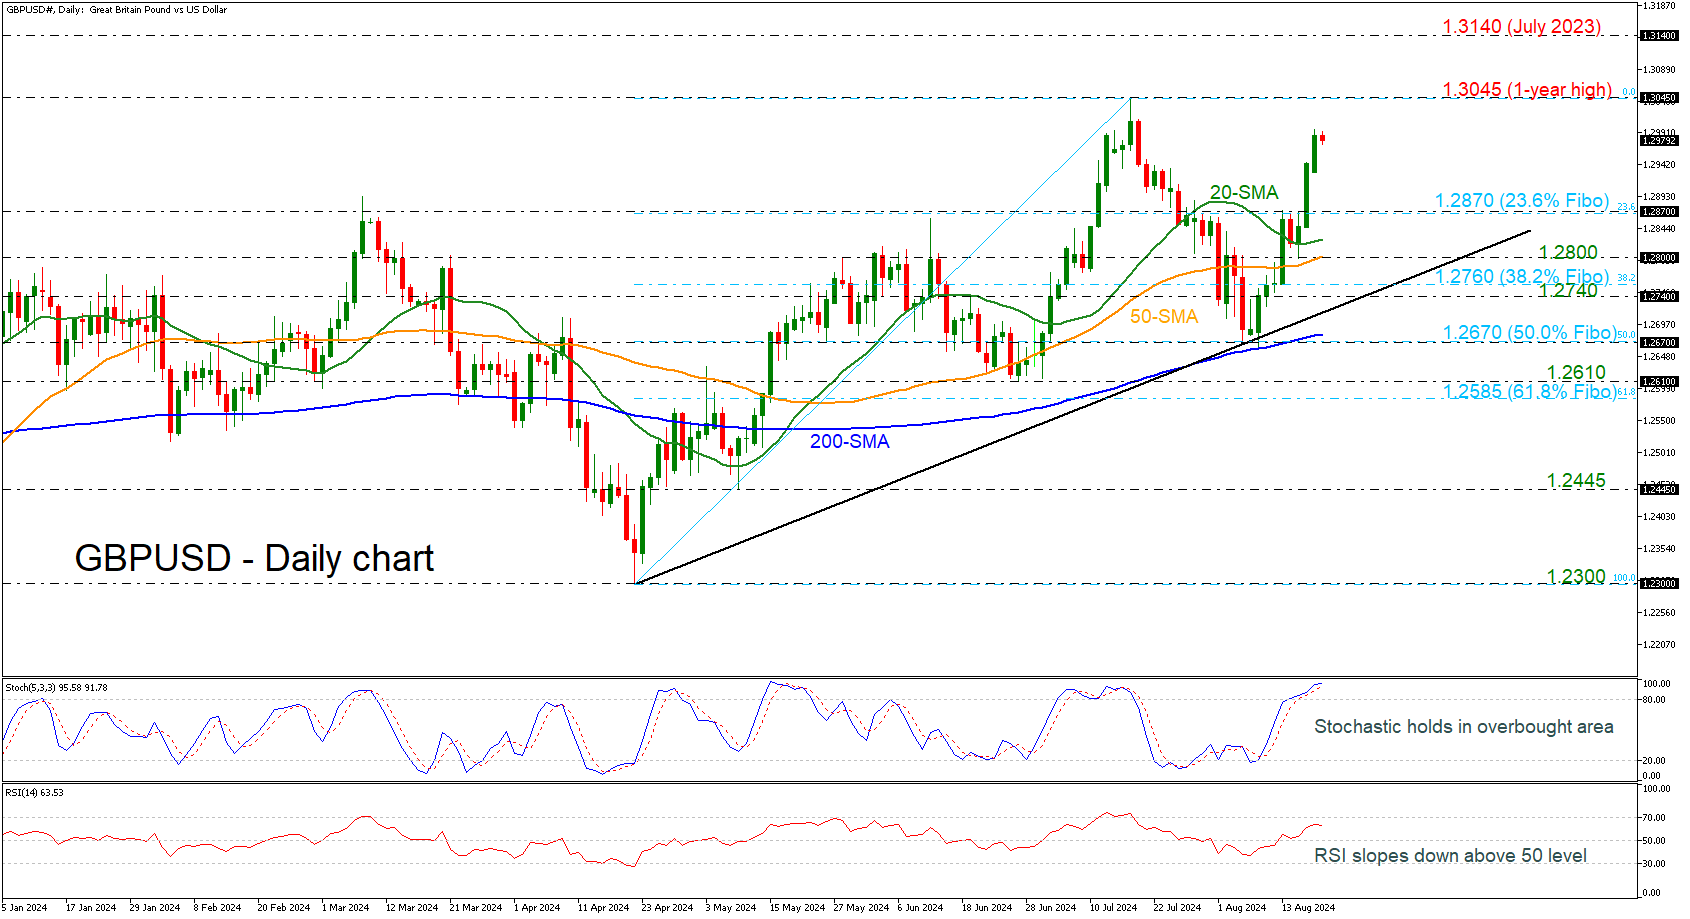
- GBPUSD’s rebound off 200-day SMA still holds
- Stochastic in overbought area
- RSI ticks south above 50 level
GBPUSD continues last week's rebound off the 200-day SMA and the 50.0% Fibonacci retracement level of the up leg from 1.2300 to 1.3045 at 1.2670, but with some weakness today. The intraday bias looks neutral to negative, as the stochastic is still standing above the 80 level but is losing some steam, while the RSI, although above 50, seems to be making its way down.
If the pair manages to head higher, the one-year high of 1.3045 could serve as a trigger point for steeper bullish action. Further north, cable could run toward the 1.3140 level, a strong barrier from last year.
However, if the pair reverses to the downside, investors could move first at the 23.6% Fibonacci of 1.2870 before meeting the 20- and then the 50-day simple moving averages (SMAs) at 1.2825 and 1.2800 respectively. If the price continues to drop, support could next come somewhere between the uptrend line and the 38.2% Fibonacci of 1.2760.
In the medium-term picture, the bounce off 1.2300 turned the outlook from neutral to bullish. Chances for another bullish move are still rising as the 200-day SMA keeps rising.
A Softer Dollar Remains the Way to Go
Market Commentary
Markets
Last week’s directional moves on key markets were extended yesterday in absence of any guidance coming from eco data or central bankers. Core bond yields fail to recover from the early August setback with daily changes in the US ranging between -1.8 bps (30-yr) and +1.6 bps (2-yr). German yields closed almost unchanged. Especially US money markets keep banking on significant Fed rate cuts to come. Apart from the magnitude of the lift-off (25 bps being our preferred scenario), especially the 2025 path will be challenged in the updated September FOMC dot plot. Markets currently discount a 3.25% policy rate by the end of 2025 compared with a median Fed view of 4%-4.25% back in June. Aggressive rate cut bets keep the dollar in the defensive. EUR/USD yesterday closed at its best level YTD (1.1085 from 1.1014) with resistance levels lining up: 1.1139 (December top) and 1.1276 (2023 top). A softer dollar remains the way to go. The less restrictive monetary policy where money markets are hoping for should help accommodate the US soft landing and especially rule out the downside recession risk. It’s what helped US stock markets stage an impressive comeback since the August 5 market meltdown. Key benchmarks yesterday rallied another 0.6% (Dow) to 1.4% (Nasdaq), lifting them to this month’s best levels. On commodity markets, gold closed at an all-time high of $2548.3/ounce. Brent crude remains under selling pressure ($77/b) both because of global demand concerns and as the US indicated that Israel accepted a cease-fire proposal in Gaza.
Asian stock markets join yesterday’s positive momentum with China underperforming. Chinese banks kept their benchmark lending rates unchanged (1y: 3.35% & 5y: 3.85%) after cutting them by 10 bps each only a month ago. ECB governing council member Rehn said that the recent increase in negative EMU growth risks reinforced the case for a September policy rate cut (provided that disinflation remains on track). He sees no clear signs of a pick-up in the manufacturing sector even though the energy cost drivers seem to have largely faded away. Today’s eco calendar remains extremely thin with only final July EMU CPI data on tap. The Swedish Riksbank is expected to lower its policy rate for a 2nd time by 25 bps (to 3.5%) with the Turkish central bank forecast to hold rates steady at 50%.
News & Views
The NY Fed’s SCE labour market survey showed a mixed picture. It recorded a sharp increase in the proportion of job seekers compared to a year ago. Among those employed four months ago, 88% were still with the same employer, a low since the start of the series in July2014 as the transition rate rose sharply. Looking forward, the expected likelihood of moving to a new employer increased to 11.6% from 10.6% in July 2023. At the same time, the average expected likelihood of becoming unemployed rose to 4.4% from 3.9% also a new high. Satisfaction with wage compensation as well as with nonwage benefits and promotion opportunities all deteriorated. Conditional on expecting an offer, the average expected annual salary of job offers in the next four months declined to $65,272 from $67,416, though it remains significantly higher than pre-pandemic levels. The average reservation wage—the lowest wage respondents would be willing to accept for a new job—increased to $81,147 from $78,645. The average expected likelihood of working beyond age 62 increased to 48.3% from 47.7. The average expected likelihood of working beyond age 67 increased to 34.2% from 32.
The Minutes of the 5-6 August meeting of the Reserve bank of Australia showed that the central bank discussed a further rate hike, but concluded that the stronger case was for leaving the policy rate unchanged at 4.35%. Members noted that developments over preceding months supported the view that inflation would be slow to decline. Underlying inflation had fallen very little over the prior year in quarterly terms and inflation was still some way above target. Members also saw the gap between aggregate demand and supply being somewhat larger than previously assessed. Holding the cash rate target steady at its current level for a longer period than currently implied by market pricing may be sufficient to return inflation to target in a reasonable timeframe. The Board will need to reassess this at future meetings. Still it guided that it was not possible to either rule in or rule out future changes in the cash rate target.
Graphs
GE 10y yield
The ECB cut policy rates by 25 bps in June. Stubborn inflation (core, services) make follow-up moves less evident. Markets nevertheless price in two to three more cuts for 2024 as disappointing US and unconvincing EMU activity data rolled in, dragging the long end of the curve down. The move accelerated during the early August market meltdown.
US 10y yield
The Fed in its July meeting paved the way for a first cut in September. It turned attentive to risks to the both sides of its dual mandate as the economy is continuing to move better in to balance. Money markets tend to err in favour of a 50 bps lift-off. The pivot weakened the technical picture in US yields with another batch of weak eco data pushing the 10-yr sub 4%.
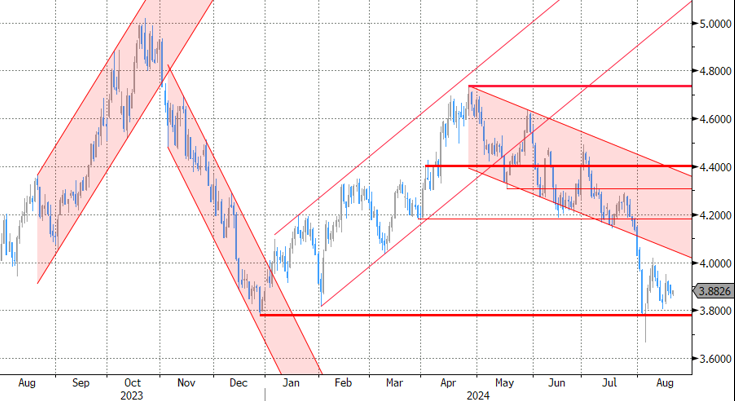
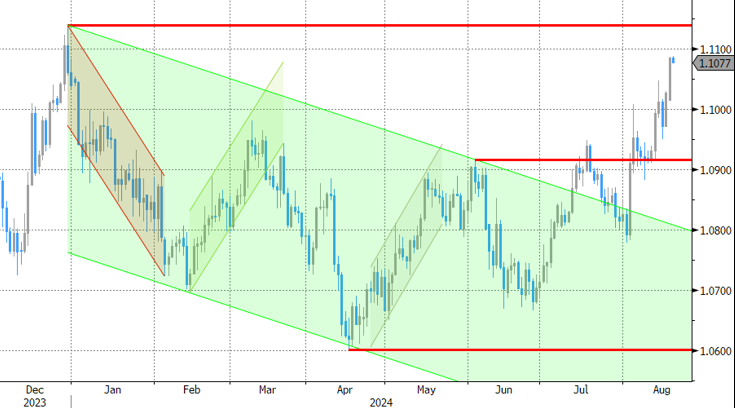
EUR/USD
EUR/USD moved above the 1.09 resistance area as the dollar lost interest rate support at stealth pace. US recession risks and bets on fast and large (50 bps) rate cuts trumped traditional safe haven flows into USD. EUR/USD 1.1139 (Dec 2023 high) and 1.1276 (2023 top) serve as next technical references.
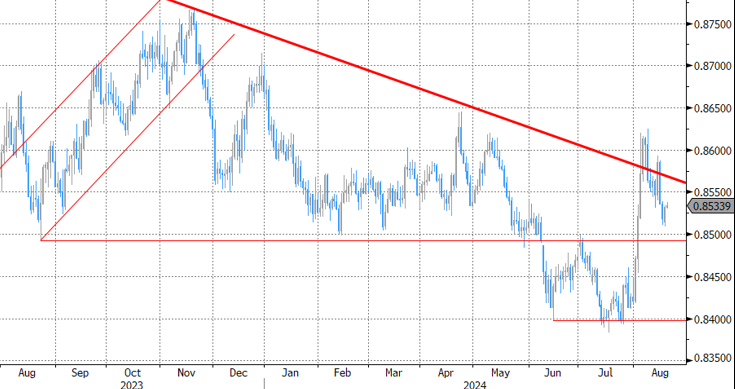
EUR/GBP
The BoE delivered a hawkish cut in August. Policy restrictiveness will be further unwound gradually 0on a pace determined by a broad range of data. The strategy similar to the ECB’s balances out EUR/GBP in a monetary perspective. Risk-off proved a more important driver of GBP recently, triggering a return from 0.84 towards 0.86.
The Sweet Soft-Landing Spot
The week kicked off on a positive note on expectation that when Federal Reserve (Fed) Chair Jerome Powell speaks at the Jackson Hole meeting on Friday, he will deliver a strong hint that the rate cuts will begin soon in the US. How soon ? Probably in September? By how much? Probably a reasonable 25bp? Would the markets be upset with the idea of a 25bp cut instead of a 50bp? Probably not, because a 50bp cut would require a severe economic slowdown, a crisis or a panic mode, which is not good for risk appetite. Therefore, the best of both worlds would be the hint of a 25bp cut that would keep the market mood in the sweet soft-landing spot. And this is what investors hope to hear.
And that hope has pushed the S&P500 up for the 8th straight session on Monday. The index added another 1% yesterday and is now just 1% below its ATH level. Nasdaq 100 jumped 1.30% and above its 50-DMA for the first time in almost more than a month. Roundhill’s Magnificent 7 ETF advanced more than 1.60% while the Russell 2000 gained 1.20%. In summary, both the Big Tech and small companies in the US gained with the thought of an approaching rate cut in the US. Even the energy stocks had a good session despite a heavy selloff in crude oil, which was triggered by the news that Israel accepted a ceasefire proposal in Gaza if Gaza says yes. US crude fell more than 2.5% to below $75pb yesterday and remains under pressure this morning but could – once the geopolitical factors are priced in – see the support of the Fed optimism and rebound back to $78/80pb range. Zooming out, what I want to say is that both the big and small stocks gained yesterday, and the S&P500’s equal-weighted index neared an ATH level as the market rally of today isn’t boosted by AI – but by the Fed expectations – and the latter benefit to other sectors than only the ones that see the direct benefits of AI investments.
AMD steps up efforts to offer something more than just, chips
AMD announced to buy ZT Systems to increase ‘its capabilities and expertise to optimise solutions at the systems, rack and the data center levels’ because customers no longer want only chips, but it want ready-to-use AI solutions - a thing that Nvidia does better than the rivals with its ecosystem and the others should improve at. AMD plans to sell ZT System’s data center infrastructure manufacturing unit and keep its system-design business and hope to compete with Nvidia in offering fast and at-scale AI solutions. AMD jumped 4.5%.
The news didn’t tame appetite for Nvidia, which also rallied more than 4% and closed the session at $130 per share. Even Intel gained yesterday.
Overall, the chipmakers are doing better now than a month ago, but the Fed optimism should enhance rotation toward the non-tech pockets of the market that were left behind over the past year-and-a-half and provide only a limited upside potential to the Big Tech.
Elsewhere
The European Stoxx 600 also opened the ween on a positive note and jumped above the 50 and 100-DMA, and the Japanese Nikkei 225 is better bid today after a moody Monday on a yen rebound. I expect the market mood to remain mainly optimistic into the Jackson Hole meeting with no major data points to hamper optimism. We will have a glance on the European and Canadian inflation numbers today, FOMC minutes tomorrow and flash manufacturing numbers for August on Thursday. I guess that the US weekly jobless claims will also be watched more seriously than usual, but all in all there should be nothing major to change the week’s focus until the Powell speaks.
The US dollar remains weak – too weak – into that speech, the EURUSD consolidates gains near 1.1080 before today’s CPI read and Cable tests the 1.30 offers supported by relatively strong fundamentals. The UK has been the best performing economy among major peers in the first half of the year. Despite political shenanigans, the Brexit pain and the cost-of-living crisis, the British economy grew more than its major peers in the first two quarters of the year – even better than the US. Germany has ranked at the bottom of the range after France and Italy. And the surprisingly good performance of the British economy keeps the Bank of England (BoE) doves more contained than their Fed peers, and gives support to the pound against the greenback. But again, I still think that the US dollar’s weakness has gone a bit too far and we shall see some downside correction before an eventual rise above the 1.30 mark. If nothing, the US economy is doing better than most peers and that alone should give the Fed doves less reason to believe that the Fed will cut more than the peers in the coming months.
Still in the UK, while the British economy and Cable outperformed peers over the past months, the British blue-chip index, the FTSE 100 – which is more concerned about the global economic health than the UK’s own matters due to its high exposure to energy – didn’t do better than the others. But the energy-heavy index should continue to see the benefits of reflation flows, if the rate cuts start while we are still in the soft-landing zone.