

Sample Category Title
USD/CAD Mid-Day Outlook
Daily Pivots: (S1) 1.3614; (P) 1.3650; (R1) 1.3670; More...
USD/CAD's fall from 1.3946 is still in progress and intraday bias stays on the downside for 1.3588 structural support. Strong support could be seen from there to bring reversal. On the upside, above 1.3684 will turn intraday bias back to the upside for stronger rebound. However, decisive break of 1.3588 will argue that rise from 1.3176 has completed and target 1.3477 support next.
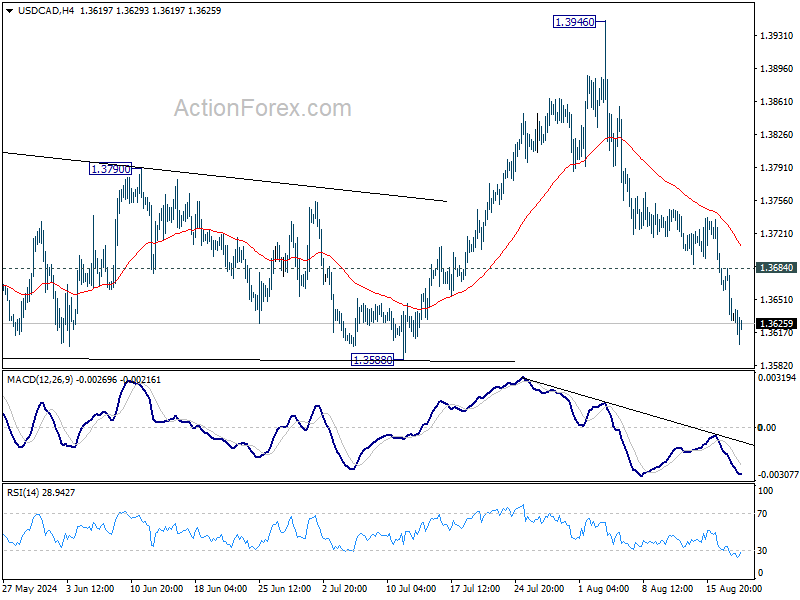
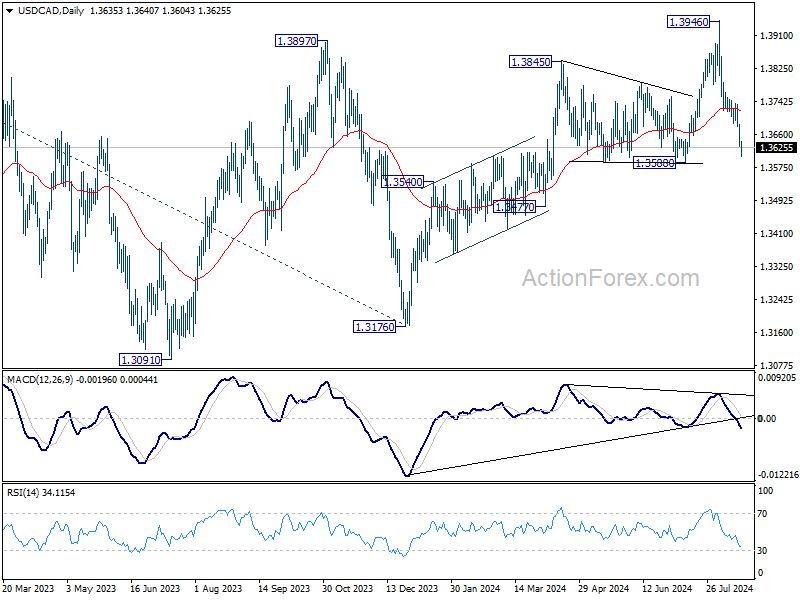
In the bigger picture, price actions from 1.3976 (2022 high) are viewed as a corrective pattern, that might have completed at 1.3176 (2023 low) already. Firm break of 1.3976 will confirm resumption of whole up trend from 1.2005 (2021 low). Next target is 61.8% projection of 1.2401 to 1.3976 from 1.3176 at 1.4149. This will be the favored case as long as 1.3588 support holds, in case of pullback. However, firm break of 1.3588 will argue that consolidation from 1.3976 is already extending with another falling leg back towards 1.3091/3176 support zone.
Canadian Dollar Slips as CPI Solidifies Case for BoC Sep Cut, Gold Marches On
Canadian Dollar has come under broad pressure in the early US session following the release of the latest inflation data, which showed a further slowdown in inflation, with headline CPI fell to a 40-month low and core measures also easing. This set of data has strengthened market’s expectation that BoC would deliver its third rate cut of the current cycle at its upcoming September meeting, lowering the key borrowing rate to 4.50%.
The data has shifted the focus to BoC’s future policy path. While the September rate cut seems like a done deal, the trajectory beyond that remains uncertain. Market participants anticipate further policy easing, but the extent and pace of additional rate cuts will be closely tied to incoming economic data.
In the broader currency markets, Dollar is currently the weakest performer for the day. Canadian Dollar follows as second worst, pressured by the dovish implications of its inflation report, while Euro is also underperforming. On the flip side, New Zealand Dollar is leading the gains, followed by Swiss Franc and British Pound. Yen and Australian Dollar are positioned in the middle of the pack.
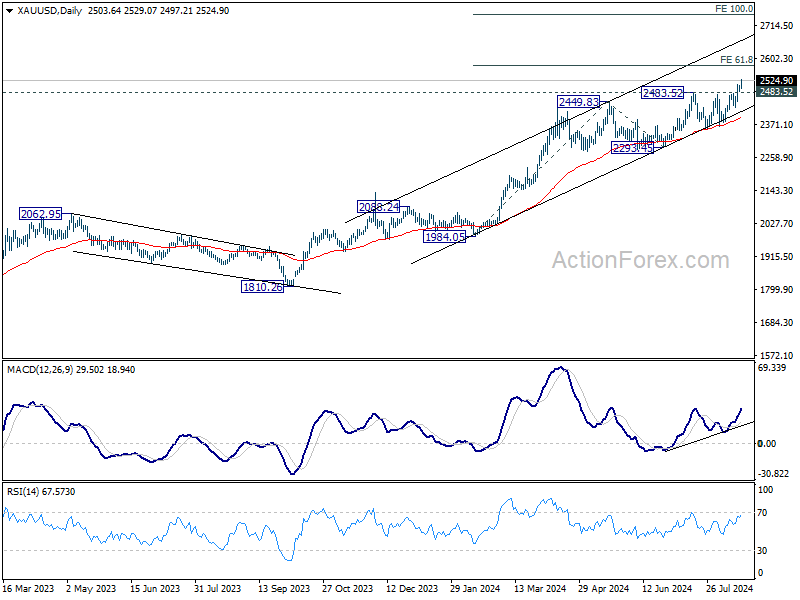
Technically, Gold's up trend resumed today after brief consolidations. Further rally is now expected as long as 2483.52 resistance turned support holds. Next target is 61.8% projection of 1984.05 to 2449.83 from 2293.45 at 2581.30. The focus is on whether Gold could lose momentum above 2581.30, or just accelerate to 100% projection at 2759.23. That would very much depend on Dollar's next move.
In Europe, at the time of writing, FTSE is down -0.87%. DAX is down -0.16%. CAC is down -0.08%. UK 10-year yield is flat at 3.926. Germany 10-year yield is down -0.0223 at 2.229. Earlier in Asia, Nikkei rose 1.80%. Hong Kong HSI fell -0.33%. China Shanghai SSE fell -0.93%. Singapore Strait Times rose 0.44%. Japan 10-year JGB yield rose 0.002 to 0.892.
Bundesbank expects temporary inflation rise, sees modest economic expansion ahead
In its latest monthly report, Bundesbank cautioned that inflation is expected to "temporarily increase" towards the end of the year. This uptick is anticipated as the currently negative inflation rates for energy turn positive, and the depressed profit margins for mineral oil products begin to recover.
Looking ahead, Bundesbank forecasts slight expansion in Germany's economic output. The report notes that the ongoing weakness in the construction sector and industry—driven largely by weak foreign demand—will likely persist. Despite these challenges, Bundesbank expects growth in private consumption and service sectors during Q3.
The report highlights that with real incomes for private households on the rise, "consumer spending should increase," though it may do so hesitantly. For instance, GfK Consumer Climate Index for July was above the average of the previous quarter, continuing its upward trend from recent months.
Eurozone CPI finalized at 2.6% in Jul, core CPI at 2.9%
Eurozone CPI was finalized at 2.6% yoy in July, up from June's 2.5% yoy. CPI Core (ex-energy, food, alcohol & tobacco) was finalized at 2.9% yoy, unchanged from June's reading. The highest contribution to the annual inflation rate came from services (+1.82 percentage points, pp), followed by food, alcohol & tobacco (+0.45 pp), non-energy industrial goods (+0.19 pp) and energy (+0.12 pp).
EU CPI was finalized at 2.8% yoy, up from June's 2.6% yoy. The lowest annual rates were registered in Finland (0.5%), Latvia (0.8%) and Denmark (1.0%). The highest annual rates were recorded in Romania (5.8%), Belgium (5.4%) and Hungary (4.1%). Compared with June 2024, annual inflation fell in nine Member States, remained stable in four and rose in fourteen.
RBA Minutes: No near-term rate cut expected, nothing ruled in or out
RBA's August meeting minutes revealed a thorough discussion on the merits of both a rate hike and a rate hold, ultimately leading to the decision to keep interest rates unchanged at 4.35%. The minutes reiterated that it is "unlikely that the cash rate target would be reduced in the short term." The minutes also noted that it is "not possible to either rule in or rule out" future changes in the cash rate
The decision to hold rates steady was seen as the best way to "balance the risks" to both inflation and the labor market, especially given the "prevailing uncertainties, market volatility, and market expectations."
RBA members emphasized the importance of placing "greater-than-usual weight on the flow of data" rather than relying solely on forecasts, due to the uncertainties surrounding the persistence of supply shocks. They noted that the data since the previous meeting had "not been sufficient to warrant a change in the stance of monetary policy."
Additionally, the minutes suggested that holding the cash rate target steady for a "longer period" than currently implied by market expectations could be enough to bring inflation back to target within a reasonable timeframe. However, the Board acknowledged that this approach would need to be reassessed at future meetings based on incoming data and evolving economic conditions.
New Zealand's goods export rises 14% yoy in Jul, imports up 8.5% yoy
New Zealand's goods exports saw a robust increase of 14% yoy in July, reaching NZD 6.1B. Goods imports also rose by 8.5% yoy to NZD 7.1B, leading to a trade deficit of NZD -963m, a stark contrast to the expected surplus of NZD 331m.
Breaking down the export data, the strongest growth came from Australia, with total exports up by 19% (NZD 135m), followed by the EU, where exports surged by 30% (NZD 114m). Exports to China increased by 8.5% (NZD 107m), while exports to the US and Japan rose by 4.7% (NZD 35m) and 5.3% (NZD 17m), respectively.
On the import side, the largest increase was from South Korea, where imports more than doubled, rising by 103% (NZD 480m). Imports from China also saw significant growth, up 18% (NZD 233m). In contrast, imports from the US and the EU declined sharply, with drops of -30% (NZD -255m) and -14% (NZD -147m), respectively. Imports from Australia showed a modest increase of 0.82% (NZD 6.3m).
USD/CAD Mid-Day Outlook
Daily Pivots: (S1) 1.3614; (P) 1.3650; (R1) 1.3670; More...
USD/CAD's fall from 1.3946 is still in progress and intraday bias stays on the downside for 1.3588 structural support. Strong support could be seen from there to bring reversal. On the upside, above 1.3684 will turn intraday bias back to the upside for stronger rebound. However, decisive break of 1.3588 will argue that rise from 1.3176 has completed and target 1.3477 support next.
In the bigger picture, price actions from 1.3976 (2022 high) are viewed as a corrective pattern, that might have completed at 1.3176 (2023 low) already. Firm break of 1.3976 will confirm resumption of whole up trend from 1.2005 (2021 low). Next target is 61.8% projection of 1.2401 to 1.3976 from 1.3176 at 1.4149. This will be the favored case as long as 1.3588 support holds, in case of pullback. However, firm break of 1.3588 will argue that consolidation from 1.3976 is already extending with another falling leg back towards 1.3091/3176 support zone.
Economic Indicators Update
| GMT | Ccy | Events | Actual | Forecast | Previous | Revised |
|---|---|---|---|---|---|---|
| 22:45 | NZD | Trade Balance (NZD) Jul | -963M | 331M | 699M | 585M |
| 01:15 | CNY | 1-Y Loan Prime Rate | 3.35% | 3.35% | 3.35% | |
| 01:15 | CNY | 5-Y Loan Prime Rate | 3.85% | 3.85% | 3.85% | |
| 01:30 | AUD | RBA Meeting Minutes | ||||
| 06:00 | CHF | Trade Balance (CHF) Jul | 4.89B | 5.44B | 6.18B | 6.12B |
| 06:00 | EUR | Germany PPI M/M Jul | 0.20% | 0.30% | 0.20% | |
| 06:00 | EUR | Germany PPI Y/Y Jul | -0.80% | -0.80% | -1.60% | |
| 08:00 | EUR | Eurozone Current Account (EUR) Jun | 50.5B | 37.0B | 36.7B | 37.6B |
| 09:00 | EUR | Eurozone CPI Y/Y Jul F | 2.60% | 2.60% | 2.60% | |
| 09:00 | EUR | Eurozone CPI Core Y/Y Jul F | 2.90% | 2.90% | 2.90% | |
| 12:30 | CAD | New Housing Price Index M/M Jul | 0.20% | 0.00% | -0.20% | |
| 12:30 | CAD | CPI M/M Jul | 0.40% | 0.30% | -0.10% | |
| 12:30 | CAD | CPI Y/Y Jul | 2.50% | 2.50% | 2.70% | |
| 12:30 | CAD | CPI Median Y/Y Jul | 2.40% | 2.50% | 2.60% | |
| 12:30 | CAD | CPI Trimmed Y/Y Jul | 2.70% | 2.70% | 2.90% | |
| 12:30 | CAD | CPI Common Y/Y Jul | 2.20% | 2.20% | 2.30% |
EUR/USD Mid-Day Outlook
Daily Pivots: (S1) 1.1043; (P) 1.1064; (R1) 1.1107; More.....
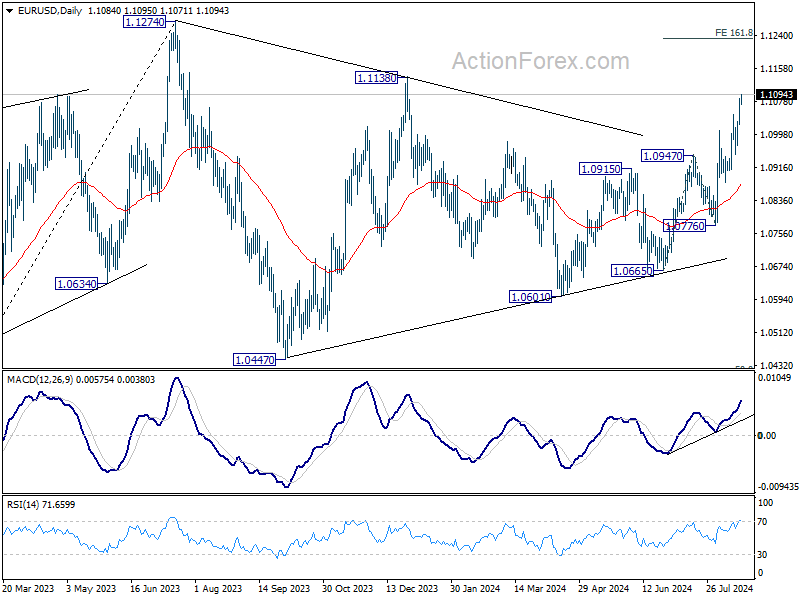
Intraday bias in EURUSD remains on the upside for the moment. Current rise should target 1.1138 resistance, and then 161.8% projection of 1.0665 to 1.0947 from 1.0776 at 1.1232. On the downside, below 1.1029 minor support will turn intraday bias neutral and bring consolidations first. But outlook will now remain bullish as long as 1.0948 support holds.
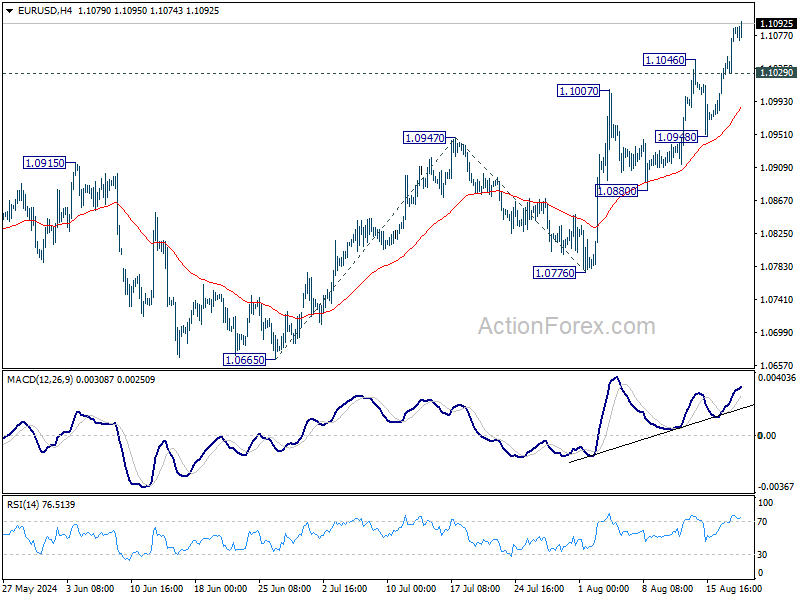
In the bigger picture, price actions from 1.1274 are viewed as a corrective pattern that's could still extend. Break of 1.1138 resistance will be the first signal that rise from 0.9534 (2022 low) is ready to resume through 1.1274 (2023 high). However, break of 1.0776 support will extend the correction with another falling leg back towards 1.0447 support.
GBP/USD Mid-Day Outlook
Daily Pivots: (S1) 1.2951; (P) 1.2974; (R1) 1.3013; More...
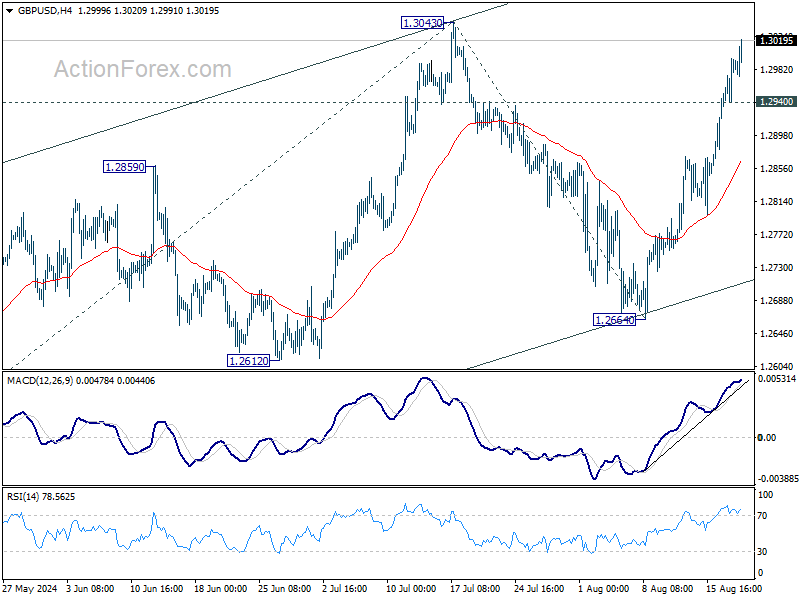
GBP/USD's rally from 1.2664 continues today and intraday bias stays on the upside for retesting 1.3043. Firm break there will resume whole rally from 1.2998 to 61.8% projection of 1.2298 to 1.3043 from 1.2664 at 1.3124, which is close to 1.3141 high. On the downside, below 1.2940 minor support will turn intraday bias neutral first.
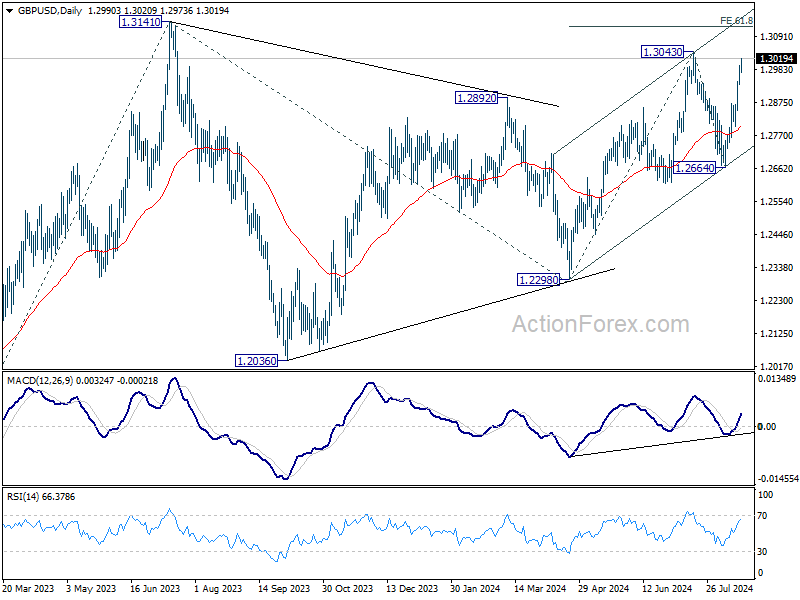
In the bigger picture, corrective pattern from 1.3141 might have completed at 1.2298 already. Rise from there could be resuming the larger up trend from 1.0351 (2022 low). Decisive break of 1.3141 will target 38.2% projection of 1.0351 to 1.3141 from 1.2298 at 1.3364 next. However, break of 1.2664 support will delay this bullish case once again and extend the corrective pattern from 1.3141.
USD/CHF Mid-Day Outlook
Daily Pivots: (S1) 0.8604; (P) 0.8641; (R1) 0.8666; More…..
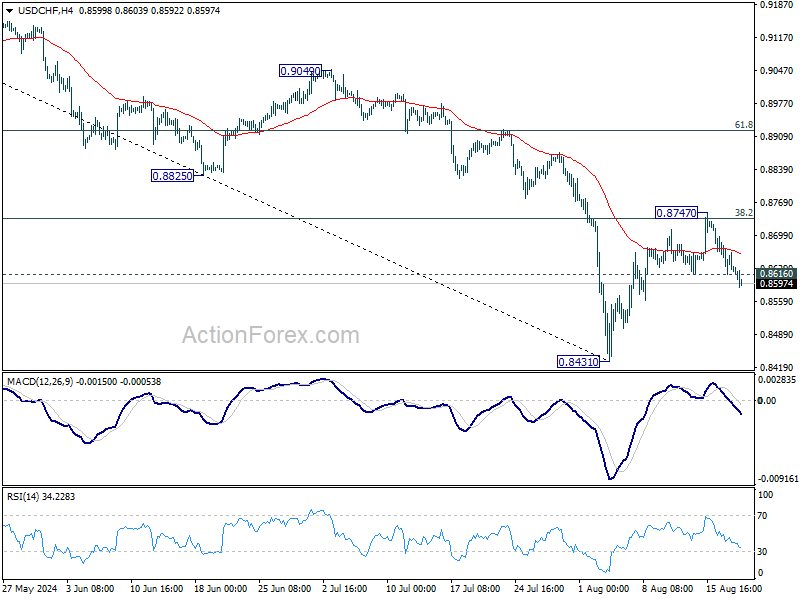
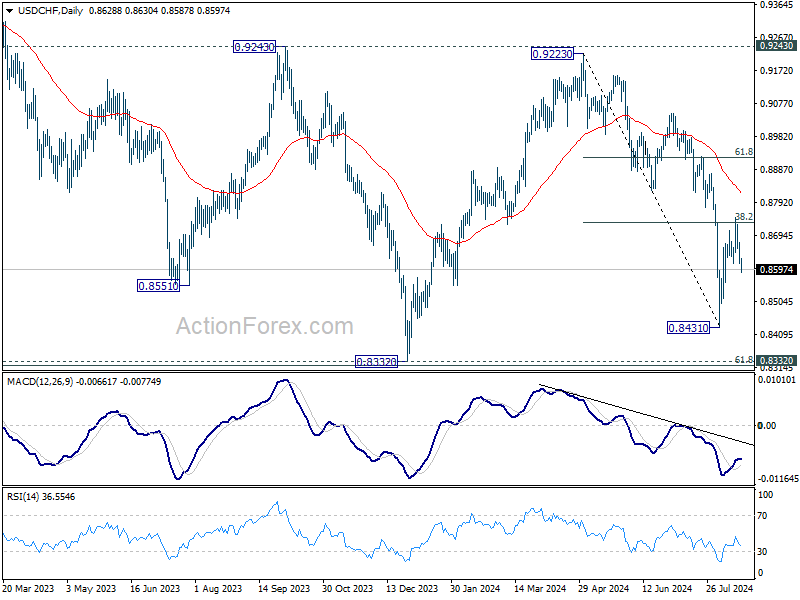
USD/CHF's break of 0.8616 support should indicate that rebound from 0.8431 has completed at 0.8747, after rejection by 38.2% retracement of 0.9223 to 0.8431 at 0.8734. Intraday bias is back on the downside for retesting 0.8431 low. For now, risk will stay on the downside as long as 0.8747 resistance holds, in case of recovery.
In the bigger picture, price actions from 0.8332 (2023 low) are currently seen as a medium term corrective pattern, with fall from 0.9223 as the second leg. Strong support could be seen from 0.8332 to bring rebound. Yet, overall outlook will continue to stay bearish as long as 0.9243 resistance holds. Firm break of 0.8332, however, will resume larger down trend from 1.0146 (2022 high).
USD/JPY Mid-Day Outlook
Daily Pivots: (S1) 145.17; (P) 146.62; (R1) 148.04; More...
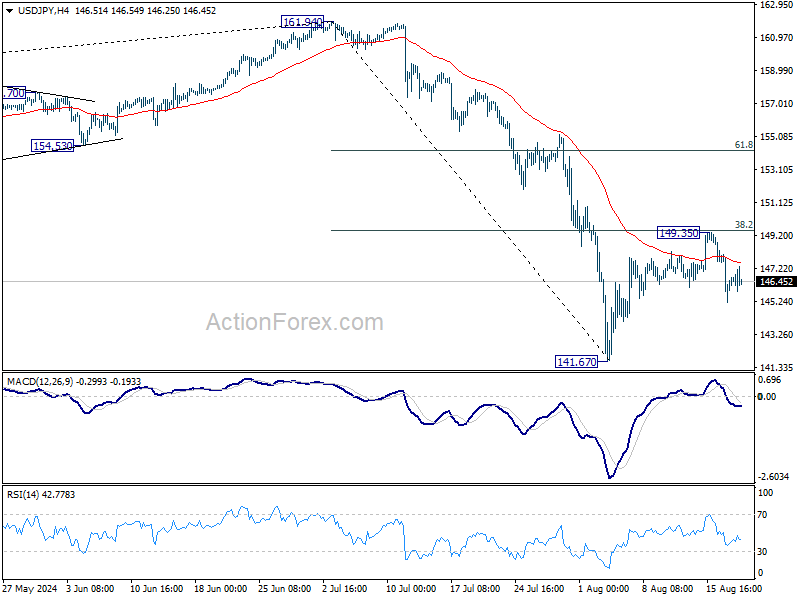
As noted before, USD/JPY's rebound from 141.67 could have completed at 149.35 after rejection by 38.2% retracement of 161.94 to 141.67 at 149.41. Intraday bias stays mildly on the downside for retesting 141.67 low. Firm break there will resume the whole fall from 161.94 to 139.26 fibonacci level next. For now, risk will stay on the downside as long as 149.35 resistance holds, in case of recovery.
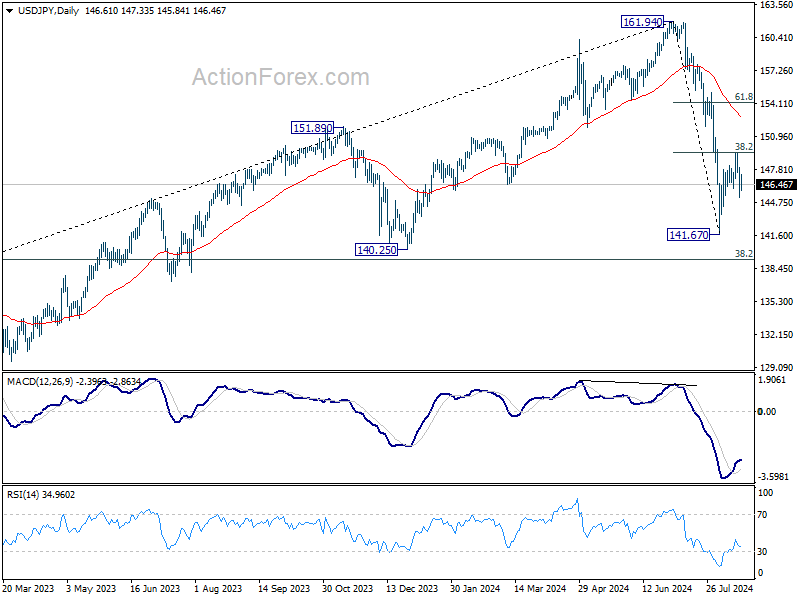
In the bigger picture, fall from 161.94 medium term is seen as correcting whole up trend from 102.58 (2021 low). Deeper decline could be seen to 38.2% retracement of 102.58 to 161.94 at 139.26, which is close to 140.25 support. In any case, risk will stay on the downside as long as 55 W EMA (now at 149.63) holds. Nevertheless, firm break of 55 W EMA will suggest that the range for medium term corrective pattern is already set.
Canada’s CPI slows to 2.5% in Jul, CPI common down to 2.2%
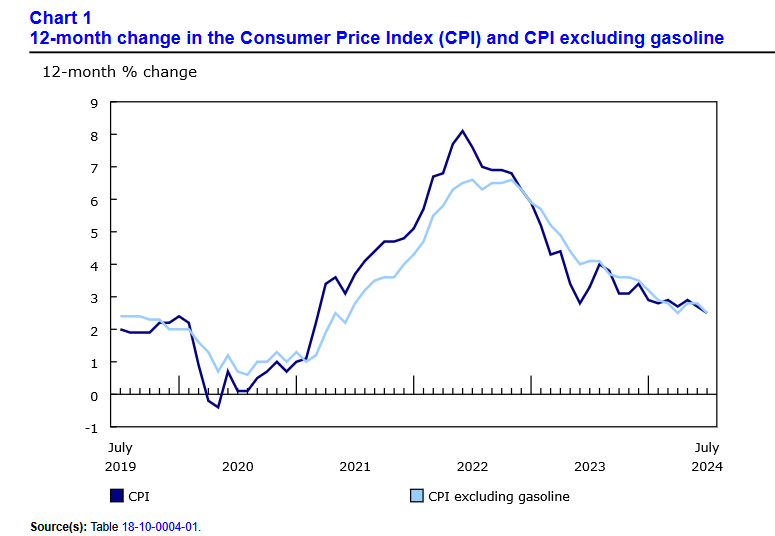
Canada's CPI slowed to 2.5% yoy in July, down from 2.7% yoy in June, aligning with market expectations. This marks the slowest pace of inflation since March 2021. According to Statistics Canada, the deceleration in headline inflation was broad-based, with lower prices for travel tours, passenger vehicles, and electricity contributing to the overall decline.
Core inflation measures also showed signs of easing. CPI median fell from 2.6% yoy to 2.4% yoy, slightly below expectations of 2.5% yoy. CPI trimmed mean slowed from 2.9% yoy to 2.7% yoy, matching expectations, while CPI common edged down from 2.3% yoy to 2.2% yoy, also in line with forecasts.
On a monthly basis, CPI rose by 0.4% mom, exceeding the expected 0.3% mom increase. Notably, gasoline prices jumped 2.4% mom. exerting upward pressure on the headline figure.
Bundesbank expects temporary inflation rise, sees modest economic expansion ahead
In its latest monthly report, Bundesbank cautioned that inflation is expected to "temporarily increase" towards the end of the year. This uptick is anticipated as the currently negative inflation rates for energy turn positive, and the depressed profit margins for mineral oil products begin to recover.
Looking ahead, Bundesbank forecasts slight expansion in Germany's economic output. The report notes that the ongoing weakness in the construction sector and industry—driven largely by weak foreign demand—will likely persist. Despite these challenges, Bundesbank expects growth in private consumption and service sectors during Q3.
The report highlights that with real incomes for private households on the rise, "consumer spending should increase," though it may do so hesitantly. For instance, GfK Consumer Climate Index for July was above the average of the previous quarter, continuing its upward trend from recent months.
EUR/USD Holds Near Seven-Month High Amid Speculation on Fed Rate Cuts
Euro/dollar maintains its position close to a seven-month peak, trading at 1.1077 on Tuesday. The US dollar's weakening continues, largely driven by market expectations of an imminent interest rate cut by the US Federal Reserve next month. Attention is also geared towards Fed Chairman Jerome Powell's upcoming remarks at the Jackson-Hole symposium on Friday.
Market participants anticipate Powell will signal the necessity for a rate reduction. The nuances of his speech will be critically evaluated to discern whether the Fed is leaning towards a moderate 25 basis point cut or a more substantial reduction in September.
While there's a possibility Powell might opt for cautious language to provide the Fed with flexibility to adjust the pace of rate cuts based on future economic data, current conditions seem conducive for at least a 25bp reduction in borrowing costs next month. The Fed could then decide to accelerate cuts depending on subsequent economic indicators.
Until further data becomes available, the US dollar might remain under pressure. So far, EURUSD has appreciated by 2.4% since the start of August, marking the most robust monthly gain since November of the previous year.
Technical analysis of EUR/USD
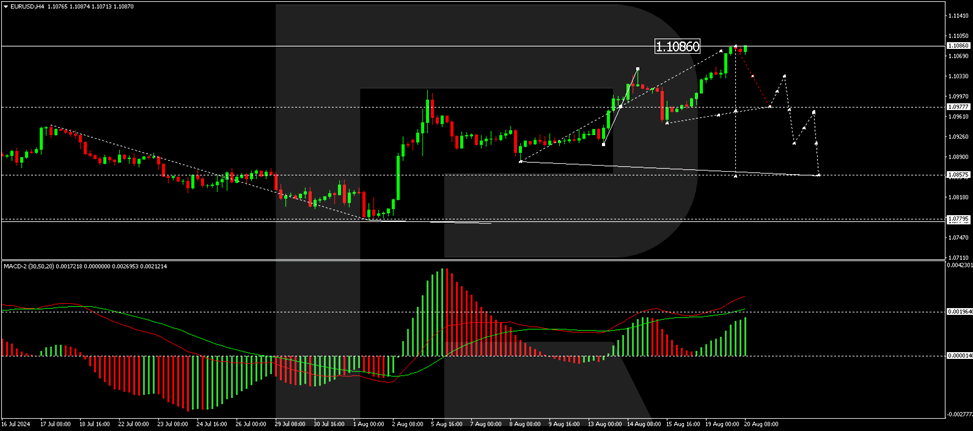
The EUR/USD has established a consolidation pattern around 1.1020, breaking upwards to reach 1.1080. This growth trajectory appears to have peaked, and the market is now likely to form a consolidation range at these high levels. A downward breakout is anticipated, potentially driving the pair towards 1.0980. A breach of this level could extend losses to 1.0880. The MACD indicator supports this view, with its signal line positioned above zero but poised to decline, suggesting a potential reversal.
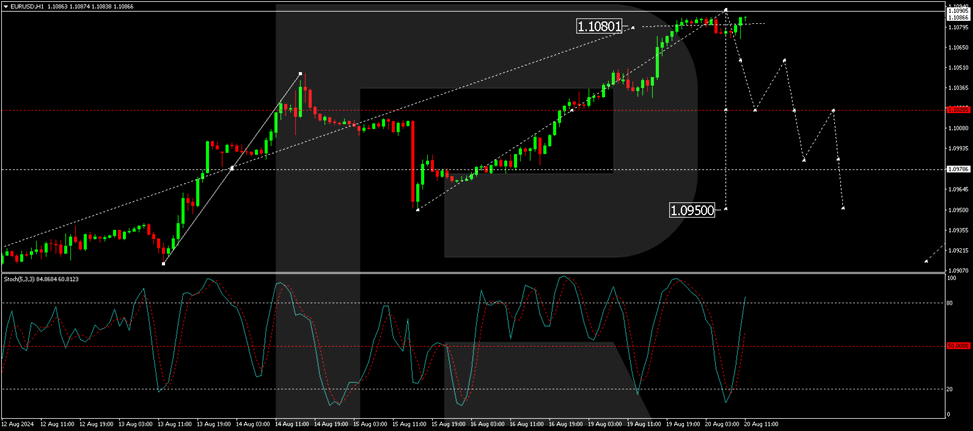
On the H1 chart, EUR/USD is currently forming a consolidation range near 1.1080, with a possible expansion to 1.1090. A downward departure from this range could target 1.1020. Following this, a corrective move to 1.1050 may occur before the pair resumes its descent to 1.0990 and potentially extends to 1.0950. This bearish outlook is corroborated by the Stochastic oscillator, which is near the 80 level and anticipated to drop towards 20, indicating a potential decline.
Why Do Oil Prices Post Notable Losses?
- Oil prices have decreased lately as a result of various crucial factors
- Technical Outlook confirms bearish structure
Global economic concerns
The global economy is encountering substantial difficulties, especially in prominent economies such as China and Europe. China's economic expansion has experienced a deceleration below initial projections, resulting in a decrease in industrial operations and a decline in oil demand. Europe has been on the brink of recession due to the disruption of energy supplies caused by the Russia-Ukraine conflict.
Oil production increases
Despite attempts by major oil producers such as Saudi Arabia and Russia to reduce production and maintain current prices, other producers, particularly in the United States, have significantly increased their output. Recently, there has been a 5-6% surge in US oil output, resulting in an excess of supply on the market.
Geopolitical factors
Although geopolitical tensions frequently cause concerns about potential supply interruptions, the current situation in the Middle East has not had a significant impact on oil supplies. However, attention has shifted towards the possibility of a cessation of hostilities in Gaza, which has contributed to the market's lack of predictability.
Despite facing sanctions and geopolitical challenges, Russia has managed to sustain a consistent level of oil output, demonstrating resilience. This resilience has effectively mitigated a substantial decrease in the global oil supply, thereby exacerbating the price slide.
The current decline in oil prices is due to a confluence of factors, including an economic downturn, heightened production levels, seasonal demand fluctuations, and geopolitical influences. These factors are anticipated to continue exerting influence on the industry in the foreseeable future.
Technical Outlook: Daily
- WTI oil battles with uptrend line
- Loses around 8% in one week
WTI crude oil prices have tumbled around 8% after the pullback off the 80.50 resistance level, taking the market well beneath the simple moving average lines and the long-term ascending trend line. If the market closes below the diagonal line, it will support the scenario of steeper decreases. The significant 72.70 support level, which has held since February, could provide immediate support. Even a drop below the 71.30 barrier and the 70.00 round number could serve as a significant turning point.
On the other hand, a recoup of some losses and a climb above 75.20 could open the way for a retest of the SMA lines between 76.88 and 79.65. Above this area, the 80.50 resistance comes next, ahead of the medium-term downtrend line around 82.00.
According to technical oscillators, the RSI is losing momentum beneath the 50 level, while the MACD is ready for a bearish crossover with its red signal line in negative territory in the short-term view.

Technical Outlook: Weekly
- WTI oil holds in symmetrical triangle in weekly chart
- Strong resistance by 200-day SMA at 78.30
Turning to the weekly chart, the price has been developing within a symmetrical triangle since June 2022, with the SMAs exhibiting strong resistance levels between 78.40 and 79.50.
Zooming in on the previous week, the bearish doji candle shows a sign for a potential downside movement, with the first support coming from the 72.70 barrier. A successful plunge beneath the uptrend line could confirm the bearish outlook, hitting the lows in May and December 2023 at 67.80. Falling further, the 64.20 barricade, registered in March 2023, could be a trigger point for traders to continue selling oil prices or be the time for an upside recovery.
Technically, the RSI is pointing down below the neutral threshold of 50, while the MACD is moving with weak momentum marginally below its trigger and zero lines.
