Sample Category Title
Gold Bulls May Rest after Record High
- Gold pulls below record high; might give up more ground
- Market trend stays positive as long as price holds above 2,463
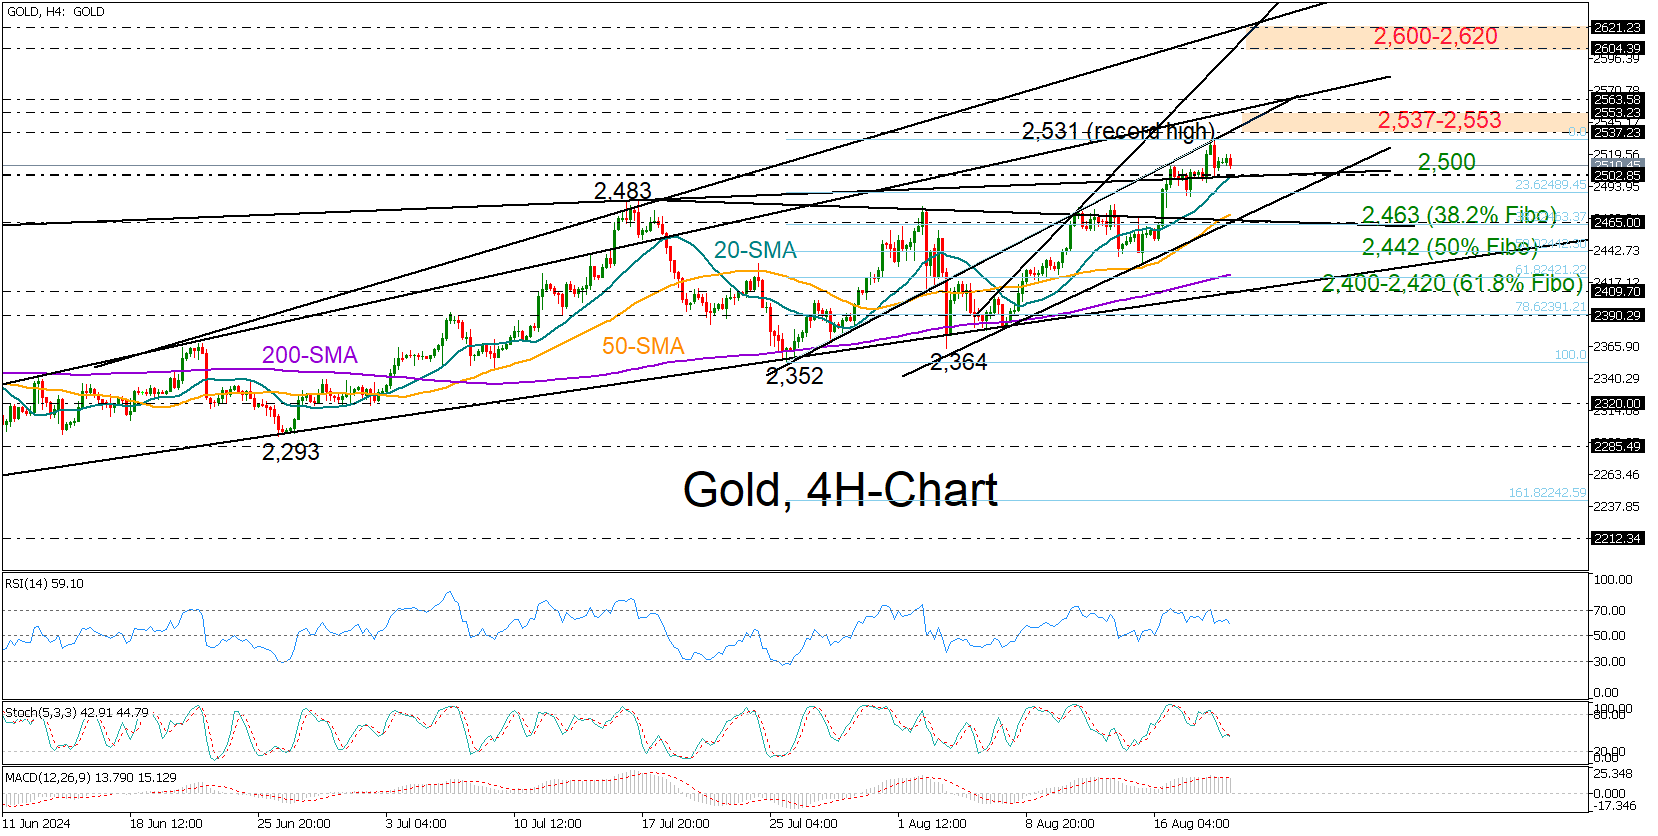
Gold lost momentum after unlocking an all-time high of 2,531 on Tuesday near the rising constraining line drawn from July’s low, but it maintained its resilience above the 2,500 psychological number by the end of the day.
The technical picture in the four-hour chart has started to show some cracks. The precious metal appears to have formed a bearish engulfing candlestick pattern at the peak of its upward movement, indicating a potential downward shift in the price. The indicators are beginning to trend downward, further validating the negative scenario.
Nevertheless, the price is still in a bullish channel, so any possible drop can be seen as part of the upward pattern unless the bears break below 2,463. Meanwhile, the market could find support from the 20-period simple moving average at 2,500 and the 23.6% Fibonacci retracement of the July-August rally at 2,489.
The 50% Fibonacci level of 2,442 could ease selling forces below the channel ahead of the 61.8% Fibonacci levels of 2,420, while a step below the ascending trendline at 2,400, which has been buffering downside movements since the end of June, could send stronger bearish signals if breached.
If the bulls stay active, their goal will be to pierce through the border between 2,537 and 2,555, with potential to continue towards the next barrier at 2,600-2,620. Slightly higher, the 2,650 region could be another hurdle.
In short, gold could become more susceptible to downward risks in the upcoming sessions. However, market sentiment would only be dampened if the price falls below 2,463, whilst a rebound above 2,537-2,555 could increase buying interest.
EURUSD Bulls Stay in Charge
- EURUSD extends rally, hits 1.1130
- But oscillators point to fading momentum
- A setback may be possible before the next leg north
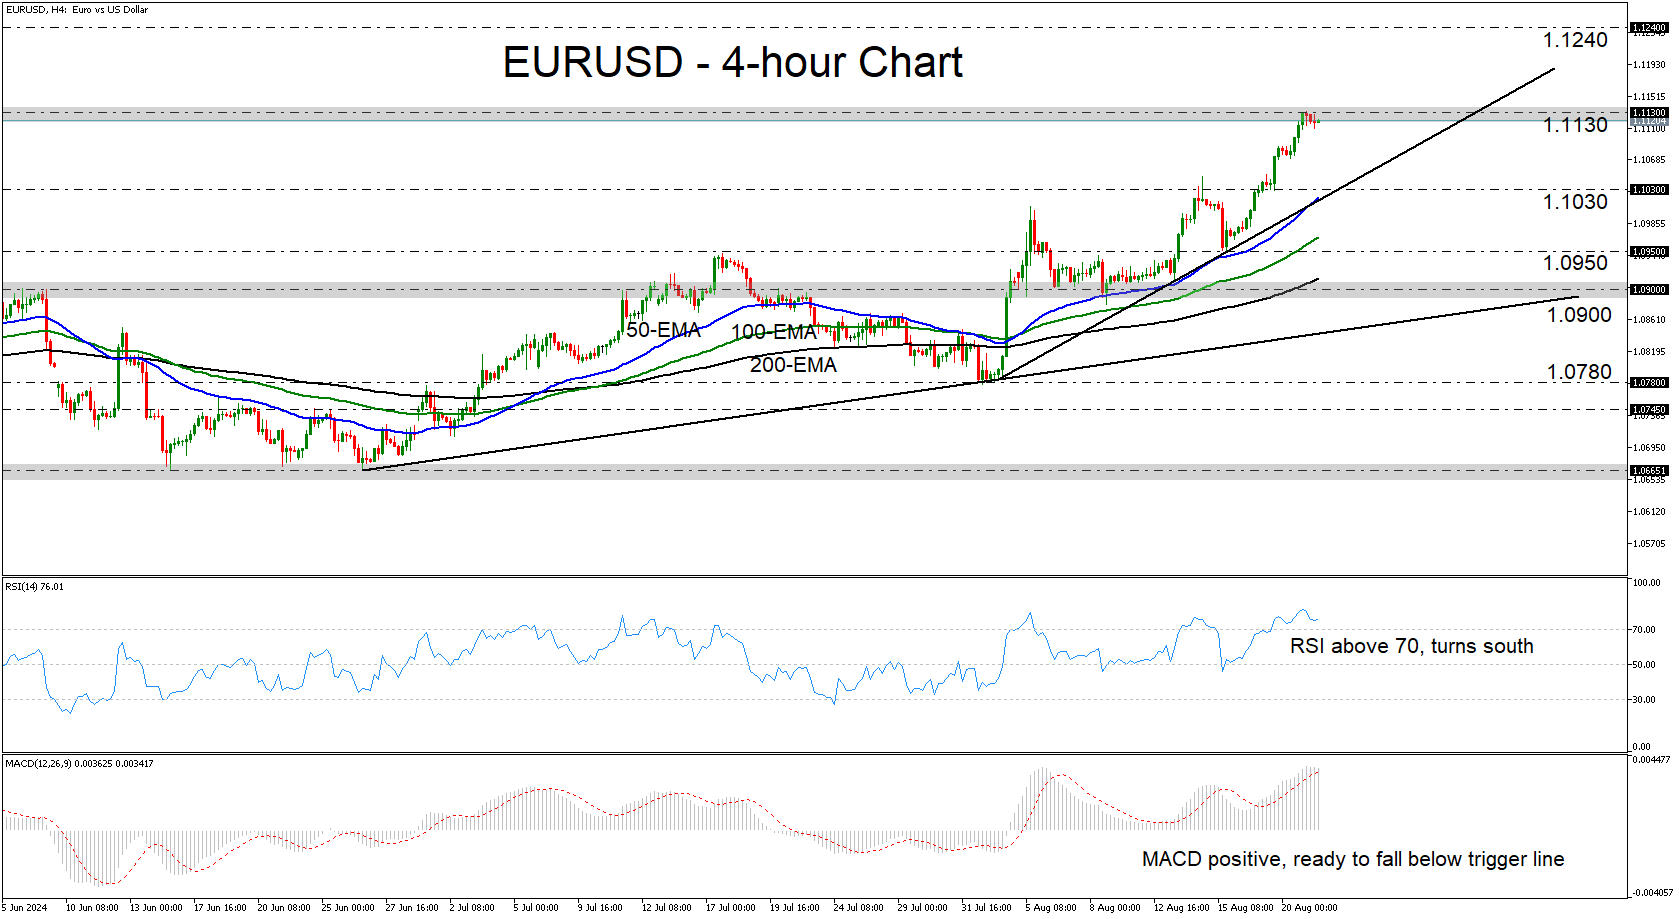
EURUSD has been in a steady rally since August 15, when it hit support at 1.0950, and it is currently testing the key resistance zone of 1.1130, a zone that stopped the bulls from heading further north back in December, as well as back in July, 2023. Overall, the pair is trading above a short-term uptrend line drawn from the low of August 2, and well above the upper bound of a prior sideways range, at around 1.0900.
Although the technical picture on the 4-hour chart appears to be overly bullish, the short-term oscillators are suggesting that the upside momentum is fading, which means that a corrective setback may be in the works before the next leg north. The RSI has peaked within its above-70 zone, while the MACD, although extremely positive, has turned south as well and looks ready to fall below its trigger line.
A retreat may invite buyers from near the aforementioned uptrend line and the 1.1030. If this is the case, another bullish wave could surpass the 1.1130 high and aim for the 1.1240 area, marked by the high of March 1, 2022.
On the downside, a dip below 1.1030 could trigger a larger correction, as it would also take the pair below the short-term uptrend line. The bears may feel confident in targeting the low of August 15, at 1.0950, or the upper bound of the sideways range that contained most of the price action since the beginning of the year. That bound stands at 1.0900.
To recap, EURUSD remains in a steep short-term uptrend, but the short-term oscillators suggest that a corrective slide may be on the cards before the next impulsive wave.
Euro Drifting as Investors Eye Fed Minutes
The euro is calm on Wednesday after an impressive 3-day rally which saw EUR/USD jump 1.4%. Will the upswing continue? In the European session, EUR/USD is trading at 1.1220 at the time of writing, down 0.08% on the day.
ECB likely to lower rates in September despite stubborn inflation
The European Central Bank took the plunge and lowered interest rates in June, for the first time in four since 2019. This brought down the key rate to 3.75%, down from a record 4%. At the meeting, the ECB also revised upwards its inflation forecast for 2024 from 2.3% to 2.5%.
The ECB remains concerned about sticky inflation which is above the 2% target. The fact that inflation is above target won’t stop the central bank from further cuts since rate moves tend to take time until they filter through the economy. The ECB wants to continue cutting rates in order to boost a flagging eurozone economy but sticky inflation and strong wage growth remain are making it more difficult for the ECB to lower rates. Still, the markets have priced in a rate cut at the September 12 meeting at around 90%.
Next up: Jackson Hole Symposium
The annual meeting at Jackson Hole could be dramatic. Federal Reserve Chair Powell will address the gathering on Friday, ahead of a widely expected Fed rate cut next month. It is practically a given that the Fed will loosen policy, but by how much?
The most likely scenario is a quarter-point cut, but earlier this month, the financial markets were routed and expectations for a large half-point cut soared. With inflation under control, the Fed is keeping a close eye on the US labor market, and Powell’s take on the economic outlook could move the markets.
.
EUR/USD Technical
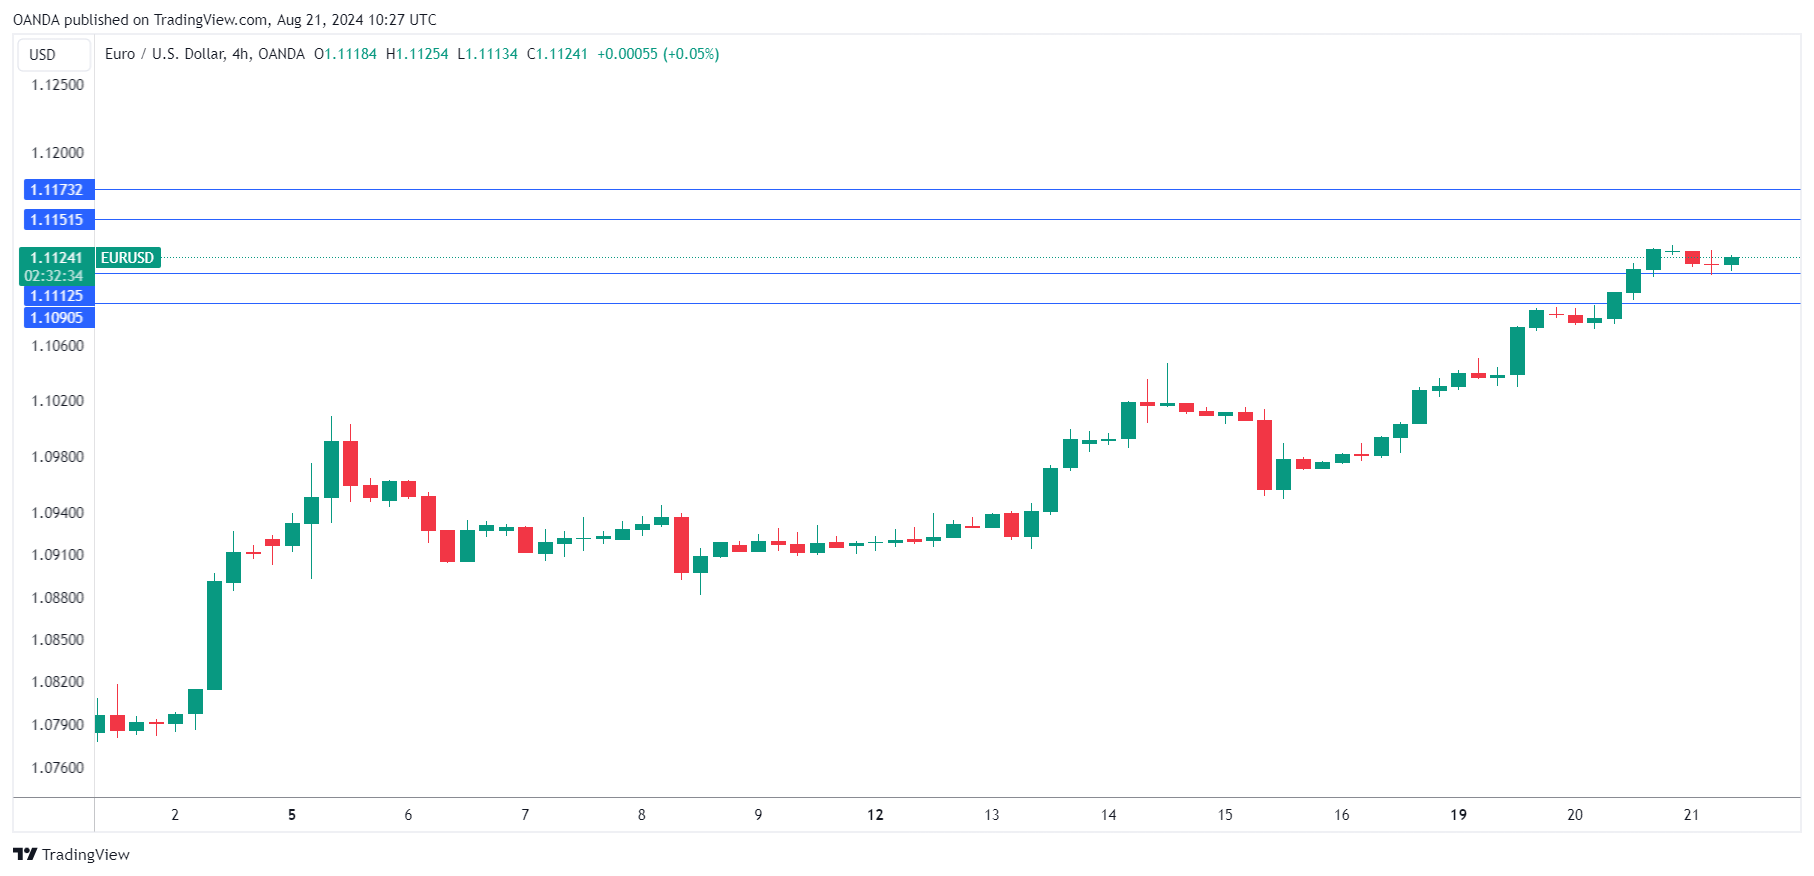
- EUR/USD is testing support at 1.1112. Below, there is support at 1.1090
- 1.1151 and 1.1173 are the next resistance lines
WTI Outlook: Bears Taking a Breather After the Latest Acceleration
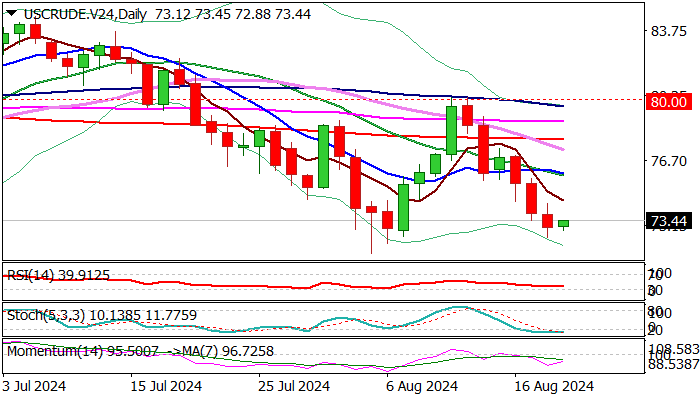
Bears are taking a breather after the latest bearish acceleration in past three days (oil price was down 5%) deflated by easing tensions in the Middle East and rise in US crude stocks (API report).
Oversold daily studies and Tenkan-Kijun-sen turned sideways, suggesting that bears are running out of steam, which may prompt traders for a partial profit-taking.
The notion is supported by the fact that oil price has repeatedly failed to register a daily close below June 4 low ($72.46).
This marks solid support, and another bounce may occur, following a triple failure in early August.
Upticks face initial resistances at $74.00/33, followed by $75.00/44, with $76.00 zone (converged 10/20DMA’s / 4-hr Ichimoku cloud base) expected to cap and mark a healthy correction.
Eventual close below $72.46 pivot and $71.66 (Aug 5 spike low) to unmask psychological $70 support.
Res: 74.00; 74.33; 75.00; 75.44.
Sup: 72.46; 72.19; 71.66; 71.00.
EURUSD: Break Out of Range or Pull Back?
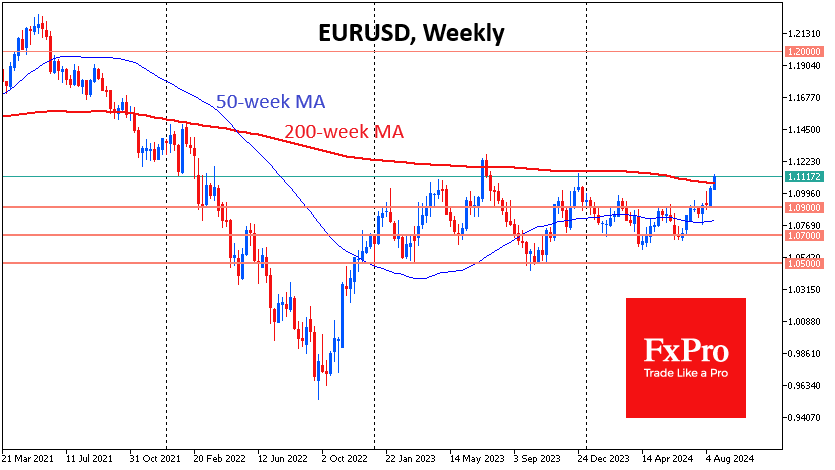
The single currency has risen above $1.11, almost repeating its late December peak. At current levels, the pair is within the upper boundary of its trading range, and the technical analysis suggests that a breakout is more likely than a pullback.
Thanks to two bullish impulses since the beginning of July, EURUSD has moved from the lower boundary of the trading range established in early 2023 at 1.07 to the upper boundary above 1.11.
Since the beginning of this week, active buying has pushed the pair above its 200-week moving average. This could potentially be an important signal of a regime change in the market, although cautious players may note that the same signal proved false last July and lagged severely in 2012 and 2017.
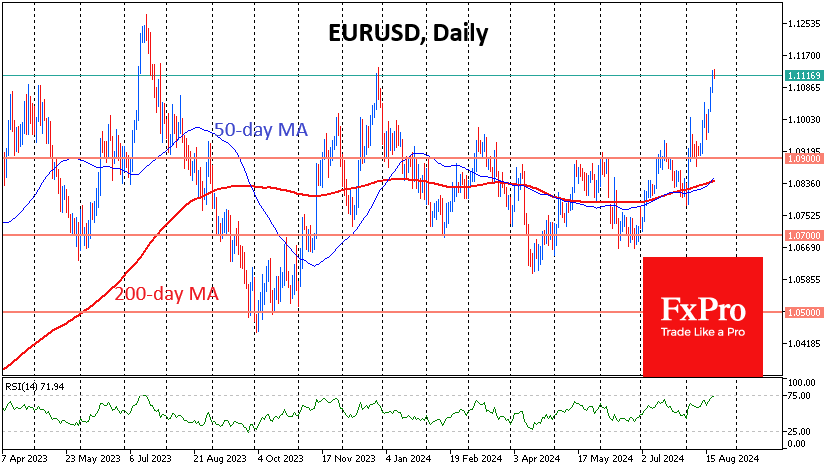
The daily timeframes show overheating as the RSI has climbed close to 75, the level from which an 11-week sell-off began in July 2023.
However, the major moving averages are bullish. A ‘golden cross’ was formed earlier this week, with the 50-day moving average above the 200-day moving average. Both are below the price, which also adds to the bullishness. The subsequent rally in the EURUSD has confirmed this important technical signal for many managers.
However, even this bullish technique needs fundamentals. The markets will need to dig deeper into the minutes of the latest Fed meeting, which will be published at the end of Wednesday. Powell’s live speech at Jackson Hole on Friday is still highly influential and could answer the question of whether the Fed is considering a 50-point rate cut next month.
Of note on Wednesday is the annual revision of US employment data, which could dramatically change the picture of the economy in recent months. Some observers are talking about a possible downward revision of 0.6-1.0 million jobs for the year. The latest weak jobs data was extremely painful for traders earlier this month, triggering a sell-off in equities despite a surge in rate cut expectations. Will this scenario be repeated?
USD/CAD Drops to 1.3600 Support Level
The USD/CAD chart shows the Canadian dollar strengthening against the USD to levels last seen at the end of July.
On one hand, the US dollar is weakened by expectations of an inevitable rate cut. On the other, the Canadian dollar gained strength after yesterday’s inflation data:
→ Although the initial reaction pushed USD/CAD up to 1.364,
→ Today, the market seems to have reassessed the impact, with the pair falling to yesterday's low, indicating continued bearish dominance.
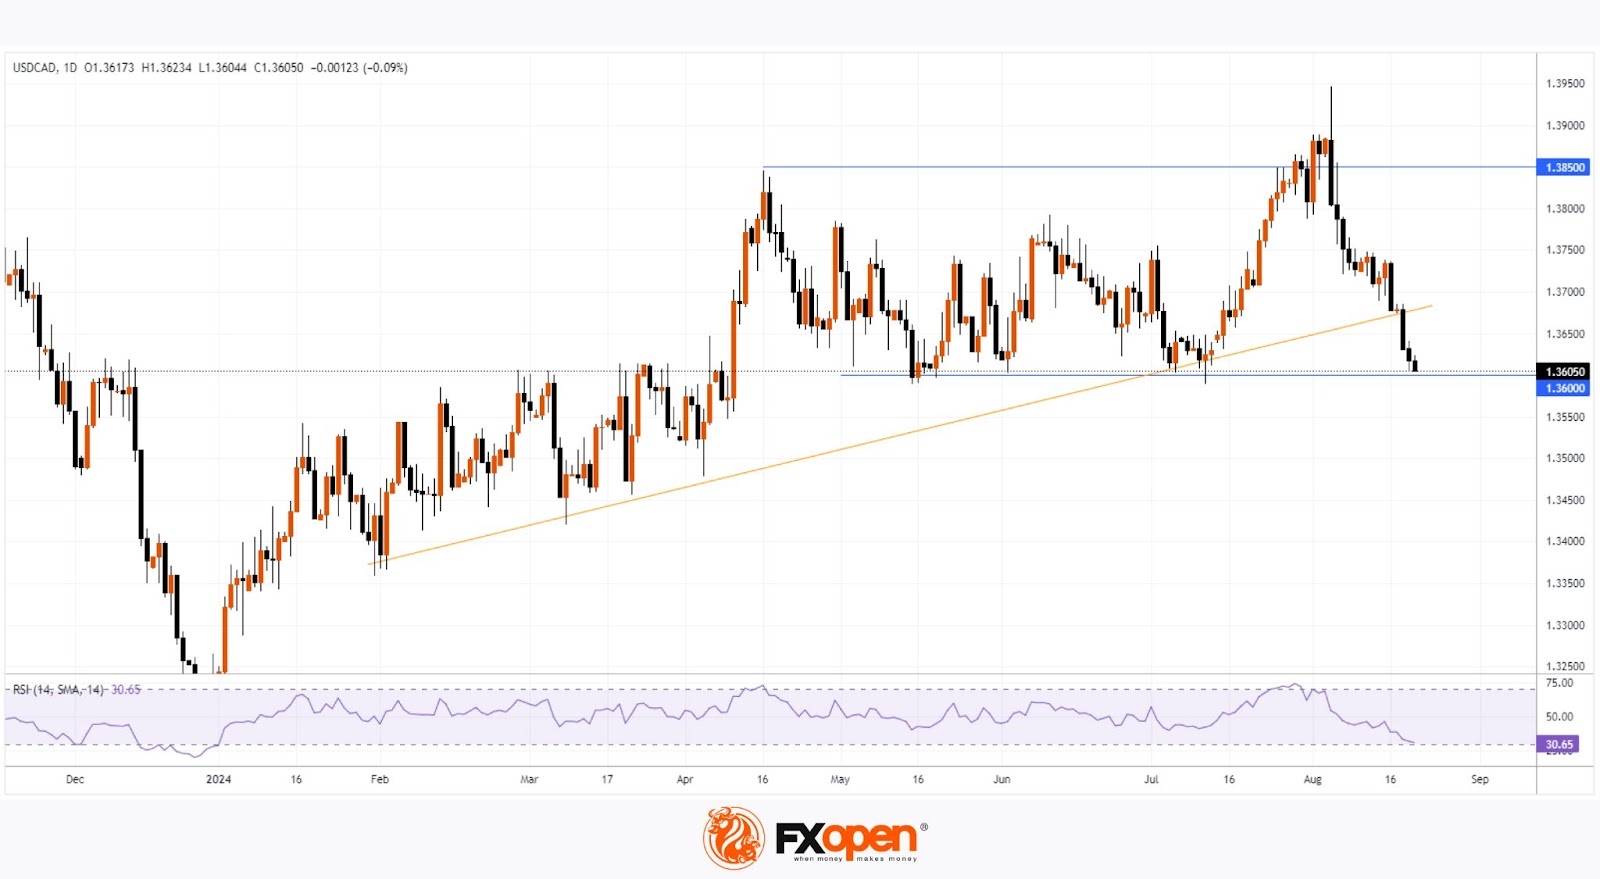
Meanwhile, technical analysis of the USD/CAD chart reveals that the pair has dropped to the 1.3600 support level, which has been a key level for bulls since May.
This decline has been quite sharp, with a drop of over 2.2% from the 6th August high. Bears managed to break the trendline (shown in yellow) and push the RSI from the overbought zone close to the oversold zone within two weeks.
Notably, before the drop, the pair broke the 1.385 support level, but it turned out to be a false breakout. The 6th August candle had a long upper shadow, suggesting many traders were caught off guard.
If the bullish breakout was a false move, could a genuine breakout of the 1.3600-1.3850 range happen to the downside?
The future direction of USD/CAD will largely depend on the market’s reaction to today’s FOMC news, scheduled for release at 21:00 GMT+3.
Trade over 50 forex markets 24 hours a day with FXOpen. Take advantage of low commissions, deep liquidity, and spreads from 0.0 pips. Open your FXOpen account now or learn more about trading forex with FXOpen.
This article represents the opinion of the Companies operating under the FXOpen brand only. It is not to be construed as an offer, solicitation, or recommendation with respect to products and services provided by the Companies operating under the FXOpen brand, nor is it to be considered financial advice.
Market Analysis: EUR/USD Regains Strength While USD/CHF Struggles
EUR/USD started a fresh increase above the 1.1000 resistance. USD/CHF declined and now struggling below the 0.8600 resistance.
Important Takeaways for EUR/USD and USD/CHF Analysis Today
- The Euro surged after it broke the 1.0950 resistance against the US Dollar.
- There is a connecting bullish trend line forming with support near 1.1090 on the hourly chart of EUR/USD at FXOpen.
- USD/CHF declined below the 0.8635 and 0.8600 support levels.
- There is a major bearish trend line forming with resistance near 0.8575 on the hourly chart at FXOpen.
EUR/USD Technical Analysis
On the hourly chart of EUR/USD at FXOpen, the pair started a fresh increase from the 1.0950 zone. The Euro cleared the 1.1000 resistance to move into a bullish zone against the US Dollar.
The bulls pushed the pair above the 50-hour simple moving average and 1.1050. Finally, the pair tested the 1.1130 resistance. A high was formed near 1.1132 and the pair is now consolidating gains above the 23.6% Fib retracement level of the upward wave from the 1.0798 swing low to the 1.1132 high.
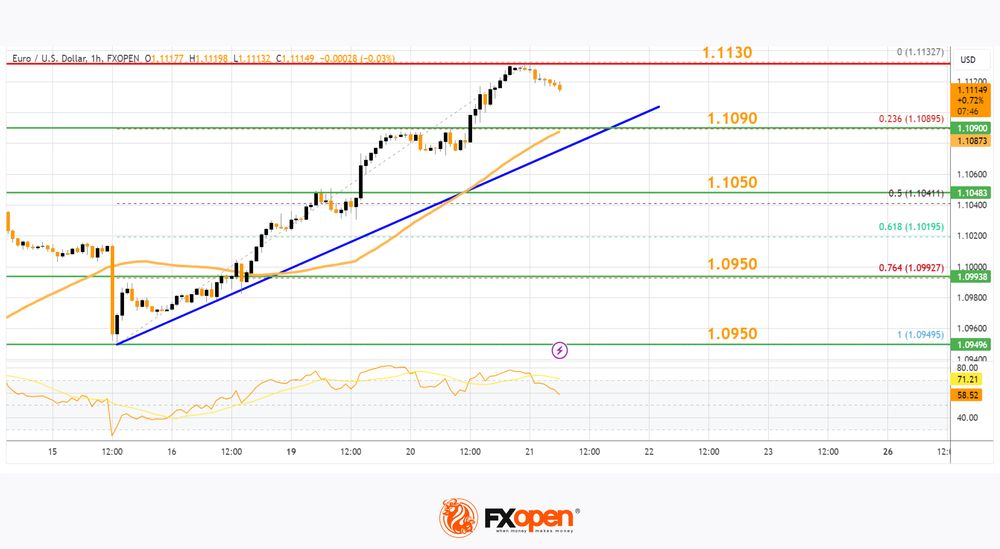
Immediate support on the downside is near a connecting bullish trend line at 1.1090. The next major support is the 50% Fib retracement level of the upward wave from the 1.0798 swing low to the 1.1132 high at 1.1050.
A downside break below the 1.1050 support could send the pair toward the 1.1000 level. Any more losses might send the pair into a bearish zone toward 1.0950.
Immediate resistance on the EUR/USD chart is near the 1.1130 zone. The first major resistance is near the 1.1150 level. An upside break above the 1.1150 level might send the pair toward the 1.1200 resistance.
The next major resistance is near the 1.1220 level. Any more gains might open the doors for a move toward the 1.1250 level.
Read analytical EUR/USD price forecasts for 2024 and beyond.
USD/CHF Technical Analysis
On the hourly chart of USD/CHF at FXOpen, the pair started a fresh decline from well above the 0.8700 zone. The US Dollar dropped below the 0.8635 support to move into a negative zone against the Swiss Franc.
The bears pushed the pair below the 50-hour simple moving average and 0.8600. Finally, the bulls appeared near the 0.8520 level. A low was formed near 0.8520 and the pair is now consolidating losses.
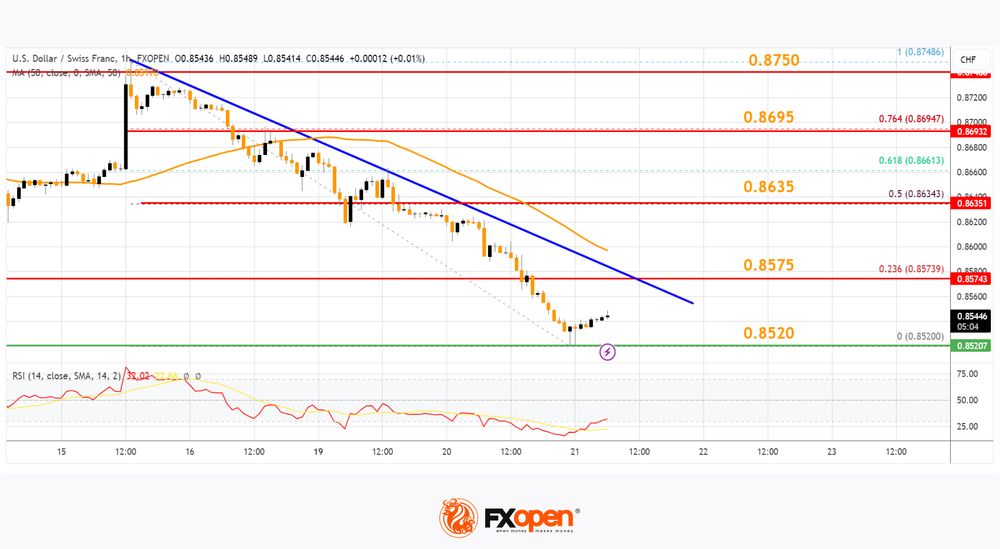
On the upside, the pair could face resistance near the 23.6% Fib retracement level of the downward move from the 0.8748 swing high to the 0.8520 low at 0.8575. There is also a major bearish trend line forming with resistance near 0.8575.
The next major resistance is near the 50% Fib retracement level of the downward move from the 0.8748 swing high to the 0.8520 low at 0.8635.
If there is a clear break above the 0.8635 resistance zone, the pair could start another increase. In the stated case, it could even surpass 0.8695.
On the downside, immediate support on the USD/CHF chart is 0.8520. The first major support is near the 0.8500 level. The next major support is near 0.8480. Any more losses may possibly open the doors for a move toward the 0.8450 level in the coming days.
Trade over 50 forex markets 24 hours a day with FXOpen. Take advantage of low commissions, deep liquidity, and spreads from 0.0 pips. Open your FXOpen account now or learn more about trading forex with FXOpen.
This article represents the opinion of the Companies operating under the FXOpen brand only. It is not to be construed as an offer, solicitation, or recommendation with respect to products and services provided by the Companies operating under the FXOpen brand, nor is it to be considered financial advice.
XAU/USD Outlook: Gold Price Consolidating Under New Record High, Ahead FOMC Minutes
Gold keeps firm tone and consolidating under new record high ($2531) posted on Tuesday, with third consecutive daily close above $2500 level, pointing to clear break.
The yellow metal holds in a steep multi-month uptrend and has registered gains of nearly 22% since the start of the year.
Strong migration into safety on Fed rate cut expectations, geopolitical tensions, uncertainty over economic situation in the US and upcoming US Presidential Election, continued to lift gold price, which rose by almost $500 in seven months of 2024.
Technical picture is firmly bullish on daily chart and contributes to positive outlook, though some price adjustment cannot be ruled out on overbought conditions and fading bullish momentum on daily chart.
Markets widely expect dovish tones from FOMC minutes (due today) and Friday’s speech from Fed Chair Powell, which will also provide more details about the depth of rate cuts.
Limited dips are likely to mark positioning for fresh push higher, with solid supports at $2500/$2483 (psychological / former top) to ideally contain and offer better buying opportunities.
Caution on drop below rising 10DMA ($2473) which may generate an initial signal of stronger correction and expose lower pivots at $2439/32 (20DMA / Aug 15 higher low).
Res: 2531; 2564; 2600; 2614.
Sup: 2500; 2483; 2473; 2450.
NZDUSD Hits Fresh 2-month High
- NZDUSD stages a V-shaped recovery from 2024 low
- The pair jumps above 200-day SMA to its highest since June 14
- Oscillators improve notably, suggesting increasing bullish bias
NZDUSD has been steadily regaining ground since the beginning of the month after finding its footing at a fresh 2024 low of 0.5848. In the near term, the pair sliced through its 200-day simple moving average (SMA) to post a fresh two-month high on Wednesday.
Should the recovery extend further, immediate resistance could be found at 0.6170, which is the 61.8% Fibonacci retracement of the 0.6368-0.5851 downleg. Conquering this barricade, the bulls may attack the June peak of 0.6220. Even higher, the 78.6% Fibo of 0.6257 may curb further upside attempts.
Alternatively, bearish actions could send the pair lower towards the 50.0% Fibo of 0.6109. A violation of that zone could set the stage for the 38.2% Fibo of 0.6048, which held strong both in January and June. Sliding beneath that floor, the price may then test the 23.6% Fibo of 0.5972.
Overall, NZDUSD’s rebound seems to be gaining steam, while the break above the 200-day SMA has further improved the technical picture. Moving forward, a test of the June peak of 0.6220 might be the next turning point for the pair.
USDJPY Rises But Still in Negative Territory
- USDJPY remains below 200-day SMA and uptrend line
- RSI ticks higher reflecting the latest move
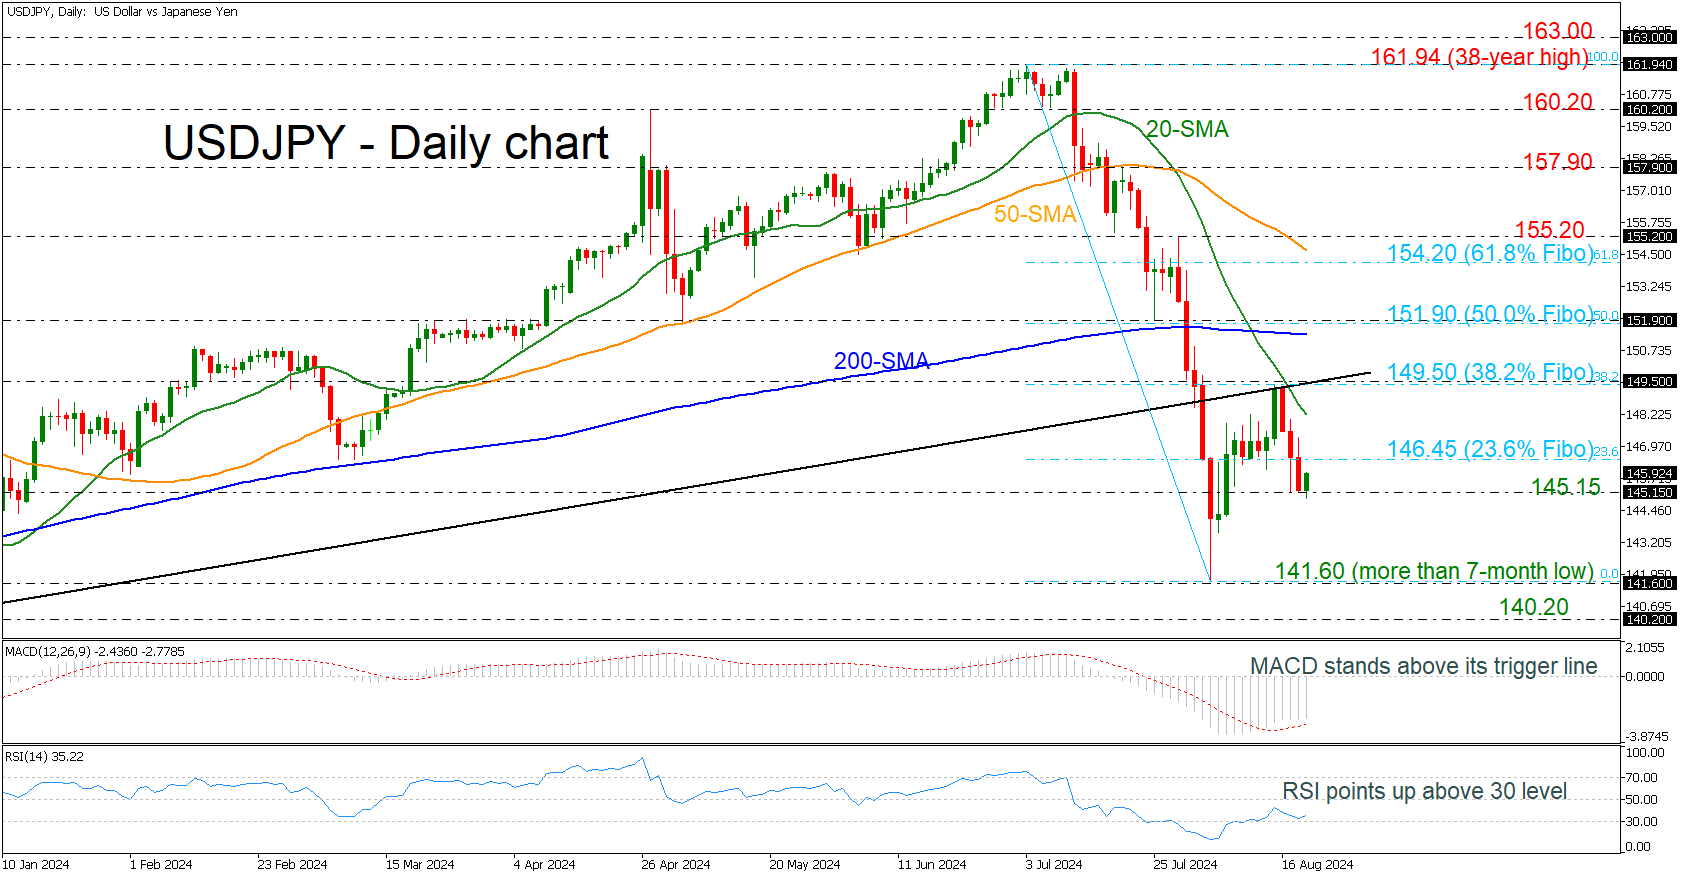
USDJPY is gaining some ground after three consecutive red days and losing around 3% from the 149.50 resistance level. The market has been trading beneath the long-term ascending trend line since the downfall at the beginning of August and more importantly is holding below the 200-day simple moving average (SMA).
Switching to technical oscillators, the MACD is holding in the negative region but rose above its trigger line, while the RSI is pointing upwards, mirroring the latest upside move.
If the market overcomes the 23.6% Fibonacci retracement level of the down leg from 161.94 to 141.60 at 146.45 then may find first resistance at the 20-day SMA currently at 148.20 before challenging the previous peak at the 38.2% Fibonacci of 149.50.
Alternatively, a drop below the 145.15 immediate support could drive traders until the more-than-seven-month low of 141.60 and the 140.20 trough, achieved on December 28.
Summarizing, USDJPY has been demonstrating a descending movement, especially after the break of the 200-day SMA, and only a climb above the 61.8% Fibonacci mark of 154.20 could change the outlook back to a positive one.