
Sample Category Title
Yen Heads for a New Round of Growth
Since the end of last week, the Yen has regained ground against the Dollar and the Euro in what looks like a new round of appreciation. So far, this seems to be an independent theme for the Yen’s rise, without any deterioration in sentiment in the equity and bond markets.
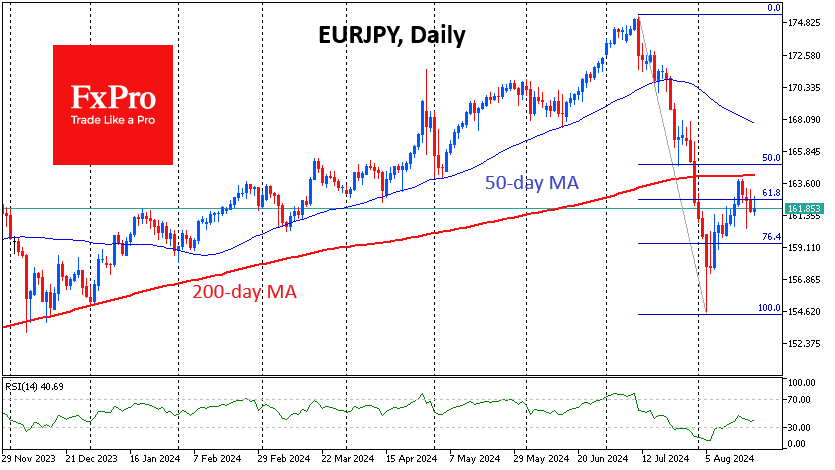
EURJPY plunged from a peak above 175 to 155 in just 17 trading days to the 5th of August, breaking the 50- and 200-day moving averages in powerful moves on the way down. The subsequent rebound lost strength as it approached the 200-day moving average and the 61.8% Fibonacci retracement level from the initial collapse.
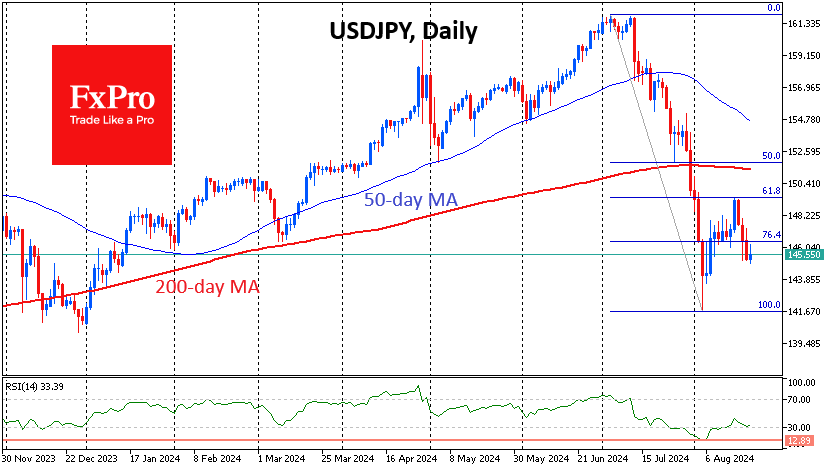
The USDJPY rebound was even less pronounced, failing to reach even the 61.8% level near 149.50 from the 162 to 142 drops.
A little over two weeks ago, the rise of the Yen was halted without the help of the Bank of Japan, whose officials said they would not raise interest rates during the volatile period. The rebound in equity indices and the sharp drop in volatility are reviving speculation about a rate hike in Japan, which contrasts with the high confidence in the ECB and the Fed easing as early as next month.
We would not be surprised to see the euro and the dollar return to local lows against the Yen of 155 and 142, respectively.
EUR/USD Outlook: Bulls Taking a Breather Under New 2024 High, Eye Fresh Signals from Fed
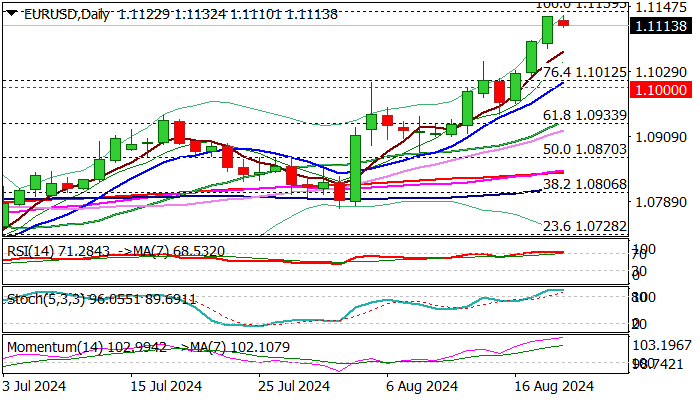
EURUSD reduced speed after steep rally in past three days which hit new 2024 top (1.1132) just ticks ahead of Dec 2023 top (1.1139).
The single currency continues to benefit from risk appetite and weak dollar on Fed rate cut expectations, with release of FOMC minutes today, to shed more light on the depth of policy easing.
Overextended daily indicators signal that larger bulls may pause for consolidation, with dips likely to be shallow on firmly bullish sentiment, while dovish Fed minutes to add fresh support. Breach of 1.1139 pivot to open way for attack at 2023 peak (1.1275).
Alternative scenario sees less dovish than expected stance of Fed as a trigger for Euro’s deeper drop, with loss of 1.10 support zone (10DMA / psychological) to risk downside acceleration
Res: 1.1132; 1.1139; 1.1220; 1.1275.
Sup: 1.1072; 1.1021; 1.1000; 1.0949.
Sunset Market Commentary
Markets
The ‘waiting game’ continued today in Europe and at the onset of the US trading session, counting down in the first place to today’s BLS payrolls revisions and to the Minutes of the Fed July 31 policy meeting later today. Even the $16 bn sale of 20-y US Treasuries might provide some insight on investors’ appetite for long maturity fixed income after the recent sharp market repositioning. On Friday and earlier this week, the absence of any news mostly resulted in a by default decline in core (US end EMU) bond yields and a weaker dollar. There was no trend reversal today, but the decline in US yields took a breather today (changes less than 2 bps across the US yield curve). Especially the long end of the US yield curve is nearing key support (US 10-y yield 3.78/3.80% area; US 30-y yield 4.05%/4.0% area). The 2-y yield is still some way off the low levels touched earlier this month. Even so, the 4% big figure maybe also triggers some caution. German Bunds marginally outperform Treasuries today further easing between 2.5 bps (2-y) and unchanged levels (30-y). Similar story for the dollar. After tentatively testing YTD lows near 101.25/35 this morning the DXY TW US index also shifted to a ST wait-and-see stance (101.45 area). EUR/USD is holding north of 1.11 with the 1.1139 December top still within reach. After a pause yesterday in the US, major equity indices showed minor gains in the run-up to the BLS labour data revision. (Eurostoxx +0.5%, S&P 500 +0.2%)
The UK budget data usually are no market mover and this was also the case today. Even so, public sector net borrowing in July again came out higher than expected (£3.1bn) and the April-July budget deficit also stays higher than the March OBR projections. It illustrates limited room for the new government to support growth. Ceteris paribus, this in theory at some point suggests a potentially bigger role for monetary policy, but the market understandably didn’t react to volatile monthly data. Gilts even marginally underperformed Bunds. Sterling gained marginally against the euro (EUR/GBP 0.853). For now, the EUR/GBP 0.85 intermediate support holds.
News & Views
The first set of hard Polish eco data from the third quarter provided a mixed picture as industrial production fell 0.2% M/M and employment growth (+0.1% M/M) remained negative in Y/Y terms in July (-0.4%). However, it will be July’s retail sales and construction activity data (posted on Friday) which will indicate whether the economy has kept its strong momentum from the 2nd quarter or not. Recall that last week’s Polish GDP release showed a significant upward surprise with the economy growing briskly: 1.5% Q/Q which translates into 3.2% growth in Y/Y terms. Moreover, there has been an upward revision of the first quarter GDP reading (from 0.5% Q/Q to 0.8%), triggering upward revisions to estimates for the 2024 annual figure as well.
Data from the energy industry group Gas Infrastructure Europe showed that European gas storage hit the 90% marker. That’s more than two months faster than the EU’s November 1 deadline of meeting that bar. Last year around, storage sites had even slightly more inventories. They help offset supply risks. Benchmark gas futures (Dutch TTF) continue hovering near their lowest levels since early August (€37.66/MWh).
Graphs
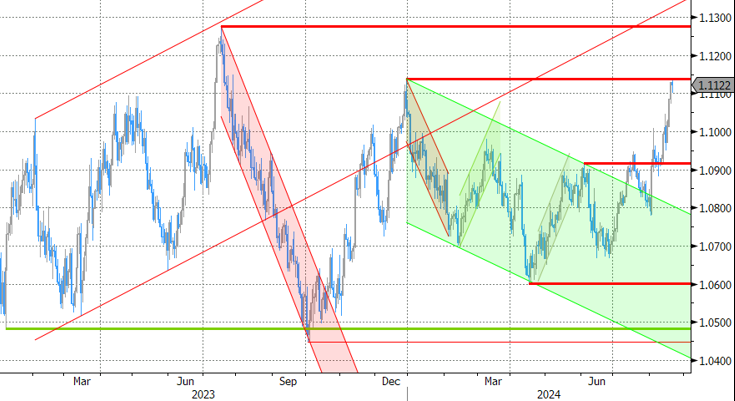
EUR/USD nears key 1.1139 resistance as dollar remains in the defensive.
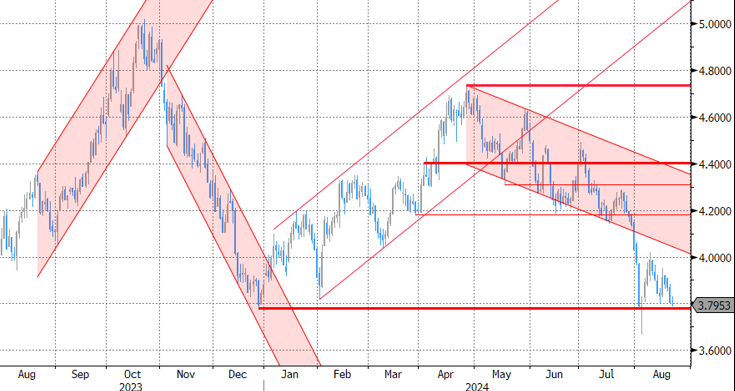
US 10-y yield testing 3.78/3/80% support
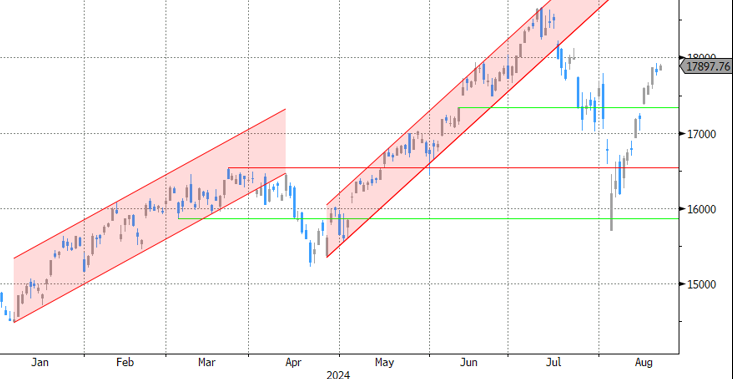
Nasdaq: risk rally slows.
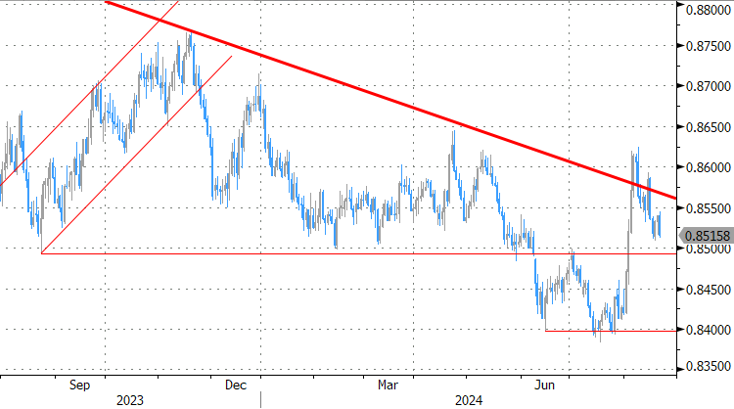
EUR/GBP:sterling looking for direction. 0.85 support holds for now
GBP/USD Hits 1-Month High, UK PMIs Next
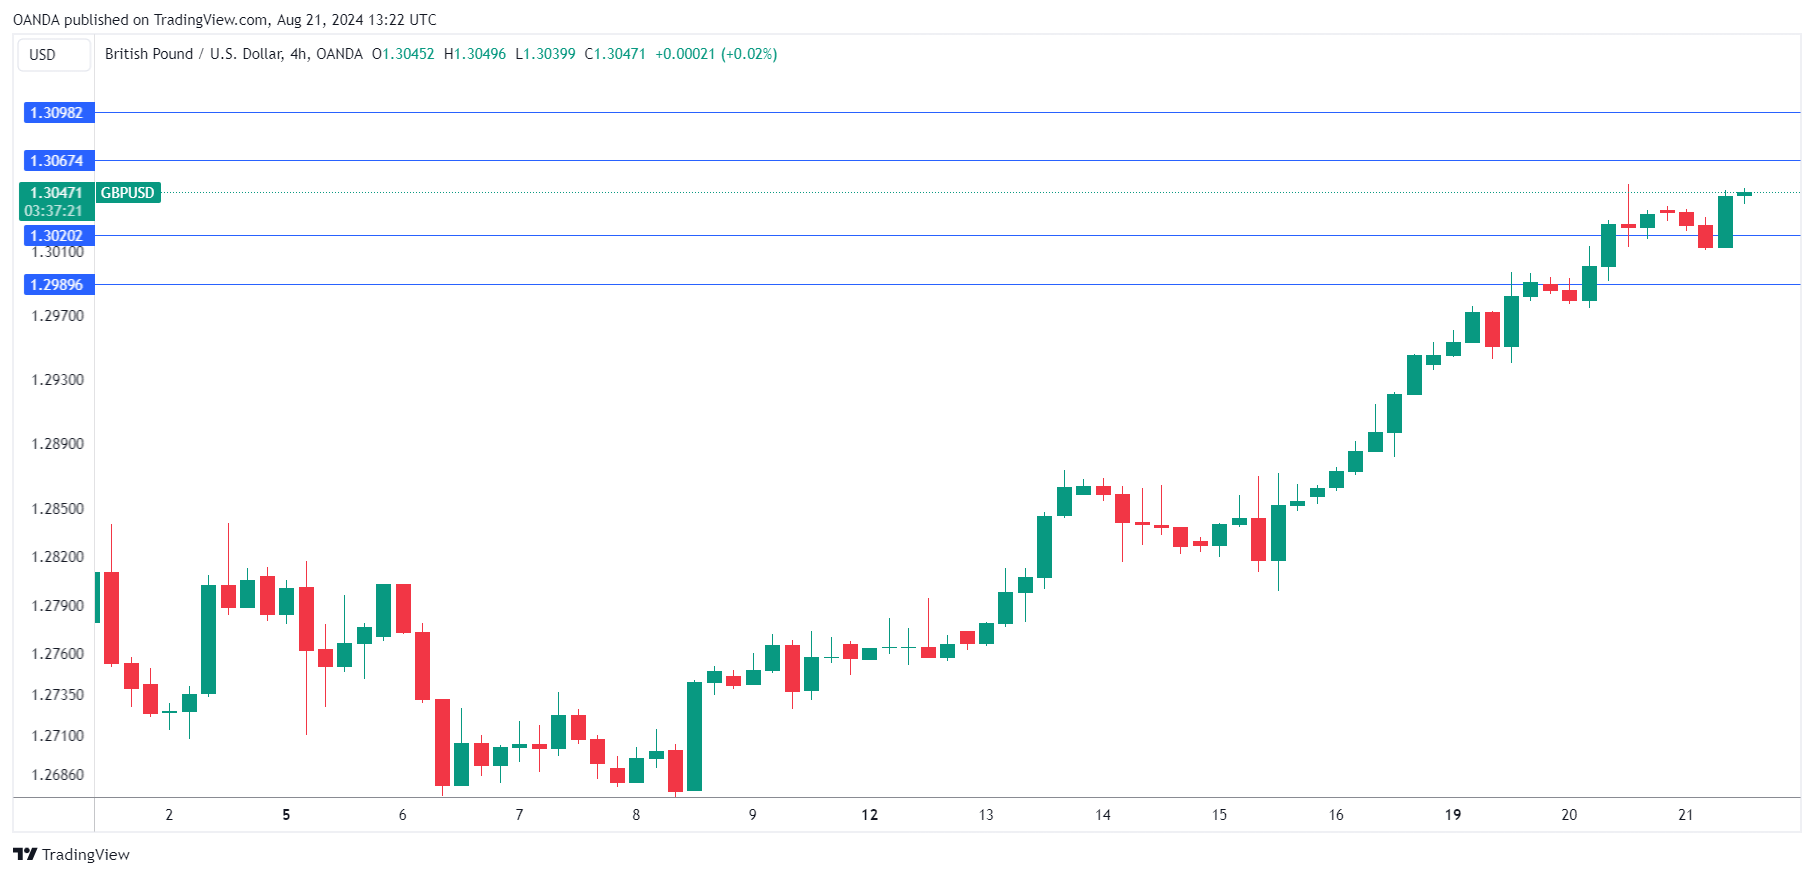
The British pound is showing limited movement on Wednesday, after a four-day rally in which it surged 1.7% against the retreating US dollar. GBP/USD is trading at 1.3047 in the North American session at the time of writing, up 0.1% on the day.
All eyes on Jerome Powell
The annual meeting at Jackson Hole has added significance this year as the Federal Reserve is expected to deliver a milestone rate cut in September. Fed Chair Powell will address the gathering on Friday and investors will be looking for clues about the anticipated September move.
The Fed last cut rates in March 2020, early in the Covid pandemic. The Fed has maintained its benchmark rate at 5.25% -5.5% for over a year and all signals point to an initial rate cut at the September 18 meeting.
The most likely scenario is a quarter-point cut but earlier this month the financial markets were routed and expectations for a large half-point cut soared. Now that the markets have recovered, a quarter-point cut is once again the most likely scenario.
With inflation under control, the Fed is keeping a close eye on the US labor market, which may be cooling too fast for the Fed. The July employment report showed a sharp drop in nonfarm payrolls and a rise in unemployment and the financial markets went into panic mode. Powell is sure to touch upon employment and inflation in his speech on Friday and his take on the economic outlook could move the US dollar.
The UK will release the July PMI report on Thursday. The manufacturing and services sectors are both showing growth, as the UK economic picture has improved. The services PMI is expected to inch upwards to 52.9, up from 52.8 in June. Manufacturing has been accelerated for three straight months but the PMI is projected to remain at 52.1. We’ll hear from Bank of England Governor Bailey on Friday at the Jackson Hole symposium.
GBP/USD Technical
- GBP/USD tested support at 1.3020 earlier. Below, there is support at 1.2989
- 1.3067 and 1.3098 are the next resistance lines.
USD/JPY Mid-Day Outlook
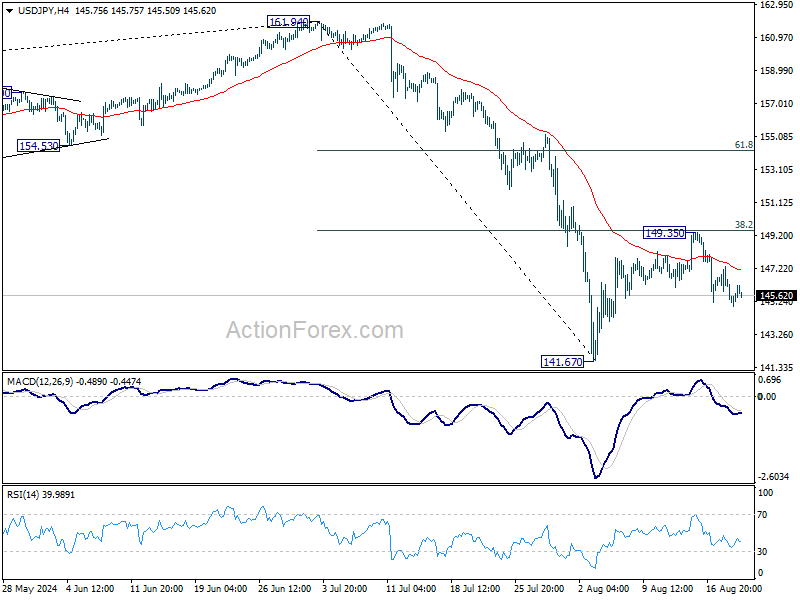
Daily Pivots: (S1) 144.53; (P) 145.94; (R1) 146.67; More...
Intraday bias in USD/JPY remains mildly on the downside for the moment. Rebound from 141.67 could have completed at 149.35 after rejection by 38.2% retracement of 161.94 to 141.67 at 149.41. Deeper fall would be seen to retest 141.67 low. Firm break there will resume the whole fall from 161.94 to 139.26 fibonacci level next. For now, risk will stay on the downside as long as 149.35 resistance holds, in case of recovery.
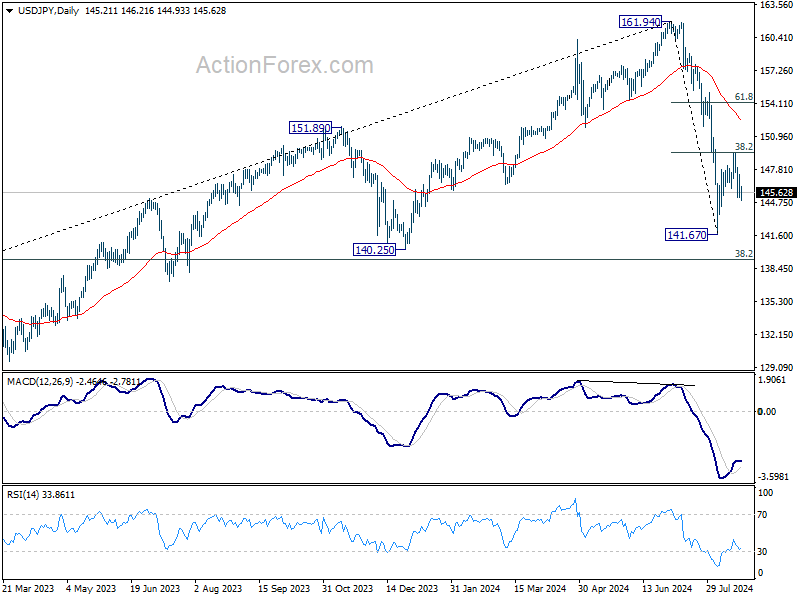
In the bigger picture, fall from 161.94 medium term is seen as correcting whole up trend from 102.58 (2021 low). Deeper decline could be seen to 38.2% retracement of 102.58 to 161.94 at 139.26, which is close to 140.25 support. In any case, risk will stay on the downside as long as 55 W EMA (now at 149.63) holds. Nevertheless, firm break of 55 W EMA will suggest that the range for medium term corrective pattern is already set.
USD/CHF Mid-Day Outlook
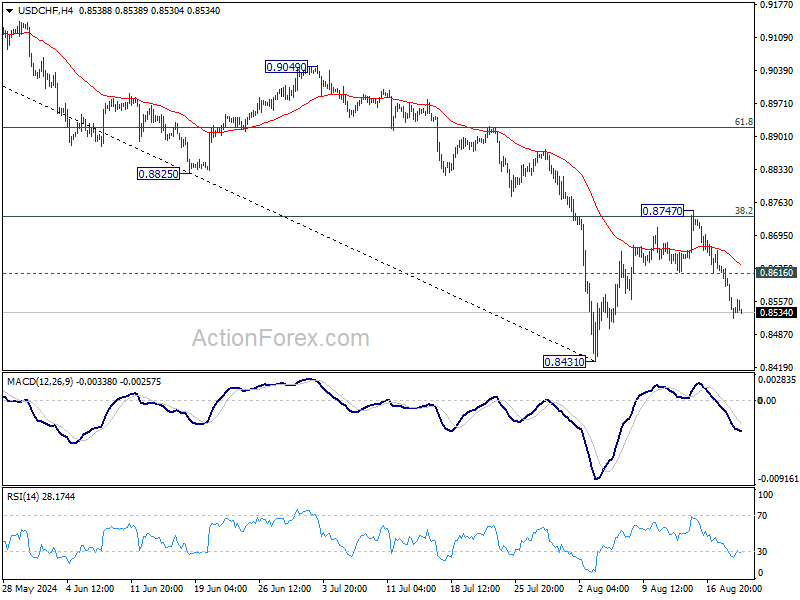
Daily Pivots: (S1) 0.8507; (P) 0.8572; (R1) 0.8605; More…..
USD/CHF's fall from 0.8747 is still in progress and intraday bias remains on the downside for retesting 0.8431. Firm break there will resume whole decline from 0.9223 towards 0.8332. On the upside, above 0.8616 minor resistance will turn intraday bias neutral first. But risk will stay on the downside as long as 0.8747 resistance holds, in case of recovery.
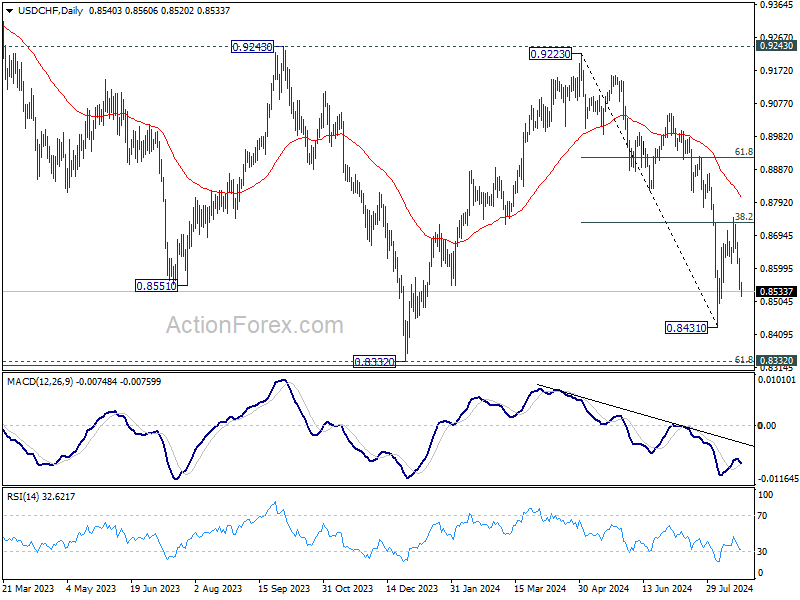
In the bigger picture, price actions from 0.8332 (2023 low) are currently seen as a medium term corrective pattern, with fall from 0.9223 as the second leg. Strong support could be seen from 0.8332 to bring rebound. Yet, overall outlook will continue to stay bearish as long as 0.9243 resistance holds. Firm break of 0.8332, however, will resume larger down trend from 1.0146 (2022 high).
GBP/USD Mid-Day Outlook
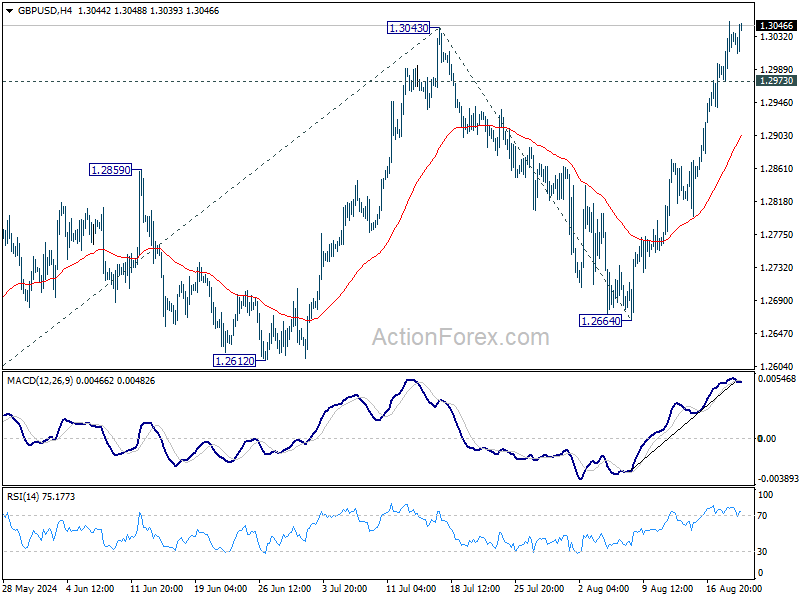
Daily Pivots: (S1) 1.2989; (P) 1.3020; (R1) 1.3067; More...
Intraday bias in GBP/USD remains on the upside with focus on 1.3043 resistance. Decisive break there will resume whole rally from 1.2998 to 61.8% projection of 1.2298 to 1.3043 from 1.2664 at 1.3124, which is close to 1.3141 high. On the downside, below 1.2973 minor support will turn intraday bias neutral first. But further rally is in favor as long as 55 4H EMA (now at 1.2899) holds, in case of retreat.
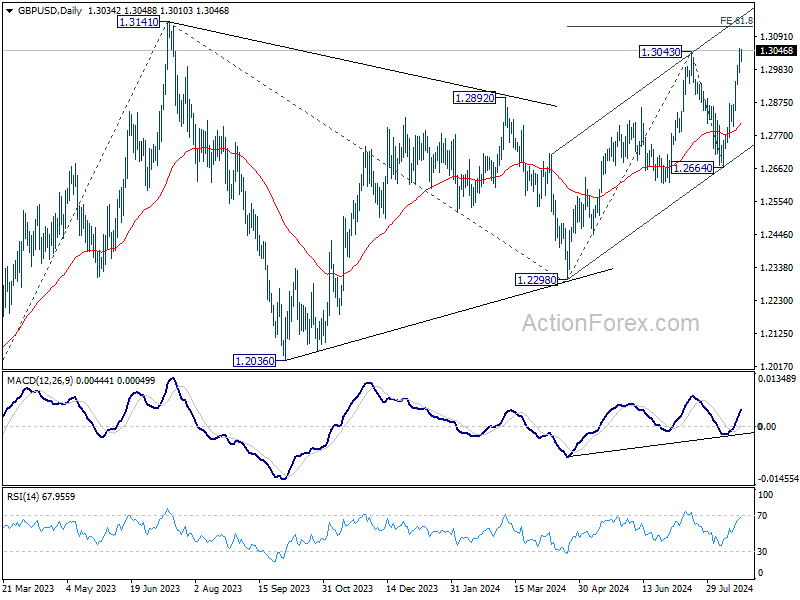
In the bigger picture, corrective pattern from 1.3141 might have completed at 1.2298 already. Rise from there could be resuming the larger up trend from 1.0351 (2022 low). Decisive break of 1.3141 will target 38.2% projection of 1.0351 to 1.3141 from 1.2298 at 1.3364 next. However, break of 1.2664 support will delay this bullish case once again and extend the corrective pattern from 1.3141.
EUR/USD Mid-Day Outlook
Daily Pivots: (S1) 1.1090; (P) 1.1112; (R1) 1.1151; More....
Intraday bias in EUR/USD remains on the upside for the moment. Firm break of 1.1138 resistance will target 161.8% projection of 1.0665 to 1.0947 from 1.0776 at 1.1232. On the downside, below 1.1071 minor support will turn intraday bias neutral and bring consolidations first. But outlook will now remain bullish as long as 1.0948 support holds.

In the bigger picture, price actions from 1.1274 are viewed as a corrective pattern that's could still extend. Break of 1.1138 resistance will be the first signal that rise from 0.9534 (2022 low) is ready to resume through 1.1274 (2023 high). However, break of 1.0776 support will extend the correction with another falling leg back towards 1.0447 support.

Dollar Continues to Struggle Amid Market Lull
The forex markets are experiencing a lull today, with little movement in the absence of significant economic releases during European and early US sessions. The much-discussed non-farm payroll revision and the release of FOMC minutes later today are unlikely to spark significant volatility. Instead, markets are likely to remain subdued until tomorrow’s PMI data from major economies, which could prompt some brief moves. However, the primary event that traders are eagerly anticipating is Fed Chair Jerome Powell’s speech at the Jackson Hole Symposium on Friday.
So far this week, Dollar remains the weakest performer, showing little sign of a sustainable recovery. Canadian Dollar is also under pressure, particularly after yesterday’s Canadian CPI data reinforced expectations for a rate cut by BoC in September. British Pound is the third worst-performing currency, though it may see a temporary boost if tomorrow’s UK PMI data surprises to the upside.
On the other hand, New Zealand Dollar has emerged as the strongest currency, continuing to recover from last week’s selloff following RBNZ’s rate cut. Swiss Franc and Japanese Yen are also performing well, likely benefiting from expectations of narrowing interest rate differentials with other major economies. Euro and Australian Dollar are trading in middle positions.
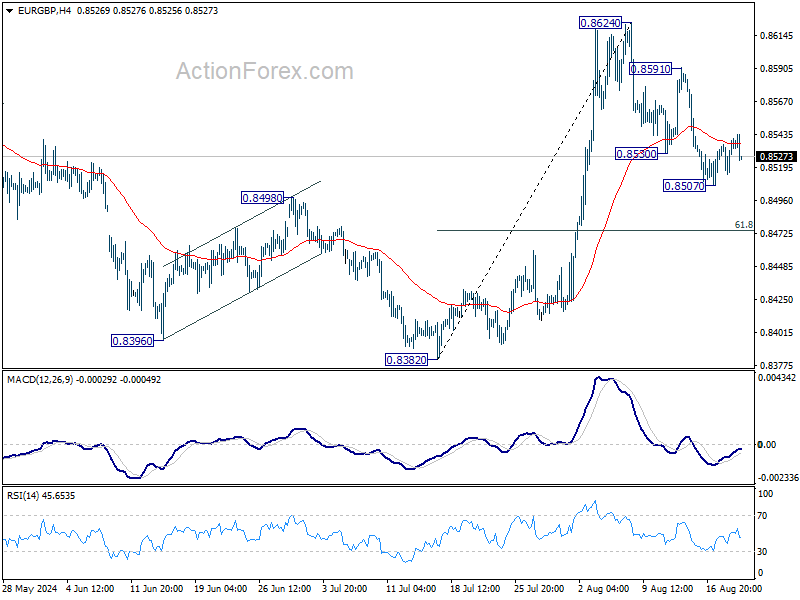
Technically, EUR/GBP's recovery from 0.8507 appears to be losing momentum after failing to sustain above 55 4H EMA. Deeper fall from current level will put near term bias back to the downside. Further break of 0.8507 will resume the pullback from 0.8624 to 61.8% retracement of 0.8382 to 0.8624 at 0.8474. in the near term.
In Europe, at the time of writing, FTSE is up 0.22%. DAX is up 0.63%. CAC is up 0.56%. UK 10-year yield is down -0.0081 at 3.911. Germany 10-year yield is down -0.0072 at 2.212. Earlier in Asia, Nikkei fell -0.29%. Hong Kong HSI fell -0.69%. China Shanghai SSE fell -0.35%. Singapore Strait Times rose 0.10%. Japan 10-year JGB yield fell -0.0256 to 0.866.
ECB's Panetta: End of monetary restriction has already begun
ECB Governing Council member Fabio Panetta indicated today that the central has entered entering a phase of monetary easing following the rate cut in June. Speaking at an event, Panetta remarked, "The end of monetary restriction has already begun," adding that discussions are ongoing regarding the ECB's next steps in September.
While Panetta refrained from sharing his specific views on the upcoming decision, he suggested that ECB is likely to continue easing monetary conditions.
"I believe it is reasonable to expect that from now on, we will move towards a phase of easing of monetary conditions," he noted, pointing to falling inflation and a slowing global economy as key factors driving this shift.
Japan's July exports value reaches record amid yen weakness
Japan's exports surged 10.3% yoy in July, reaching JPY 9,619B—a record high for the month. The growth of export value was was largely driven by the weaker yen, which marked a -12.3% depreciation from a year ago. On volume basis, exports actually declined by -5.2% yoy.
Regionally, Japan's exports to the US grew by 7.3%, a slight deceleration from the previous month. Exports to China remained steady with a 7.2% increase, while shipments to the EU saw a decline of -5.3%.
On the import side, Japan recorded a 16.6% yoy increase, bringing the total to JPY 10,241B—the largest ever for July. As a result, the trade balance showed a deficit of JPY -622 B.
In seasonally adjusted terms, exports rose 1.7% mom to JPY 9,137B, while imports increased by 0.9% mom to JPY 9,893B, leading to a seasonally adjusted trade deficit of JPY -755B.
Australia's Westpac leading index points to modest growth, but sustainability in doubt
Australia's six-month annualized growth rate in the Westpac–Melbourne Institute Leading Index inched up to +0.06%, signaling a slight improvement in economic momentum.
However, Westpac cautioned that this positive signal may not be sustained due to "sharp falls in commodity prices." The detailed report highlights that the economy is facing "significant cross-currents," with economic activity improving but expected to remain "below trend into early 2025."
As RBA gears up for its next meeting on September 23–24, Westpac emphasized the importance of the upcoming June quarter national accounts, set to be released on September 4. These figures are expected to shed light on the strength of domestic demand and could ease some of the RBA's concerns regarding productivity growth.
However, Westpac noted that there is little chance of a policy shift at the September meeting, as the next quarterly CPI update isn't due until October 30.
EUR/USD Mid-Day Outlook
Daily Pivots: (S1) 1.1090; (P) 1.1112; (R1) 1.1151; More....
Intraday bias in EUR/USD remains on the upside for the moment. Firm break of 1.1138 resistance will target 161.8% projection of 1.0665 to 1.0947 from 1.0776 at 1.1232. On the downside, below 1.1071 minor support will turn intraday bias neutral and bring consolidations first. But outlook will now remain bullish as long as 1.0948 support holds.
In the bigger picture, price actions from 1.1274 are viewed as a corrective pattern that's could still extend. Break of 1.1138 resistance will be the first signal that rise from 0.9534 (2022 low) is ready to resume through 1.1274 (2023 high). However, break of 1.0776 support will extend the correction with another falling leg back towards 1.0447 support.
Economic Indicators Update
| GMT | Ccy | Events | Actual | Forecast | Previous | Revised |
|---|---|---|---|---|---|---|
| 23:50 | JPY | Trade Balance (JPY) Jul | -0.76T | -0.76T | -0.82T | |
| 01:00 | AUD | Westpac Leading Index M/M Jul | 0.00% | 0.00% | ||
| 06:00 | GBP | Public Sector Net Borrowing (GBP) Jul | 2.2B | 0.5B | 13.6B | 12.6B |
| 12:30 | CAD | Industrial Product Price M/M Jul | 0.00% | -0.50% | 0.00% | |
| 12:30 | CAD | Raw Material Price Index Jul | 0.70% | -0.90% | -1.40% | |
| 14:30 | USD | Crude Oil Inventories | -2.0M | 1.4M | ||
| 18:00 | USD | FOMC Minutes |
ECB’s Panetta: End of monetary restriction has already begun
ECB Governing Council member Fabio Panetta indicated today that the central has entered entering a phase of monetary easing following the rate cut in June. Speaking at an event, Panetta remarked, "The end of monetary restriction has already begun," adding that discussions are ongoing regarding the ECB's next steps in September.
While Panetta refrained from sharing his specific views on the upcoming decision, he suggested that ECB is likely to continue easing monetary conditions.
"I believe it is reasonable to expect that from now on, we will move towards a phase of easing of monetary conditions," he noted, pointing to falling inflation and a slowing global economy as key factors driving this shift.