Sample Category Title
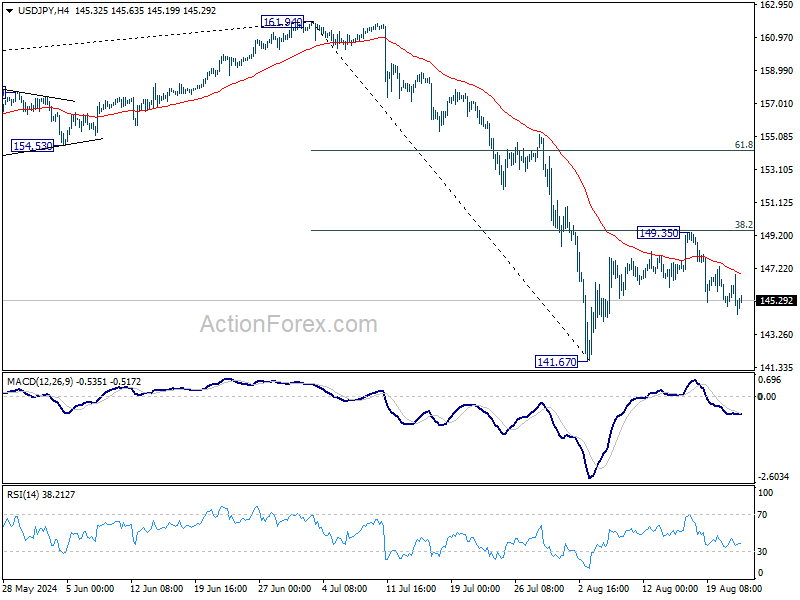
USD/JPY Daily Outlook
Daily Pivots: (S1) 144.19; (P) 145.55; (R1) 146.63; More...
USD/JPY's fall from 149.35 is still in progress despite weak momentum. Intraday bias stays on the downside for retesting 141.67 low. Firm break there will resume the whole fall from 161.94 to 139.26 fibonacci level next. For now, risk will stay on the downside as long as 149.35 resistance holds, in case of recovery.
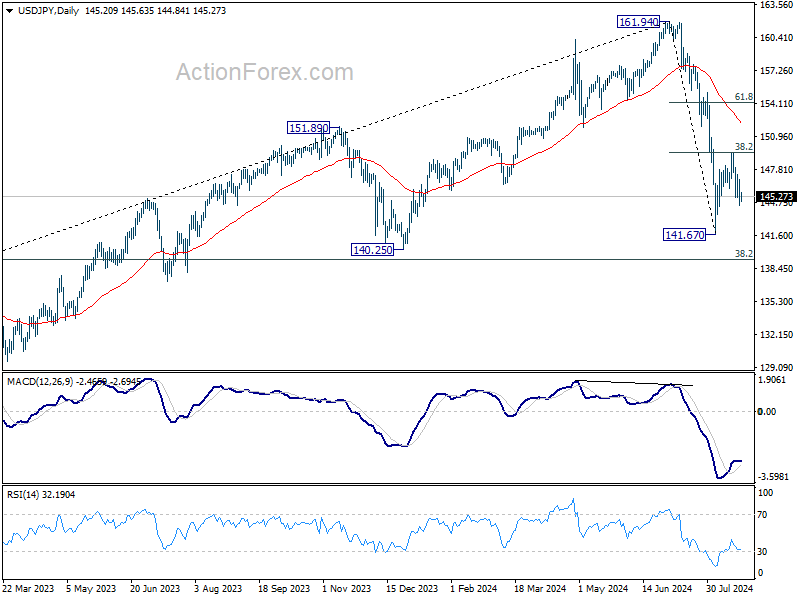
In the bigger picture, fall from 161.94 medium term is seen as correcting whole up trend from 102.58 (2021 low). Deeper decline could be seen to 38.2% retracement of 102.58 to 161.94 at 139.26, which is close to 140.25 support. In any case, risk will stay on the downside as long as 55 W EMA (now at 149.63) holds. Nevertheless, firm break of 55 W EMA will suggest that the range for medium term corrective pattern is already set.
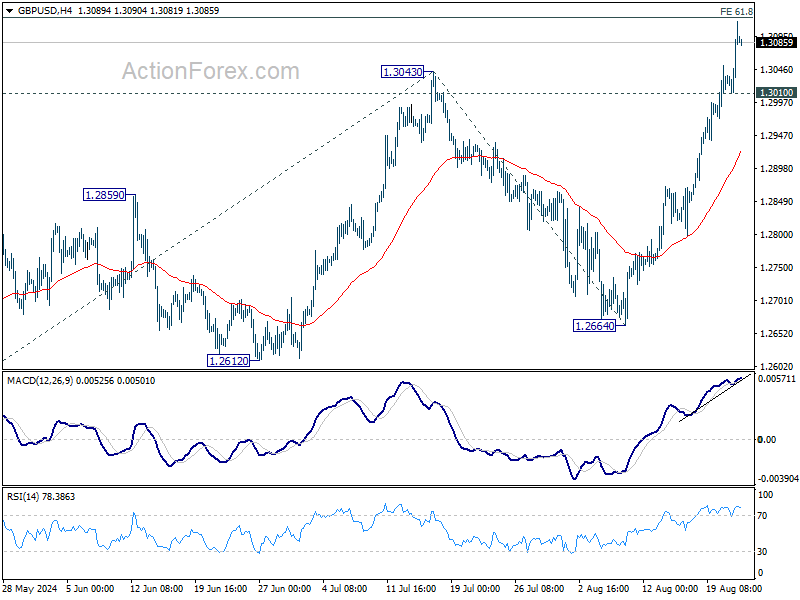
GBP/USD Daily Outlook
Daily Pivots: (S1) 1.3028; (P) 1.3074; (R1) 1.3137; More...
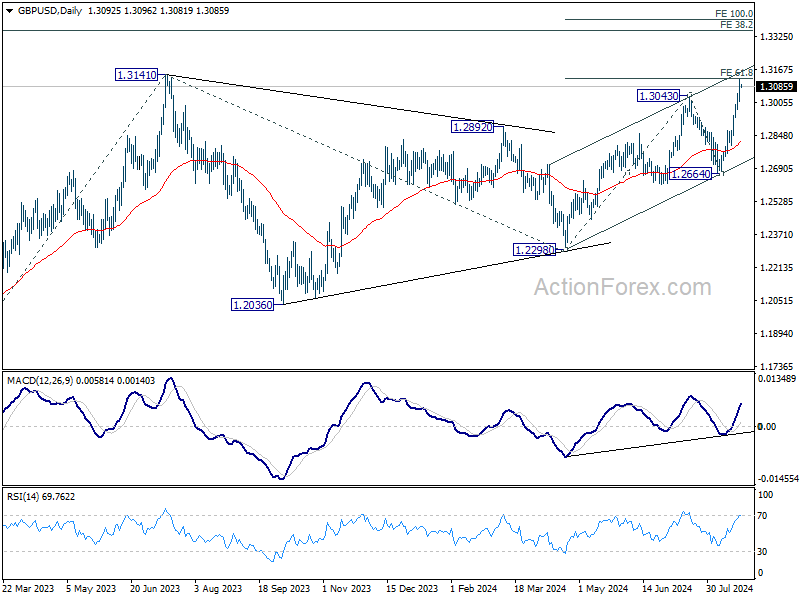
GBP/USD's firm break of 1.3043 confirms resumption of whole rally from 1.2998. Intraday bias stays on the upside for 61.8% projection of 1.2298 to 1.3043 from 1.2664 at 1.3124, which is close to 1.3141 high. Decisive break there will confirm larger up trend resumption for 100% projection at 1.3409. On the downside, below 1.3010 minor support will turn intraday bias neutral and bring consolidations first, before staging another rally.
In the bigger picture, corrective pattern from 1.3141 might have completed at 1.2298 already. Rise from there could be resuming the larger up trend from 1.0351 (2022 low). Decisive break of 1.3141 will target 38.2% projection of 1.0351 to 1.3141 from 1.2298 at 1.3364 next. However, break of 1.2664 support will delay this bullish case once again and extend the corrective pattern from 1.3141.
USD/CHF Daily Outlook
Daily Pivots: (S1) 0.8487; (P) 0.8525; (R1) 0.8554; More…..
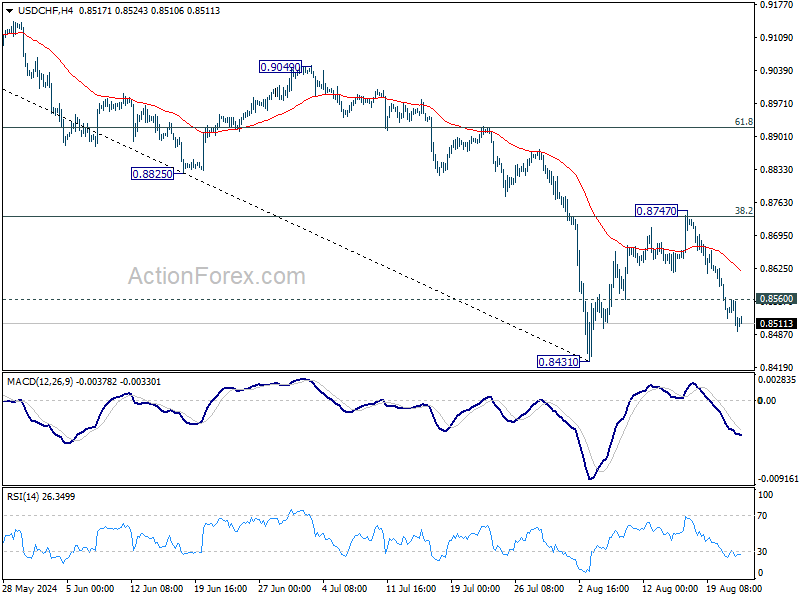
Intraday bias in USD/CHF remains on the downside as fall from 0.8747 is in progress for retesting 0.8431. Firm break there will resume whole decline from 0.9223 towards 0.8332 low. On the upside, above 0.8560 minor resistance will turn intraday bias neutral first. But risk will stay on the downside as long as 0.8747 resistance holds, in case of recovery.
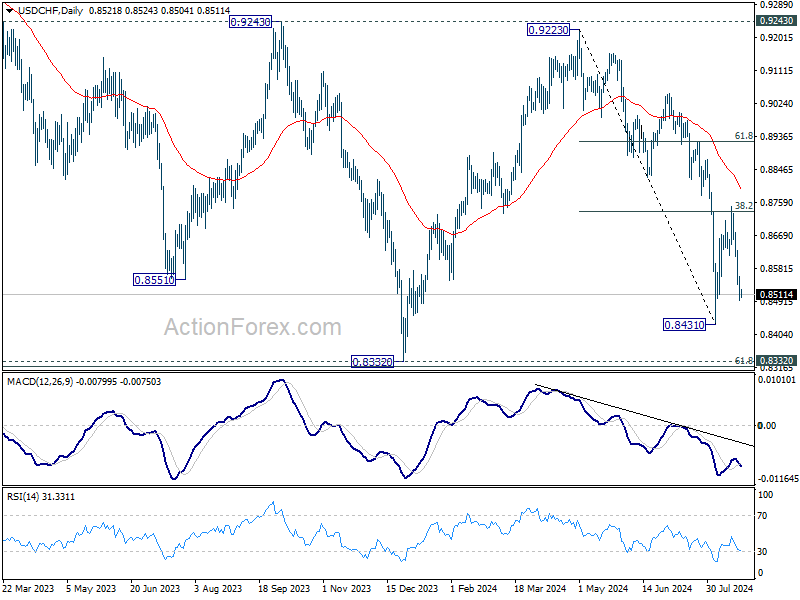
In the bigger picture, price actions from 0.8332 (2023 low) are currently seen as a medium term corrective pattern, with fall from 0.9223 as the second leg. Strong support could be seen from 0.8332 to bring rebound. Yet, overall outlook will continue to stay bearish as long as 0.9243 resistance holds. Firm break of 0.8332, however, will resume larger down trend from 1.0146 (2022 high).
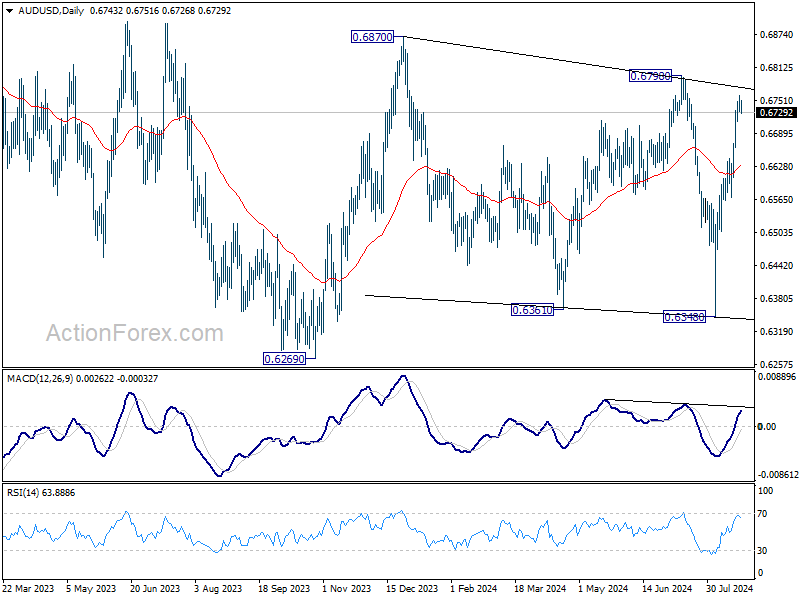
AUD/USD Daily Report
Daily Pivots: (S1) 0.6730; (P) 0.6745; (R1) 0.6760; More...
A temporary top should be in place at 0.6760 in AUD/USD with 4H MACD crossed below signal line. Intraday bias is turned neutral for consolidations first. Downside of retreat should be contained by 55 4H EMA (now at 0.6664) to bring rebound. Above 0.6760 will target 0.6798 resistance next. Firm break there will argue that larger rise from 0.6269 is ready to resume through 0.6870 resistance.
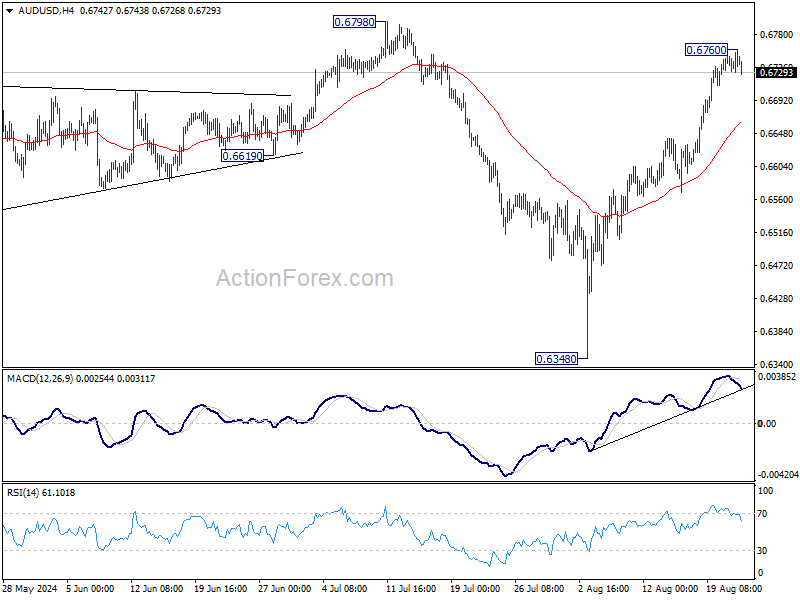
In the bigger picture, overall, price actions from 0.6169 (2022 low) are seen as a medium term corrective pattern. Rise from 0.6340 is likely developing into another rising leg. Firm break of 0.6798/6870 resistance zone will target 0.7156 resistance. In case of another fall, strong support should be seen from 0.6169/6361 to bring rebound.
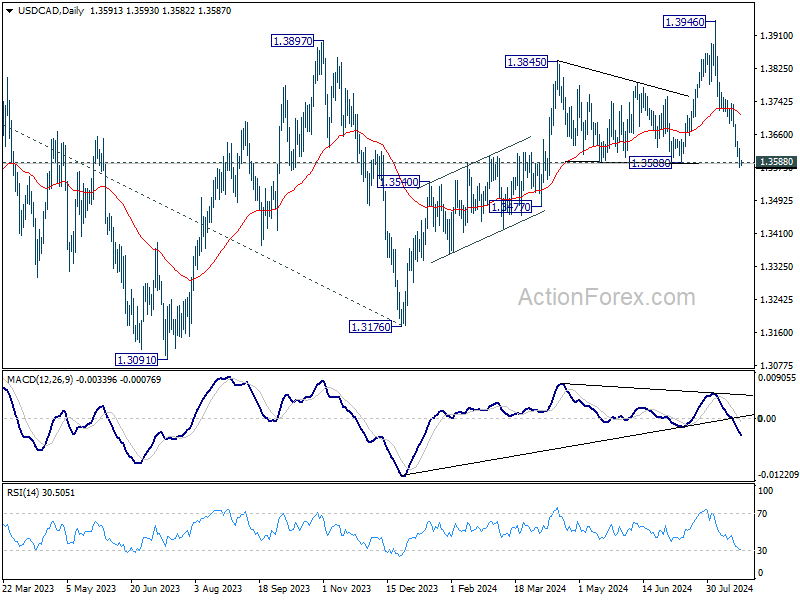
USD/CAD Daily Outlook
Daily Pivots: (S1) 1.3566; (P) 1.3604; (R1) 1.3631; More...
Immediate focus is now on 1.3588 structural support as fall from 1.3946 extended. Strong support could be seen there to bring reversal. On the upside, above 1.3640 minor resistance will turn intraday bias back to the upside for stronger rebound. However, decisive break of 1.3588 will argue that rise from 1.3176 has completed at 1.3946 and target 1.3477 support next.
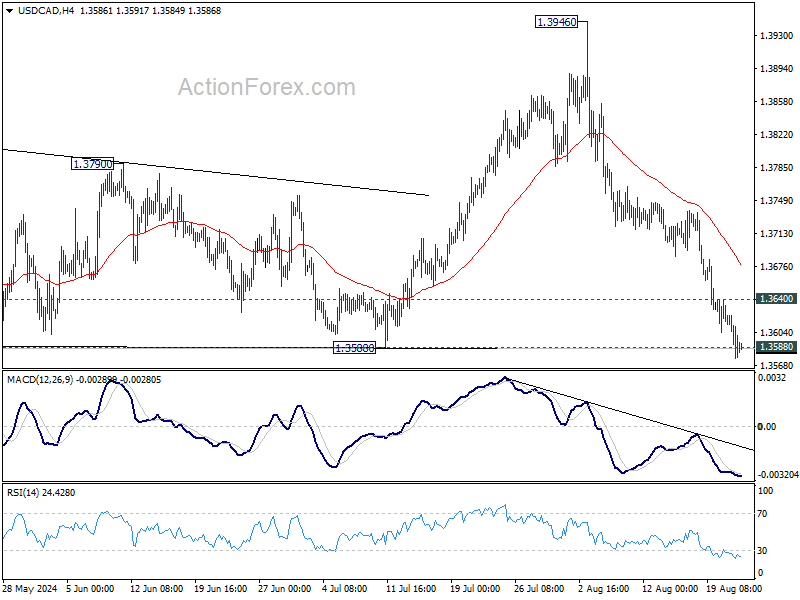
In the bigger picture, price actions from 1.3976 (2022 high) are viewed as a corrective pattern, that might have completed at 1.3176 (2023 low) already. Firm break of 1.3976 will confirm resumption of whole up trend from 1.2005 (2021 low). Next target is 61.8% projection of 1.2401 to 1.3976 from 1.3176 at 1.4149. This will be the favored case as long as 1.3588 support holds, in case of pullback. However, firm break of 1.3588 will argue that consolidation from 1.3976 is already extending with another falling leg back towards 1.3091/3176 support zone.
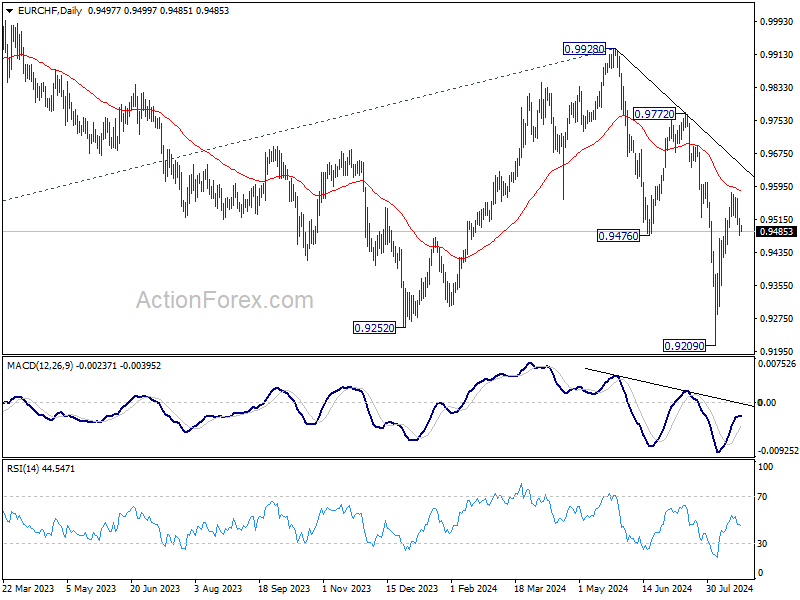
EUR/CHF Daily Outlook
Daily Pivots: (S1) 0.9475; (P) 0.9500; (R1) 0.9523; More....
EUR/CHF is staying in consolidation below 0.9579 and intraday bias remains neutral for the moment. Further rally is expected as long as 0.9448 support holds. Sustained break of 55 D EMA (now at 0.9581) will pave the way back to 0.9972/0.9928 resistance zone. However, decisive break of 0.9448 will suggest rejection by 55 D EMA, and turn bias back to the downside for 0.9209 low.
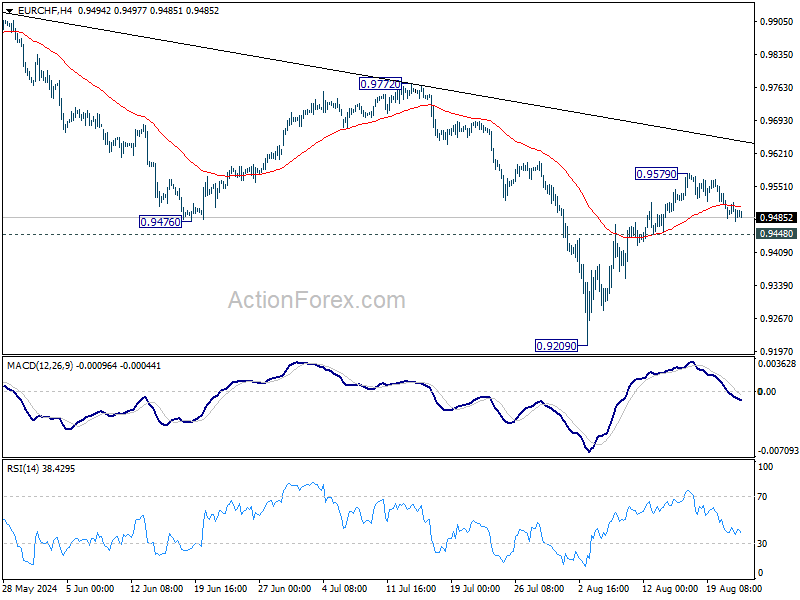
In the bigger picture, medium term corrective pattern from 0.9407 (2022 low) might have completed with three waves to 0.9928. Decisive break of 0.9252 (2023 low) will confirm long term down trend resumption. Next target will be 61.8% projection of 1.1149 to 0.9407 from 0.9928 at 0.8851. For now, outlook will stay bearish as long as 0.9928 resistance holds, even in case of strong rebound.
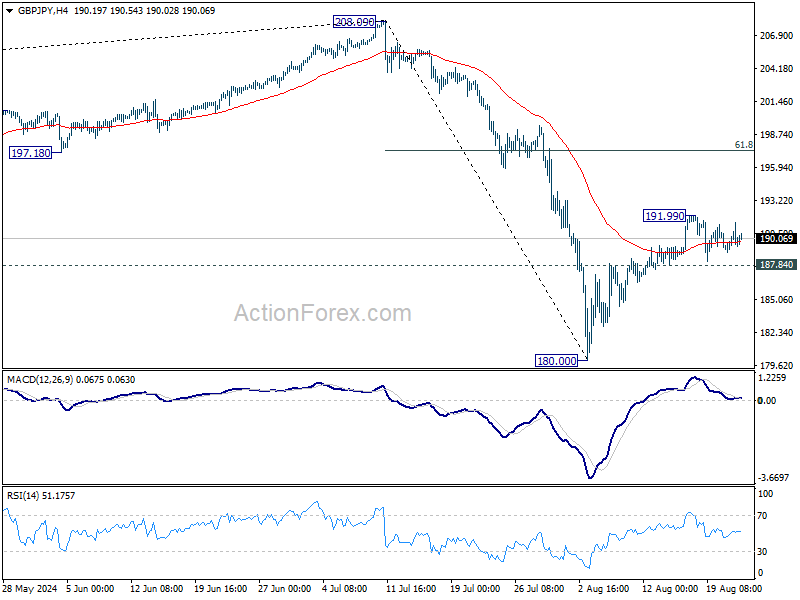
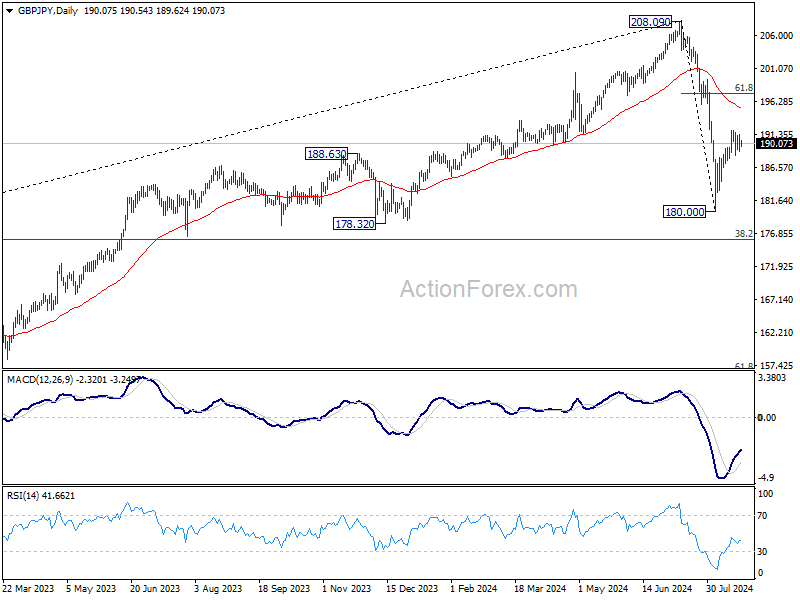
GBP/JPY Daily Outlook
Daily Pivots: (S1) 188.92; (P) 190.21; (R1) 191.47; More...
Range trading continues in GBP/JPY below 191.99 and intraday bias remains neutral. On the upside, above 191.99 will resume the rally from 180.00, and target 61.8% retracement of 208.09 to 180.00 at 197.35, as the second leg of the corrective pattern from 208.09. On the downside, however, firm break of 187.84 support will argue that rebound from 180.00 has completed, and turn bias back to the downside for retesting 180.00 instead.
In the bigger picture, price actions from 208.09 are seen as a correction to whole rally from 123.94 (2020 low). Current development suggests that the first leg has completed and the range of medium term consolidation should be set between 38.2% retracement of 123.94 to 208.09 at 175.94 and 208.09.
EUR/JPY Daily Outlook
Daily Pivots: (S1) 161.25; (P) 162.09; (R1) 162.82; More....
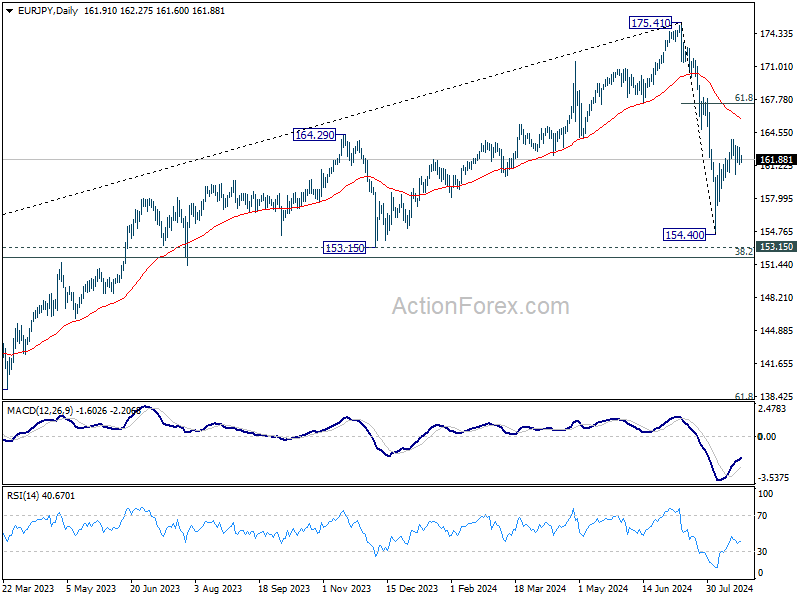
EUR/JPY is staying in consolidation below 163.86 and intraday bias remains neutral. On the upside, break of 163.86 will resume the rise from 154.40 and target 61.8% retracement of 175.41 to 154.40 at 167.38, as the second leg of the corrective pattern from 175.41. On the downside, however, firm break of 160.57 support will suggest that the rebound from 154.40 has completed, and turn bias back to the downside for 154.40 instead.
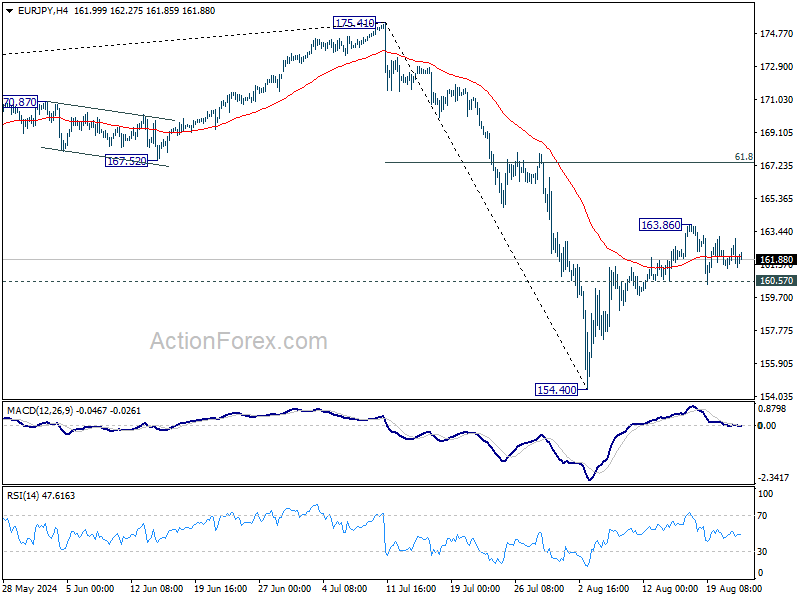
In the bigger picture, price actions from 175.41 are seen as correction to rally from 114.42 (2020 low). Current development suggests that the first leg has completed. The range of consolidation should be seen between 38.2% retracement of 114.42 to 175.41 at 152.11 and 175.41 high.
EUR/GBP Daily Outlook
Daily Pivots: (S1) 0.8502; (P) 0.8524; (R1) 0.8538; More....
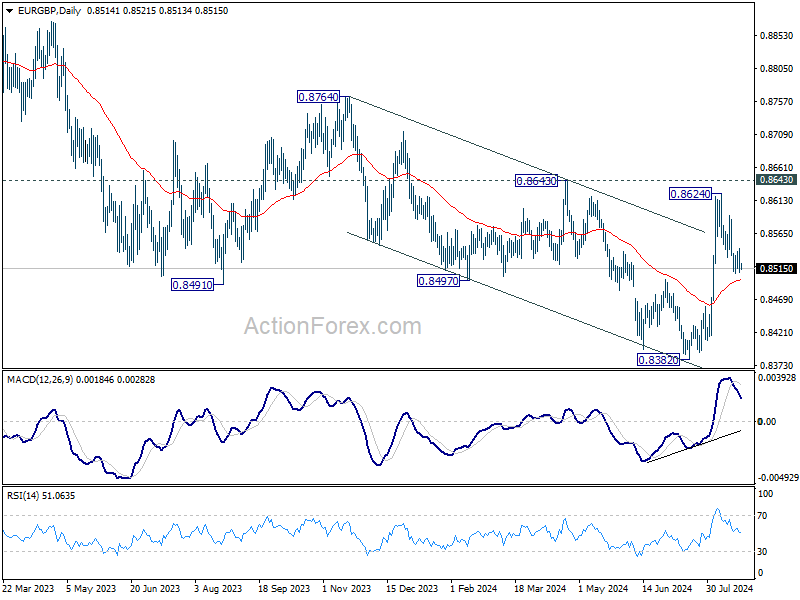
Intraday bias in EUR/GBP remains neutral as range trading continues above 0.8507. For now, strong support is still expected from 55 D EMA (now at 0.8498), to complete the correction from 0.8624. Break of 0.8591 resistance will argue that rise from 0.8382 is ready to resume through 0.8624. However, sustained break of 55 D EMA will bring deeper fall to 61.8% retracement of 0.8382 to 0.8624 at 0.8474.
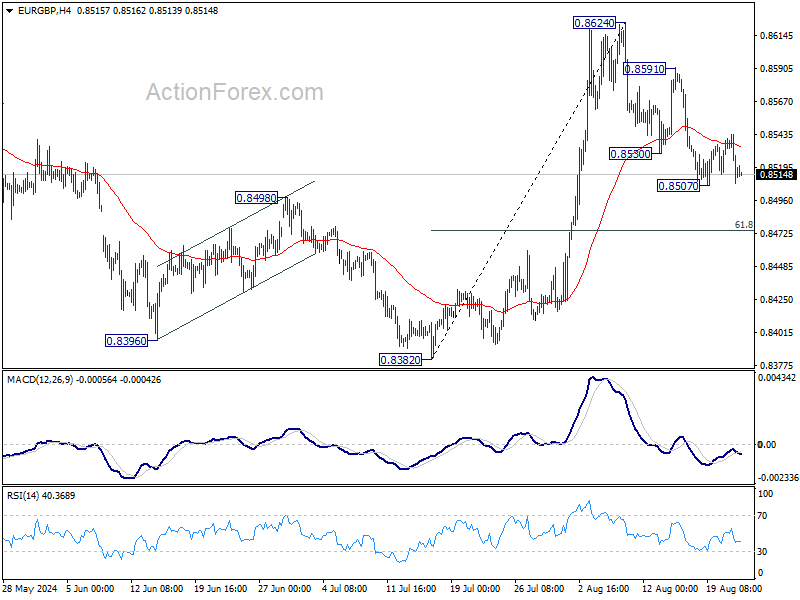
In the bigger picture, while the rebound from 0.8382 is strong, there is no confirmation of trend reversal yet. As long as 0.8643 resistance holds, down trend from 0.9267 could still resume through 0.8382 at a later stage. However, firm break of 0.8643 will indicate that such down trend has completed, and turn outlook bullish for 0.8764 resistance next.
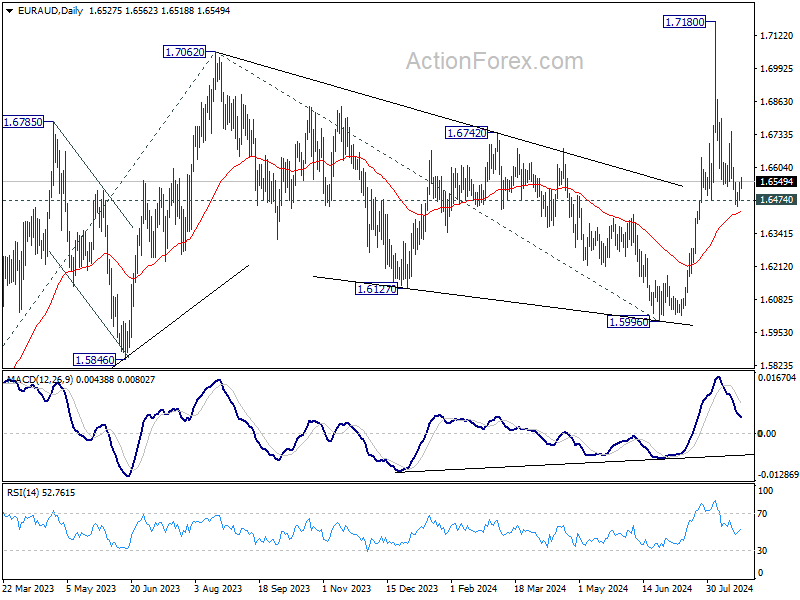
EUR/AUD Daily Outlook
Daily Pivots: (S1) 1.6489; (P) 1.6518; (R1) 1.6564; More...
EUR/AUD recovered after failing to sustain below 1.6474 support, but stays below 1.6745 resistance. Intraday bias remains neutral first, and rise from 1.5996 is still in favor to continue. On the upside, break of 1.6745 resistance will suggest that pullback from 1.7180 has completed, and retain near term bullishness. Further rise should then be seen back to retest 1.7180 high. However, decisive break of 1.6474 will argue that rise from 1.5996 has completed, and dampen the larger bullish view.
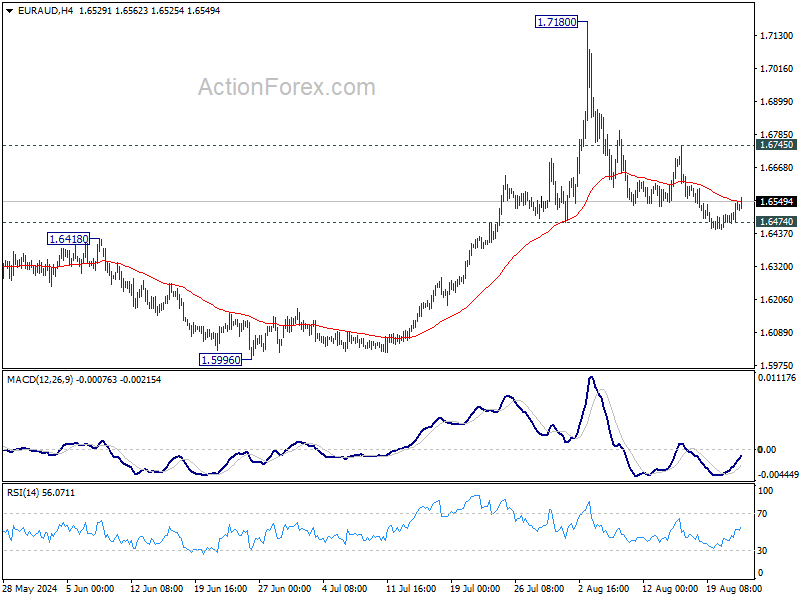
In the bigger picture, corrective fall from 1.7062 medium term top should have completed at 1.5996. Larger up trend from 1.4281 (2022 low) is resuming. Next target is 61.8% projection of 1.4281 to 1.7062 from 1.5996 at 1.7715. This will now remain the favored case as long as 1.6474 support holds. However, decisive break of 1.6474 will argue that EUR/AUD is still engaging in medium term range trading.