Sample Category Title
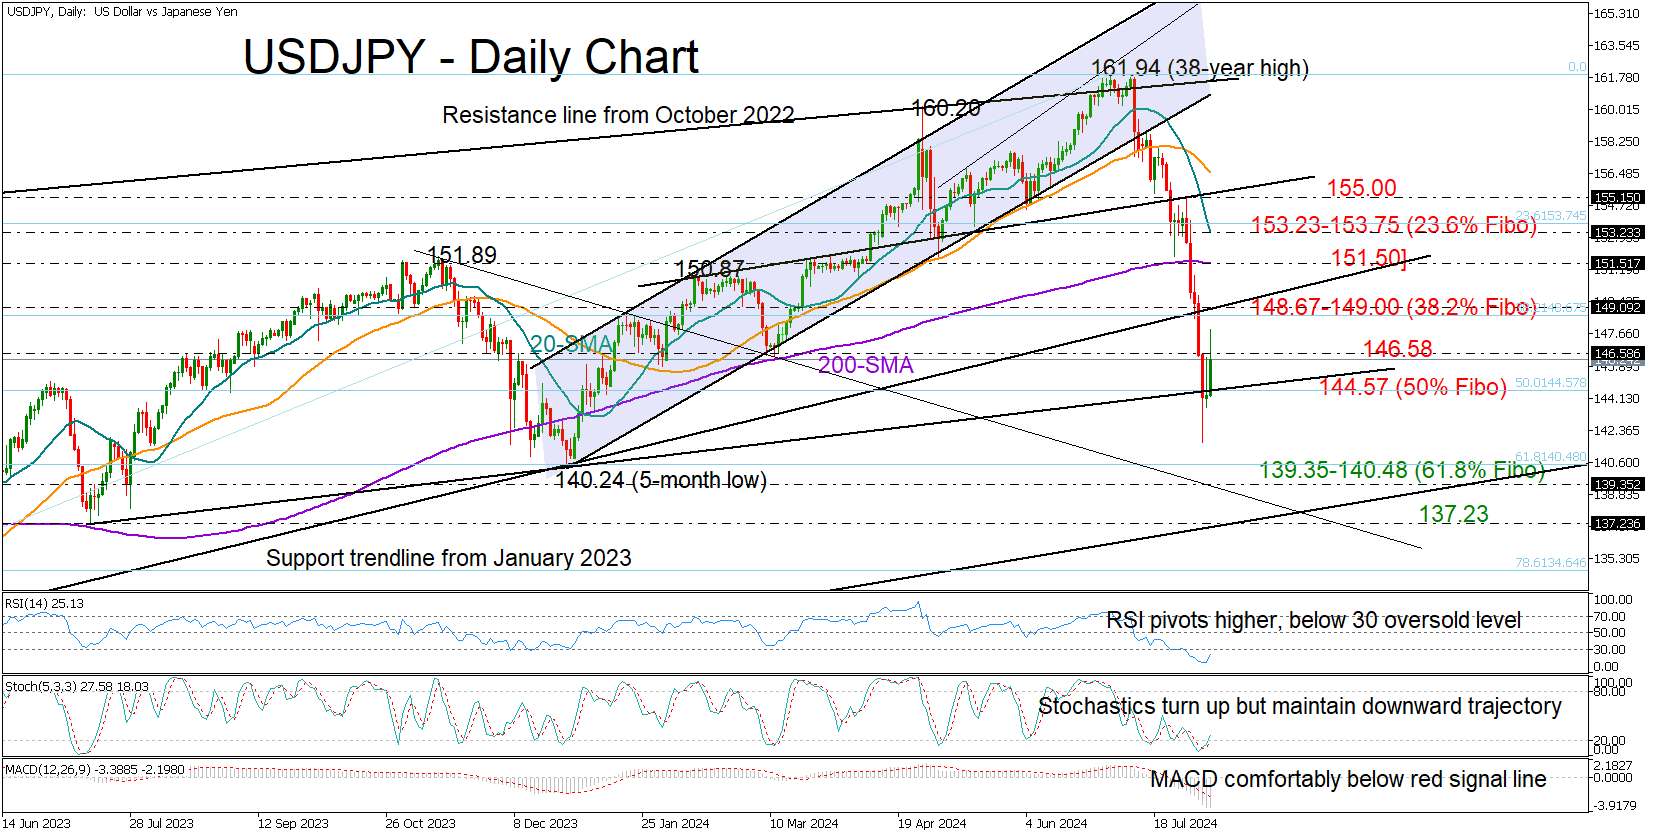
USDJPY Begins a Healing Process
- USDJPY gears up after 7-month low
- Recent sharp sell-off looks overdone
- Bulls hope for a close above 146.58 to continue higher
USDJPY showed signs of life on Wednesday, forcefully bouncing above the 144.57 bar that had limited Tuesday’s gains following the flash spike to 146.35.
There is still a chance for sellers to reverse today’s bull run since the RSI and stochastic oscillator have not moved out of the bearish area. However, with the indicators hovering within the oversold region, downward pressures might soon subside.
More importantly, if the pair manages to complete a bullish doji candlestick pattern by recouping Monday’s freefall above 146.58, the pair might receive fresh buying interest likely towards the 149.00 constraining zone. Even higher, the spotlight will fall on the 200-day simple moving average (SMA) at 151.50, a break of which could navigate the price straight to the 20-day SMA at 153.20.
On the downside, the key support trendline drawn from July 2023 will be closely watched along with the 50% Fibonacci retracement of the 2023-2024 uptrend at 144.57. If that base collapses, the price is expected to fall rapidly into the 139.35-140.48 zone formed by the descending constraining line from November 2023 and the 61.8% Fibonacci level. Another step lower could target the 2021 ascending trendline at 137.23.
Overall, it appears that the recent aggressive sell-off in USDJPY has reached a bottom. The bulls face a challenging task for a full recovery, but closing above 146.58 could give their recovery attempt a boost.
Market Analysis: GBP/USD Dives While EUR/GBP Gains Strength
GBP/USD started a fresh decline from the 1.2860 resistance zone. EUR/GBP is rising and might climb above the 0.8620 resistance.
Important Takeaways for GBP/USD and EUR/GBP Analysis Today
- The British Pound is showing bearish signs below the 1.2800 support.
- There is a key bearish trend line forming with resistance near 1.2750 on the hourly chart of GBP/USD at FXOpen.
- EUR/GBP is gaining pace and trading above the 0.8500 zone.
- There is a short-term contracting triangle forming with support near 0.8570 on the hourly chart at FXOpen.
GBP/USD Technical Analysis
On the hourly chart of GBP/USD at FXOpen, the pair failed to stay above the 1.2860 pivot level. As a result, the British Pound started a fresh decline below 1.2820 against the US Dollar.
There was a clear move below 1.2800 and the 50-hour simple moving average. The bears pushed the pair below 1.2750. Finally, there was a spike below the 1.2680 support zone. A low was formed near 1.2673 and the pair is now consolidating losses.
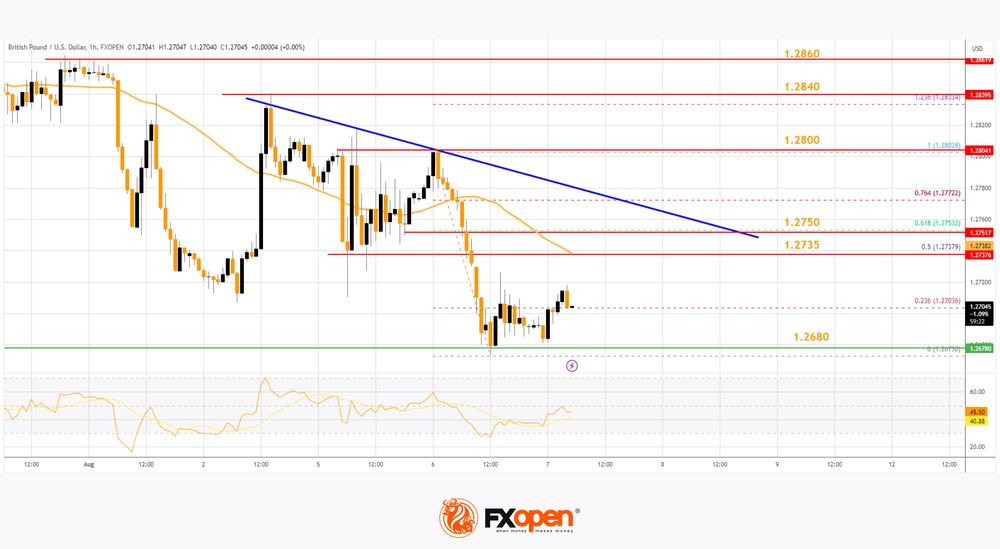
There was a minor move above toward the 23.6% Fib retracement level of the downward move from the 1.2802 swing high to the 1.2673 low.
On the upside, the GBP/USD chart indicates that the pair is facing resistance near the 50-hour simple moving average at 1.2735 and the 50% Fib retracement level of the downward move from the 1.2802 swing high to the 1.2673 low.
The next major resistance is near a bearish trend line at 1.2750 on the same chart. A close above the 1.2750 resistance zone could open the doors for a move toward 1.2800. Any more gains might send GBP/USD toward 1.2840.
On the downside, there is a key support forming near 1.2680. If there is a downside break below the 1.2680 support, the pair could accelerate lower. The next major support is near the 1.2620 zone, below which the pair could test 1.2585. Any more losses could lead the pair toward the 1.2540 support.
EUR/GBP Technical Analysis
On the hourly chart of EUR/GBP at FXOpen, the pair started a decent increase from the 0.8415 zone. The Euro traded above the 0.8465 resistance level to enter a positive zone against the British Pound.
The pair settled above the 50-hour simple moving average and 0.8515. The pair traded as high as 0.8618 before there was a downside correction. There was a move below the 23.6% Fib retracement level of the upward move from the 0.8416 swing low to the 0.8618 high.
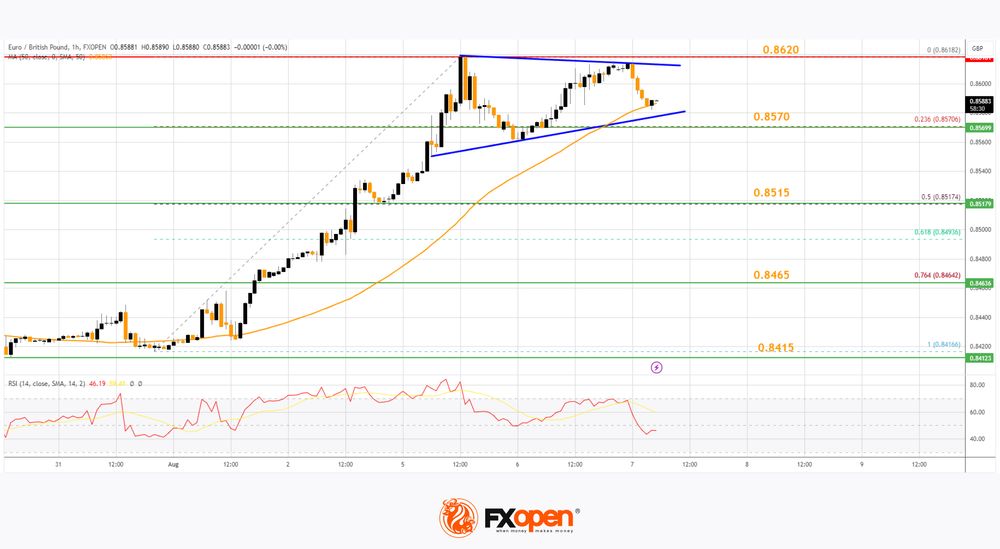
However, the pair is stable above 0.8550. There is also a short-term contracting triangle forming with support near 0.8570.
The next major support is near the 50% Fib retracement level of the upward move from the 0.8416 swing low to the 0.8618 high at 0.8515. A downside break below the 0.8515 support might call for more downsides. In the stated case, the pair could drop toward the 0.8465 support level. Any more losses might call for an extended drop toward the 0.8415 pivot zone.
The EUR/GBP chart suggests that the pair is facing resistance near the 0.8620 zone. A close above the 0.8620 level might accelerate gains. In the stated case, the bulls may perhaps aim for a test of 0.8650. Any more gains might send the pair toward the 0.8685 level.
Trade over 50 forex markets 24 hours a day with FXOpen. Take advantage of low commissions, deep liquidity, and spreads from 0.0 pips. Open your FXOpen account now or learn more about trading forex with FXOpen.
This article represents the opinion of the Companies operating under the FXOpen brand only. It is not to be construed as an offer, solicitation, or recommendation with respect to products and services provided by the Companies operating under the FXOpen brand, nor is it to be considered financial advice.
EUR/USD Daily Outlook
Daily Pivots: (S1) 1.0903; (P) 1.0933; (R1) 1.0962; More.....
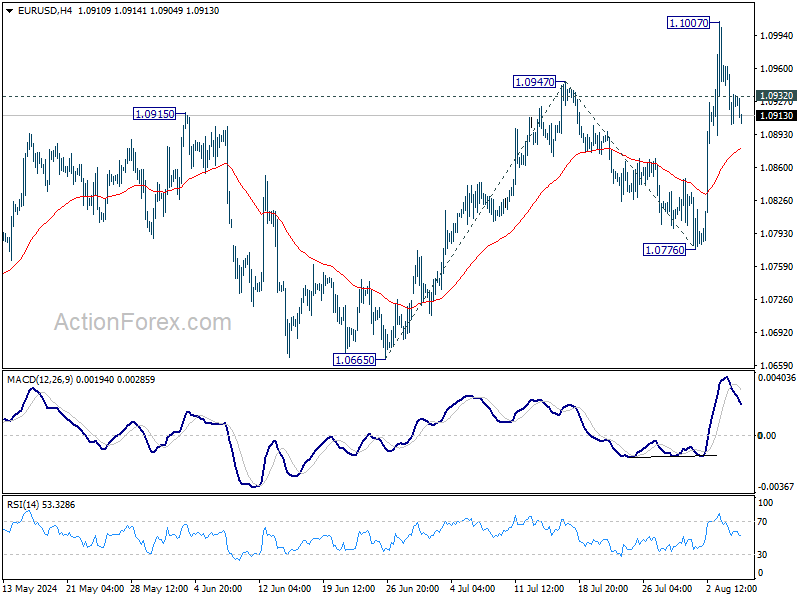
Intraday bias in EUR/USD remains neutral as consolidation continues below 1.1007. While deeper retreat cannot be ruled out, downside should be contained well above 1.0776 support. On the upside, break of 1.1007 will resume recent rally from 1.0665 to 100% projection of 1.0665 to 1.0947 from 1.0776 at 1.1056 next.
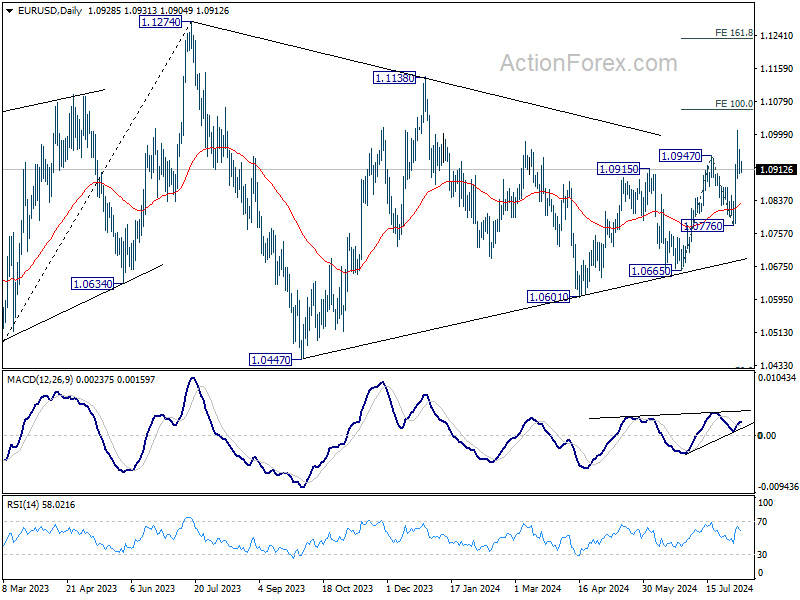
In the bigger picture, price actions from 1.1274 are viewed as a corrective pattern that's still be in progress. Break of 1.1138 resistance will be the first signal that rise from 0.9534 (2022 low) is ready to resume through 1.1274 (2023 high). However, break of 1.0776 support will extend the correction with another falling leg back towards 1.0447 support.
USD/JPY Daily Outlook
Daily Pivots: (S1) 143.21; (P) 144.79; (R1) 145.95; More...
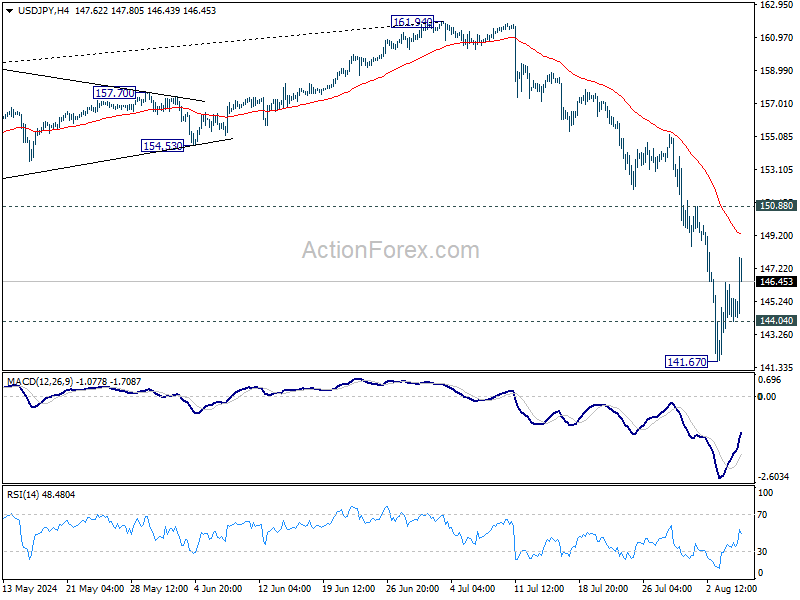
While USD/JPY's recovery extends higher today, upside is still limited below 150.88 resistance. Intraday bias remains neutral and further decline remains in favor. On the downside, below 144.04 minor support will bring retest of 141.67 first. Break there will resume the fall from 161.94 to 140.25 support next.
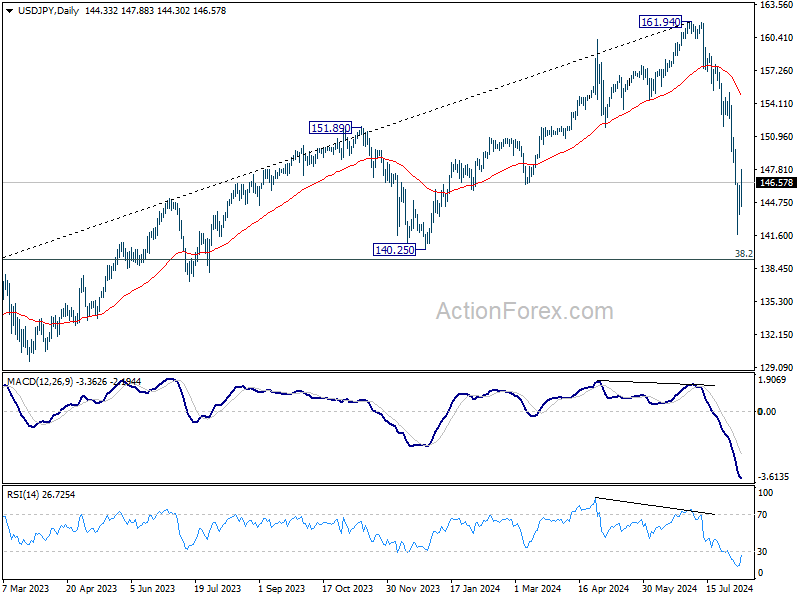
In the bigger picture, the strong break of 55 W EMA (now at 149.98) argue that fall from 161.94 medium term is correcting whole up trend from 102.58 (2021 low). Deeper decline could be seen to 38.2% retracement of 102.58 to 161.94 at 139.26, which is close to 140.25 support. In any case, risk will stay on the downside as long as 55 W EMA (now at 149.83) holds. Nevertheless, firm break of 55 W EMA will suggest that the range for medium term corrective pattern is already set.
GBP/USD Daily Outlook
Daily Pivots: (S1) 1.2642; (P) 1.2723; (R1) 1.2772; More...
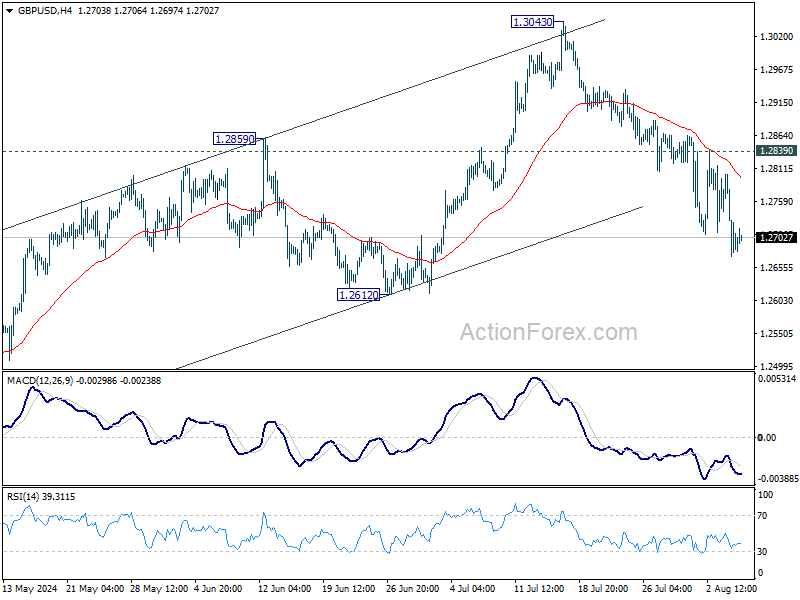
Intraday bias in GBP/USD remains on the upside at this point. Fall from 1.3043 is in progress for 1.2612 support. Decisive break there should confirm that rise from 1.2298 has completed, and target this support next. For now, risk will remain on the downside as long as 1.2839 resistance holds, in case of recovery.
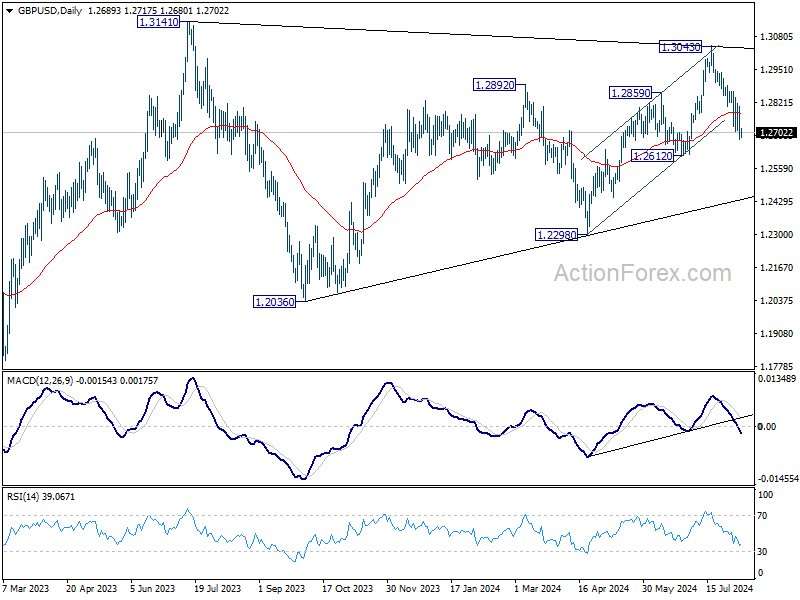
In the bigger picture, current development suggests that corrective pattern from 1.3141 is extending with fall from 1.3043 as another leg. Break of 1.2612 support would strengthen this case. But still, downside should be contained by 1.2036/2298 support zone even in case of deep decline. Rise from 1.0351 (2022 low) remains in favor to resume at a later stage.
USD/CHF Daily Outlook
Daily Pivots: (S1) 0.8485; (P) 0.8529; (R1) 0.8556; More…
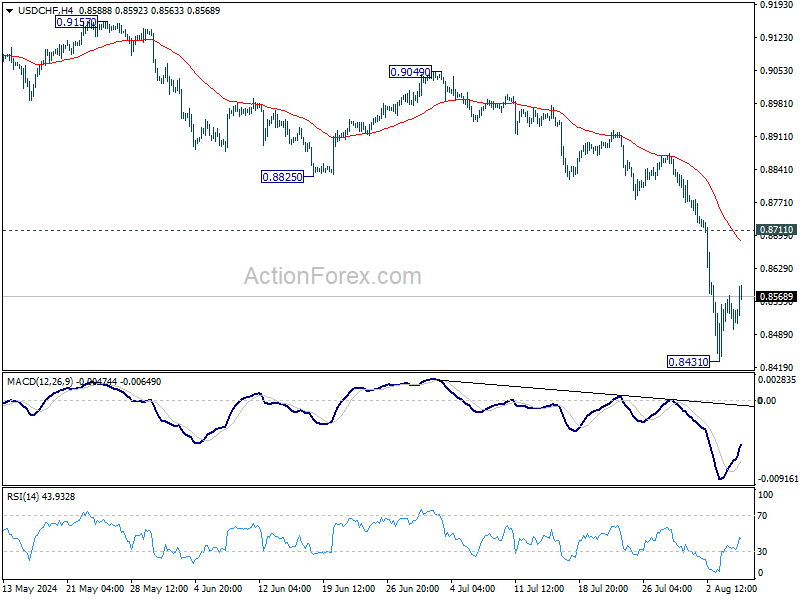
Intraday bias in USD/CHF remains neutral as consolidation continues above 0.8431 low. While further recovery cannot be ruled out, upside should be limited by 0.8711 resistance to bring another fall. On the downside, below 0.8431 will resume the decline from 0.9223 to retest 0.8332 low.
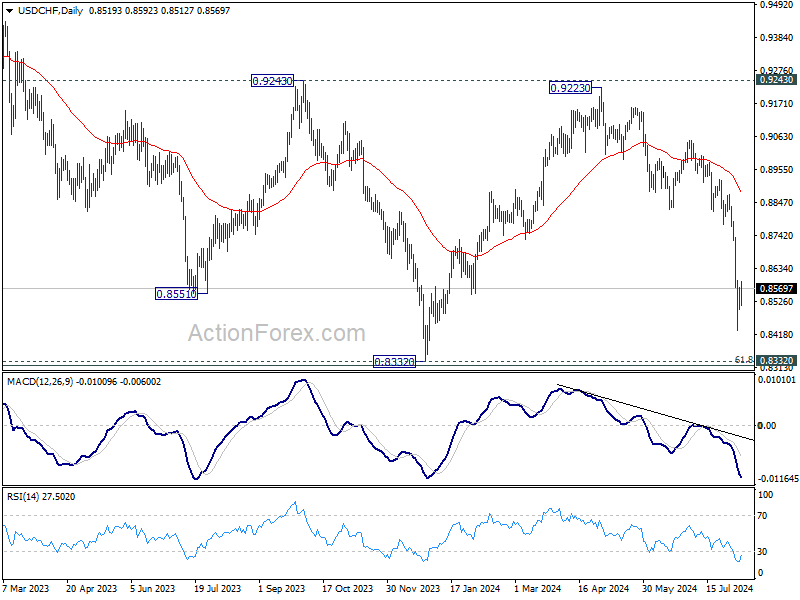
In the bigger picture, price actions from 0.8332 (2023 low) are currently seen as a medium term corrective pattern, with fall from 0.9223 as the second leg. Strong support could be seen from 0.8332 to bring rebound. Yet, overall outlook will continue to stay bearish as long as 0.9243 resistance holds. Firm break of 0.8332, however, will resume larger down trend from 1.0146 (2022 high).
AUD/USD Daily Report
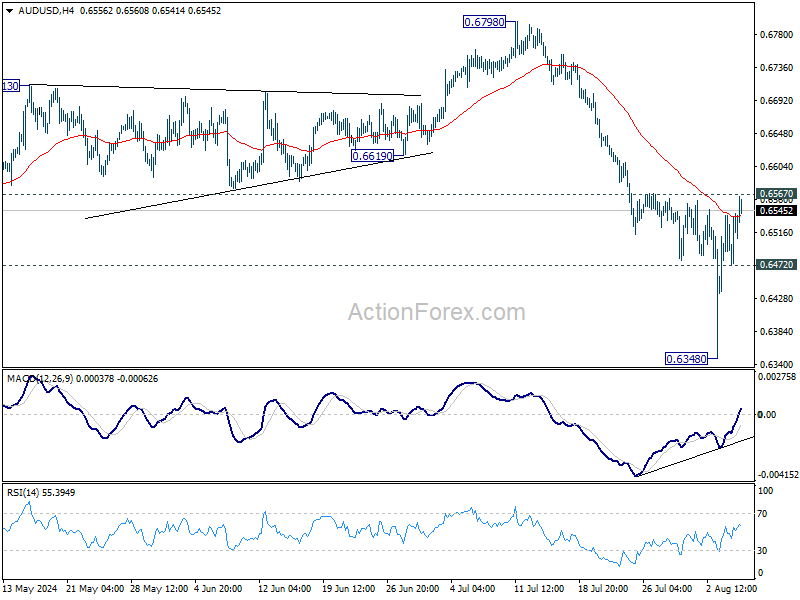
Daily Pivots: (S1) 0.6480; (P) 0.6511; (R1) 0.6549; More...
AUD/USD is still capped by 0.6567 resistance and intraday bias remains neutral for the moment. Further fall is also in favor. On the downside, below 0.6472 minor support will turn bias back to the downside for retesting 0.6348 low. Nevertheless, strong break of 0.6567 will bring stronger rally to 55 D EMA (now at 0.6617) and possibly above.
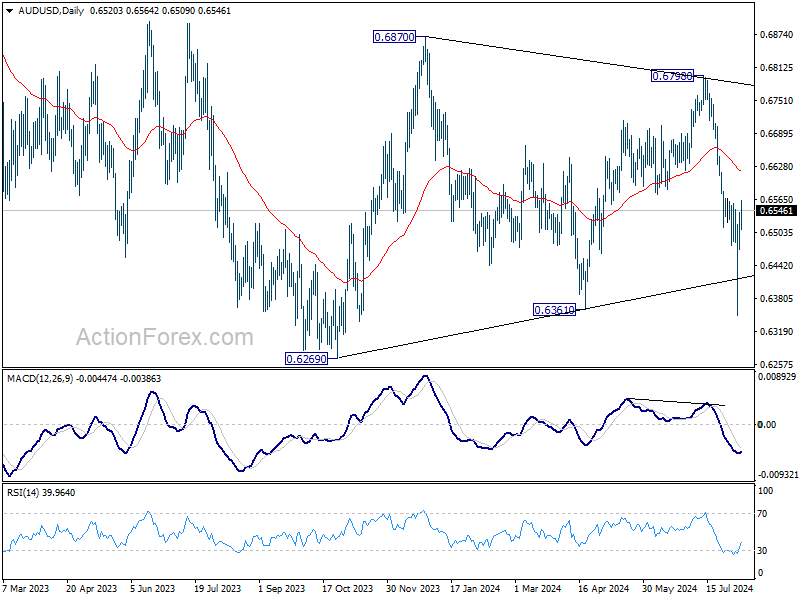
In the bigger picture, overall, price actions from 0.6169 (2022 low) are seen as a medium term corrective pattern, with fall from 0.6798 as another falling leg. Deeper fall could be seen to the lower side of the range between 0.6169/6361. But strong support should be seen there to contain downside. For now, risk will stay on the downside as long as 55 D EMA (now at 0.6617) holds, in case of rebound.
USD/CAD Daily Outlook
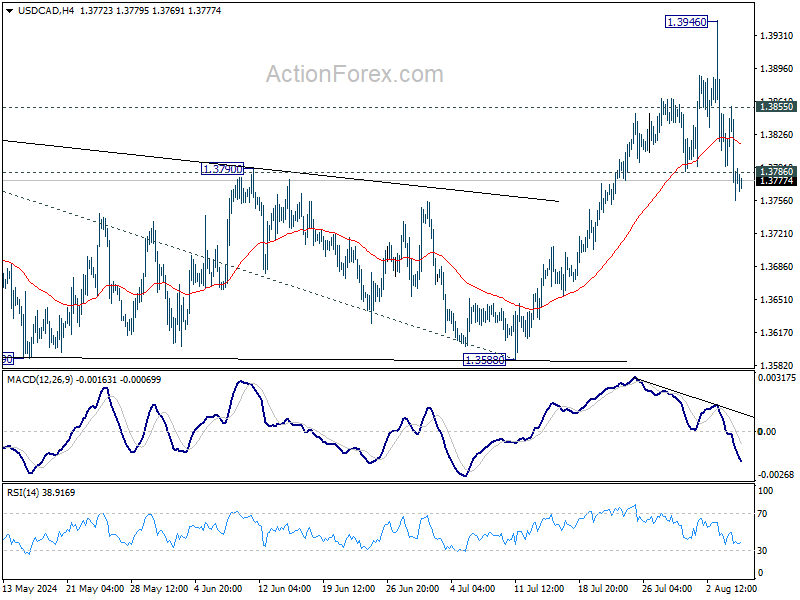
Daily Pivots: (S1) 1.3743; (P) 1.3799; (R1) 1.3842; More...
USD/CAD's break of 1.3786 support confirms short term topping at 1.3946, on bearish divergence condition in 4H MACD. Intraday bias is back on the downside for 55 D EMA (now at 1.3726). Sustained break there would dampen the original bullish outlook and bring deeper fall. On the upside, above 1.3855 minor resistance will bring retest of 1.3946 first.
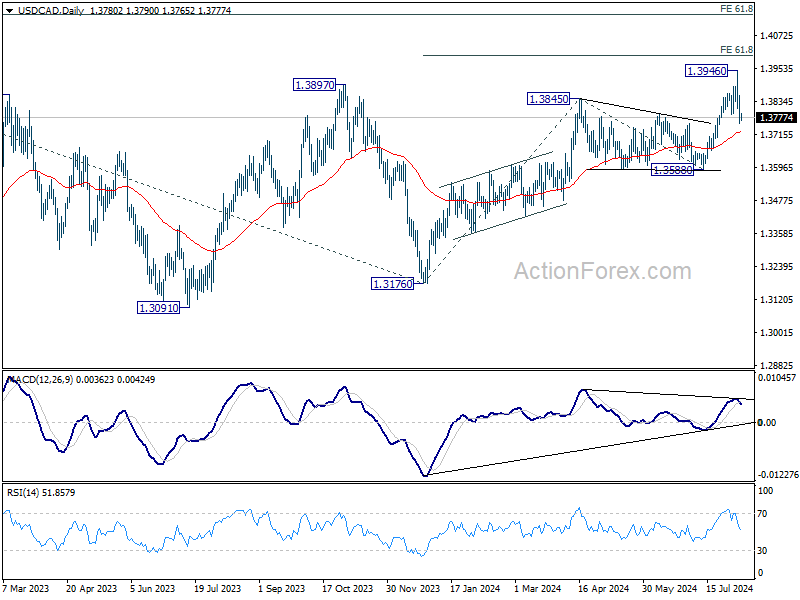
In the bigger picture, price actions from 1.3976 (2022 high) are viewed as a corrective pattern, that might have completed at 1.3176 (2023 low) already. Firm break of 1.3976 will confirm resumption of whole up trend from 1.2005 (2021 low). Next target is 61.8% projection of 1.2401 to 1.3976 from 1.3176 at 1.4149. This will be the favored case as long as 1.3588 support holds, in case of pullback.
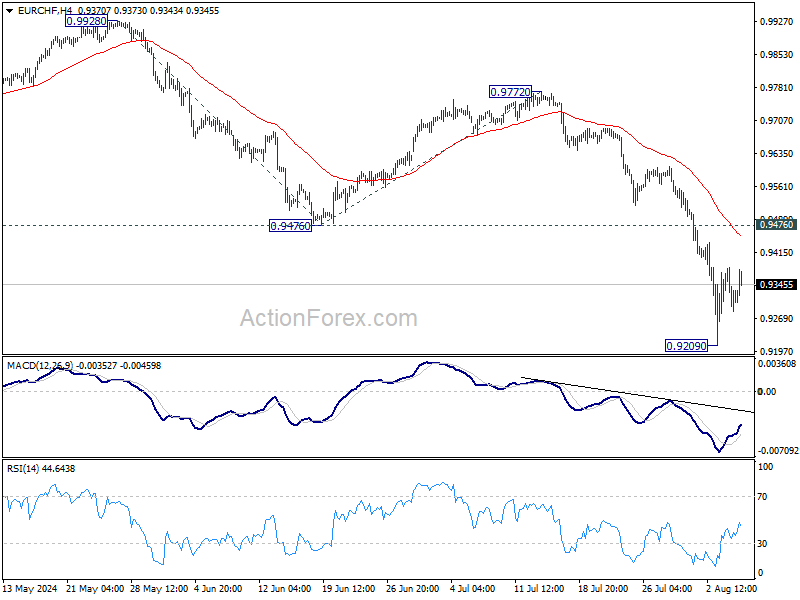
EUR/CHF Daily Outlook
Daily Pivots: (S1) 0.9268; (P) 0.9326; (R1) 0.9367; More....
Intraday bias in EUR/CHF remains neutral as consolidation continues above 0.9209. While stronger recovery cannot be ruled out, near term outlook will remain bearish as long as 0.9476 support turned resistance holds. Below 0.9209 will target 161.8% projection of 0.9928 to 0.94767 from 0.9772 at 0.9041 next.
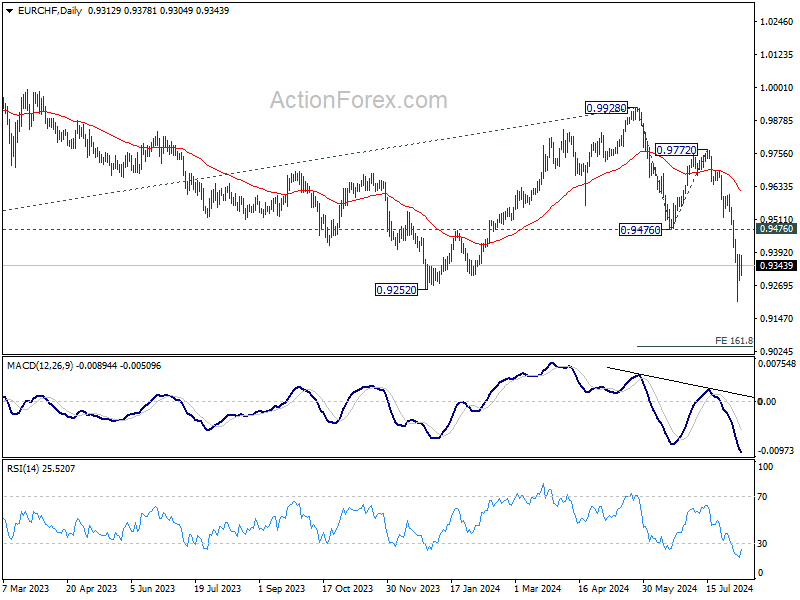
In the bigger picture, current downside acceleration argues that medium term corrective pattern from 0.9407 (2022 low) might have completed with three waves to 0.9928. Decisive break of 0.9252 (2023 low) will confirm long term down trend resumption. Next target will be 61.8% projection of 1.1149 to 0.9407 from 0.9928 at 0.8851. For now, outlook will stay bearish as long as 0.9928 resistance holds, even in case of strong rebound.
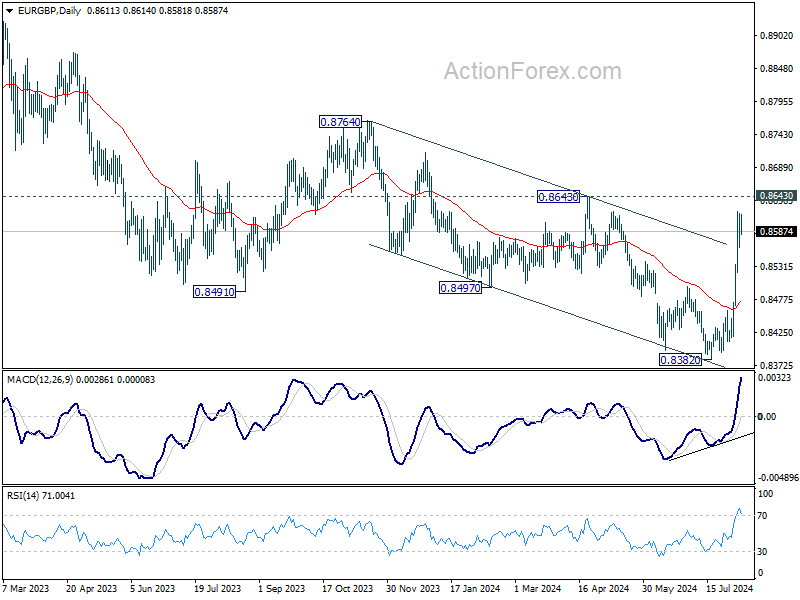
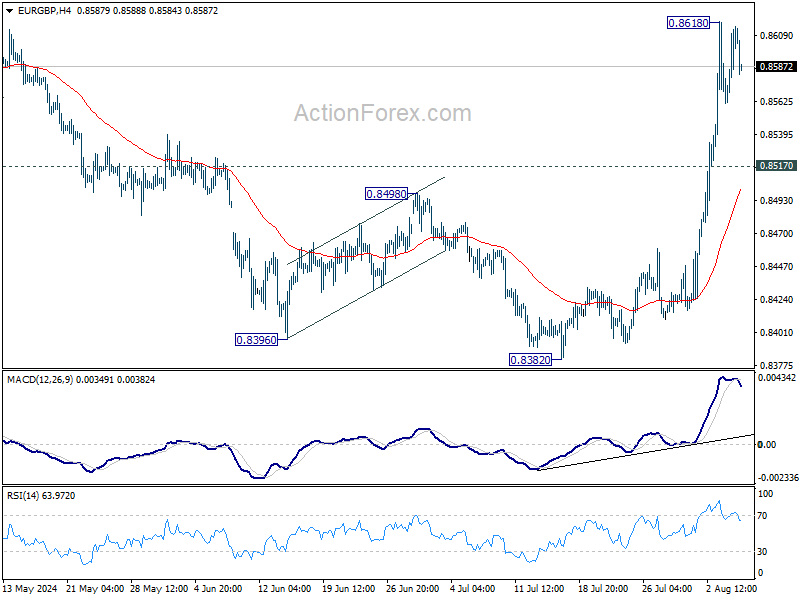
EUR/GBP Daily Outlook
Daily Pivots: (S1) 0.8578; (P) 0.8597; (R1) 0.8632; More....
Intraday bias in EUR/GBP is turned neutral with 4H MACD crossed below signal line. Some consolidations would be seen below 0.8618 first. Downside should be contained above 0.8517 minor support to bring another rally. Above 0.8618 will resume the rise from 0.8382 to 0.8643 resistance. Decisive break there will strengthen the case of larger bullish reversal and target 0.8764 key resistance next.
In the bigger picture, while the rebound from 0.8382 is strong, there is no confirmation of trend reversal yet. As long as 0.8643 resistance holds, down trend from 0.9267 could still resume through 0.8382 at a later stage. However, firm break of 0.8643 will indicate that such down trend has completed, and turn outlook bullish.