

Sample Category Title
GBPUSD Drops Out of Bullish Channel
- GBPUSD trims more gains after bearish channel breakout
- Technical signals remain negative; support at 1.2670
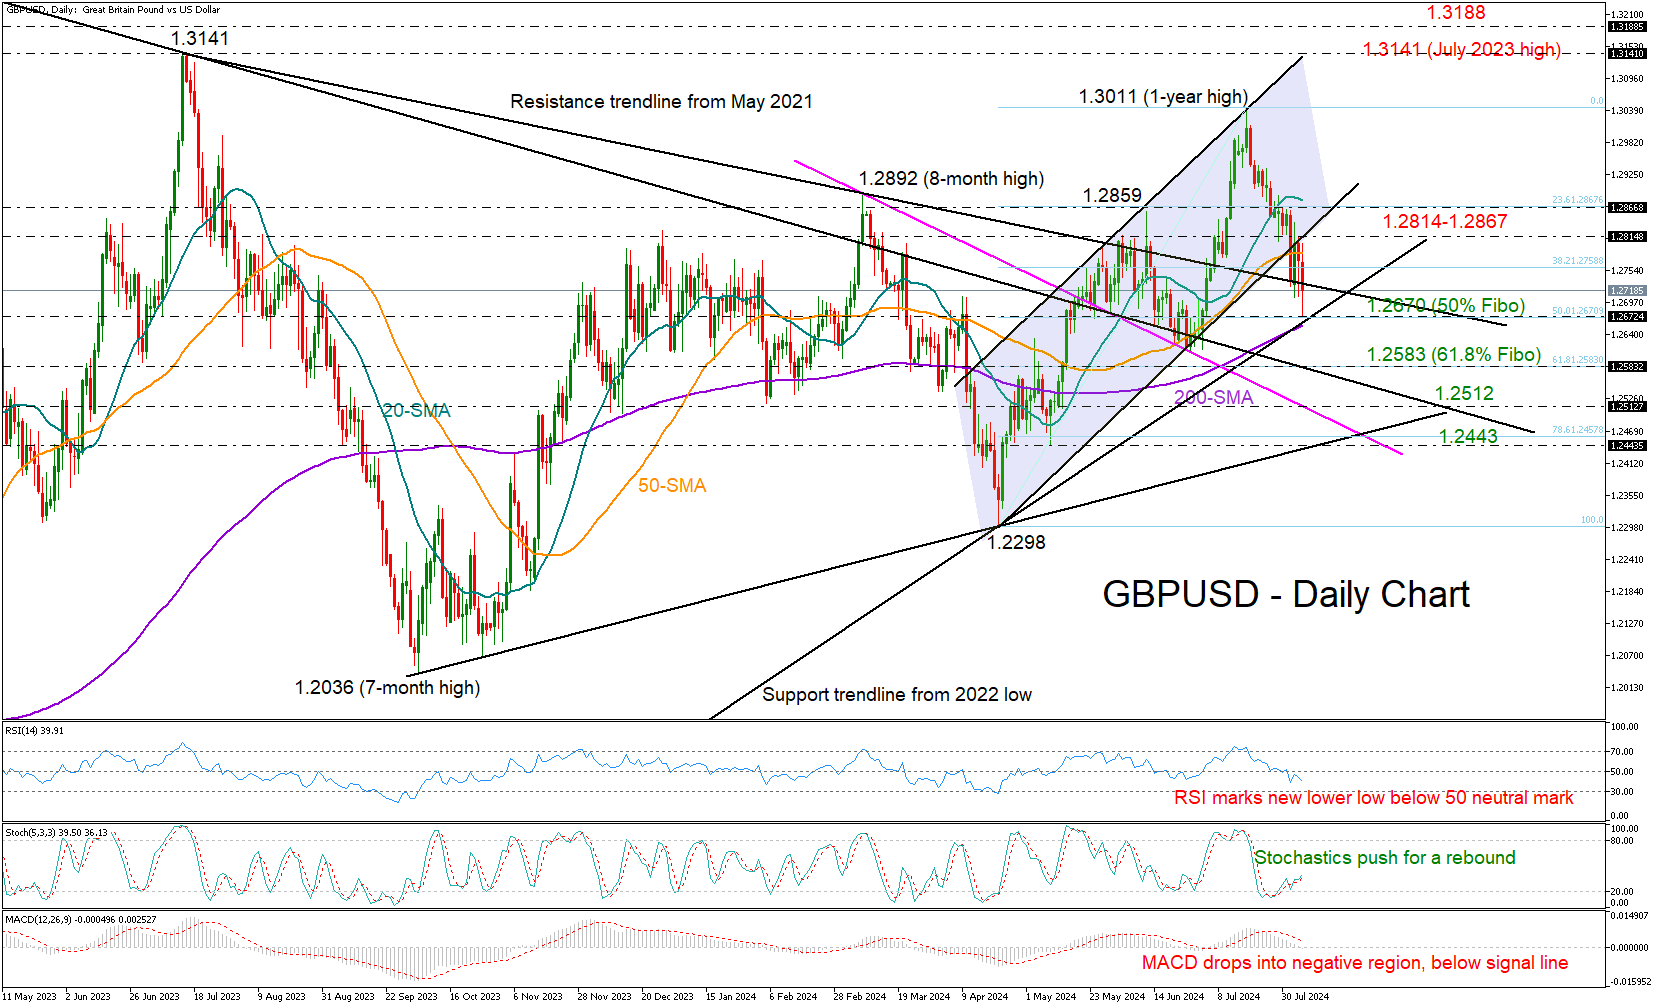
GBPUSD bears powered up on Tuesday with scope to fight the 200-day simple moving average (SMA) and the support trendline from the 2022 low at 1.2670, which triggered the April-July bull trend. Notably, the 50% Fibonacci retracement of this upleg is in the neighborhood.
The ongoing negative correction emerged after the price failed to crawl back above the broken bullish channel and the 1.2814 level, raising concerns about a bearish continuation.
The question now is whether the 1.2670 support region will put brakes on the bearish development. Technically, it's likely the bears will break through this level as the price has retreated beneath its 20- and 50-day SMAs. Moreover, the RSI and the MACD are decelerating within the bearish area, backing the downward move in the price.
If the floor at 1.2670 collapses, the next turning point could be found near the 61.8% Fibonacci mark of 1.2583 or around the 1.2512 barrier. A continuation lower could see another important test near the strong ascending trendline near 1.2443, a break of which is expected to prompt a faster decline towards April’s trough of 1.2298.
Should the pair secure a strong footing near 1.2670 there is potential for an advance back towards the lower band of the broken bullish channel seen at 1.2814. Slightly higher, the 20-day SMA and the 23.6% Fibonacci number of 1.2867 could prevent a meaningful acceleration towards the 1.3000 zone.
In a nutshell, GBPUSD displays a cloudy short-term outlook, poised to give up more ground if the 1.2670 floor collapses.
AUD Set to Regain Momentum
Following a week-long, 300-pip drop on AUDNZD last week, this week has opened up with some renewed bullish vigor with a 150-pip correction. While this looks incredible in favor of the Australian Dollar, there yet remains some mystery as to the exact direction the momentum will follow. Here’s my outlook as touching the price action on AUDNZD, GBPAUD and EURAUD pairs.
AUDNZD – H2 Timeframe
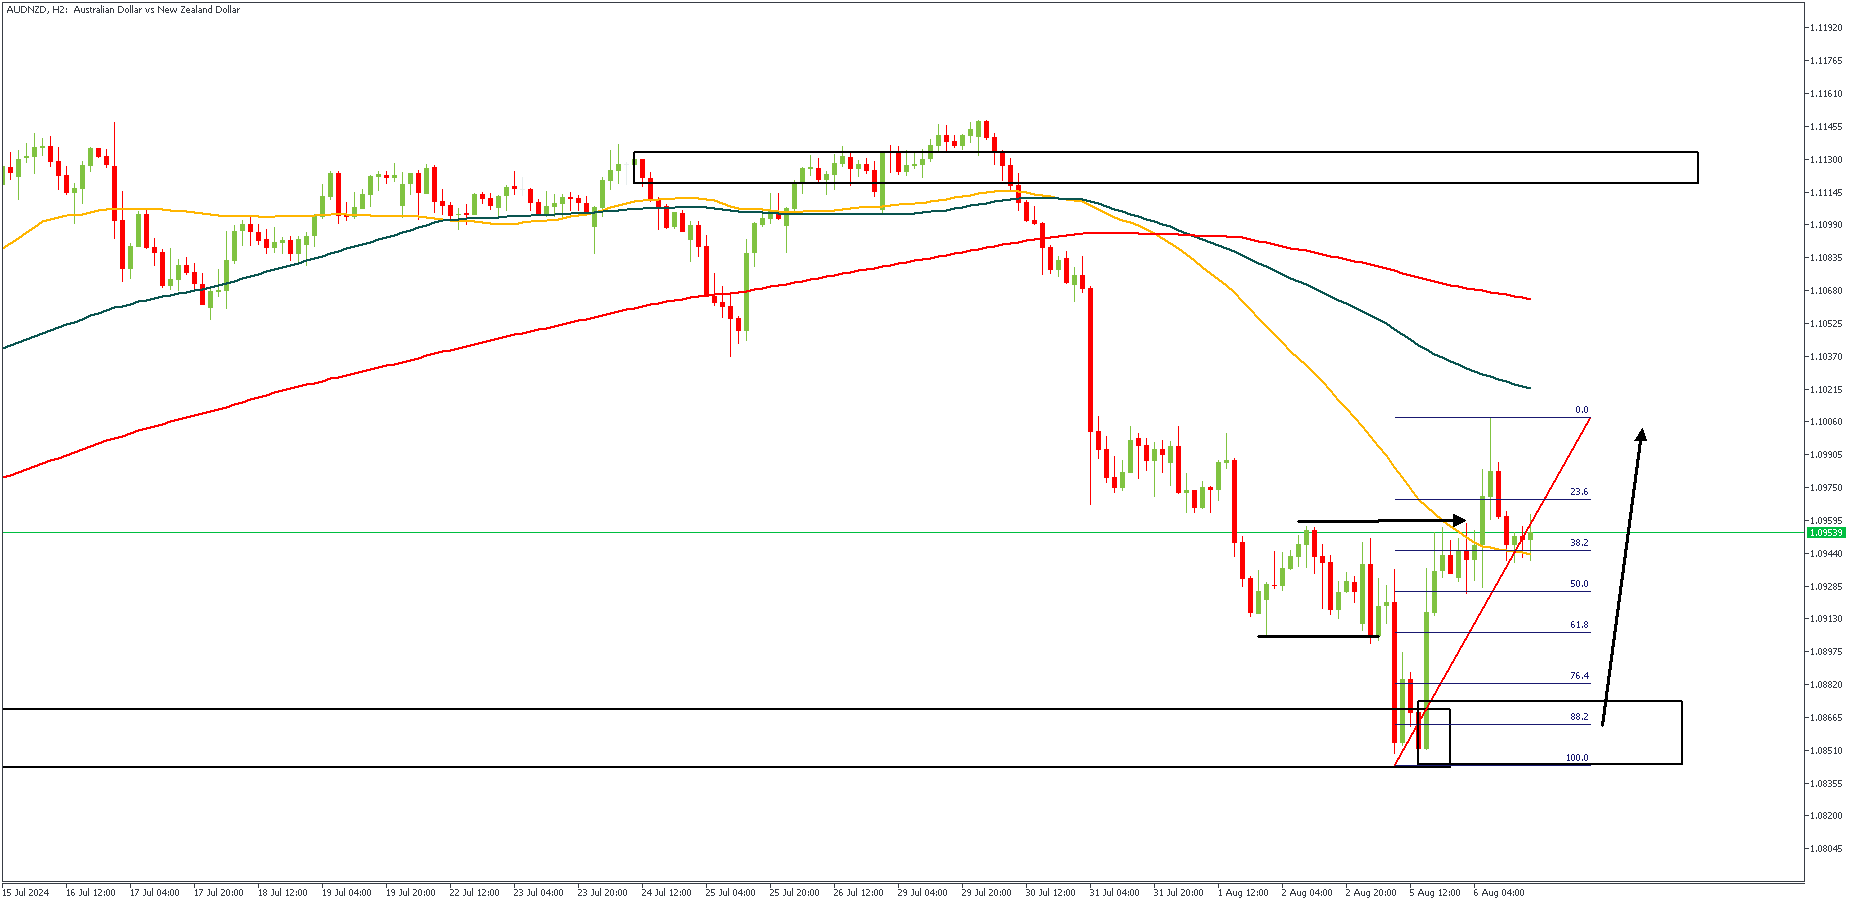
On the 2-hour timeframe chart of AUDNZD, we can see that price faced some initial rejection from the demand zone highlighted by the rectangle, after which price broke above the previous high. The SBR price action pattern that formed after the rejection is my basis for entry; a retest of the demand zone below the 76% Fibonacci retracement level.
Analyst’s Expectations:
- Direction: Bullish
- Target: 1.10114
- Invalidation: 1.08372
EURAUD – H2 Timeframe
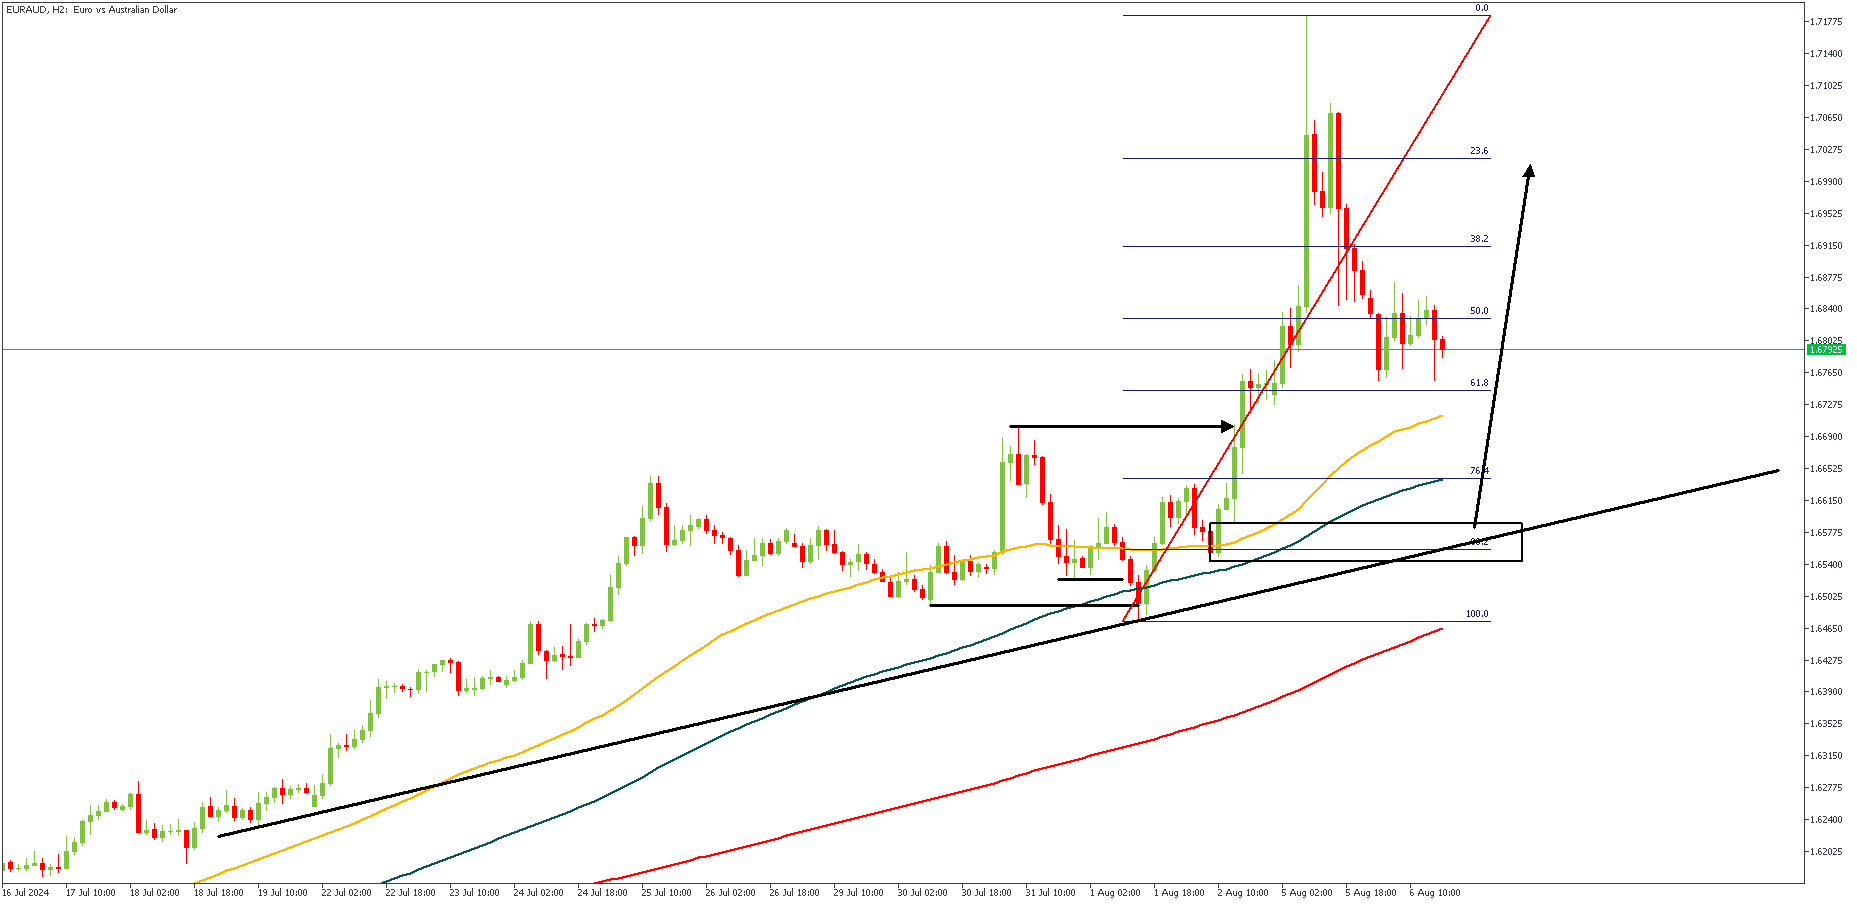
EURAUD on the 2-hour timeframe presents a SBR (Sweep-Break-Retest) pattern which aligns perfectly with the bullish array of the moving averages, and the 88% of the Fibonacci retracement tool. The trendline support, and the 100-period moving average support serve as additional confluences in favor of the bullish sentiment on EURAUD.
Analyst’s Expectations:
- Direction: Bullish
- Target: 1.70275
- Invalidation: 1.64423
GBPAUD – D1 Timeframe
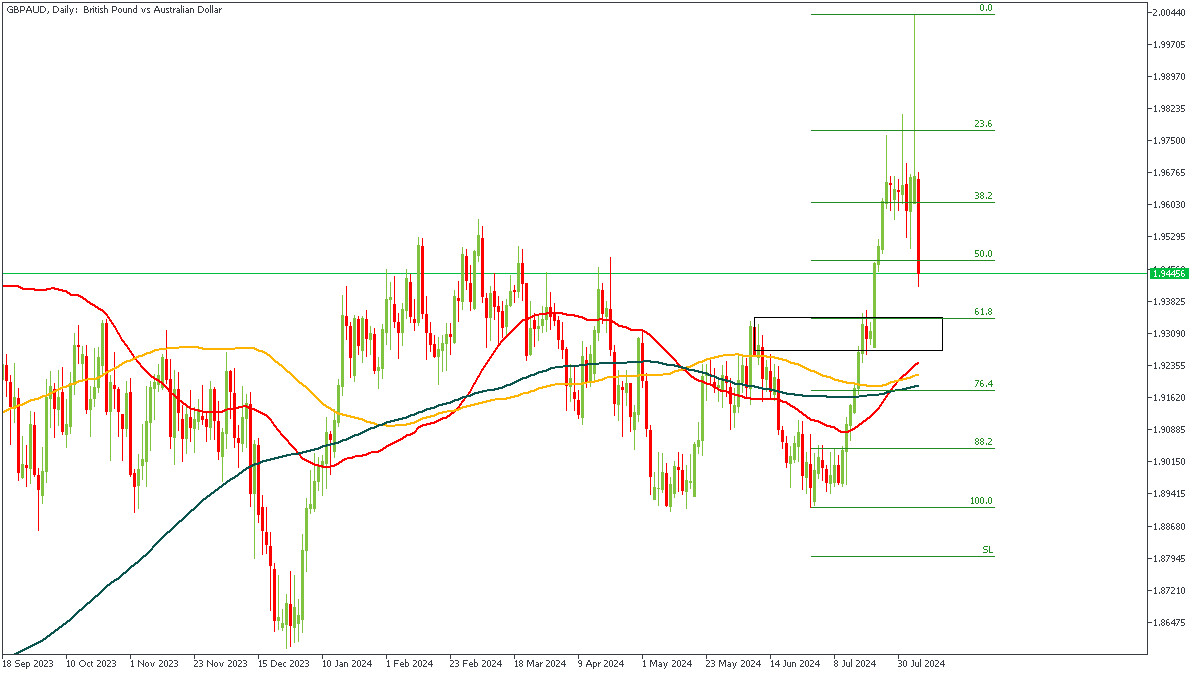
As for GBPAUD, the Daily timeframe provides the clearest price action movement. On the Daily timeframe of GBPAUD, we see price approaching the 61% of the Fibonacci retracement zone, with a rally-base-rally demand zone overlapping the golden ratio level of the retracement tool. Considering the presence of the 50-day moving average nearby, it seems safe to expect a bullish outcome from the demand zone.
Analyst’s Expectations:
- Direction: Bullish
- Target: 1.97589
- Invalidation: 1.91051
JP 225 Index Tries to Find Footing After 20% Crash
- JP 225 index plummets to 10-month low amid global stock meltdown
- Oversold signals detected; but bulls could show up above 33,585
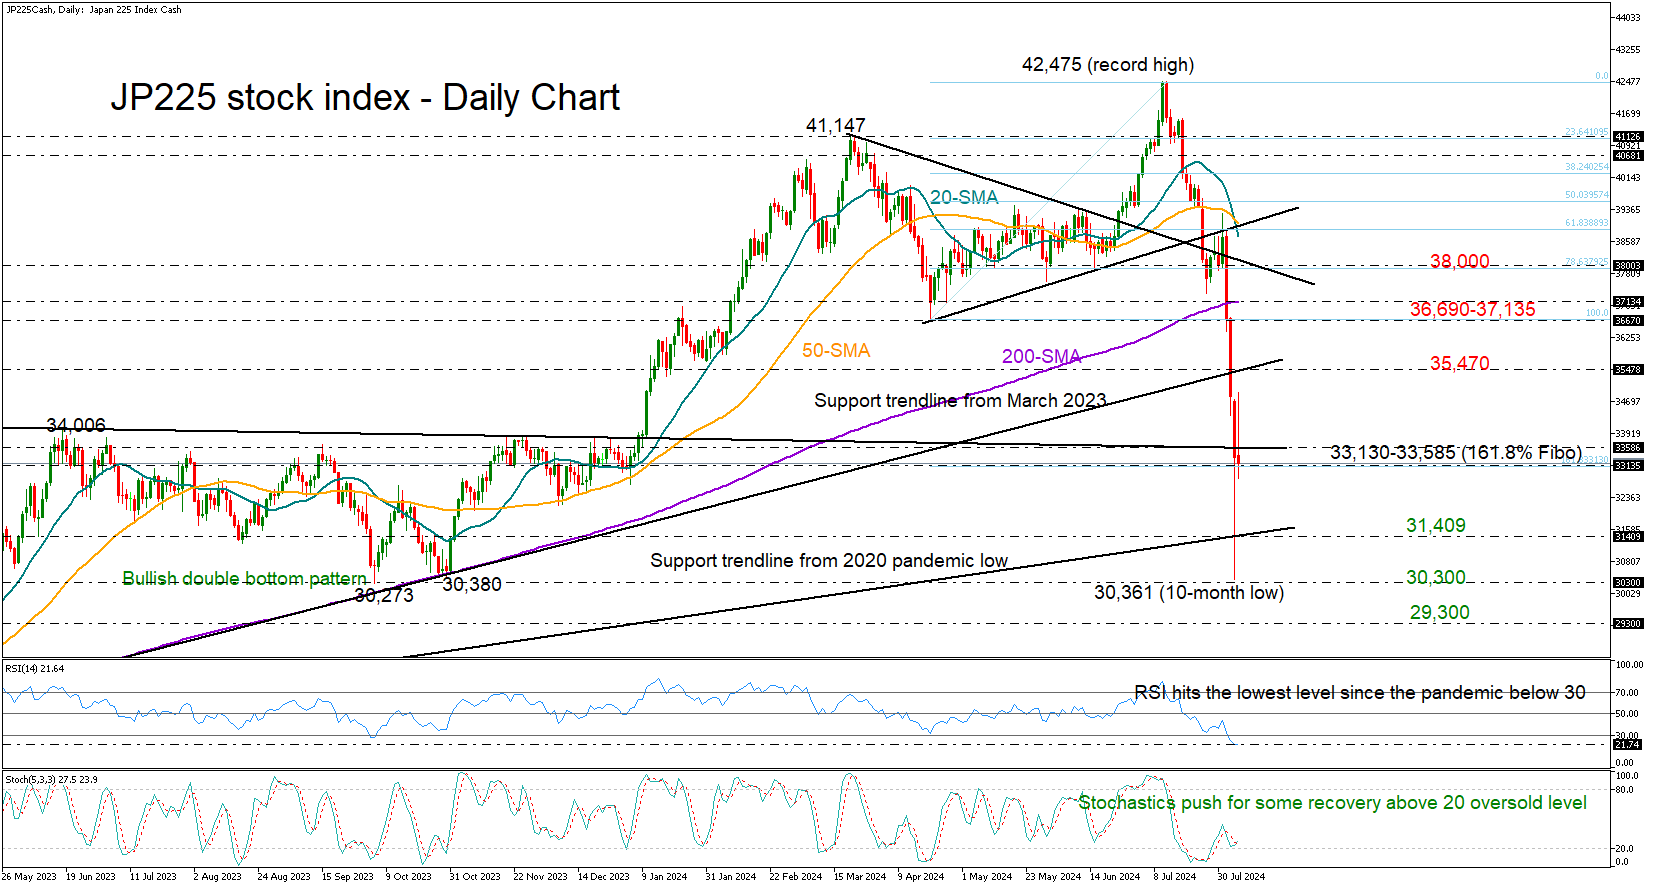
Japan’s 225 stock index (cash) started the month on the wrong foot, sinking by a massive 21% to a 10-month low of 30,361 in the wake of recession fears in the US and as the bruised yen finally entered a bullish cycle.
Technically, the index suffered its sharpest correction below its 200-day simple moving average (SMA) since the pandemic, reaching the lows from October 2023 before closing the day around 33,336. The latter overlaps with the 161.8% Fibonacci extension of the April-July upleg, which is currently buffering downside pressures.
However, for the index to run towards the 35,470 barrier, the price might first need to overcome the nearby resistance line at 33,585. Even higher, April’s low of 36,692 and the 200-day SMA could block the way towards the 38,000 psychological mark.
According to the RSI and the stochastic oscillator, the market is hovering near oversold levels. Hence, the bears could soon get exhausted. Nevertheless, a close below the 33,130 region could postpone any recovering attempts, shifting the spotlight towards the ascending trendline which connects the 2020 and 2023 lows at 31,400, although the line was unable to stop Monday’s freefall. If selling forces persist, the price might revisit the October double bottom area of 30,300. The 29,300 region could be the next pivot point.
In brief, Japan’s 225 index erased all its progress from late 2023 in short-period of time and some recovery could be justified given the oversold signals. Still, selling interest may not evaporate in the coming sessions, unless the price manages to step above 33,585.
Gold (XAU/USD) Steadies After Volatile Monday; DXY Bounces Back
- Gold prices rebounded above $2,400/oz after a dip to $2,364/oz, showing resilience despite a strengthening US Dollar.
- Gold benefits from expectations of more aggressive rate cuts and its safe-haven status.
- Geopolitical and economic risks in the second half of 2024, along with anticipated rate cuts, should theoretically support the gold rally, but a Middle East peace agreement could complicate the outlook.
Gold prices bounced back robustly yesterday following a selloff that saw the precious metal dip to around $2,364/oz. Since then, gold has rallied back above the $2,400/oz mark and continues to consolidate above this level.
The resilience of gold and sustained buying interest are evident, even with the US Dollar strengthening significantly in European trade this morning. Despite the rise in the DXY, gold prices have remained largely unaffected.
The notion of the Dollar’s demise as a safe-haven asset might be premature, given the increasing geopolitical risks. Today’s bounce in the Dollar comes amid heightened tensions in the Middle East, suggesting that the US Dollar may still retain some of its haven appeal despite ongoing recessionary concerns.
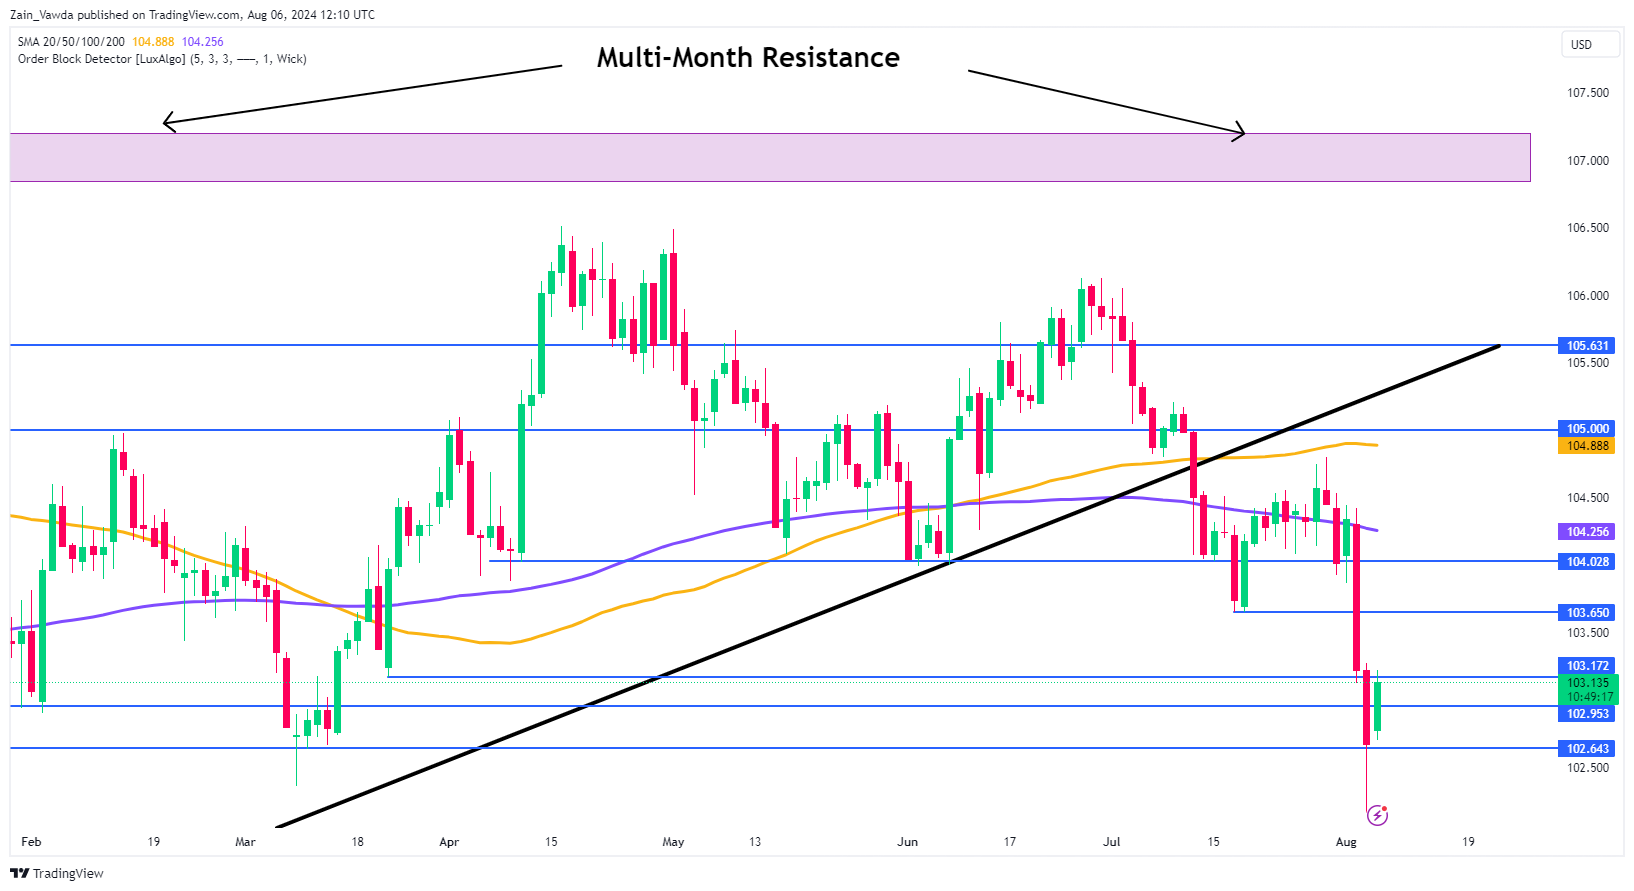
On the chart, the DXY found support around the key 102.00 level yesterday.
A rally has since followed, but the DXY is now encountering its first resistance at approximately 103.200, with further resistance ahead at 103.60. Conversely, a push to the downside from this point could lead Gold to revisit recent lows, but this would require a daily candle close below 102.60 for it to materialize.
US Dollar Index Daily Chat, July 25, 2024
Source:TradingView.com
Support
- 2400
- 2392
- 2364
Resistance
- 2420
- 2450
- 2470
Gold is benefitting from expectations of more aggressive rate cuts, along with its safe-haven appeal. Moving forward, gold could return to the rangebound behavior observed frequently in 2024.
The second half of the year presents numerous risks, both geopolitical and economic. These, coupled with anticipated interest rate cuts, should theoretically sustain the gold rally. However, a peace agreement in the Middle East could complicate the outlook, necessitating a reassessment of gold’s medium-term direction at the very least.
Economic Data, US Earnings and Geopolitics to Drive Sentiment
Data is sparse for the US this week and thus the geopolitics and US earnings may be the driving force of sentiment as well.
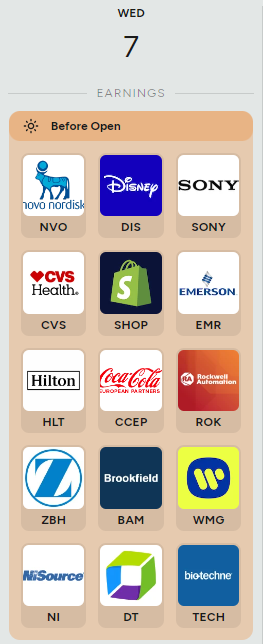
Among the big names on the earnings front this week, we have Occidental Petroleum and Disney reporting tomorrow among a host of other names.
Source: Earnings Hub
Technical Analysis Gold (XAU/USD)
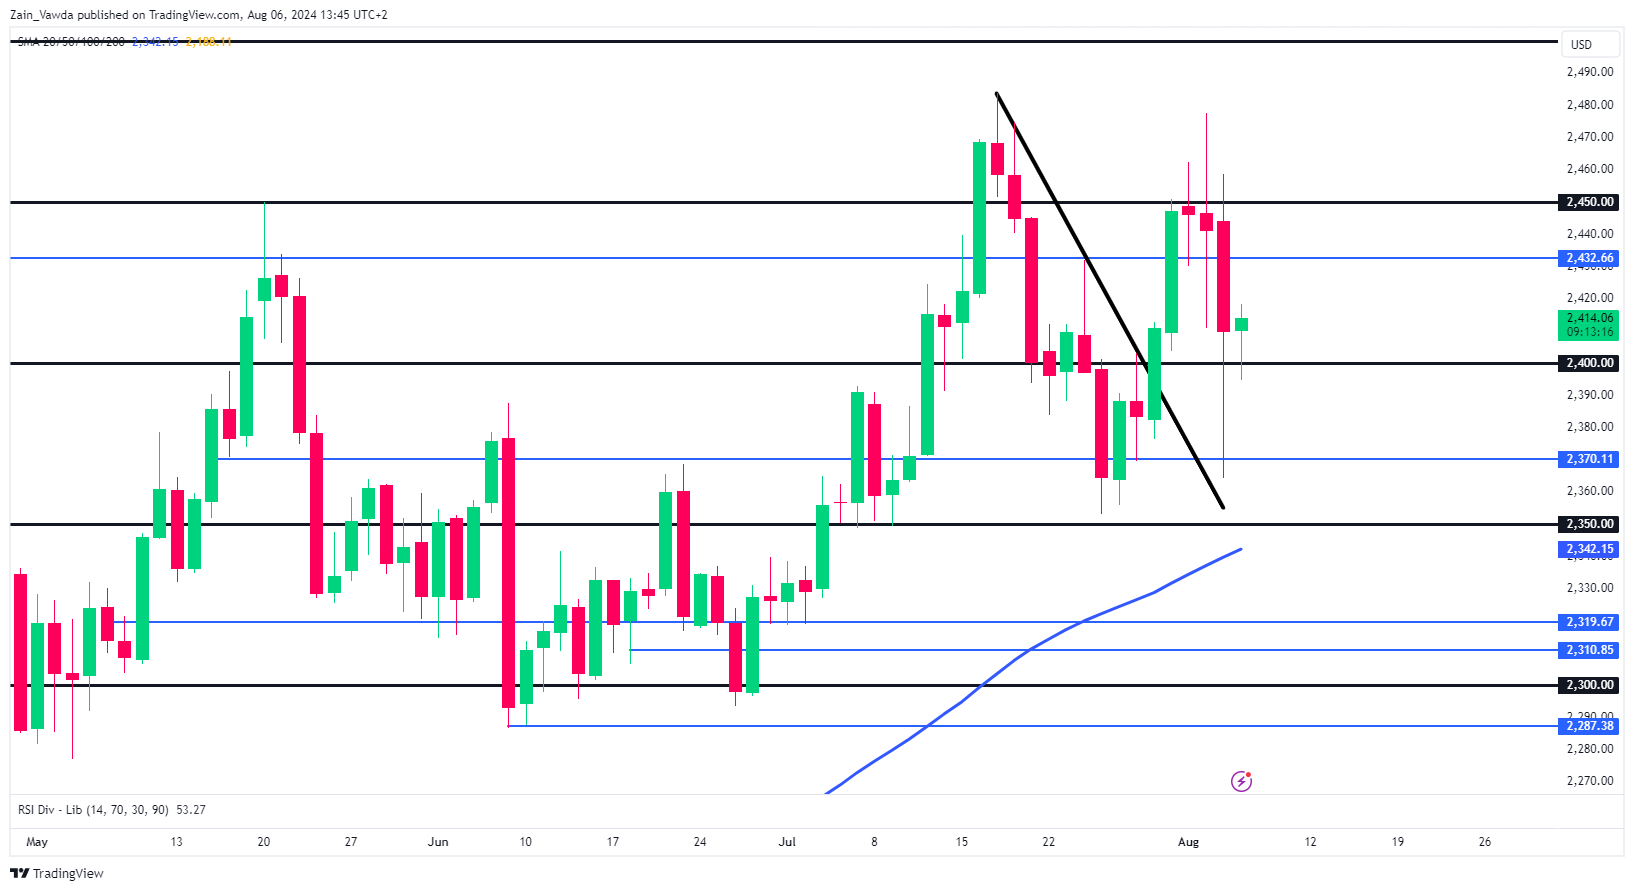
From a technical standpoint, gold made an impressive recovery during the US session yesterday, leaving markets puzzled by its earlier selloff.
This rebound positions the precious metal for potential further gains. Immediate support at $2,400 is crucial; a daily candle close below this level could signal sustained downside pressure. The key question remains whether this will be counterbalanced by gold’s safe-haven appeal.
GOLD (XAU/USD) Chart, August 6, 2024
Source: TradingView (click to enlarge)
Support
- 2400
- 2392
- 2370
Resistance
- 2420
- 2450
- 2470
Canada’s Trade Position Swings to a Surplus in June
Canada’s merchandise trade balance moved sharply into surplus territory in June after three months in deficit. June's surplus registered at $638 million, with last month's deficit being revised slightly lower to $1.6 billion.
Merchandise exports increased by a hefty 5.5% in June, pulling the value of goods exported to the highest level since January 2023. Increases were broad-based, with shipments up in 9 of 11 sectors. Leading the charge was a 13.3% month-on-month (m/m) increase in crude oil shipments helped by the recently completed Trans Mountain pipeline. Exports of metal and non-metallic products also advanced at a healthy 11.8% m/m pace.
Merchandise imports also increase in June, but by a smaller amount (1.9% m/m). Gains were also broad based as 9 of 11 sectors posted increases, with outsized contributions from a 5.1% m/m increase in passenger cars and light truck imports. Elsewhere, consumer goods imports rose by 3.7% m/m and imports of pharmaceutical goods advanced by 16.9%.
In volume terms, merchandise exports and imports rose by 4.57% and 1.16% m/m, respectively.
Canada's merchandise trade surplus with the United States widened for a third straight month, up to $9.4 billion in June from $8.8 billion the month prior.
Key Implications
Despite robust export activity in June, trade will likely act as a headwind to second quarter GDP growth, as April and May data came in on the weaker end. That being said, the hand-off into next quarter could prove to be significant. The effects of the Trans Mountain pipeline expansion are now flowing through the data, with strong crude oil exports expected in the coming months.
In the Bank of Canada's recently released Monetary Policy Report (MPR), they expect GDP in the third quarter to grow by a sizeable 2.8%, higher than most forecasters expect. While we still have minimal data on how the entire economy is tracking, Q3 trade could add up to 1.0 percentage points (ppts) to headline GDP growth.
EUR/USD Mid-Day Outlook
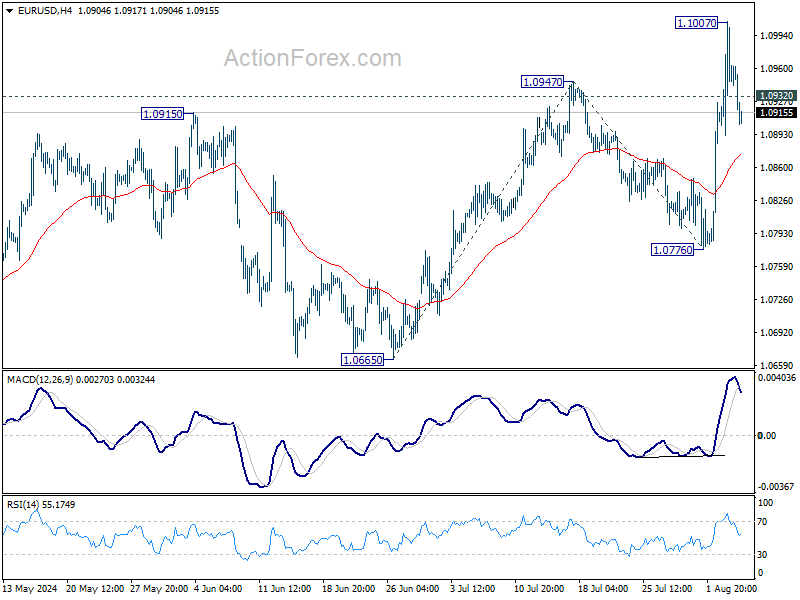
Daily Pivots: (S1) 1.0893; (P) 1.0951; (R1) 1.1009; More.....
Intraday bias in EUR/USD is turned neutral with break of 1.0932 minor support. Some consolidations would be seen below 1.1007 first. While deeper retreat cannot be ruled out, downside should be contained well above 1.0776 support. On the upside, break of 1.1007 will resume recent rally from 1.0665 to 100% projection of 1.0665 to 1.0947 from 1.0776 at 1.1056 next.
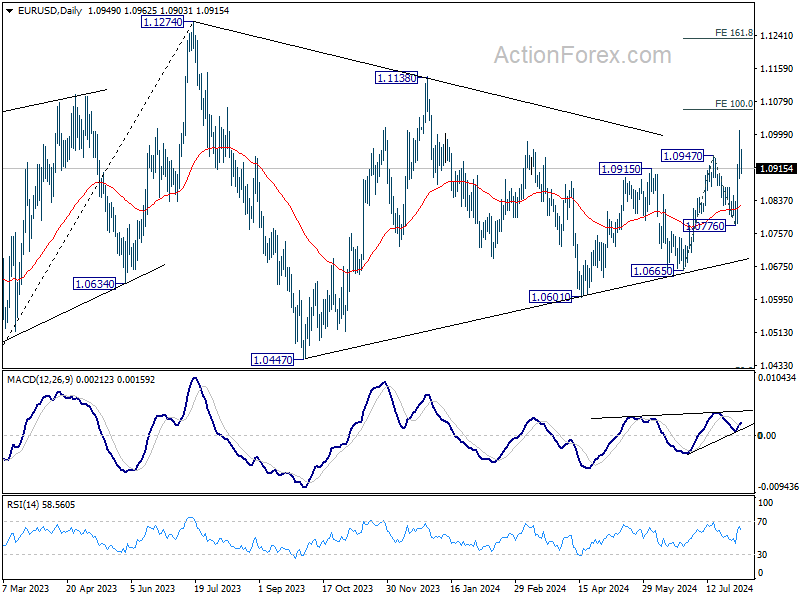
In the bigger picture, price actions from 1.1274 are viewed as a corrective pattern that's still be in progress. Break of 1.1138 resistance will be the first signal that rise from 0.9534 (2022 low) is ready to resume through 1.1274 (2023 high). However, break of 1.0776 support will extend the correction with another falling leg back towards 1.0447 support.
USD/CHF Mid-Day Outlook
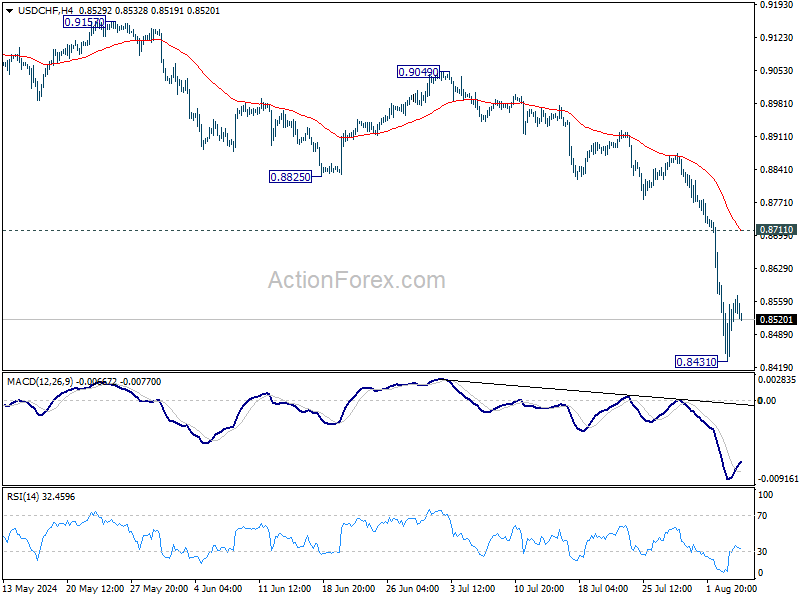
Daily Pivots: (S1) 0.8437; (P) 0.8520; (R1) 0.8606; More…
Intraday bias in USD/CHF remains neutral for consolidations above 0.8431. Upside of recovery should be limited by 0.8711 resistance to bring another fall. On the downside, below 0.8431 will resume the decline from 0.9223 to retest 0.8332 low.
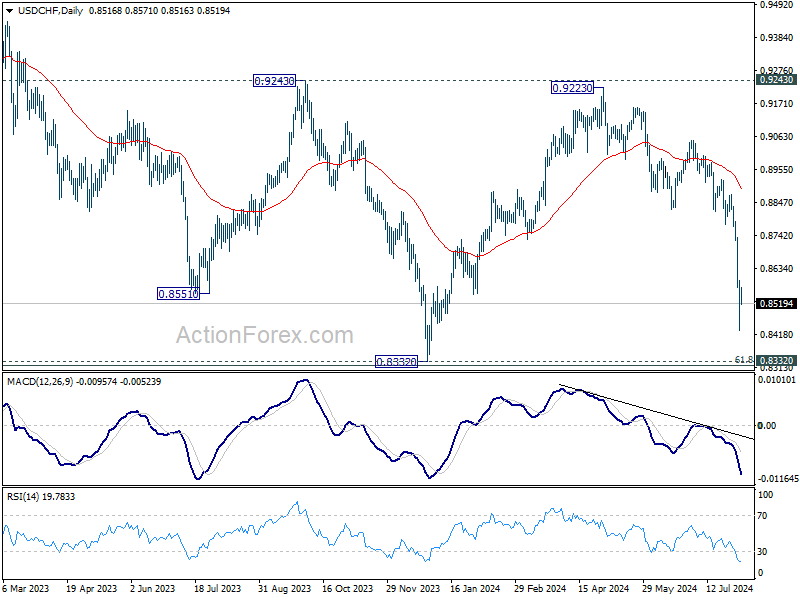
In the bigger picture, price actions from 0.8332 (2023 low) are currently seen as a medium term corrective pattern, with fall from 0.9223 as the second leg. Strong support could be seen from 0.8332 to bring rebound. Yet, overall outlook will continue to stay bearish as long as 0.9243 resistance holds. Firm break of 0.8332, however, will resume larger down trend from 1.0146 (2022 high).
USD/JPY Mid-Day Outlook
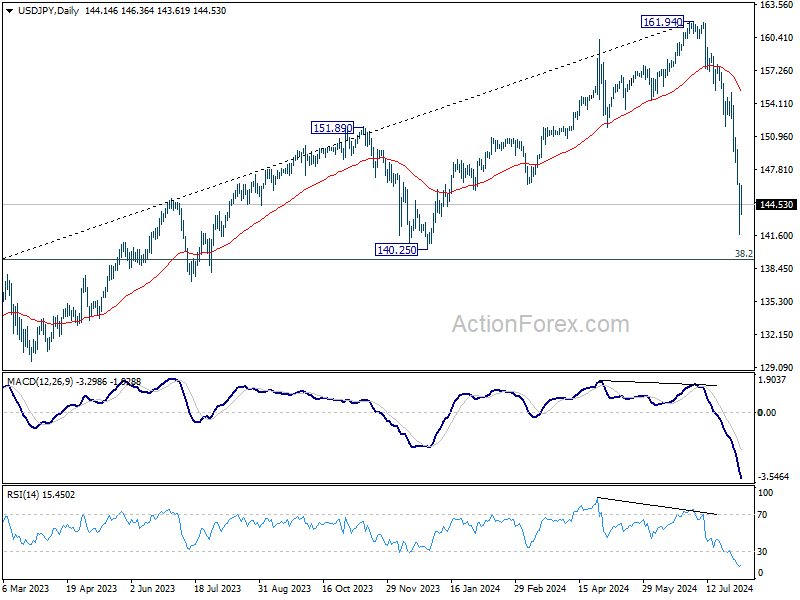
Daily Pivots: (S1) 141.68; (P) 144.17; (R1) 146.64; More...
Intraday bias in USD/JPY remains neutral for consolidation above 141.67. Upside of recovery should be limited by 150.88 resistance to bring another fall. On the downside, break of 141.67 will resume the decline from 161.94 to 140.25 support next.
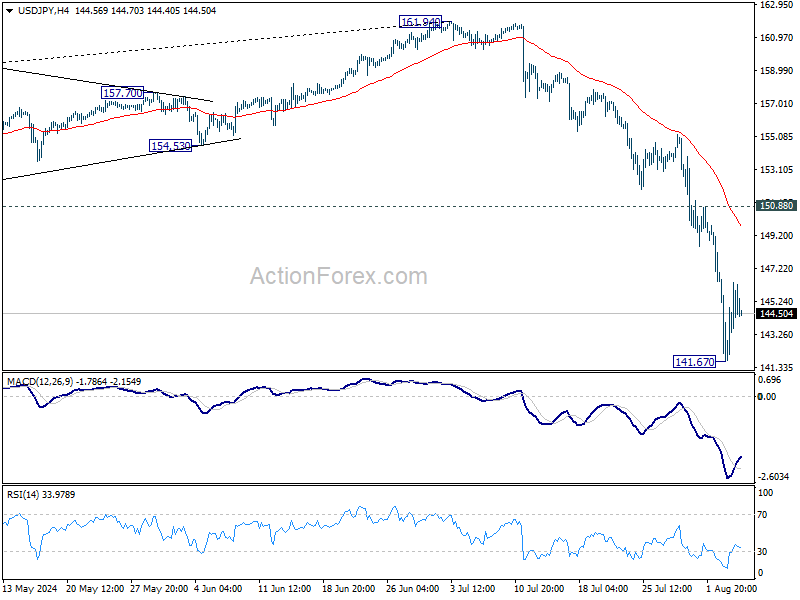
In the bigger picture, the strong break of 55 W EMA (now at 149.98) argue that fall from 161.94 medium term is correcting whole up trend from 102.58 (2021 low). Deeper decline could be seen to 38.2% retracement of 102.58 to 161.94 at 139.26, which is close to 140.25 support. In any case, risk will stay on the downside as long as 55 W EMA (now at 149.83) holds. Nevertheless, firm break of 55 W EMA will suggest that the range for medium term corrective pattern is already set.
GBP/USD Mid-Day Outlook
Daily Pivots: (S1) 1.2719; (P) 1.2769; (R1) 1.2829; More...
GBP/USD's fall from 1.3043 resumed by breaking 1.2706 temporary low and intraday bias is back on the downside for 1.2612 support. Decisive break there should confirm that rise from 1.2298 has completed, and target this support next. For now, risk will remain on the downside as long as 1.2839 resistance holds, in case of recovery.

In the bigger picture, current development suggests that corrective pattern from 1.3141 is extending with fall from 1.3043 as another leg. Break of 1.2612 support would strengthen this case. But still, downside should be contained by 1.2036/2298 support zone even in case of deep decline. Rise from 1.0351 (2022 low) remains in favor to resume at a later stage.
