Sample Category Title
USD/JPY Falls Below 150 Yen Per Dollar
The yen was last this strong in mid-March this year. News from central banks contributed to the decline in USD/JPY.
Yesterday, the Bank of Japan raised interest rates to levels not seen in the past 15 years. Conversely, the Fed kept rates unchanged as expected but "opened the door" for a possible cut in September, according to Reuters. This news weakened the USD and provided a bullish boost to U.S. stock markets.
This shift highlights the collapse of the "carry trade" strategy, where high U.S. rates and low Japanese rates supported the rise of USD/JPY. From early 2023 to the July peak in 2024, USD/JPY rose by about 23%, but it started declining amid news of Bank of Japan's currency interventions.
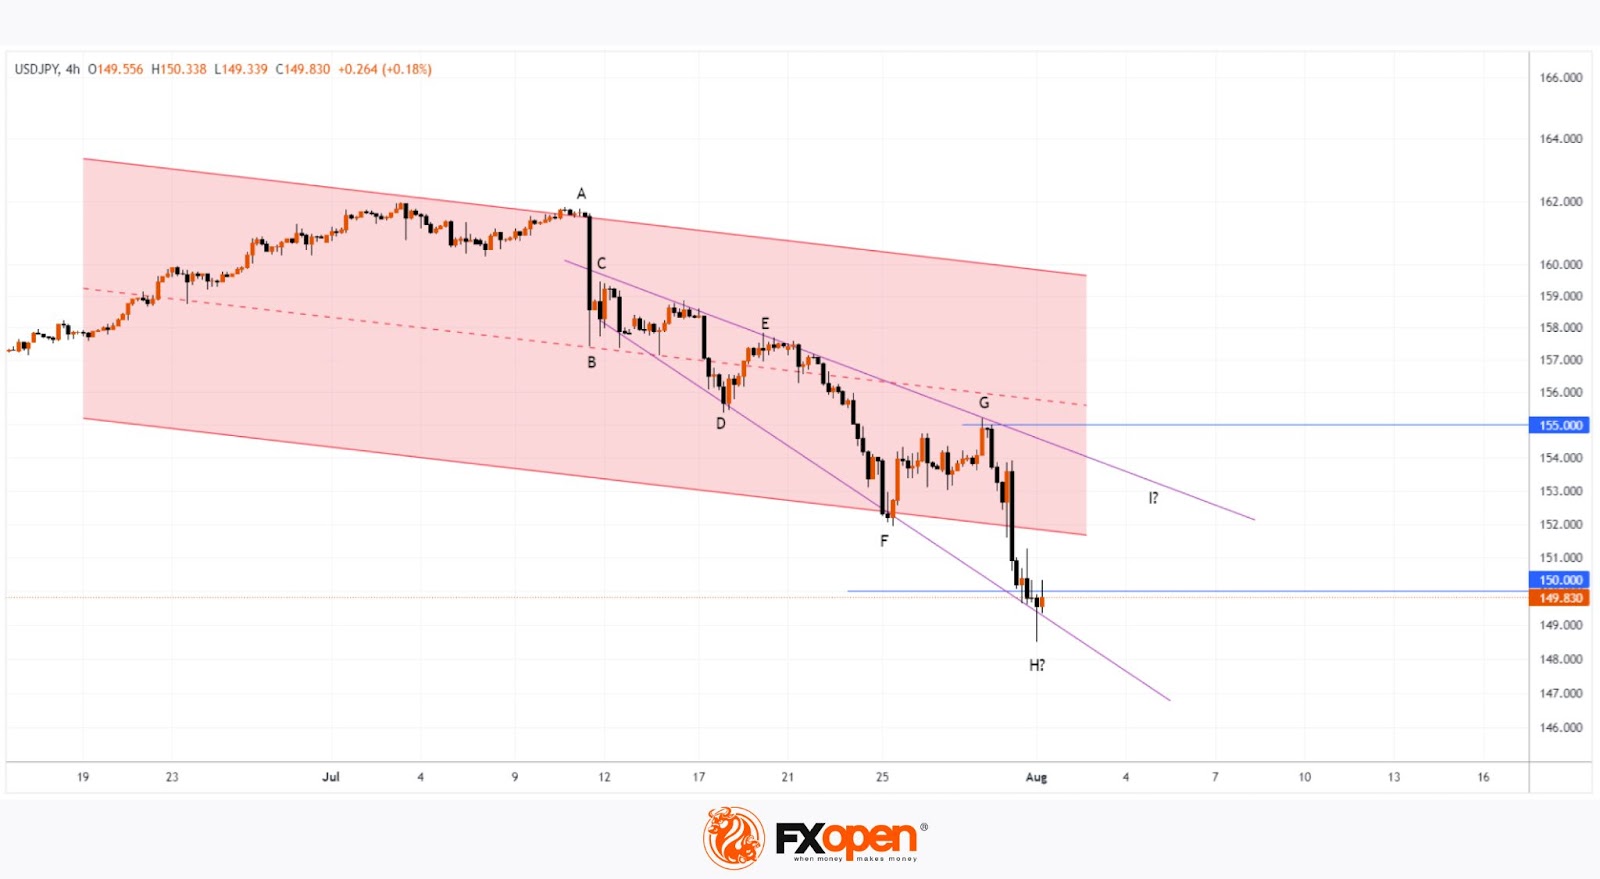
On July 25, analysing the USD/JPY chart, we:
→ Constructed a descending channel (shown in red);
→ Predicted a scenario with a technical rebound from the lower boundary of the red channel.
Since then, USD/JPY climbed to the psychological mark of 155 yen per dollar on July 30, where the downtrend resumed after a false breakout.
How might the USD/JPY situation develop?
Technical Analysis of USD/JPY Today:
→ The chart forms a structure of swing extremes A-B-C-D-E-F-G. Notably, each subsequent recovery is about 50% of the previous downward impulse, indicating dominant supply forces. The expanding channel, shown in purple, also confirms this.
→ The psychological level of 150 yen per dollar may act as support, mirroring the resistance at 155 yen. Today's price action shows signs of demand activation below 150.
Therefore, it's possible that:
→ After a decline of over 8% from peak A, bears may want to take profits;
→ A corrective move H→I towards the upper purple boundary could form.
Trade over 50 forex markets 24 hours a day with FXOpen. Take advantage of low commissions, deep liquidity, and spreads from 0.0 pips. Open your FXOpen account now or learn more about trading forex with FXOpen.
This article represents the opinion of the Companies operating under the FXOpen brand only. It is not to be construed as an offer, solicitation, or recommendation with respect to products and services provided by the Companies operating under the FXOpen brand, nor is it to be considered financial advice.
GBP/JPY Daily Outlook
Daily Pivots: (S1) 190.80; (P) 194.20; (R1) 196.23; More...
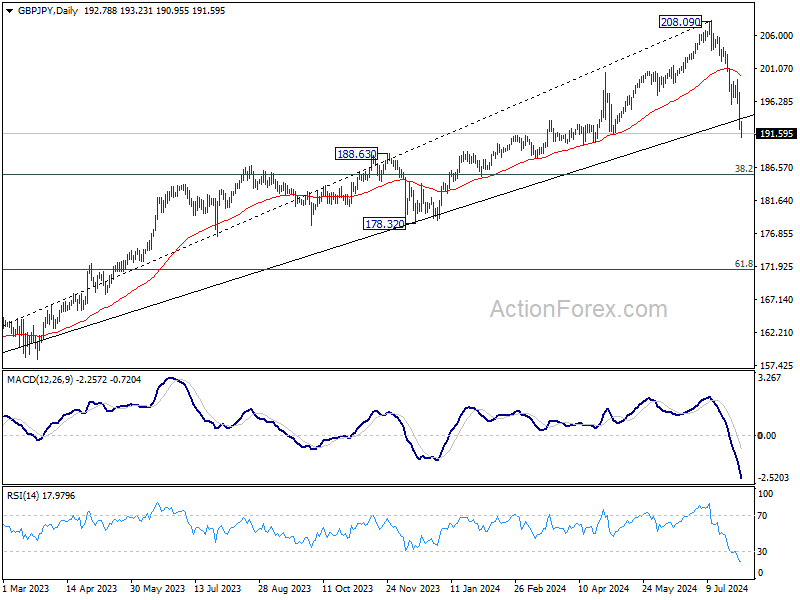
GBP/JPY's fall from 208.09 continues today and intraday bias stays on the downside. Current decline is a larger scale correction and should target 185.49 fibonacci level. For now, outlook will continue to stay bearish as long as 199.45 resistance holds, in case of recovery.
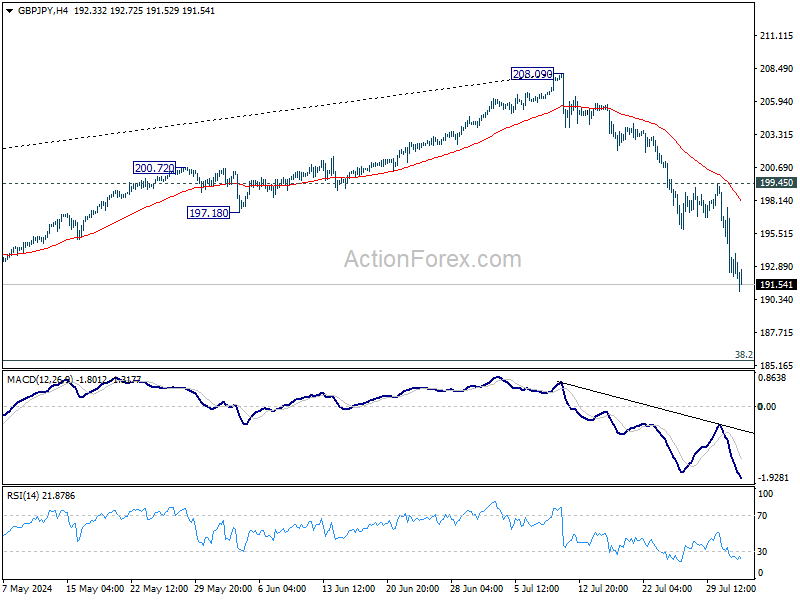
In the bigger picture, considering bearish divergence condition in W MACD, 208.09 might be a medium term top and fall from there could already be correcting whole up trend from 148.93 (2022 low). Risk will now stay on the downside as long as 55 D EMA (now at 199.93) holds. Deeper fall would be seen to 38.2% retracement of 148.93 to 208.09 at 185.49.
EUR/JPY Daily Outlook
Daily Pivots: (S1) 160.76; (P) 163.65; (R1) 165.29; More...
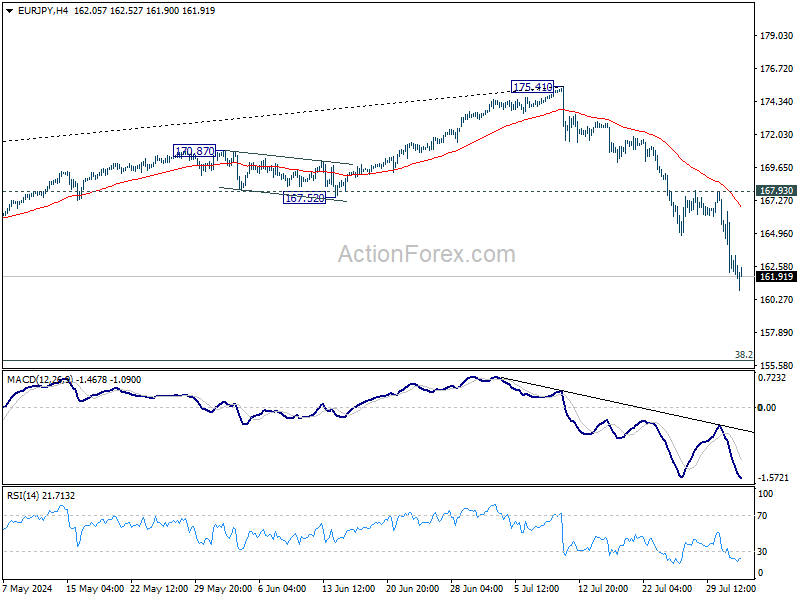
EUR/JPY's fall from 175.41 is in progress and intraday bias remains on the downside. This decline should be a larger scale correction and should target 155.91 fibonacci level next. On the upside, break of 167.93 resistance is needed to confirm short term bottoming. Otherwise, outlook will stay bearish in case of recovery.
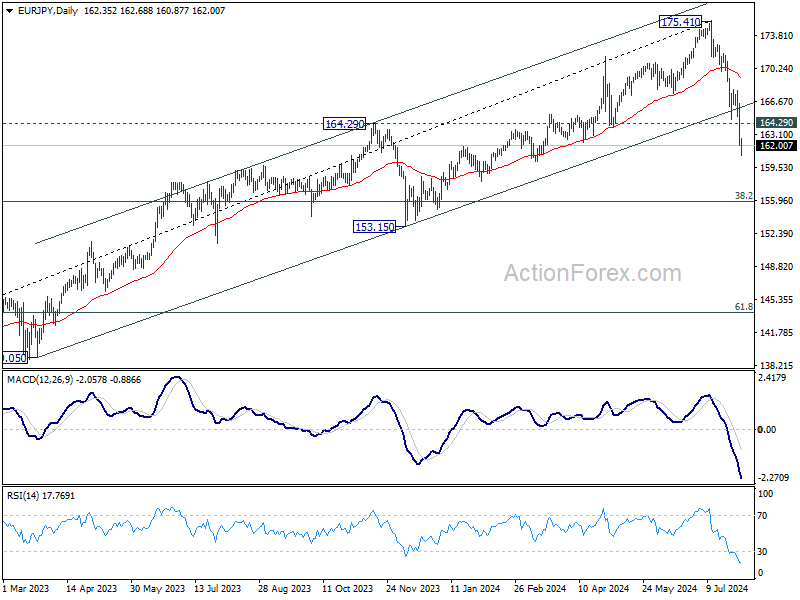
In the bigger picture, break of 164.29 resistance turned support indicates that fall from 175.41 medium term top is at least correcting the rise from 124.73, with risk of bearish trend reversal. Deeper decline would be seen to 38.2% retracement of 124.37 to 175.41 at 155.91. This will now remain the favored case as long as 55 D EMA (now at 169.17) holds, even in case of strong rebound.
EUR/GBP Daily Outlook
Daily Pivots: (S1) 0.8409; (P) 0.8429; (R1) 0.8441; More....
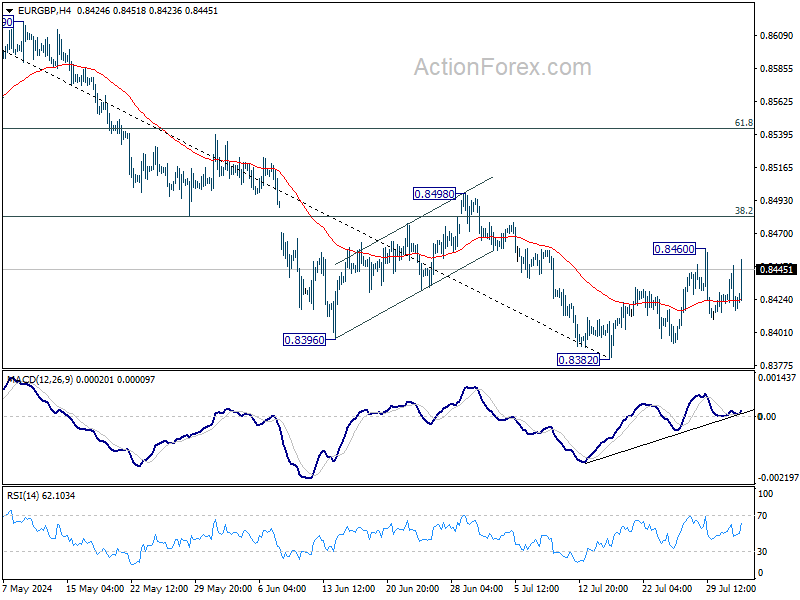
Intraday bias in EUR/GBP remains neutral for the moment. Consolidation from 0.8382 might extend with stronger recovery. But outlook continues to stay bearish with 0.8498 resistance intact. Firm break of 0.8382 will resume larger down trend next target will be 138.2% projection of 0.8764 to 0.8497 from 0.8463 at 0.8274.
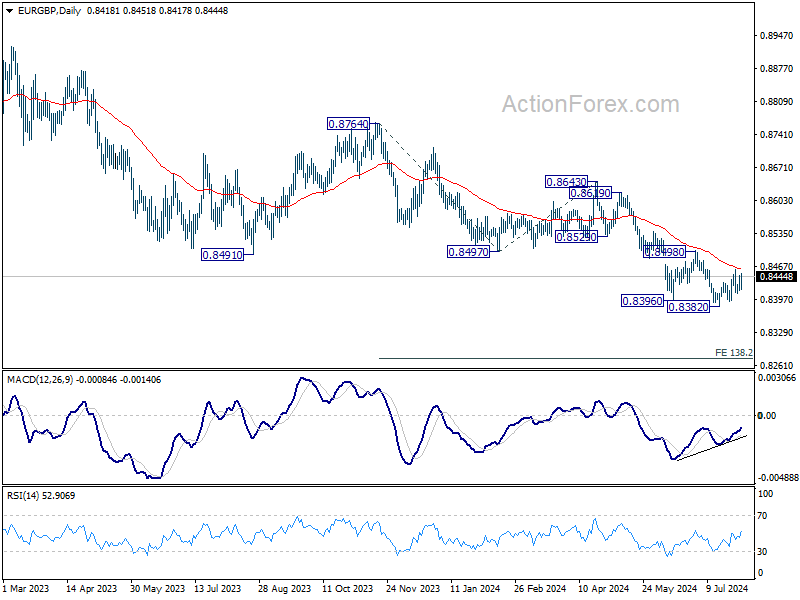
In the bigger picture, down trend from 0.9267 (2022 high) is in progress. Next target is 0.8201 key support (2022 low). For now, outlook will remain bearish as long as 0.8643 resistance holds, even in case of strong rebound.
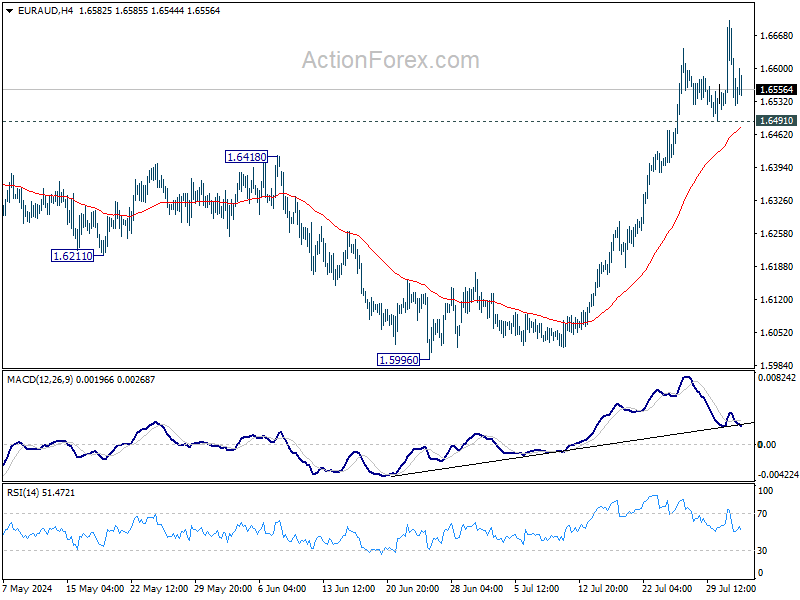
EUR/AUD Daily Outlook
Daily Pivots: (S1) 1.6482; (P) 1.6592; (R1) 1.6659; More...
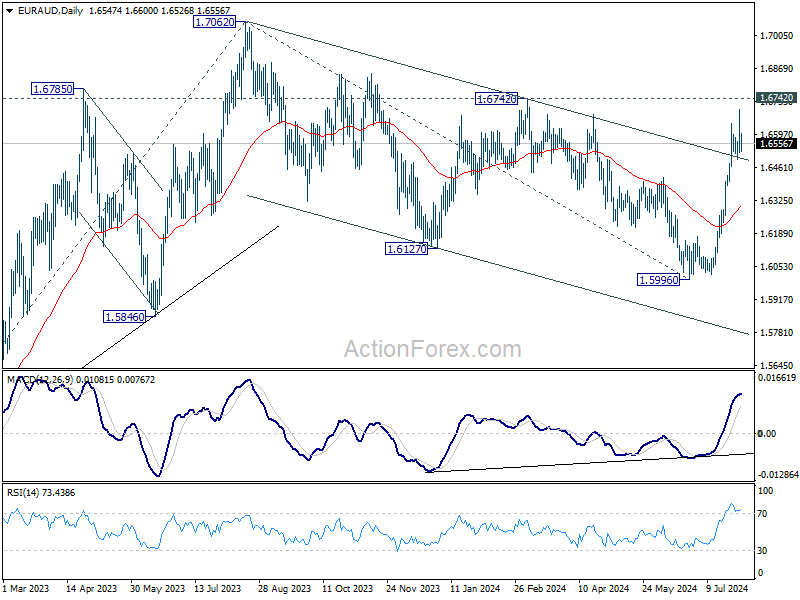
Further rise is expected in EUR/AUD with 1.6491 support intact. As noted before, corrective fall from 1.7062 should have completed with three waves down to 1.5998. Firm break of 1.6742 will argue that larger up trend is going to resume through 1.7062 high. On the downside, however, break of 1.6491 support will delay the bullish case and bring retreat first.
In the bigger picture, fall from 1.7062 medium term top is seen as a correction to the up trend from 1.4281 (2022 low) and could have completed after hitting 38.2% retracement of 1.4281 to 1.7062 at 1.6000. On resumption next target will be 61.8% projection of 1.4281 to 1.7062 from 1.5996 at 1.7715. This will now remain the favored case as long as 55 D EMA (now at 1.6296) holds.
EUR/CHF Daily Outlook
Daily Pivots: (S1) 0.9480; (P) 0.9522; (R1) 0.9549; More....
EUR/CHF's fall from 0.9928 resumed by breaking through 0.9476 support. Intraday bias is now on the downside. Further decline should be seen to 100% projection of 0.9928 to 0.94767 from 0.9772 at 0.9320. On the upside, break of 0.9605 resistance is needed to confirm short term bottoming. Otherwise, outlook will remain bearish in case of recovery.

In the bigger picture, with 1.0095 key medium term resistance intact, price actions from 0.9252 (2023 low) are seen as a corrective pattern. Fall from 0.9928 is seen as the second leg that's in progress to retest 0.9252 low. But strong support should be seen there to extend the corrective pattern with another rising leg. In any case, medium term outlook will be neutral at best as long as 1.0095 structural resistance holds.

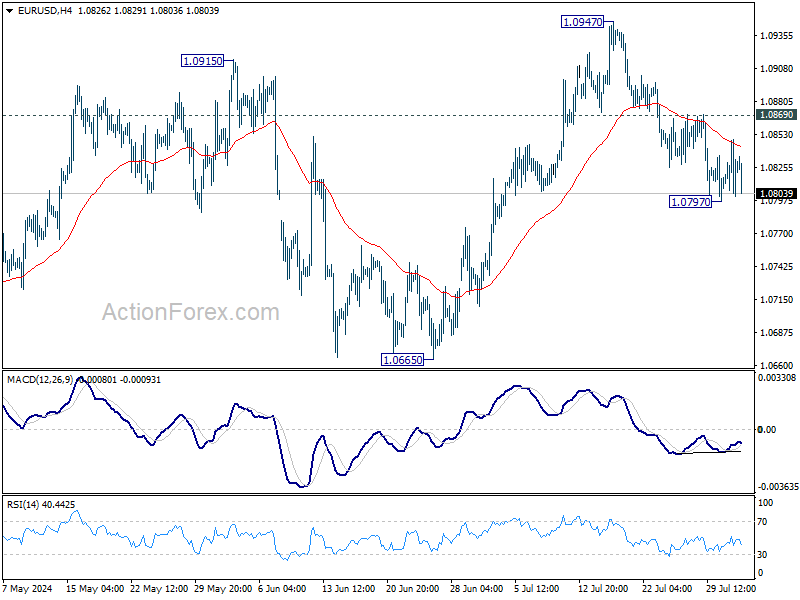
EUR/USD Daily Outlook
Daily Pivots: (S1) 1.0802; (P) 1.0826; (R1) 1.0849; More.....
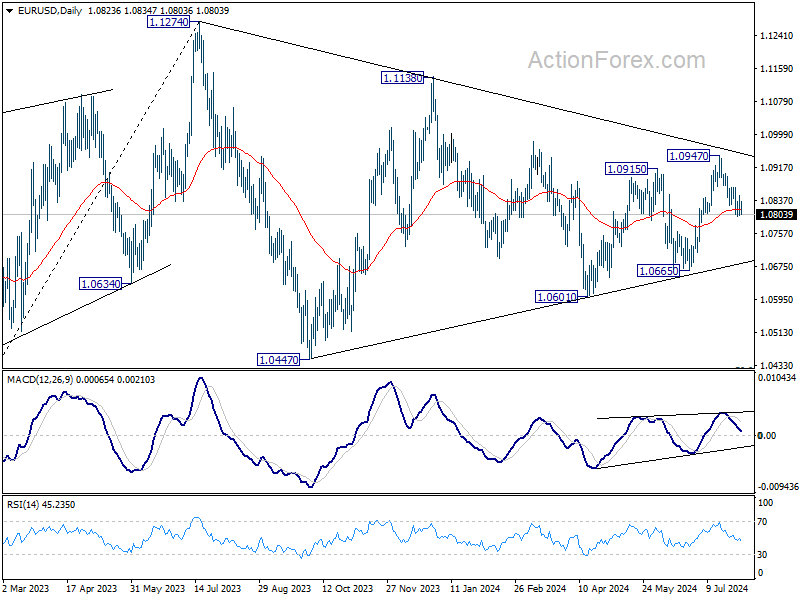
Intraday bias in EUR/USD remains neutral for consolidation above 1.0797 temporary low. Further decline decline is expected with 1.0869 resistance intact. Sustained break of 55 D EMA (now at 1.0815) will argue that whole rebound from 1.0601 has completed with three waves up to 1.0947. Deeper decline should then be seen to 1.0601/0665 support zone next. Nevertheless, break of 1.0869 minor resistance will bring retest of 1.0947 instead.
In the bigger picture, price actions from 1.1274 are viewed as a corrective pattern that's still be in progress. Break of 1.1138 resistance will be the first signal that rise from 0.9534 (2022 low) is ready to resume through 1.1274 (2023 high). However, break of 1.0665 support will extend the correction with another falling leg back towards 1.0447 support.
USD/JPY Daily Outlook
Daily Pivots: (S1) 148.42; (P) 151.16; (R1) 152.72; More...
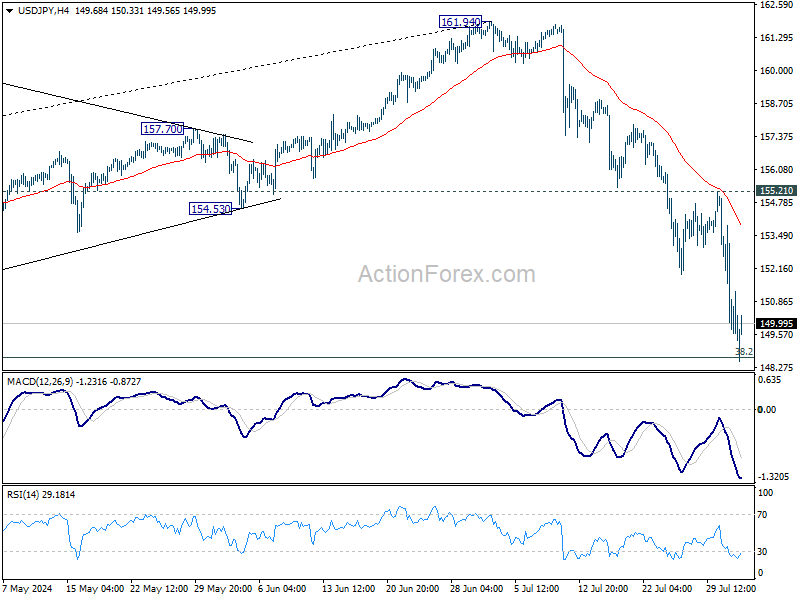
USD/JPY's fall from 161.94 is still in progress and hit 148.66 fibonacci level already. Strong support could be seen from the current level, which is close to medium term channel support (now at 148.22) to bring rebound. However, break of 155.21 resistance is needed to confirm short term bottoming. Otherwise, risk will stay on the downside in case of recovery.
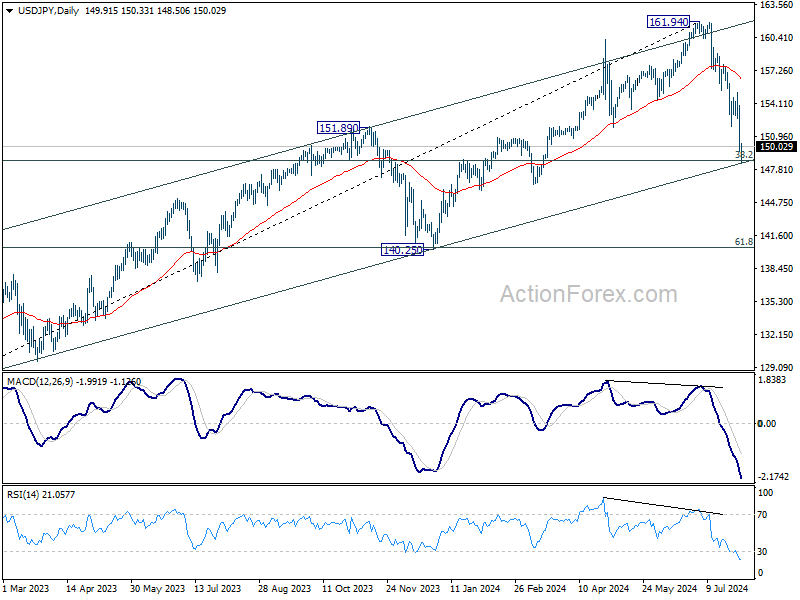
In the bigger picture, considering the depth and momentum of the current decline, 161.94 should be a medium term top already. Fall from there is seen as correcting the whole rise from 127.20 (2023 low) at least. Next target is 38.2% retracement of 127.20 to 161.94 at 148.66. Decisive break there will pave the way to 140.25 support next. Risk will now stay on the downside as long as 55 D EMA (now at 156.42) holds, in case of rebound.
GBP/USD Daily Outlook
Daily Pivots: (S1) 1.2830; (P) 1.2847; (R1) 1.2873; More...
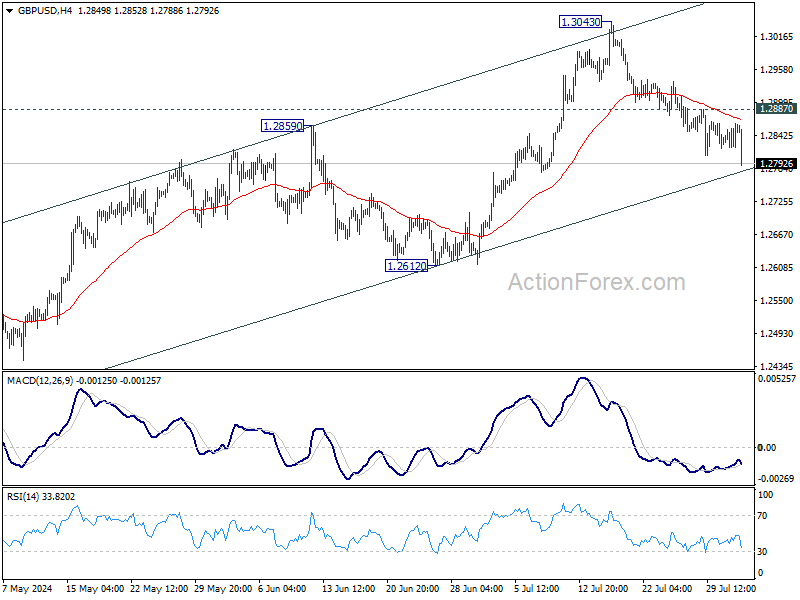
GBP/USD's fall from 1.3043 continues today despite slightly weak downside momentum as seen in 4H MACD. Decisive break of 55 D EMA (now at 1.2782) will suggest that rise from 1.2298 has completed with three waves up to 1.3043. Deeper fall would be seen to 1.2612 support and below. On the upside, above 1.2887 minor resistance will turn intraday bias back to the upside for stronger rebound.
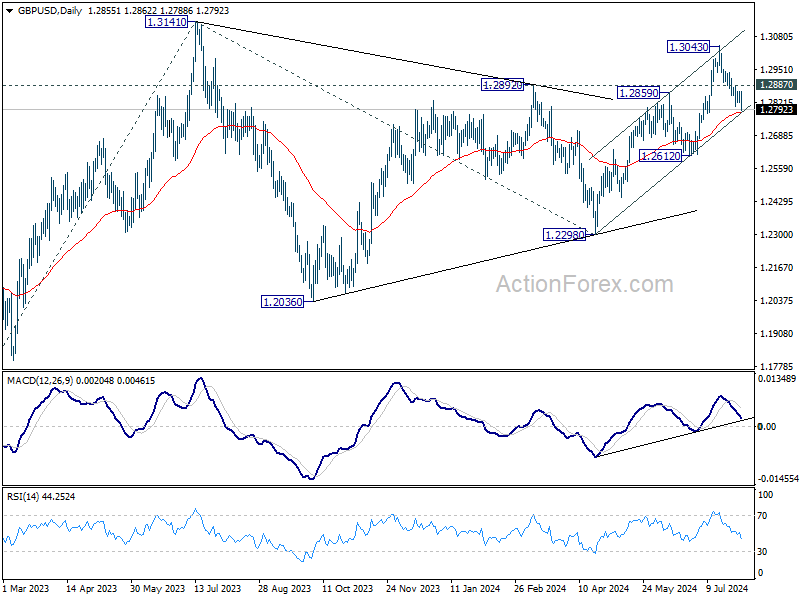
In the bigger picture, corrective pattern from 1.3141 medium term top (2023 high) could have completed with three waves to 1.2298 already. This will now remain the favored case as long as 1.2612 support holds. Firm break of 1.3141 will target 61.8% projection of 1.0351 (2022 low) to 1.3141 from 1.2298 at 1.4022. However, break of 1.2612 support argue that this corrective pattern is extending with another falling leg.
USD/CHF Daily Outlook
Daily Pivots: (S1) 0.8753; (P) 0.8797; (R1) 0.8823; More…
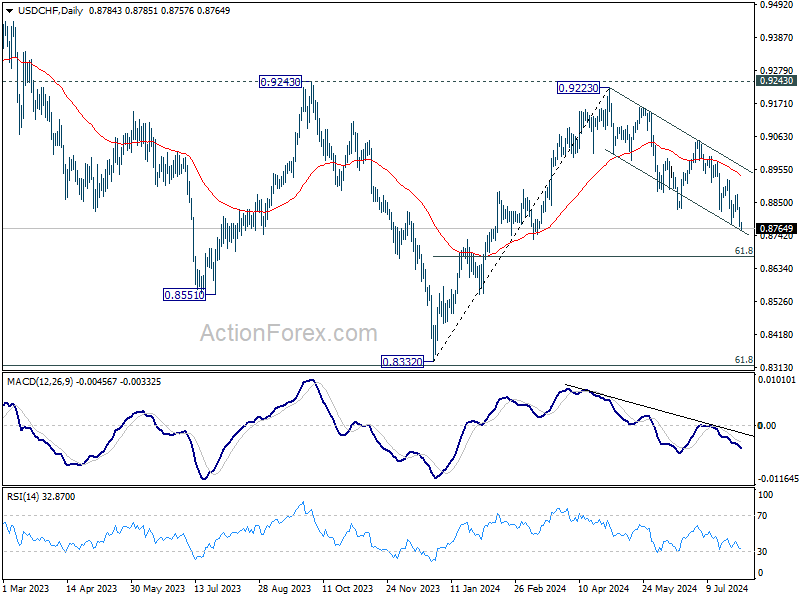
USD/CHF's decline from 0.9223 resumed by breaking 0.8776 and intraday bias is back on the downside. Deeper fall should be seen to 61.8% retracement of 0.8332 to 0.9223 at 0.8672 next. For now, risk will stay on the downside as long as 0.8874 resistance holds, in case of recovery.
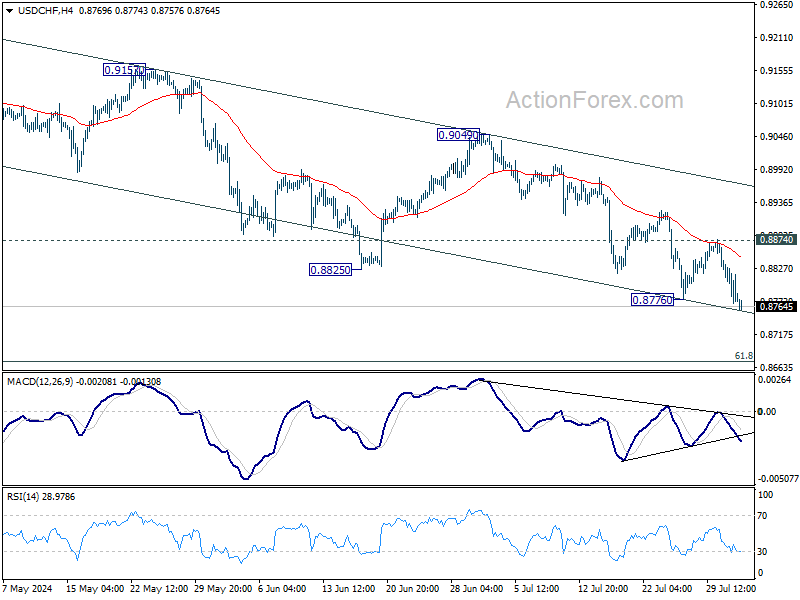
In the bigger picture, with 0.9243 resistance intact, medium term outlook in USD/CHF is neutral at best. For now, more sideway trading is likely between 0.8332/9243. However, firm break of 0.9243 will indicate larger bullish trend reversal.