Sample Category Title
Bank of England Joins Central Bank Rate Cut Club
Summary
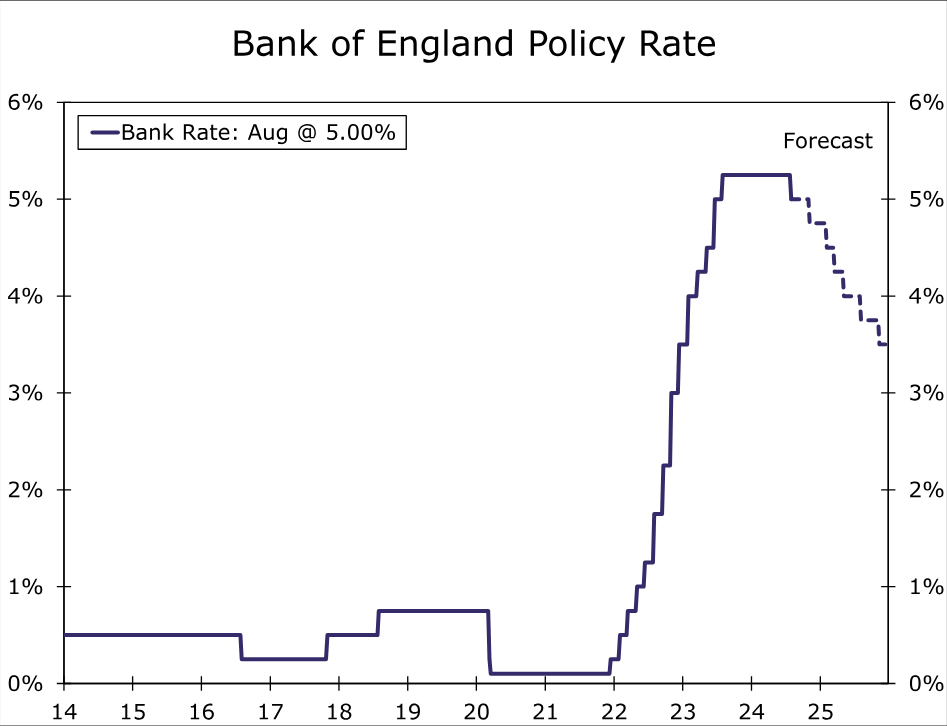
- The Bank of England (BoE) joined the growing group of G10 central banks that have eased monetary policy, by delivering an initial 25 bps policy rate cut to 5.00% at today's monetary policy announcement. The guidance from the BoE's announcement was also somewhat cautious, for now likely arguing against a steady series of rate cuts at each and every meeting.
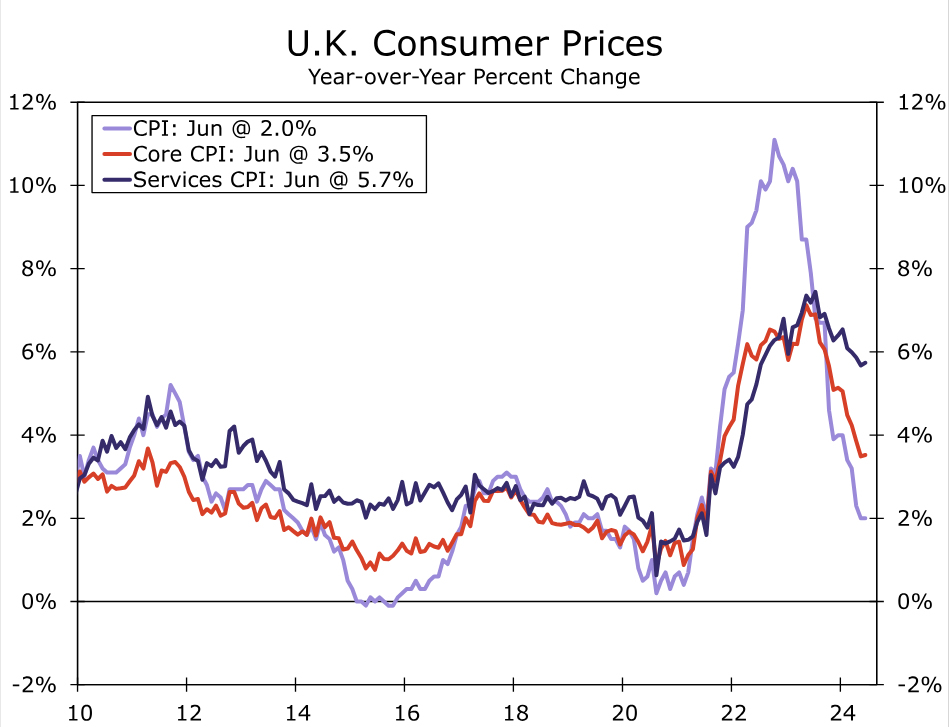
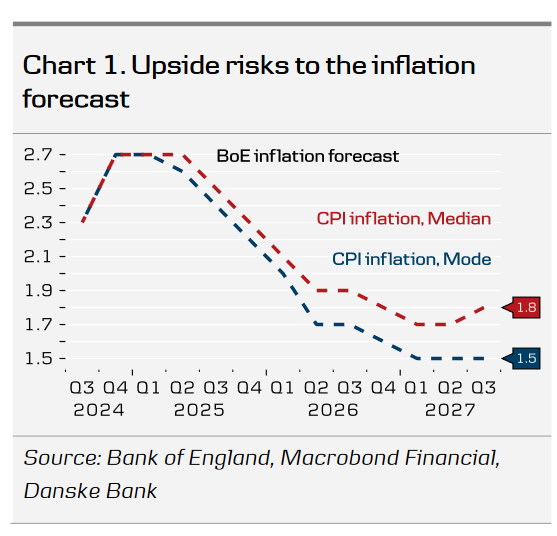
- That message was reinforced by the central bank's updated economic projections, which envisage stronger GDP growth of 1.2% in 2024 and also see headline CPI inflation rebounding to 2.7% by the end of this year. Based on market-implied interest rates, however, inflation is expected to undershoot the 2% inflation target over the medium term.
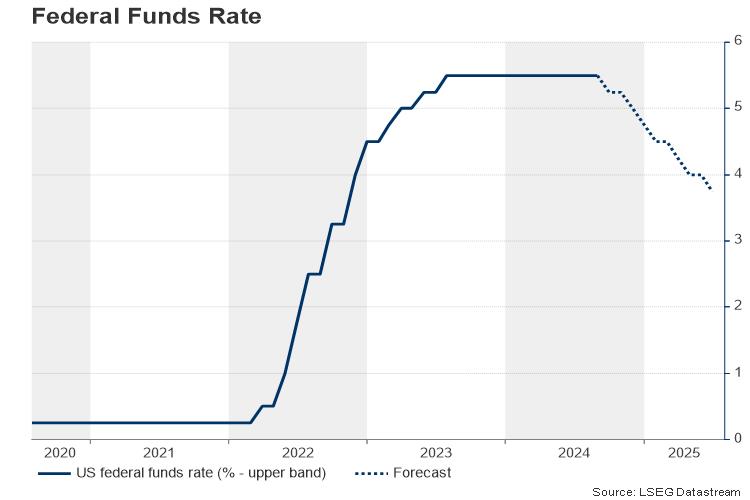
- Overall, we view today's announcement as consistent with our view the Bank of England will take an initially cautious approach to monetary easing. We forecast only one more policy rate cut this year, of 25 bps at the November monetary policy announcement. We expect somewhat faster easing in 2025, and forecast a cumulative 125 bps of rate cuts next year which would see the policy rate end 2025 at 3.50%.
Bank of England Delivers Rate Cut, Offers Careful Guidance
The Bank of England (BoE) joined the growing group of G10 central banks that have eased monetary policy, by delivering an initial 25 bps policy rate cut to 5.00% at today's monetary policy announcement. To be sure, the decision was finely balanced, with a closely split 5-4 vote from policymakers to lower interest rates. The guidance from the BoE's announcement was also somewhat cautious, for now likely arguing against a steady series of rate cuts at each and every meeting.
To be sure, there was some softening in the BoE's assessment of the outlook for underlying inflation, comments that broadly justified the decision to lower interest rates. The central bank said it:
“expects the fall in headline inflation, and normalization in many indicators of inflation expectations, to continue to feed through to weaker pay and price-setting dynamics. A margin of slack should emerge in the economy as GDP falls below potential and the labor market eases further. Domestic inflationary persistence is expected to fade away over the next few years, owing to the restrictive stance of monetary policy.”
At the same time, the BoE acknowledged the risk that inflationary pressures from second-round effects could prove more enduring in the medium term. Balancing these factors, the BoE said it is now appropriate to reduce the degree of policy restrictiveness “slightly.” The central bank repeated, however, that “monetary policy will need to continue to remain restrictive for sufficiently long until the risks to inflation returning sustainably to the 2% target in the medium term have dissipated further.” And finally, the BoE said it will decide the appropriate degree of monetary policy restrictiveness at “each” meeting. Reinforcing that final point at a post meeting press conference, Governor Bailey said:
“I’m not giving you any view on the path of rates to come — I’m saying we will go from meeting to meeting, as we always do”
The Bank of England also published updated economic projections alongside today's announcement. Those forecasts are based on market-implied interest rates, which envisage the policy rate falling to 4.1% in 2025 and 3.5% in three years' time. The forecasts anticipate stronger economic growth than previously, with 2024 GDP growth seen at 1.25% compared to 0.5% previously, while GDP growth forecasts for 2025 and 2026 were left unchanged at 1% and 1.25% respectively. Meanwhile, headline CPI inflation is expected to rebound to 2.7% by the end of this year but, based on market assumptions, fall below the 2% inflation target over the medium-term. Headline inflation is seen at 1.7% after two years, and 1.5% after three years.
Overall, we view today's announcement as consistent with our view the Bank of England will take an initially cautious approach to monetary easing. Stronger near-term economic growth, a likely rebound in near-term inflation and the possibility of upside surprises, and the BoE's careful guidance all point to a gradual pace of rate cuts. We expect only one more policy rate cut this year, of 25 bps at the November monetary policy announcement. As inflation recedes next year and given the potential for a medium-term inflation undershoot, we do expect a faster pace of easing in 2025. We forecast a cumulative 125 bps of rate cuts next year which would see the policy rate end 2025 at 3.50% and, moreover, we believe the balance of risks is tilted toward faster rate cuts than slower rate cuts in 2025.
Will US Nonfarm Payrolls Steal The Show This Week?
- US nonfarm payrolls to be released on Friday, 12:30 GMT
- Analysts estimate softer employment conditions in July
- Gold might push for an uptrend resumption if jobs data disappoint
Will July's NFP report be a game-changer?
Friday’s nonfarm payrolls report will not be the last before September’s FOMC policy meeting, but it will be the first release of the third quarter and the first of the second half of the year. Therefore, the figures might be symbolic, especially after the Fed decided to put a September rate cut on the table but provided little insight about whether there will be more reductions after November’s presidential election.
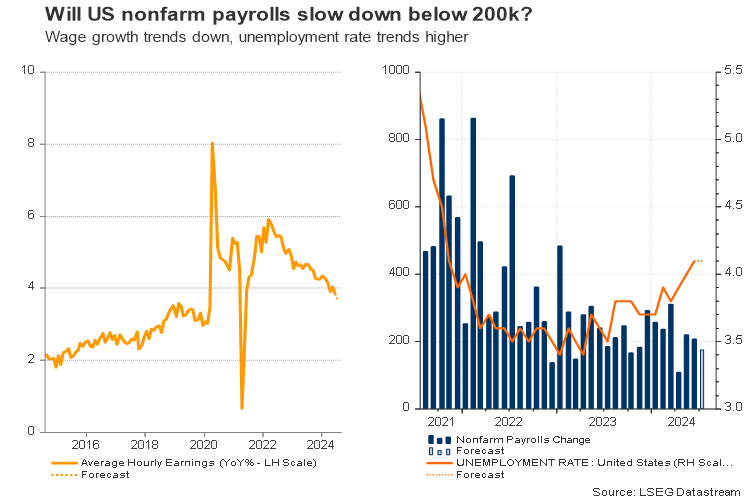
Forecasts are discouraging, but will the data surprise again?
Despite their past error in judging employment growth, investors continue to expect fewer than 200k new jobs, with estimates of 175k for July. Additionally, they anticipate a drop in average hourly earnings to 3.7% year-on-year, the lowest in 12 months, from the previous 3.9%, along with an unchanged unemployment rate of 4.1%.
Excluding the 2020-2022 period of lockdowns, the creation of jobs in the US economy tended to slow down during the month of July since 2015, but it was stronger than analysts expected most of the time. Hence, another upside surprise might be technically possible.
From recent evidence, the flash S&P Global business PMI survey for July indicated a moderate increase in employment, though what was more striking is that input costs headed higher on the back of rising raw material prices, shipping and labor costs, increasing fears that businesses might transfer some of the increased costs to consumers or accept lower margins.
On the other hand, the latest private ADP employment report displayed a softer pay increase of 4.8% for those who stayed in the same job – the lowest since 2021 but still comfortably higher than the 3.7% estimate for Friday’s average hourly earnings.
In any case, the negative relation between wage growth and unemployment rate have been markedly noticeable since the start of the year, with unemployment benefits trending up partially on the back of increased migration and average hourly earnings losing steam.
September rate cut is a done deal, what's next?
All in all, a quarter percentage point rate cut in September is a done deal and there is a small group of investors who foresee a more aggressive 50bps rate reduction. Perhaps the case for a bold double rate reduction might stay unfavorable unless there is a sharp deterioration in the employment data and inflation sinks towards the Fed’s 2.0% target.
In the meantime, a worse-than-expected NFP report, including a milder wage growth and/or another soft increase in the unemployment rate, could boost prospects for a second-rate cut in the coming months. Futures markets suggest a 60% probability for a 25bps rate cut in November and investors are certain that another one could follow in December.
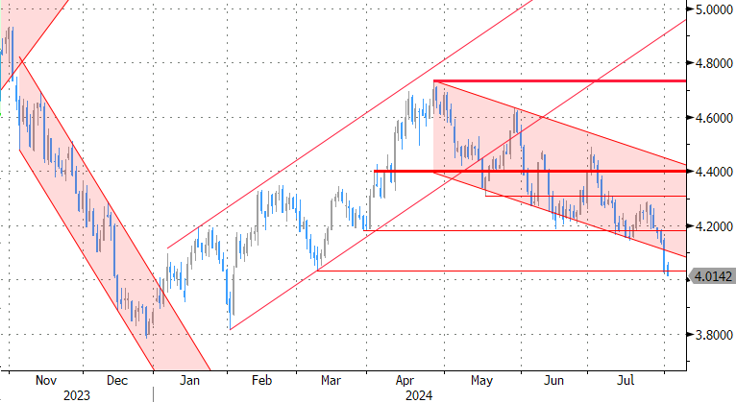
Gold
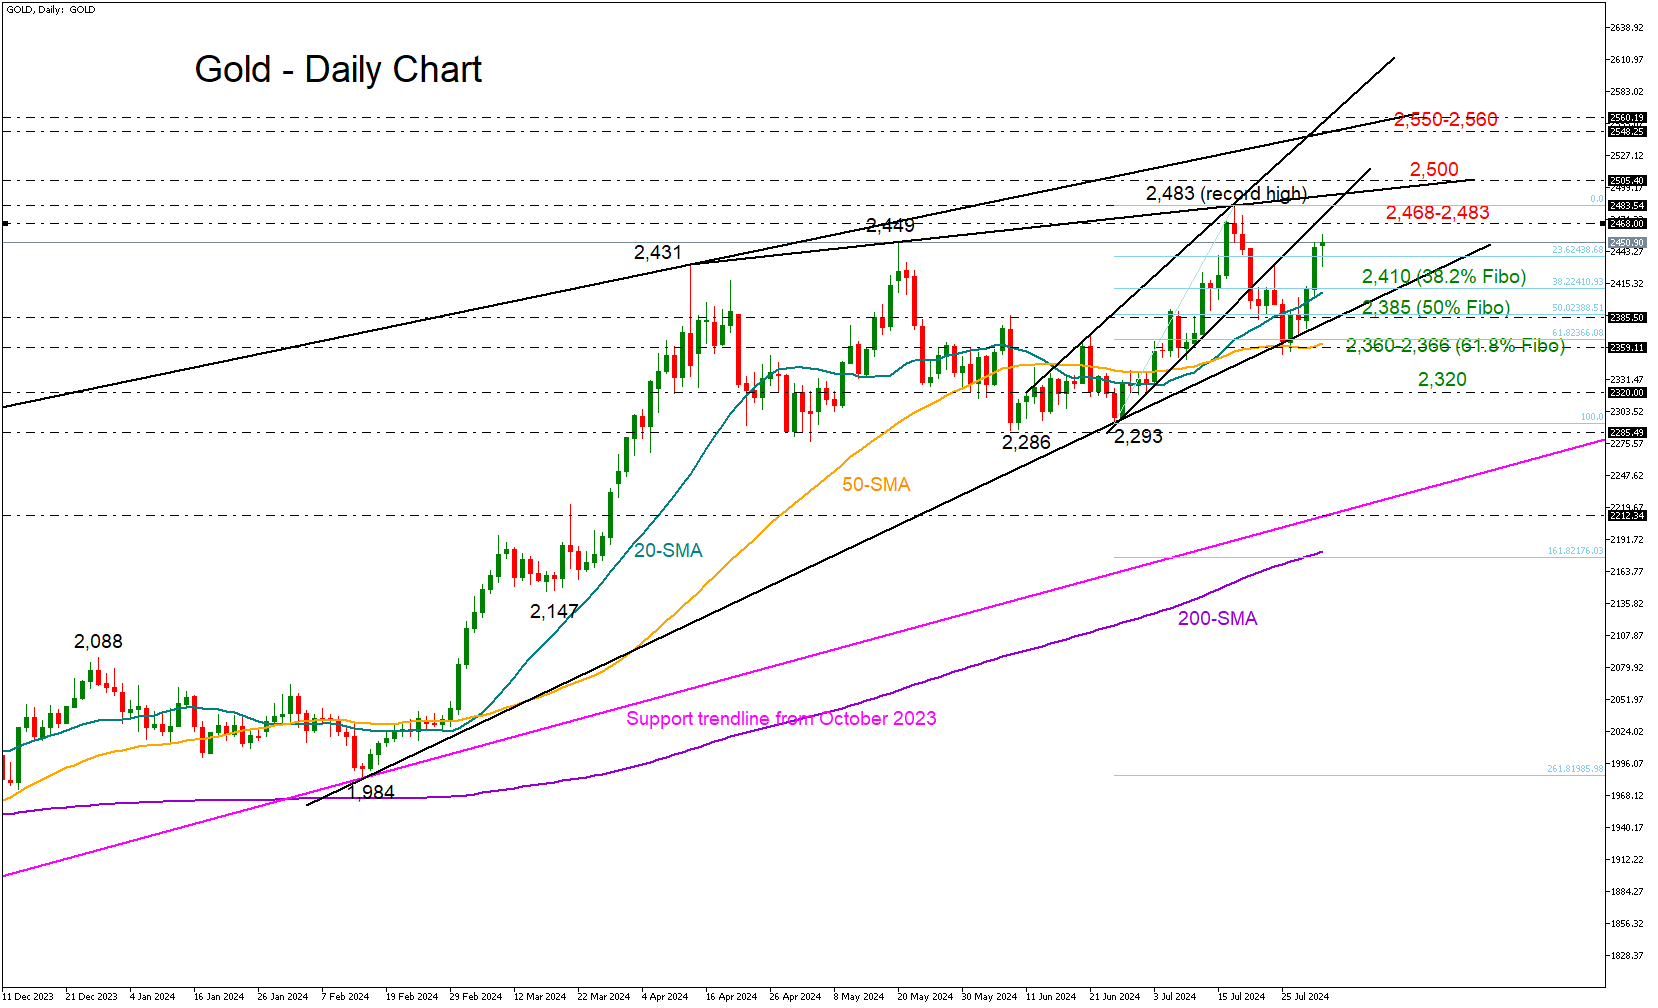
As regards the market reaction, the greenback could lose more ground in the wake of disappointing employment numbers, boosting gold closer to its all-time high of $2,483 or even towards the $2,500 psychological mark. The $2,550 constraining zone could be the next destination.
In the opposite case where nonfarm payrolls come in above 200k once again and wage growth shows some strength, investors might scale back their expectations for a 50bps rate cut in September and perhaps become less confident for a second reduction in the coming months. Consequently, the US dollar might attract fresh buying interest, pressing gold towards the $2,385 - $2,410. A step lower and beneath the 50-day simple moving average (SMA) at 2,366 could raise concerns for a bearish trend reversal, triggering a faster decline towards the $2,320 zone.
GBP/USD Outlook: Limited Negative Impact from BoE Rate Cut
Cable traded in a choppy mode with limited downside after BOE rate cut and regained traction on much higher than expected US jobless claims.
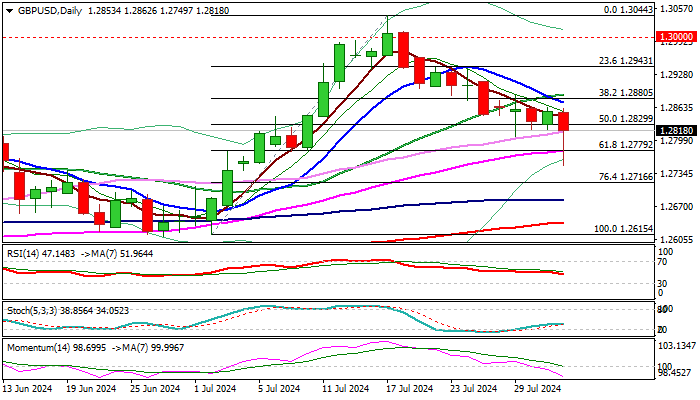
The pair returned above 1.2800 mark after hitting the lowest in almost one month (1.2750), with subsequent bounce signaling formation of a bear-trap on daily chart (below Fibo support at 1.2779, reinforced by 55DMA).
This may generate initial signal of formation of reversal pattern, although with more work at the upside needed to validate signal (close above 20DMA at 1.2888 seen as minimum requirement).
Until then, the downside will remain vulnerable, as negative momentum continues to strengthen on daily chart).
Look for firmer direction signals on break of either pivot (1.2779 or 1.2888).
US Manufacturing PMI data (today) and Labor report (Friday) expected to provide fresh signals.
Res: 1.2830; 1.2873; 1.2888; 1.2943.
Sup: 1.2779; 1.2750; 1.2706; 1.2683.
US ISM manufacturing drops to 46.8, reflecting deepening contraction
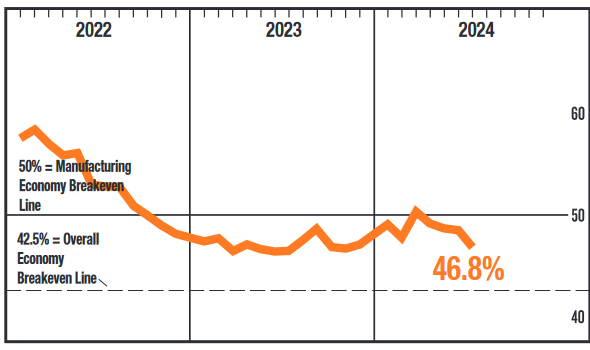
US ISM Manufacturing PMI dropped from 48.5 to 46.8 in July, falling below the expected 48.8. This marks the fourth consecutive month of contraction for the manufacturing sector, with the decline accelerating.
New orders fell from 49.3 to 47.4, indicating that demand has not seen consistent growth since May 2022. Production also decreased significantly, dropping from 48.5 to 45.9, the lowest performance since May 2020. Employment saw a sharp decline from 49.3 to 43.4, reaching its lowest level since June 2020. Prices, however, rose slightly from 52.1 to 52.9.
Timothy Fiore, Chair of the ISM Manufacturing Business Survey Committee, commented, "After breaking a 16-month streak of contraction by expanding in March, the manufacturing sector has contracted the last four months, and at a faster rate in July." Notably, none of the six biggest manufacturing industries registered growth in July.
Historically, the relationship between the Manufacturing PMI and the overall economy suggests that the July reading of 46.8 corresponds to a change of plus-1.2 percent in real GDP on an annualized basis.
Bank of England Review – Easing Commences But No Game-Changer for GBP
- At today's monetary policy meeting, the Bank of England decided to cut the Bank Rate by 25bp to 5.00%.
- A tight vote split, the notion of it being a finely balanced decision to cut rates and a mention of upside risks to the inflation forecast, gave the cut a slight hawkish twist.
- Gilt yields tracked lower and EUR/GBP moved higher on the cut, but GBP more than fully retraced the move during the press conference.
The Bank of England (BoE) decided to cut the Bank Rate by 25bp to 5.00% at today's meeting. The vote split was very tight with 5 members voting for a cut and 4 members voting for an unchanged decision. Pill joined the hawkish camp consisting of Greene, Haskel and Mann in voting for an unchanged decision, dissenting from Governor Bailey for the first time since he joined the MPC.
Delivering its first cut today following a hiking cycle, the BoE noted that "it is now appropriate to reduce slightly the degree of policy restrictiveness" but that "monetary policy will need to continue to remain restrictive for sufficiently long until the risks to inflation returning sustainably to the 2% target in the medium term have dissipated further". The committee further signalled a cautious approach with Bailey wary on cutting "too quickly or by too much" and that for some of the members who decided to vote for a cut "the decision was finely balanced ... and there remained some upside risks to the outlook." On the forecasts, GDP forecast was revised up to 1.25% for 2024 (from 0.5%) as expected with upside risks around the output gap. The central (modal) projection on inflation was revised lower but with upside risks across the forecast horizon.
Given the notion of it being a finely balanced decision, upside risks to the inflation forecast and the tight vote split, we think that this suggests that the BoE will take a more gradual approach to a cutting cycle. We expect the next 25bp cut in November with the Bank Rate ending the year at 4.75%.
Rates. 2Y Gilt yields moved lower on the statement but overall, the reaction in rates markets was muted. While markets price a probability for a move in September (7bp), it sees it as more likely that the next cut will be later in the year (November).
FX. EUR/GBP moved higher on the announcement of a cut but given the tight vote split and the more cautious approach on monetary easing, EUR/GBP more than fully retraced the move. We see relative rates as rather neutral for EUR/GBP, given our hawkish call on the ECB. We expect EUR/GBP to continue its move lower driven by indicators pointing to a continued (modest) rebound in the global manufacturing cycle, tight credit spreads and low FX volatility. The key risk is policy action from the BoE.
Our call. We expect the BoE to deliver one additional cut this year at the November meeting with risks skewed towards an additional cut. Markets are pricing 40bp for the remainder of the year with the next cut 25bp cut fully priced by November.
Sunset Market Commentary
Markets
After the Fed’s most clear pivot towards imminent rate cuts yesterday, the Bank of England thought it could do even better. It cut the policy rate by 25 bps to 5% in a 5-4 split vote. For “some” in the group of 5 it was a finely balanced decision - similar to what was the case in June when the majority decided to keep rates unchanged. This was also reflected in the rationale to “reduce slightly the degree of policy restrictiveness”. It was the result of a balancing act that leads us to label it a “hawkish cut”. Several inflation indicators, including services and core inflation, are still too high and risks remain tilted to the upside. But they are expected to normalize further. Based on the market implied interest rate path, headline CPI would – after temporarily bouncing back to 2.7% by the end of the year – ease towards 1.7% and 1.5% in respectively two and three years time. This disinflation is facilitated by the economy growing below potential, creating a margin of slack under the weight of a still-restrictive monetary policy. This feels at odds with the recent data. Indeed, the BoE noted that GDP has picked up sharply so far this year before downplaying it by saying that underlying momentum appeared weaker. GDP is seen growing 0.8% by 2025Q3 and will pick up to 1.4% and 1.7% in the years after. The economy will be in excess supply all this time. Given how the decision was not at all a straightforward one, the BoE abstained from any forward guidance. Instead, it opted to continue “to monitor closely the risks of inflation persistence” and to “decide the appropriate degree of monetary policy restrictiveness at each meeting.” The Bank of England basically copy-pasted the ECB strategy of very gradually unwinding peak restrictiveness, on a pace determined by incoming data. Both inflation and economic data give the BoE less room to maneuver compared to Frankfurt though. Markets nevertheless add rate cutting bets, particularly for the second half of next year. Front end yields drop 11.8 bps, though a large chunk already occurred prior to the BoE while weak (but second tier) US data a bit later accelerated the downleg. Sterling lost some ground in the wake of a decision that was not a 100% expected, but losses could have been larger given the sizeable yield drop. EUR/GBP only trades marginally higher around 0.843. US unit labor costs came in to the low side of expectations (0.9% in Q2) and weekly jobless claims rose to the highest in 11 months (249k, topping 236k estimates). The latter add to growing labour market concerns and comes a day after the Fed said it turned attentive to both sides of its dual mandate. US yields swapped 2 bps gains for losses after already declining >10 bps yesterday. German yields gapped lower at the open, catching up with the US late yesterday. Moves down amount to slightly over 3 bps. The dollar mostly gained, including against the Japanese yen (USD/JPY 150.57) and the euro (EUR/USD 1.08 is fighting for survival). Stock markets drop less than 1% in Europe but open higher in the US.
News & Views
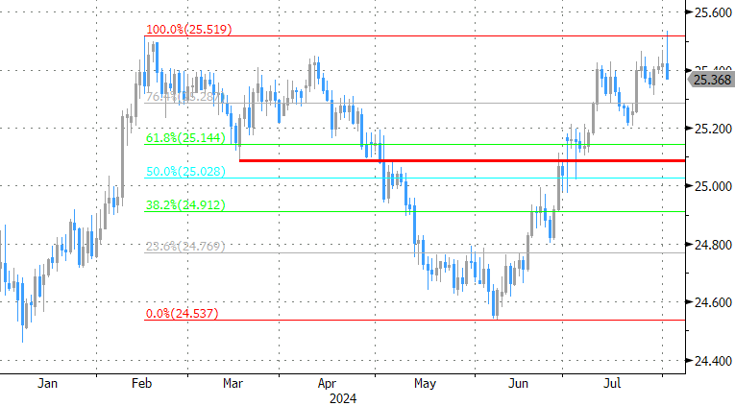
The Czech National Bank cut the policy rate 25 bps to 4.50% today. The press conference as well as statement is due later today. In the run-up to today’s decision markets were split on a 25 or 50 bps outcome after, amongst others, the CNB vice governor flagged the possibility of another big step at this meeting. Until then, markets didn’t really consider the option given that the previous 50 bps cut was already not as straightforward as the previous ones and given the recent CZK depreciation move. It appears that the latter now convinced CNB policymakers to take a more cautious cutting approach. EUR/CZK earlier on the day briefly jumped to the highest since March 2022 before paring gains to trade little changed around 25.43 on a daily basis.
The OPEC+’s monitoring committee did not issue any specific recommendation during today’s meeting. A statement on the website noted the “high overall conformity” to the current output curbs and reiterated the possibility to pause or even reverse the planned unwinding of voluntary production cuts. In June, OPEC+ agreed to first extend some 2.2 mln of voluntary output curbs that were originally scheduled to end that month to September 2024 and then to roll them back gradually on a monthly basis through September 2025. The move roiled the oil market as increased supply was expected against the background of weakening demand (especially from China). After plummeting to as low as $77/b prices then recovered $10 only to slide again in recent weeks. The recent geopolitical developments have supported oil again somewhat in recent days.
Graphs
UK 2-yr yield hits new YtD low as Bank of England delivers “hawkish cut”
EUR/CZK: sigh of relief for the Czech crown as CNB slows down cutting pace from 50 to 25 bps
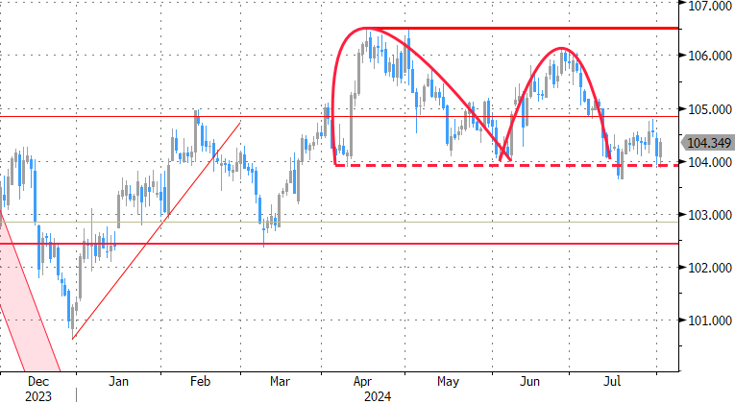
DXY: trade-weighted dollar is holding up well despite Fed readying first (but priced in) rate cut for September
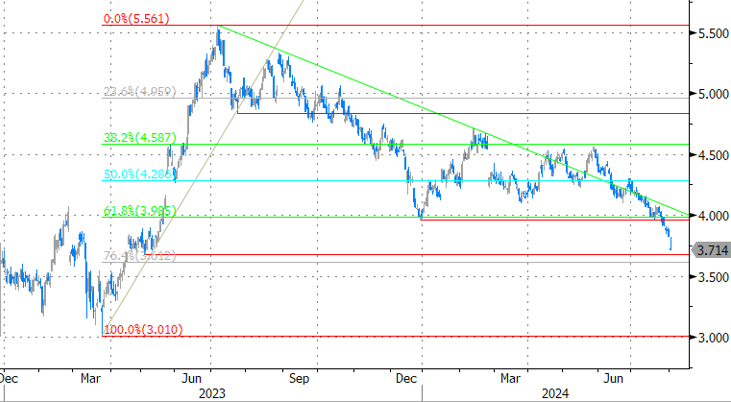
US 10-yr yield is heavily testing support around 4% as weak jobless claims add to growing labour market concerns/risks
The Crypto Market Pulled Back Further into the Range
Market picture
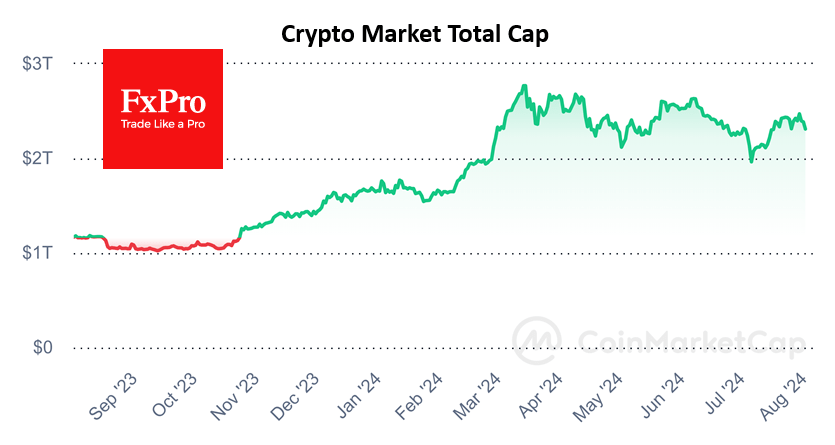
Cryptocurrencies continued to sag, failing to support gains in the stock market, returning the crypto market cap to $2.30trn levels seen a week ago. The market formed another lower local peak, a sequence that has been in place since March. A move towards the lower end of the sloping range suggests the potential for another 20% decline. This is a pessimistic, non-mainstream scenario given Bitcoin’s historically strong performance in these months post-halving and the good risk appetite in stocks and commodities.
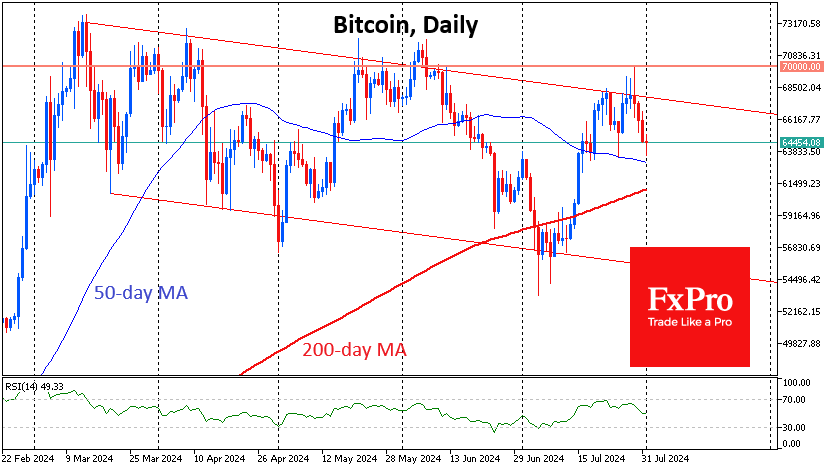
Bitcoin was down to $63.7K on Thursday morning, once again near the 50-day moving average, which remains a tactical support line. If the decline develops, dynamics around the $63K and $61K levels, near where the 50 and 200-day moving averages are, will be important. A failure of this support will open the way to $55K, which is quite frightening.
Bitcoin ended July up 4.4% to $64,600. In terms of seasonality, August is considered one of the two worst months for BTC. Over the past 13 years, bitcoin has ended the month up only five times and down eight times. The average decline was 15.4% and the average rise was 26%.
News background
Ethereum is expected to experience greater price fluctuations than Bitcoin. QCP Capital noted that the monthly volatility premium for the asset in “long-distance” options increased from 4% to 8%.
Another recalculation saw the first cryptocurrency’s mining difficulty increase by 10.5% to 90.67T. The average hashrate for the period since the previous value change was 933.84 EH/s.
Bankrupt cryptocurrency exchange Mt.Gox sent another 33,964 BTC ($2.25bn) to an unknown address and made an internal transfer of 47,229 BTC ($3.13bn). According to Arkham, Mt.Gox-related wallets still hold 80,128 BTC worth $5.32bn. The majority of Mt.Gox investors receiving payouts can be classified as hodlers. This potentially mitigates the scale of selling pressure in the coming weeks.
A forthcoming bill from Senator Cynthia Lummis would allow the US to create the first cryptocurrency reserve, The Block reported, citing a draft document.
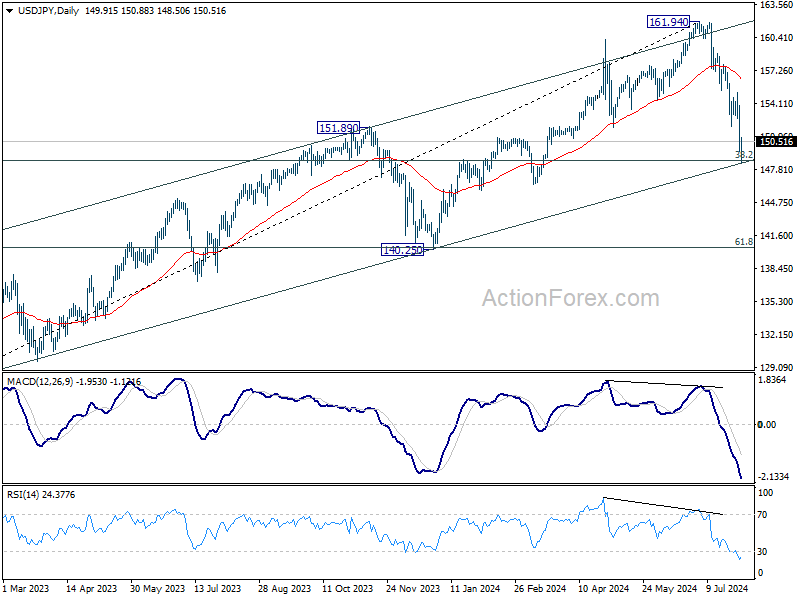
USD/JPY Mid-Day Outlook
Daily Pivots: (S1) 148.42; (P) 151.16; (R1) 152.72; More...
Intraday bias in USD/JPY remains on the downside for the moment. Strong support could be seen from 148.66 fibonacci level to bring consolidations. On the upside, above 151.93 support turned resistance will turn bias back to the upside for stronger recovery. Nevertheless, sustained break of 148.66 will pave the way to next support at 140.25.
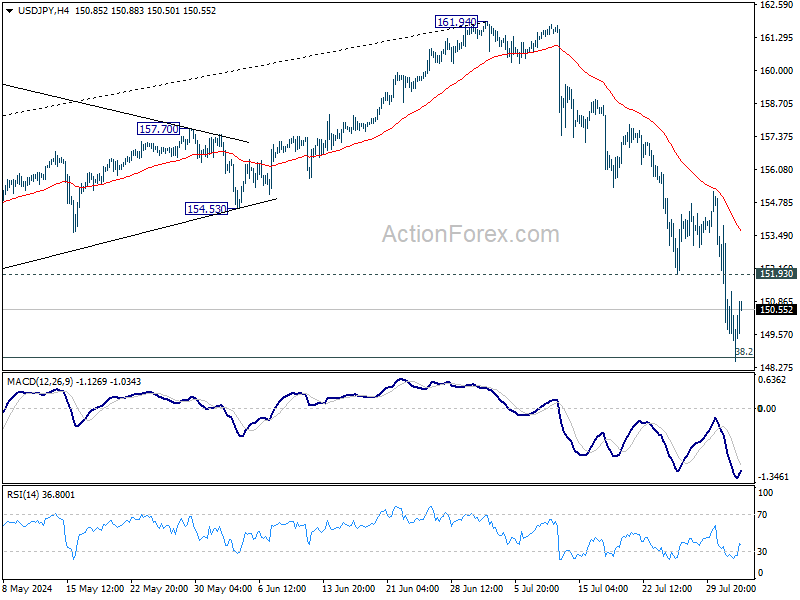
In the bigger picture, considering the depth and momentum of the current decline, 161.94 should be a medium term top already. Fall from there is seen as correcting the whole rise from 127.20 (2023 low) at least. Next target is 38.2% retracement of 127.20 to 161.94 at 148.66. Decisive break there will pave the way to 140.25 support next. Risk will now stay on the downside as long as 55 D EMA (now at 156.42) holds, in case of rebound.
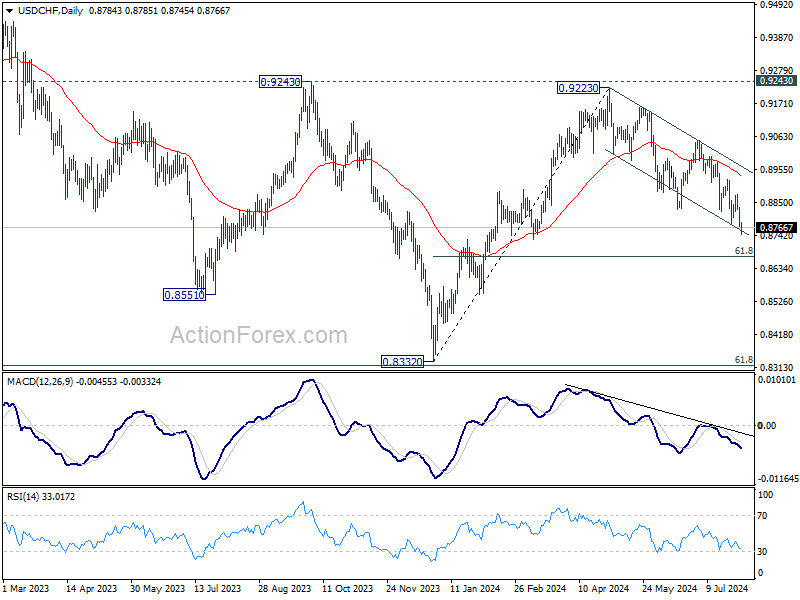
USD/CHF Mid-Day Outlook
Daily Pivots: (S1) 0.8753; (P) 0.8797; (R1) 0.8823; More…
Intraday bias in USD/CHF remains on the downside for the moment. Current fall from 0.9223 is in progress for 61.8% retracement of 0.8332 to 0.9223 at 0.8672 next. For now, risk will stay on the downside as long as 0.8874 resistance holds, in case of recovery.
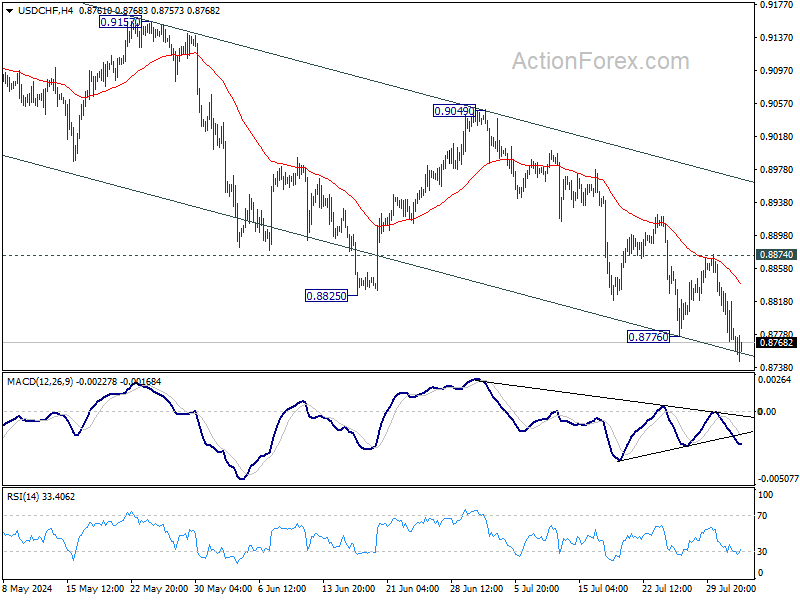
In the bigger picture, with 0.9243 resistance intact, medium term outlook in USD/CHF is neutral at best. For now, more sideway trading is likely between 0.8332/9243. However, firm break of 0.9243 will indicate larger bullish trend reversal.
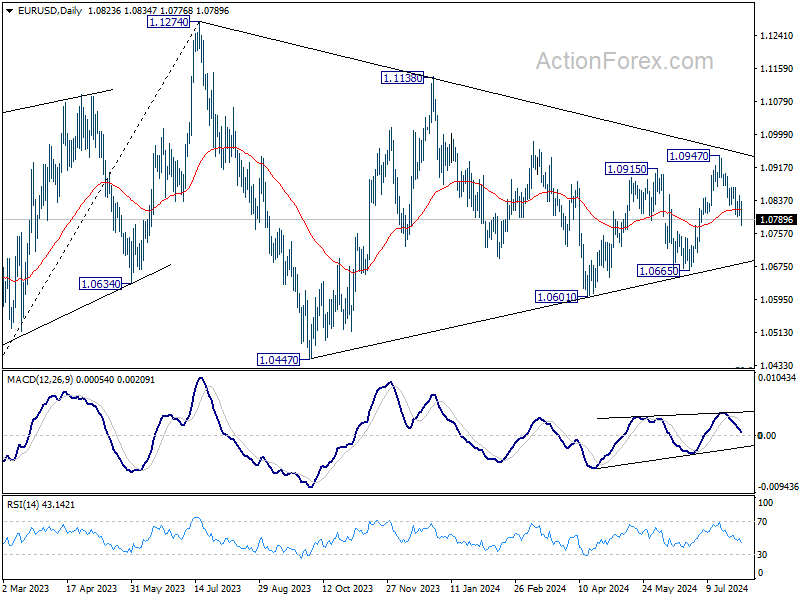
EUR/USD Mid-Day Outlook
Daily Pivots: (S1) 1.0802; (P) 1.0826; (R1) 1.0849; More.....
EUR/USD's fall from 1.0947 resumed by breaking through 1.0797 temporary low and intraday bias is back on the downside. Current development suggest that rebound from 1.0601 has completed with three waves up to 1.0947. Deeper decline should be seen to 1.0665 support next. For now, risk will stay on the downside as long as 1.0869 resistance holds, in case of recovery.
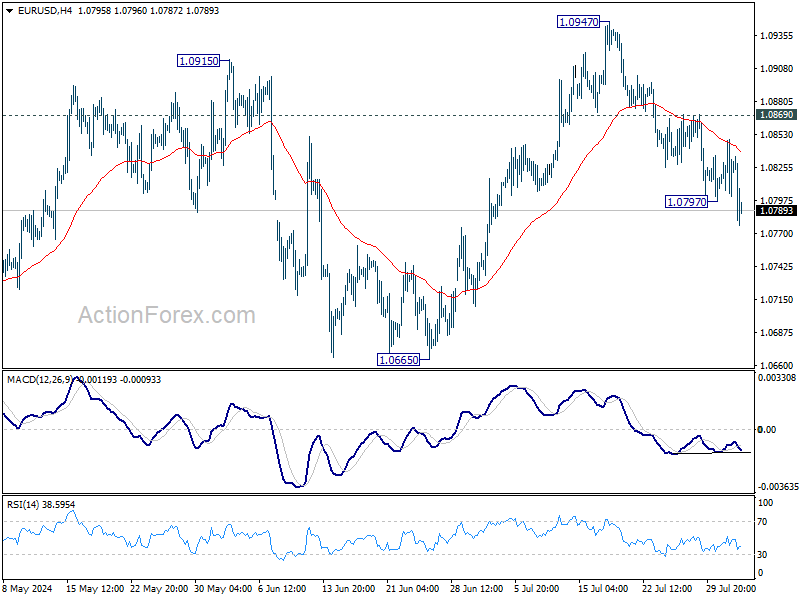
In the bigger picture, price actions from 1.1274 are viewed as a corrective pattern that's still be in progress. Break of 1.1138 resistance will be the first signal that rise from 0.9534 (2022 low) is ready to resume through 1.1274 (2023 high). However, break of 1.0665 support will extend the correction with another falling leg back towards 1.0447 support.