Sample Category Title
GBP/JPY Daily Outlook
Daily Pivots: (S1) 196.72; (P) 197.93; (R1) 198.96; More...
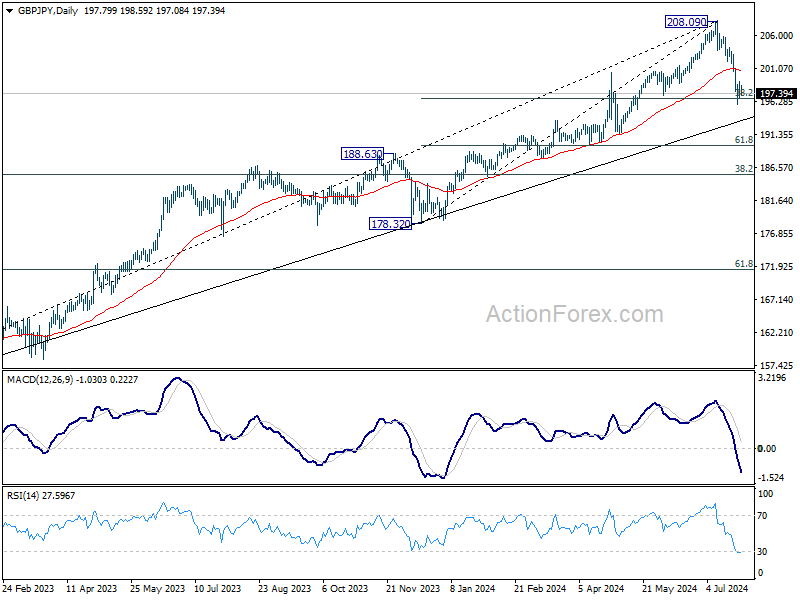
Intraday bias in GBP/JPY remains neutral for consolidations above 195.84 temporary low. Further decline is expected as long as 202.08 support turned resistance holds. On the downside, sustained trading below 38.2% retracement of 178.32 to 208.09 at 196.71 will argue that larger scale correction is under way to 185.49 fibonacci level.
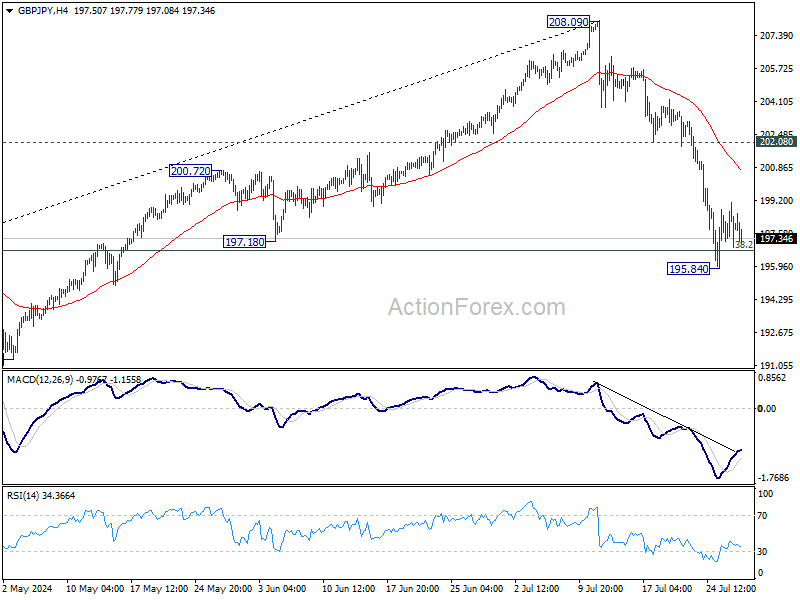
In the bigger picture, considering bearish divergence condition in W MACD, 208.09 might be a medium term top and fall from there could already be correcting whole up trend from 148.93 (2022 low). Risk will now stay on the downside as long as 55 D EMA (now at 200.78) holds. Sustained break of 196.71 will pave the way to 38.2% retracement of 148.93 to 208.09 at 185.49.
EUR/JPY Daily Outlook
Daily Pivots: (S1) 166.19; (P) 167.10; (R1) 167.87; More...
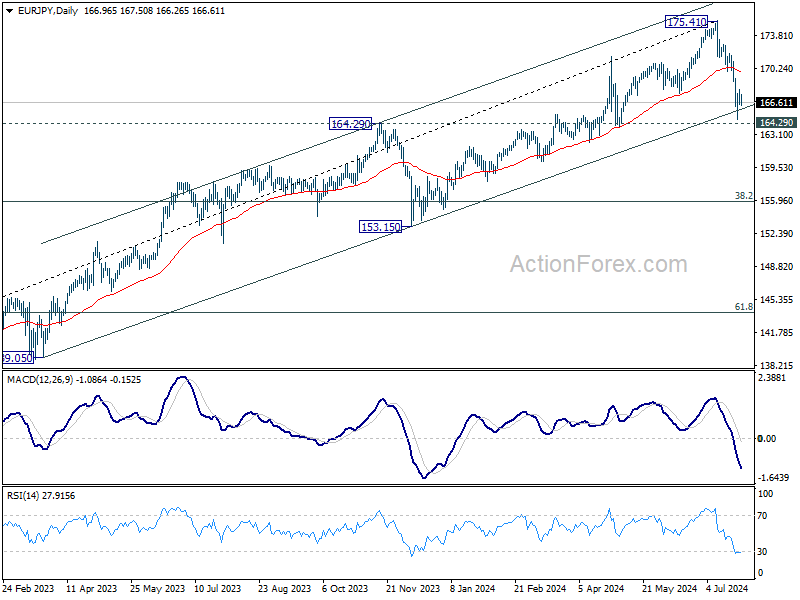
Intraday bias in EUR/JPY stays neutral for consolidations above 164.81 temporary low. Outlook will remain bearish as long as 169.98 resistance holds. On the downside, decisive break of 164.29 support turned resistance will indicate that larger scale correction is underway for 155.91 fibonacci level.
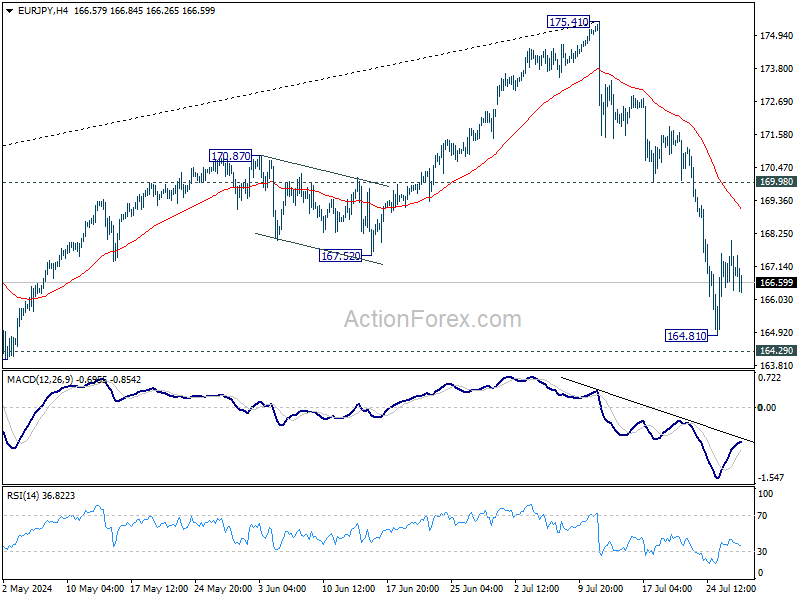
In the bigger picture, immediate focus is on 164.29 resistance turned support. Strong rebound from there will retain medium term bullishness for resuming the up trend through 175.41 at a later stage. However, decisive break of 164.29 will indicate that fall from 175.41 is at least correcting the rise from 124.73, with risk of bearish trend reversal. Deeper decline would be seen to 38.2% retracement of 124.37 to 175.41 at 155.91.
EUR/GBP Daily Outlook
Daily Pivots: (S1) 0.8427; (P) 0.8439; (R1) 0.8449; More....
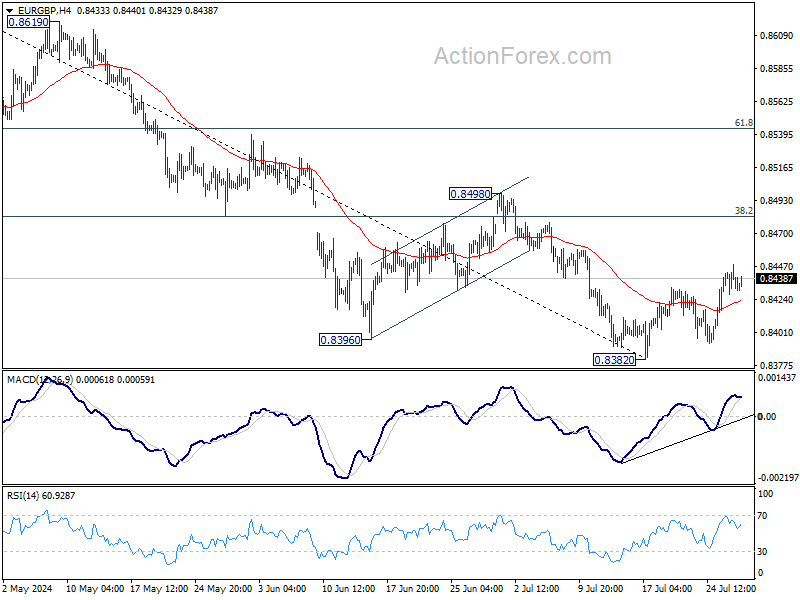
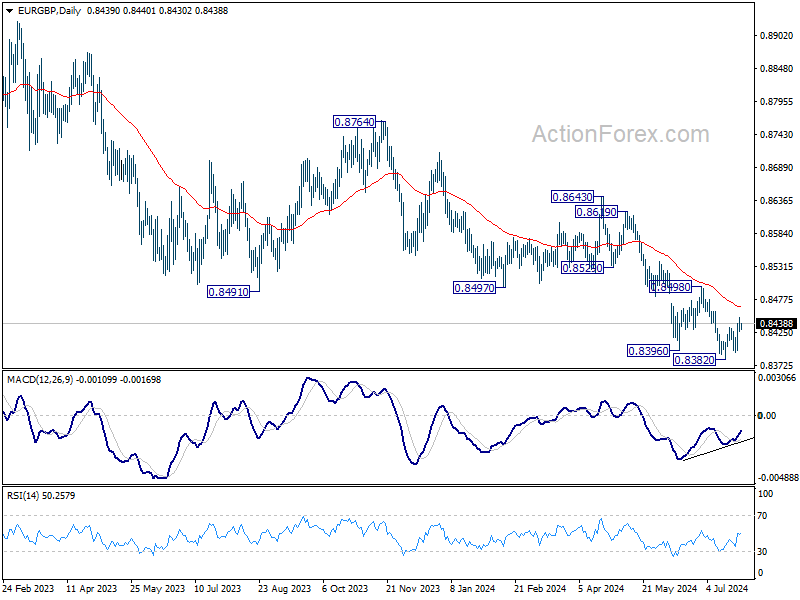
Intraday bias in EUR/GBP remains neutral for the moment. Recovery from 0.8382 could extend higher. But outlook will stay bearish as long as 0.8498 resistance holds. Firm break of 0.8382 will resume larger down trend.
In the bigger picture, down trend from 0.9267 (2022 high) is in progress. Next target is 0.8201 key support (2022 low). For now, outlook will remain bearish as long as 0.8643 resistance holds, even in case of strong rebound.
EUR/AUD Daily Outlook
Daily Pivots: (S1) 1.6540; (P) 1.6569; (R1) 1.6612; More...
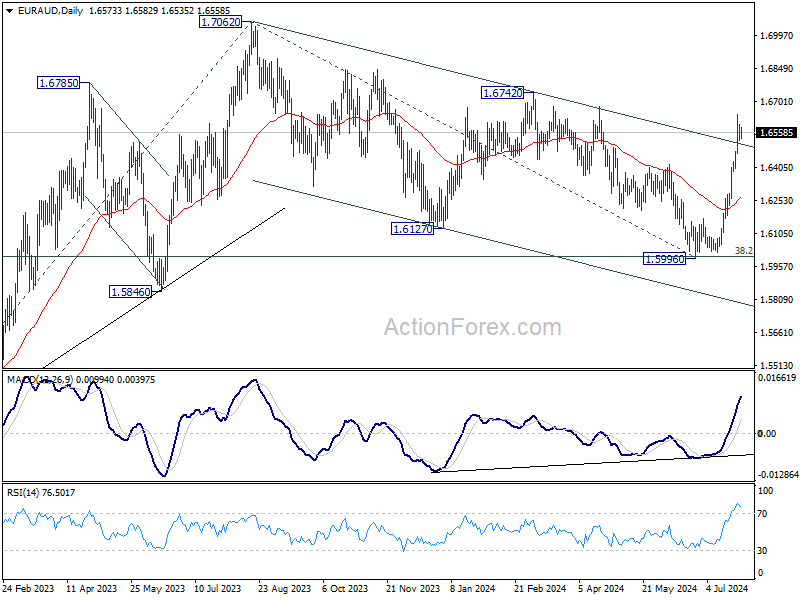
Intraday bias in EUR/AUD remains neutral for consolidations below 1.6642 temporary top. Further rally is expected as long as 1.6384 support holds. Corrective fall from 1.7062 should have completed with three waves down to 1.5998. Above 1.6642 will target 1.6742 resistance. Decisive break there will argue that larger up trend is going to resume through 1.7062 high.
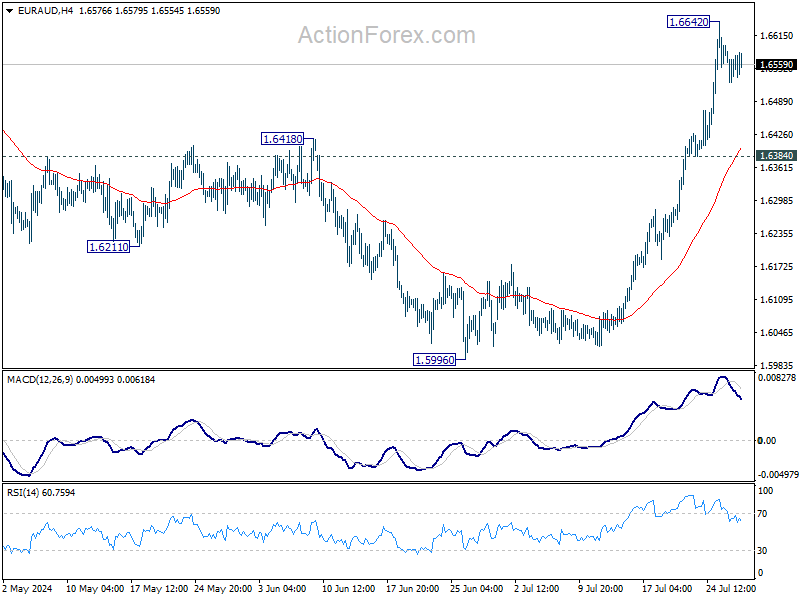
In the bigger picture, fall from 1.7062 medium term top is seen as a correction to the up trend from 1.4281 (2022 low) and could have completed after hitting 38.2% retracement of 1.4281 to 1.7062 at 1.6000. On resumption next target will be 61.8% projection of 1.4281 to 1.7062 from 1.5996 at 1.7715. This will now remain the favored case as long as 55 D EMA (now at 1.6264) holds.
EUR/CHF Daily Outlook
Daily Pivots: (S1) 0.9561; (P) 0.9581; (R1) 0.9612; More....
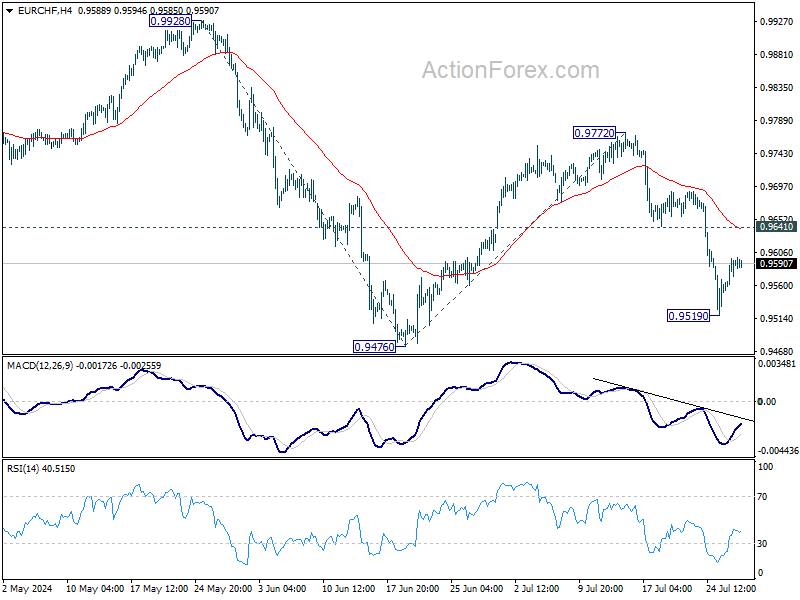
Intraday bias in EUR/CHF remains neutral for consolidations above 0.9159. Further decline is expected as long as 0.9641 support turned resistance holds. Rebound from 0.9476 should have completed as a corrective move at 0.9772. Below 0.9519 will bring retest of 0.9476. Firm break there will resume whole fall from 0.9928 to 100% projection of 0.9928 to 0.94767 from 0.9772 at 0.9320.
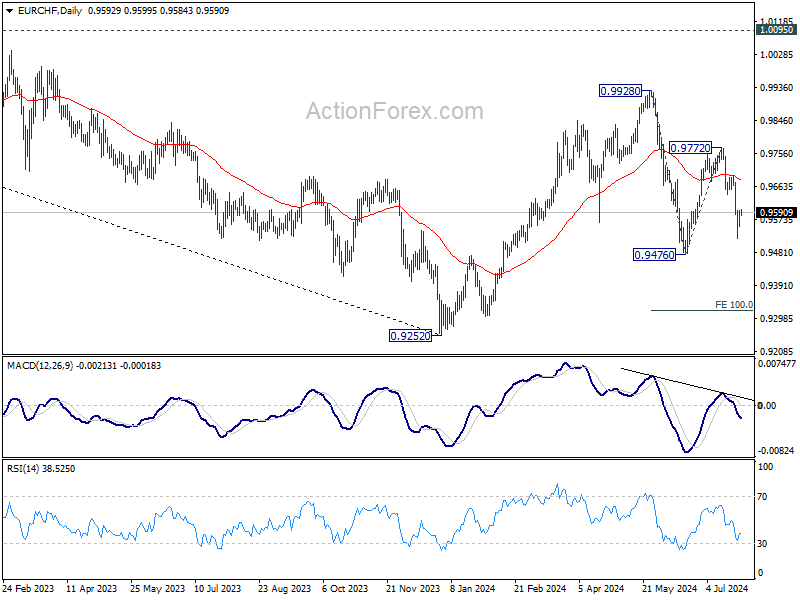
In the bigger picture, with 1.0095 key medium term resistance intact, price actions from 0.9252 (2023 low) are seen as a corrective pattern. Fall from 0.9928 might be the second leg and break of 0.9476 would bring deeper decline to retest 0.9252 low. But strong support should be seen there to extend the corrective pattern with another rising leg. In any case, medium term outlook will be neutral at best as long as 1.0095 structural resistance holds.
EUR/USD Daily Outlook
Daily Pivots: (S1) 1.0843; (P) 1.0855; (R1) 1.0869; More.....
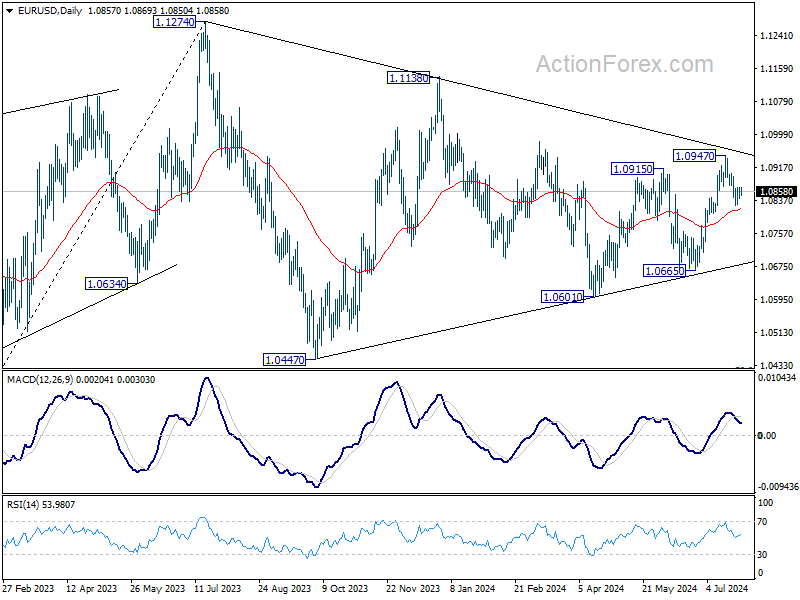
Intraday bias in EUR/USD remains neutral for consolidations above 1.0825 temporary low. Further decline is expected as long as 1.0896 minor resistance holds. Below 1.0825 will target 55 D EMA (now at 1.0815). Sustained break there will argue that whole rebound from 1.0601 has completed with three waves up to 1.0947, and target 1.0601/0665 support zone. Nevertheless, break of 1.0896 will bring retest of 1.0947 resistance instead.
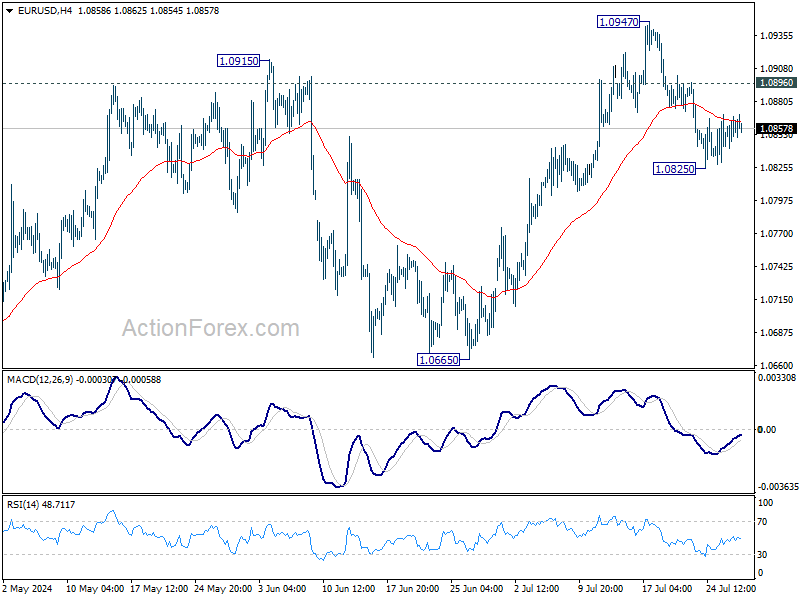
In the bigger picture, price actions from 1.1274 are viewed as a corrective pattern that's still be in progress. Break of 1.1138 resistance will be the first signal that rise from 0.9534 (2022 low) is ready to resume through 1.1274 (2023 high). However, break of 1.0665 support will extend the correction with another falling leg back towards 1.0447 support.
GBP/USD Daily Outlook
Daily Pivots: (S1) 1.2851; (P) 1.2866; (R1) 1.2883; More...
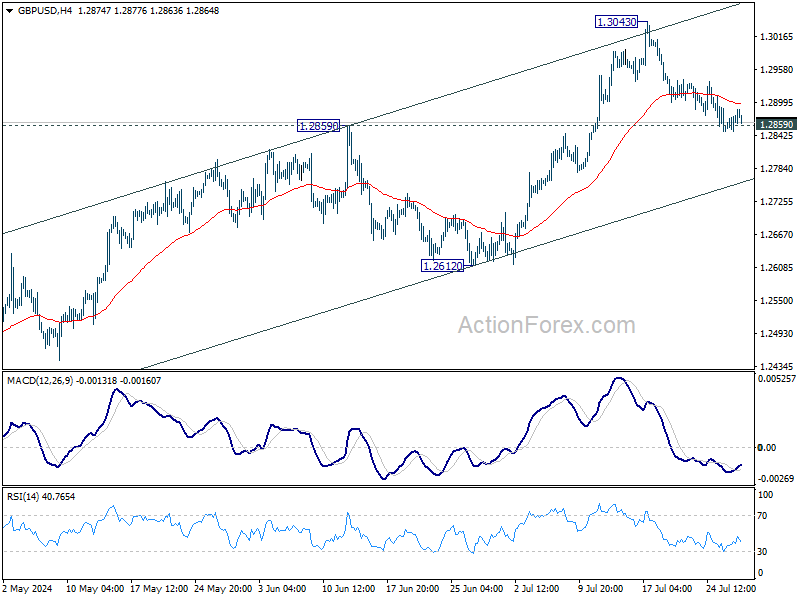
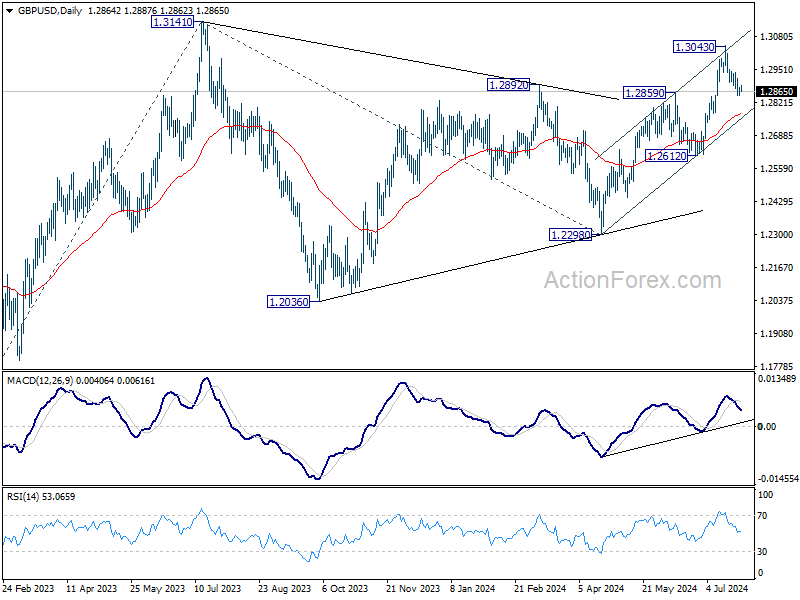
Intraday bias in GBP/USD remains neutral for the moment and outlook is unchanged. As long as 1.2859 resistance turned support holds, further rally is in favor. Break of 1.3043 will resume the rise from 1.2298. However, firm break of 1.2859 will turn bias to the downside for deeper decline to 55 D EMA (now at 1.2777).
In the bigger picture, corrective pattern from 1.3141 medium term top (2023 high) could have completed with three waves to 1.2298 already. This will now remain the favored case as long as 1.2612 support holds. Firm break of 1.3141 will target 61.8% projection of 1.0351 (2022 low) to 1.3141 from 1.2298 at 1.4022.
USD/CHF Daily Outlook
Daily Pivots: (S1) 0.8812; (P) 0.8828; (R1) 0.8853; More…
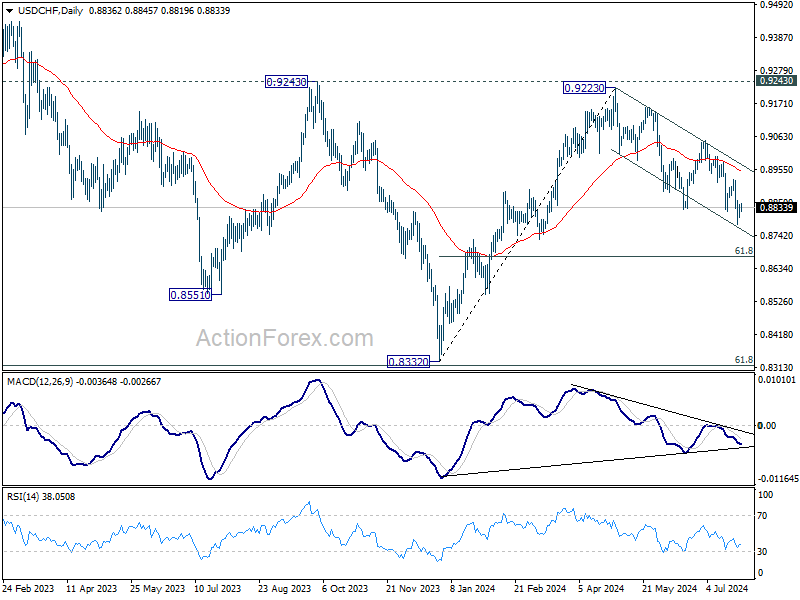
Intraday bias in USD/CHF remains neutral for consolidations above 0.8776 temporary low. Further decline is expected as long as 0.8923 resistance holds. On the downside, break of 0.8776 will resume the fall from 0.9223 to 61.8% retracement of 0.8332 to 0.9223 at 0.8672 next. However, break of 0.8923 will turn bias back to the upside for stronger rebound instead.
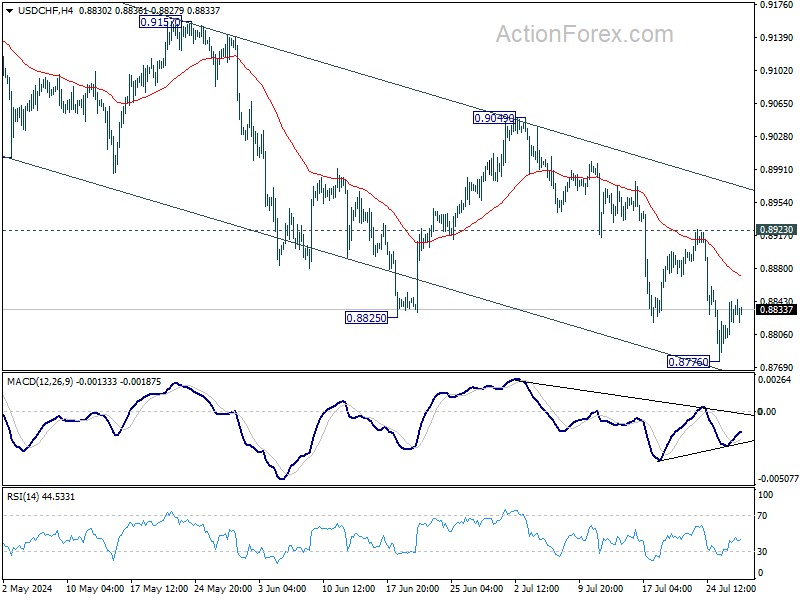
In the bigger picture, with 0.9243 resistance intact, medium term outlook in USD/CHF is neutral at best. For now, more sideway trading is likely between 0.8332/9243. However, firm break of 0.9243 will indicate larger bullish trend reversal.
USD/JPY Daily Outlook
Daily Pivots: (S1) 152.96; (P) 153.85; (R1) 154.59; More...
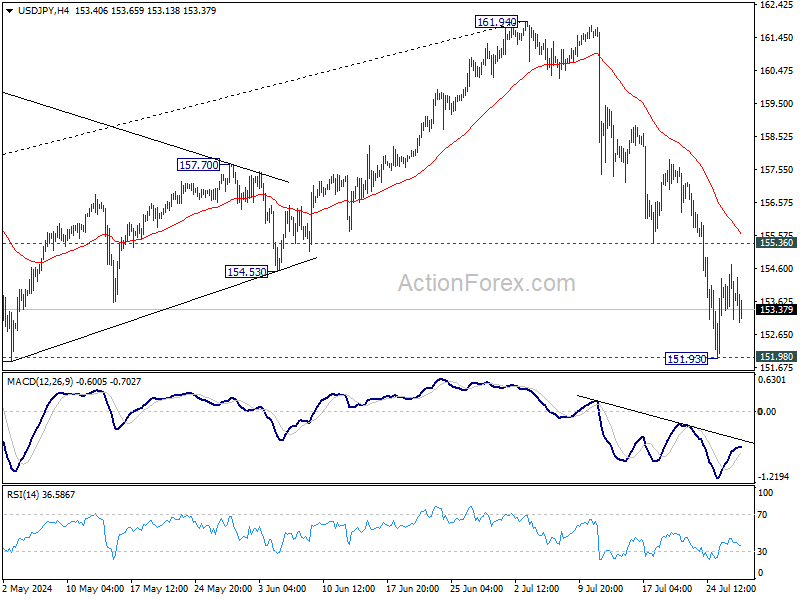
Intraday bias in USD/JPY remains neutral for consolidation above 151.93. Further decline is expected as long as 155.36 support turned resistance holds. On the downside, decisive break of 151.89 resistance turned support will argue that large scale correction is underway to 148.66 fibonacci level. Nevertheless, break of 155.36 will turn bias back to the upside for stronger rebound.
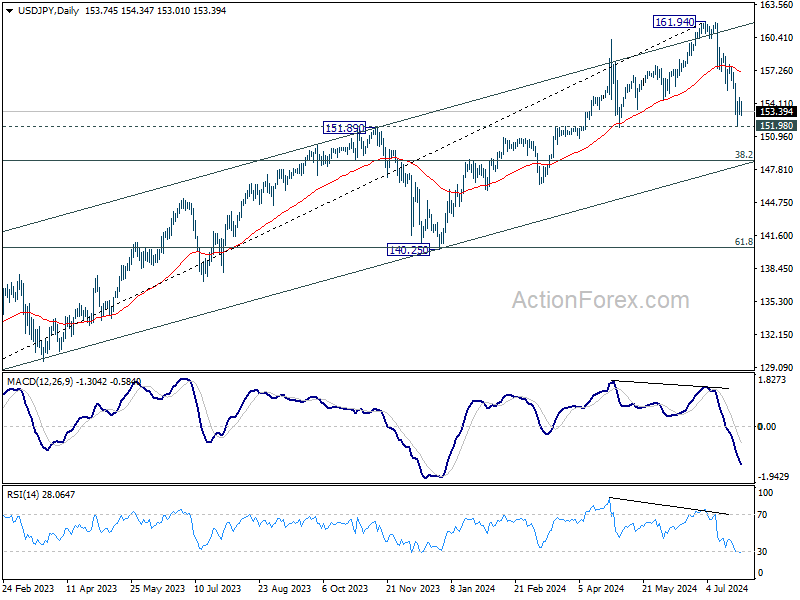
In the bigger picture, considering the depth and momentum of the current decline, 161.94 should be a medium term top already. Fall from there is seen as correcting the whole rise from 127.20 (2023 low) at least. Break of 151.89 will pave the way to 38.2% retracement of 127.20 to 161.94 at 148.66. Risk will now stay on the downside as long as 55 D EMA (now at 157.04) holds, in case of rebound.
AUD/USD Daily Report
Daily Pivots: (S1) 0.6528; (P) 0.6548; (R1) 0.6568; More...
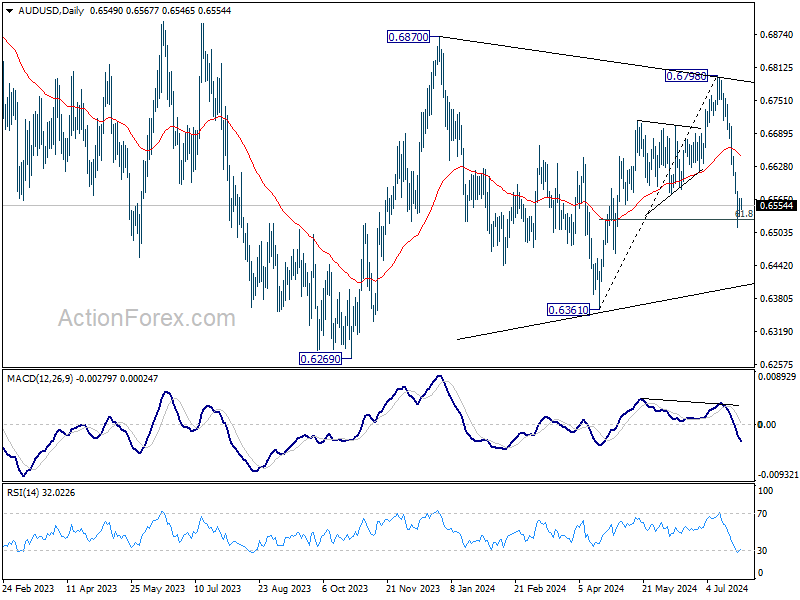
Intraday bias in AUD/USD remains neutral for consolidations above 0.6513 temporary low. Further decline is expected as long as 55 4H EMA (now at 0.6623) holds. On the downside, sustained break of 61.8% retracement of 0.6361 to 0.6798 at 0.6528 will resume the fall from 0.6798 to 0.6361 support next.

In the bigger picture, overall, price actions from 0.6169 (2022 low) are seen as a medium term corrective pattern, with fall from 0.6798 as another falling leg. Deeper fall could be seen to the lower side of the range between 0.6169/6361. But strong support should be seen there to contain downside. For now, risk will stay on the downside as long as 0.6798 resistance holds, in case of rebound.