Sample Category Title
ECB’s Wunsch: Successive rate cuts in Jun and Jul could trigger excessive repricing
ECB Governing Council member Pierre Wunsch expressed today that he is "very comfortable" with rate cut in June. He also anticipates that at least two rates cuts this year, "barring any bad news".
However, Wunsch was careful to temper expectations regarding the pace of future rate cuts, particularly stressing that a reduction in rates in July, following a potential June cut, is "not a done deal".
He highlighted the importance of "managing expectations," noting that too rapid a sequence of rate reductions could lead the markets to anticipate cuts at every ECB meeting. Such a perception could trigger an excessive repricing in the markets, which Wunsch views as problematic.
USD/JPY: Rate Falls Rapidly After Exceeding Psychological Mark of 160 Yen Per Dollar
Despite the fact that today is a holiday in Japan, the foreign exchange market is experiencing extreme volatility — wide candles are forming on the USD/JPY chart, and the rate briefly exceeded the psychological level of 160 yen per dollar, reaching a new high in 34 years.
The weakening of the yen in the first hours of trading occurred against the background of the fact that:
→ On Friday, the Bank of Japan decided to leave interest rates at the same level = 0.1%.
→ At the same time, market participants did not hear clear signals from the Bank of Japan that the weakening yen would be supported.
→ On Wednesday, May 1, the Fed will announce its decision on the interest rate. It is also expected to remain unchanged at 5.5%, highlighting the difference in monetary policy between Japan and the United States.
However, shortly after the yen surpassed the psychological level of 160.00, USD/JPY fell sharply to 155.50 and below — traders, according to Reuters, saw signs of intervention from Japanese financial authorities after a 13% increase since the beginning of the year.
Let us recall that Tokyo previously intervened in the foreign exchange market in September and October 2022, when the US dollar exchange rate was about 146.00 and 152.00 yen, respectively.
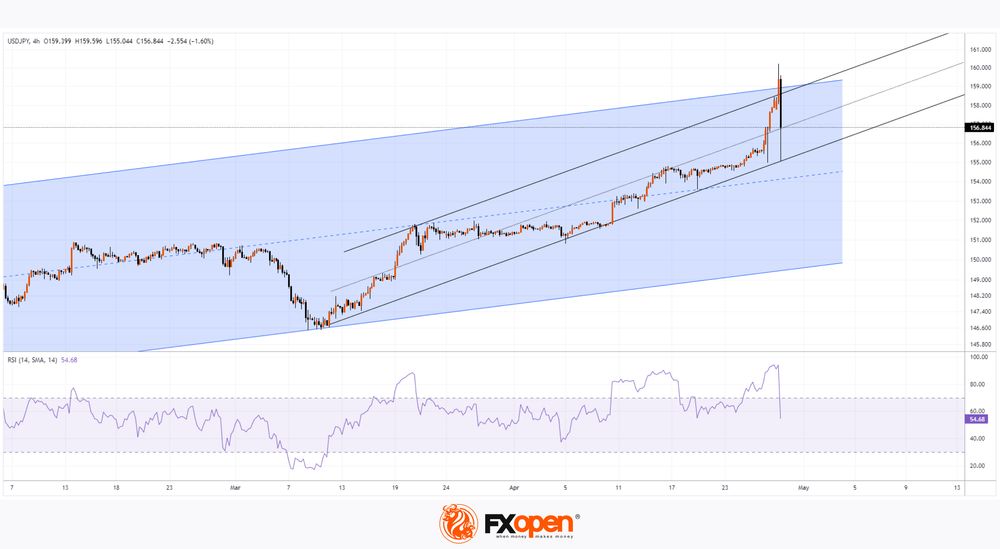
Technical analysis of the 4-hour USD/JPY chart shows that:
→ the price has exceeded the upper limit of the ascending channel (shown in blue);
→ the price has exceeded the upper limit of a steeper ascending channel, which originates in March (shown in black);
→ the RSI indicator exceeded the value = 93, indicating that the market was extremely overbought.
Having reached the lower black line, the USD/JPY rate bounced from it to the black median line — thus, a decrease of 2.5% took only 1 hour.
If official statements follow soon, they may confirm the assumption that the 160 yen per US dollar level is a tolerance limit that Tokyo cannot afford to allow to be breached. Such statements have the potential to change the balance of power in the market, cooling the ardor of the bulls.
It is possible that the peak reached this morning will be a peak that can hold for many months.
Trade over 50 forex markets 24 hours a day with FXOpen. Take advantage of low commissions, deep liquidity, and spreads from 0.0 pips. Open your FXOpen account now or learn more about trading forex with FXOpen.
This article represents the opinion of the Companies operating under the FXOpen brand only. It is not to be construed as an offer, solicitation, or recommendation with respect to products and services provided by the Companies operating under the FXOpen brand, nor is it to be considered financial advice.
USD/JPY: Pulls Back from New Multi-Decade Top on Suspected Intervention
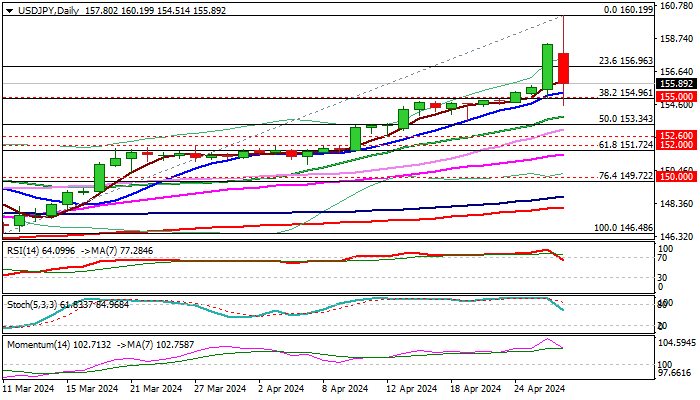
USDJPY cracked psychological 160 barrier and hit new multi-decade high early Monday, with subsequent sharp pullback to 155.00 zone on suspected intervention.
Fresh weakness cracked pivotal 155 support area (Friday’s low / 10DMA / Fibo 38.2% of 146.448/160.19) but so far without sustained break lower, with close above this levels to mark a healthy correction and keep larger bulls intact for fresh push higher.
However, risk of deeper pullback exists, as daily indicators are in steep decline and RSI / Stochastic emerged from overbought zone and threats of further intervention by Japan’s authorities.
Extended dips below 155.00 should find solid ground above broken pivotal barrier, now acting as very significant support (152.60, broken Fibo 38.2% of 277.65/75.55) to keep broader bullish bias, with monthly close above this level, needed to confirm.
Conversely, firm break here would signal temporary top and open way for deeper correction.
Res: 156.89; 157.23; 157.73; 158.43.
Sup: 155.00; 154.51; 153.80; 153.34.
USD/JPY: Overextended Intraday Rally Makes It Vulnerable to Squeeze Down With Rumoured Talks of FX Intervention
- USD/JPY extended its rally to hit 159.60 key long-term resistance (also the April 1990 secular swing high).
- Today’s Asian session’s swift upmove in USD/JPY has led to an increase in its volatility condition which increases the risk of FX intervention.
- Abrupt intraday movement in USD/JPY that wiped out earlier intraday gains has the hallmark of a suspected FX intervention.
Last Friday (26 April) price actions of the USD/JPY continued its march higher to close the US session with a new 34-year high at 158.35 (+1.7% daily gain) in light of a stubborn inflationary trend in the US as the core PCE price index (excluding food and energy) for March stood unchanged at 2.8% y/y and surpassed expectations of 2.6% y/y that put the highly anticipated US Federal Reserve’s dovish pivot narrative at the start of the year in great jeopardy.
On the flip side, the Bank of Japan’s recently concluded monetary policy decision last Friday lacked the “decisive punch” to shore up the persistent JPY weakness trend in terms of communications as BoJ Governor Ueda remarked in the press conference that the weak JPY has not had a big impact of underlying inflation in Japan (via imported inflation) which has reduced the odds of an interest rate hike in the next BoJ’s meeting in July.
159.60 key long-term resistance has been reached with increased volatility
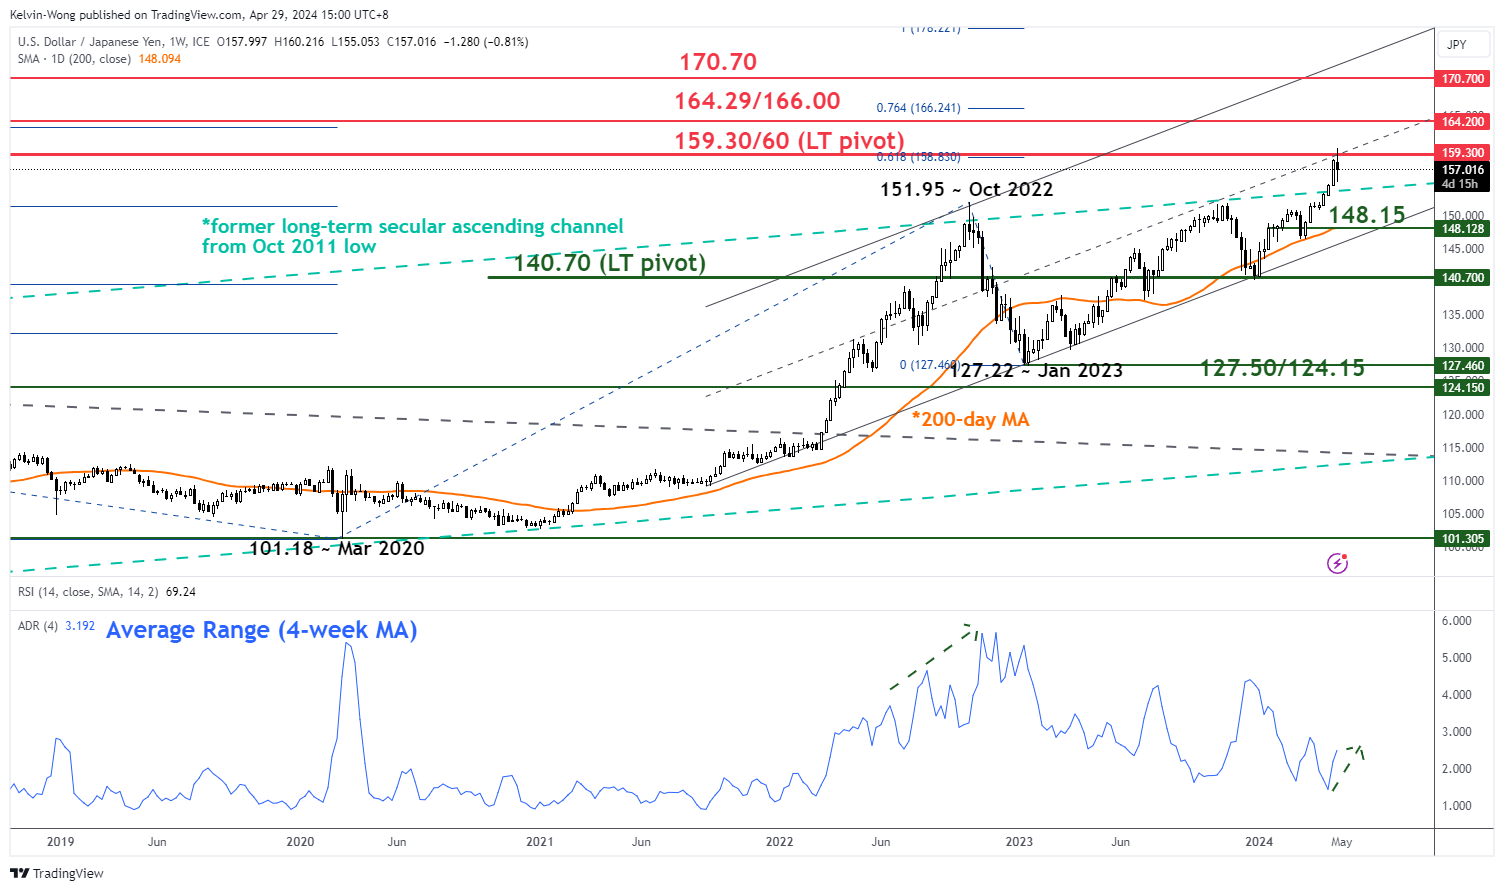
Fig 1: USD/JPY major trend as of 29 Apr 2024 (Source: TradingView, click to enlarge chart)
Recently, Japanese key Ministry of Finance (MoF) officials have highlighted that they are watching the FX market with a sense of “urgency” and stressed abrupt market movements as their key concerns in light of potential interventions to pause the JPY weakness.
An abrupt movement can be termed as an increase in volatility. In today’s early Asian session, the USD/JPY has jumped up by +1.5% (230 pips) to hit an intraday high of 160.23 within 3.5 hours from the start of the session.
This latest set of movements seen in the USD/JPY has caused its 4-week moving average of its weekly range indicator (a measurement of volatility, considering the highest and lowest price points rather than closing levels) has jump up significantly from 1.43 printed last week to a current intra-week value of 3.19. (see Fig 1).
Therefore, an increase in the volatility condition of USD/JPY has increased the risk of FX intervention.
Large speculative players’ net bearish positioning on JPY hit an extreme level
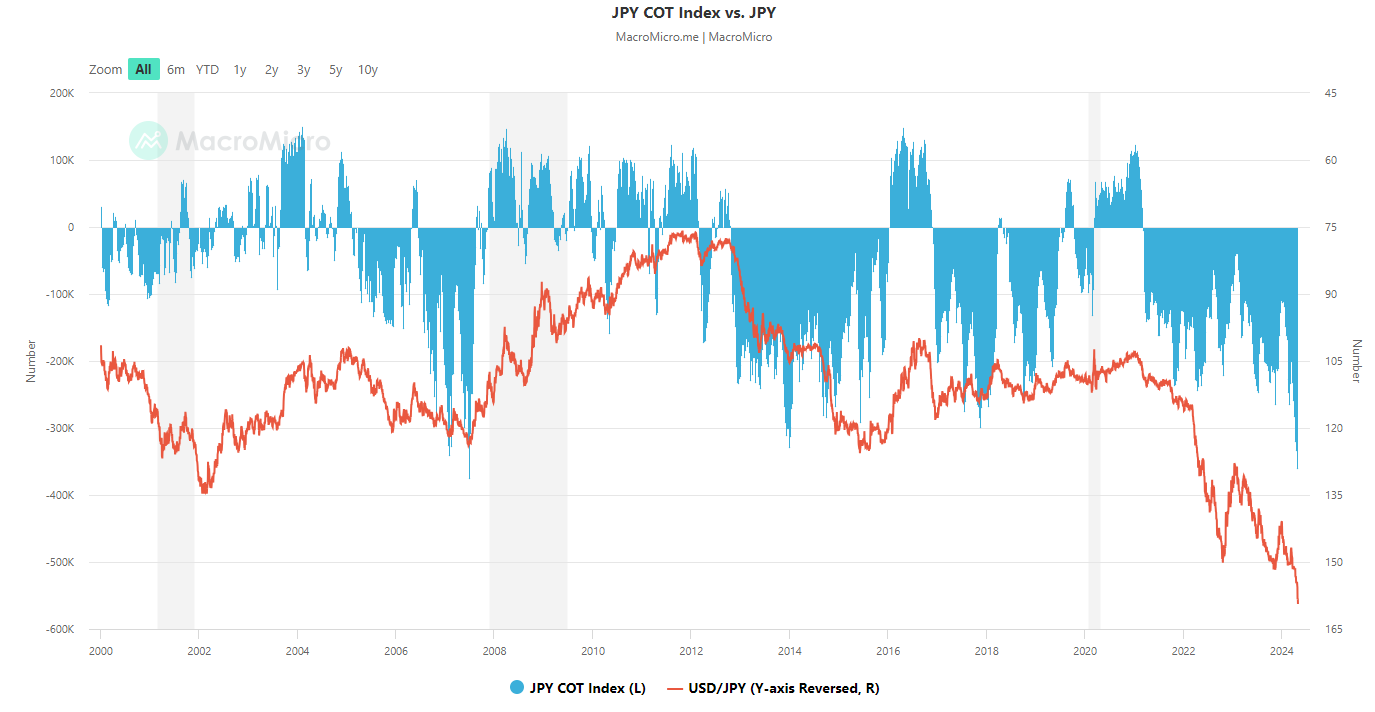
Fig 2: Commitments of Trader large speculators’ net positioning in JPY futures as of 22 April 2024 (Source: Macro Micro, click to enlarge chart)
Based on the latest data Commitments of Traders data as of 22 April 2024 (compiled by Macro Micro), the aggregate net bearish open positions of large speculators in the JPY futures market in the US (after offsetting the aggregate positions of large commercial hedgers) have increased to -359,063 contracts (net short), its lowest level in almost 17 years with -374,536 contracts recorded on 25 June 2007 (see Fig 2).
Since large speculators have committed a relatively high amount of net bearish open positioning on JPY via the futures market, a real FX Intervention by Japanese authorities at this juncture may trigger a “panic” short covering of such leveraged short positions which in turn might cascade into an abrupt liquidity squeeze and negative feedback loop movement into the USD/JPY at least in the short-term horizon.
Wild intraday swings below 159.60 key long-term pivotal resistance
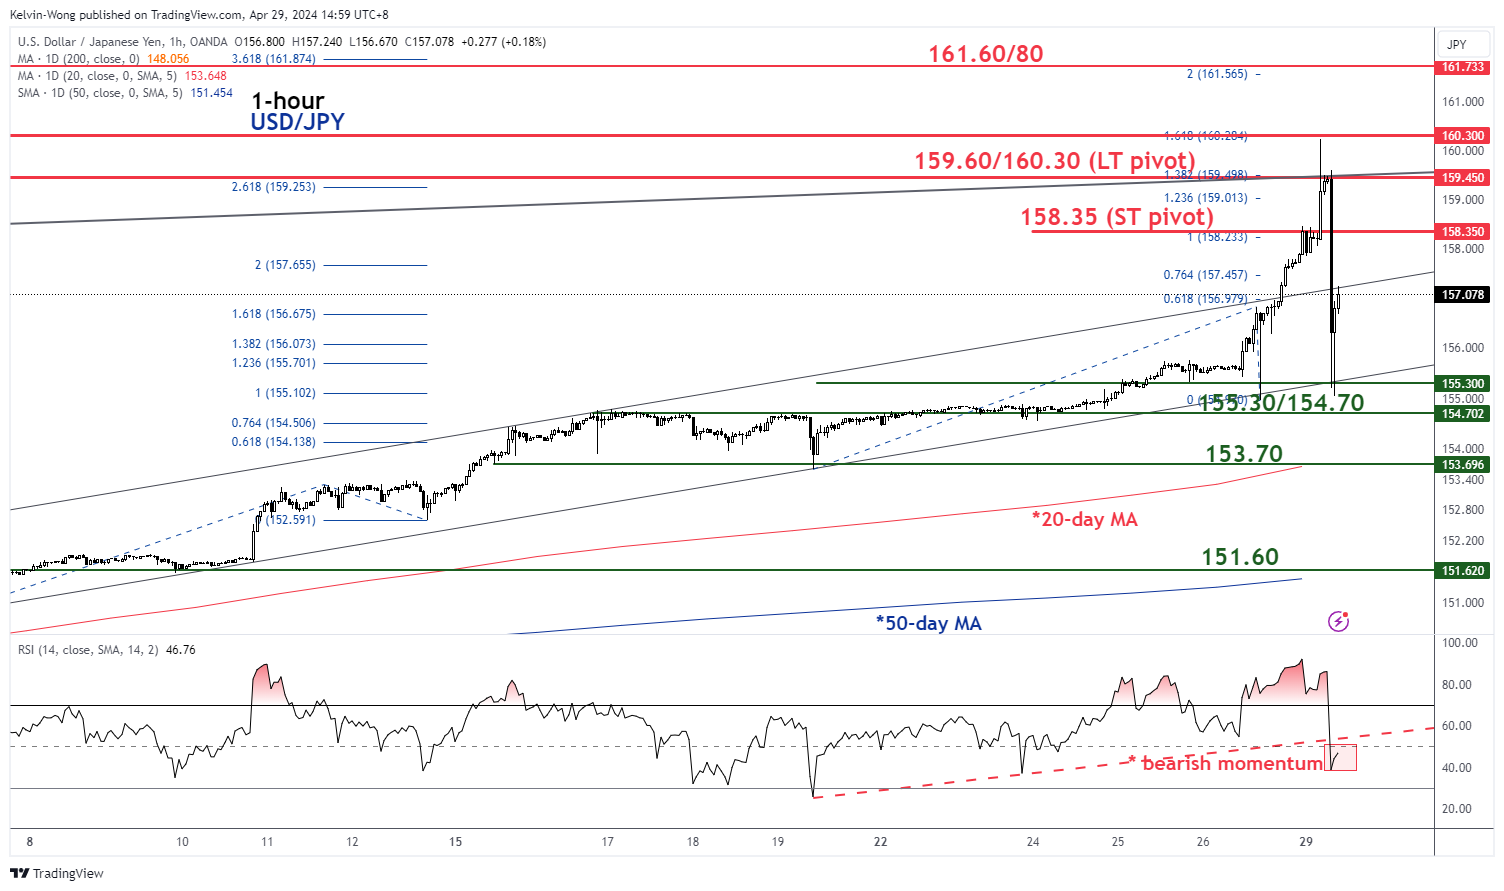
Fig 3: USD/JPY short-term trend as of 29 Apr 2024 (Source: TradingView, click to enlarge chart)
After skyrocketing to today’s Asian session intraday high of 160.23, it has erased its intraday gains within one hour to record a current intraday loss of -0.87% (-3.2% from intraday high to low) at this time of writing.
These abrupt short-term movements have given rise to the suspected footprints of actual FX interventions by Japanese authorities, so far, no official confirmations from MoF due to a public holiday in Japan today.
Watch the 158.35 key short-term pivotal support and break below 154.70 near-term support may trigger a further potential short-term downward spiral to expose the next intermediate supports at 153.70 (also the 20-day moving average) and 151.60 (50-day moving average) (see Fig 3).
On the other hand, a clearance above 158.35 negates the bearish tone for a retest on the 159.60/160.30 long-term pivotal resistance area.
EURUSD Attempts Recovery from 5-month Low
- EURUSD rebounds from a five-month bottom
- But oscillators suggest that the bears retain control
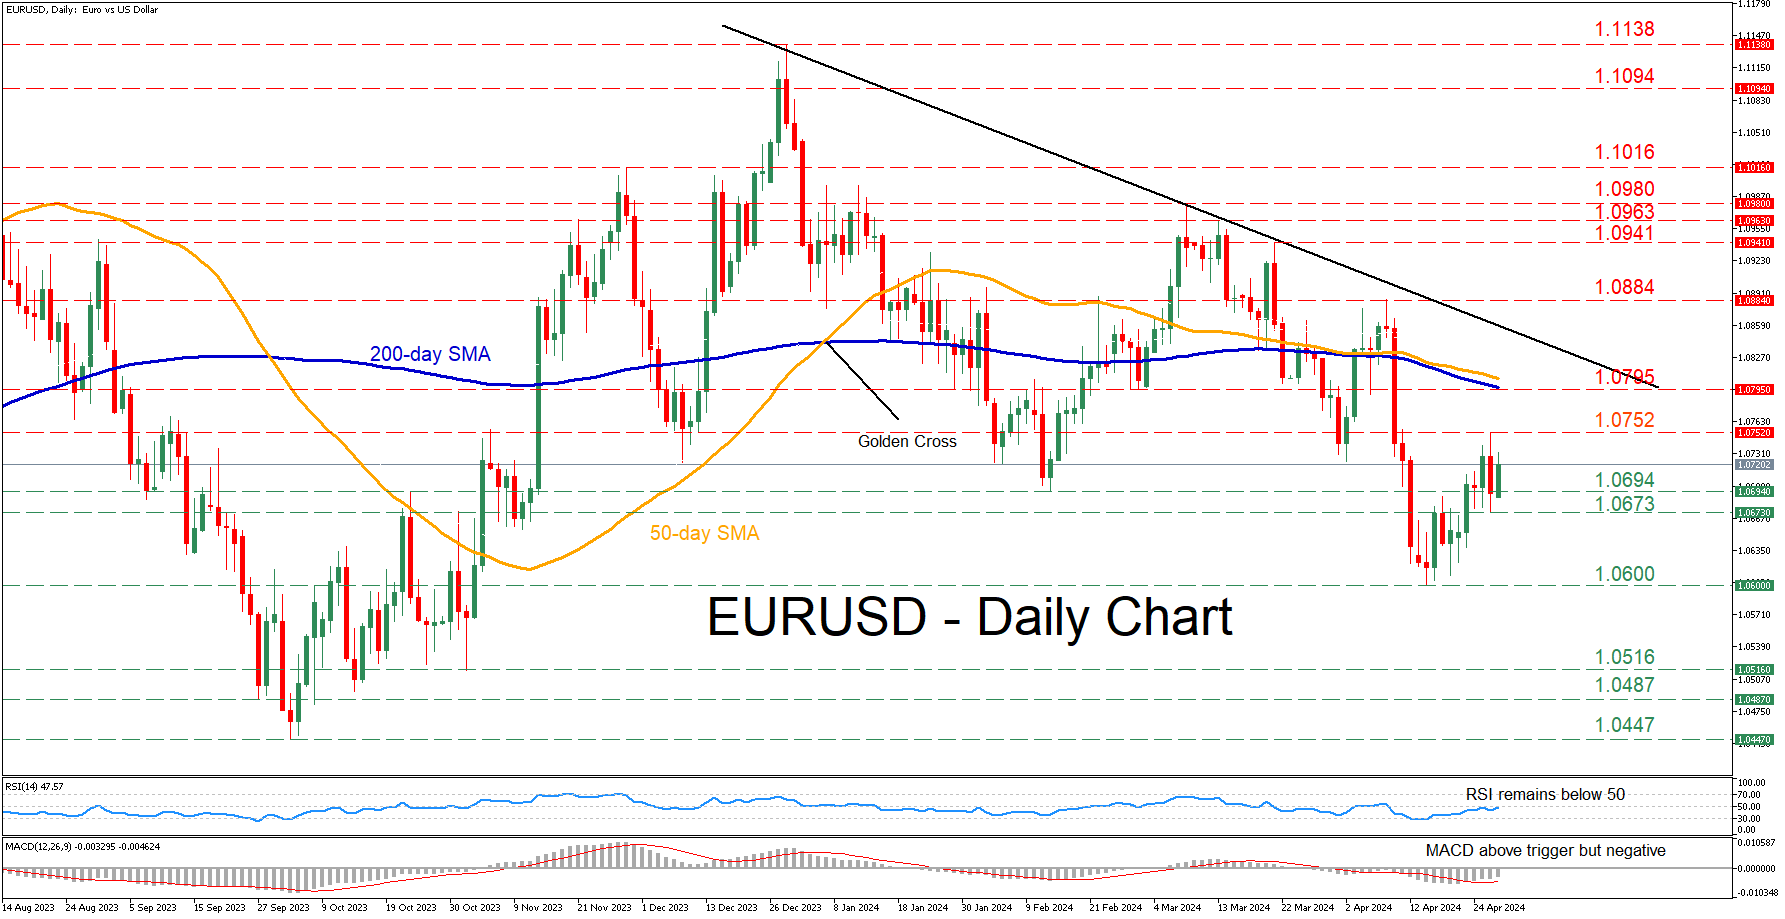
EURUSD came under severe selling pressure in the aftermath of a hotter-than-expected inflation report on April 10, posting a fresh 2024 low of 1.0600. Although the pair has been regaining ground since then, the momentum indicators are still tilted to the downside.
Should the rebound resume, the recent resistance of 1.0752 could prove to be the first barrier for the price to overcome. Conquering this barricade, the bulls could attack 1.0795, a region that acted both as support and resistance throughout 2024 and overlaps with the 200-day simple moving average (SMA). A violation of that zone could set the stage for the September high of 1.0884.
Alternatively, a downside move could meet immediate support at the February low of 1.0694. Sliding beneath that floor, the price could test the recent support of 1.0673. Even lower, the five-month bottom of 1.0600 could come under scrutiny.
In brief, EURUSD has been in a recovery mode over the past few sessions, but the momentum indicators are suggesting that bears are still holding the upper hand. Hence, a break above the 200-day SMA is needed for the short-term picture to improve.
US 500 Cash Index in the Green Ahead of Fed
- US 500 index is edging higher, a tad below the 50-day SMA
- Bulls are feeling more confident following strong tech earnings
- Momentum indicators are mixed at this stage
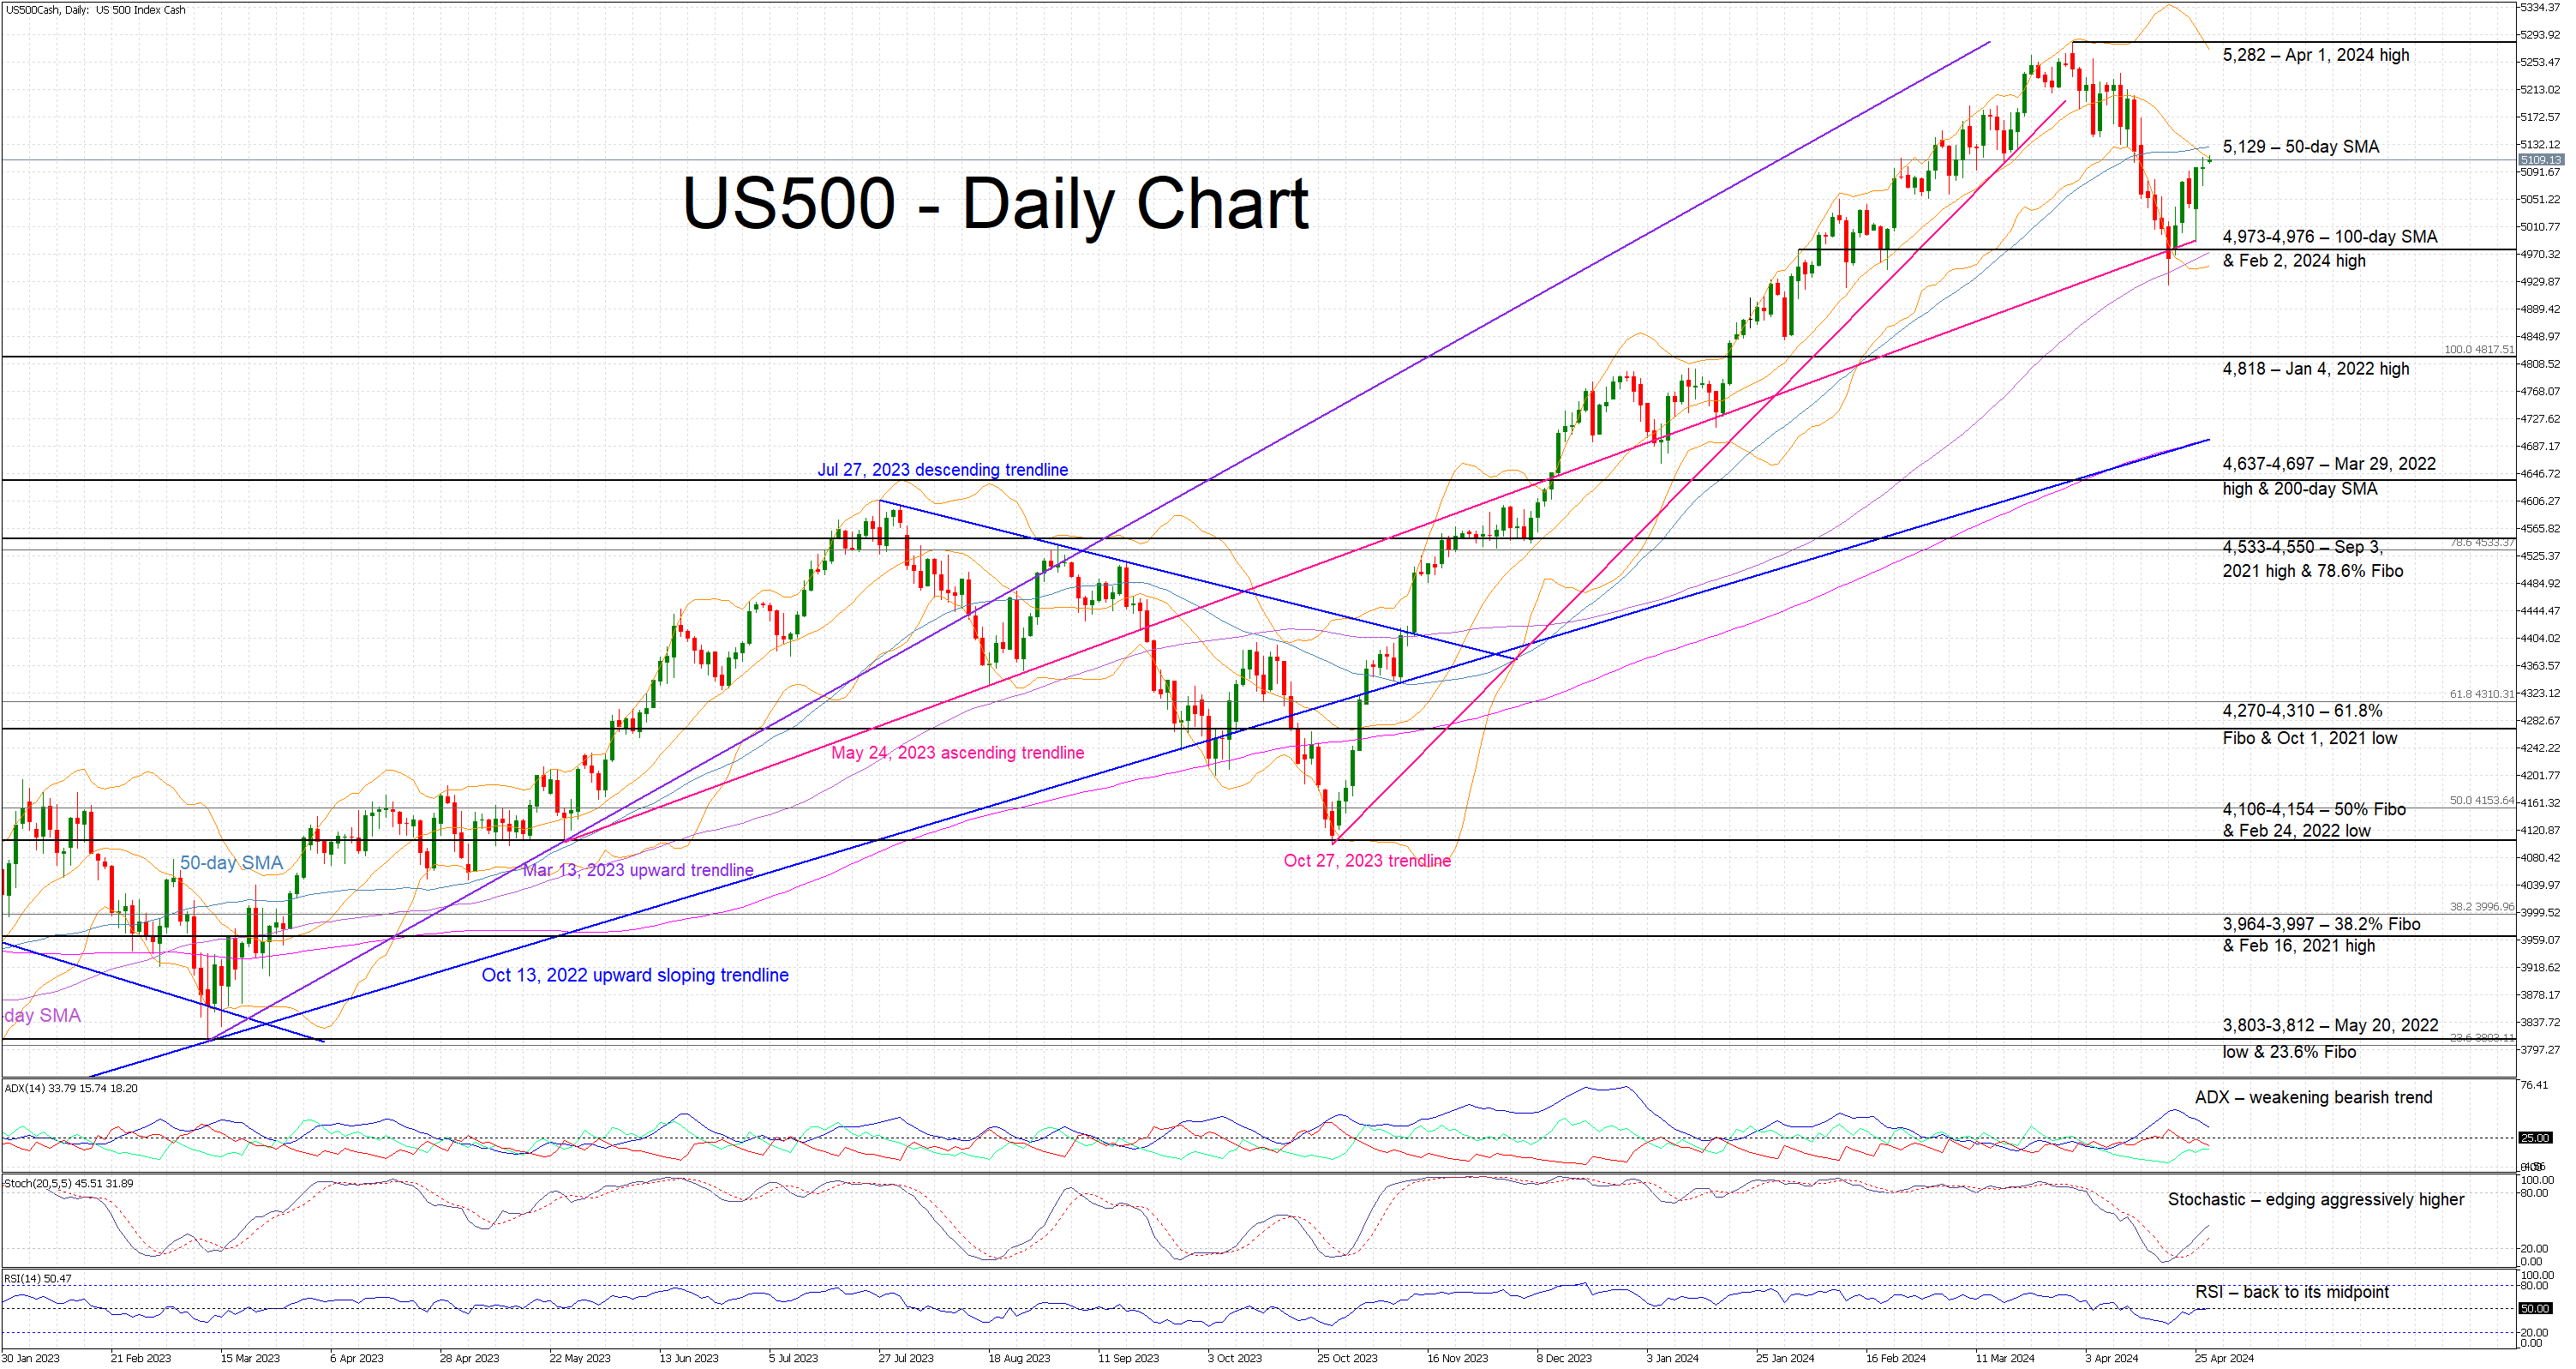
The US 500 cash index is trying to record its third consecutive green candle today as the bulls are probably feeling relieved following the recent strong tech earnings and the lack of a significant upside surprise in last week’s PCE report. The US 500 index is apparently preparing to test the 50-day simple moving average (SMA) as the market’s focus has firmly turned to Wednesday’s Fed meeting.
In the meantime, the momentum indicators are mostly mixed. The Average Directional Movement Index (ADX) is edging lower, signalling the end of the recent bearish trend, and possibly pointing to quieter sessions ahead. Similarly, the RSI is back at its midpoint area, confirming the market participants’ decision to stay on the sidelines ahead of this week’s big events. Interestingly though, the stochastic oscillator is moving aggressively higher and building a gap from its moving average. Should this move pick up pace, it would be seen as a strong bullish signal.
Should the bulls remain confident, they would try to overcome the 50-day SMA at 5,129 and then gradually set sail for the April 1, 2024 high of 5,282. If successful, they could have the chance to record a new all-time high.
On the other hand, the bears are trying to retake market control and keep the US 500 index below the 50-day SMA. They could then push it gradually lower towards the busier 4,973-4,976 range, which is populated by the 100-day SMA, the February 2, 2024 high and the May 24, 2023 ascending trendline. Even lower, the January 4, 2022 high at 4,818 could prove stronger to overcome than currently anticipated.
To conclude, market participants are preparing for this week’s key events starting with the Fed decision on Wednesday that could determine the short-term outlook in the US 500 index.
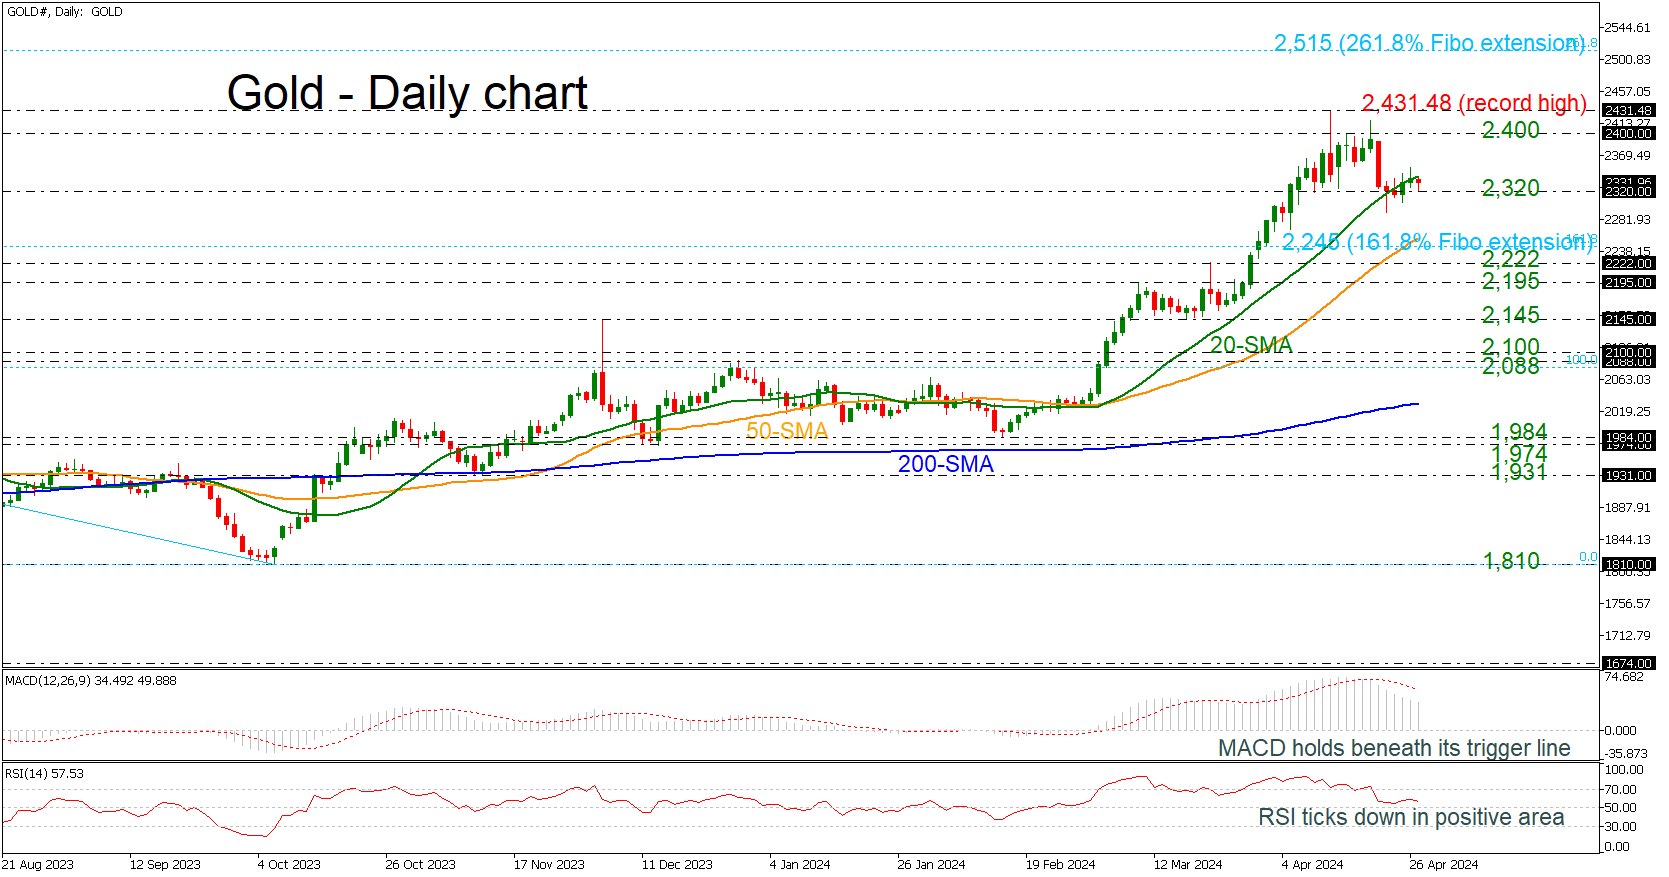
Gold Weakens Its Momentum
- Gold holds near the 20-day SMA
- Oscillators are heading south
Gold prices are moving back and forth of the 2,320 barrier and the 20-day simple moving average (SMA), while remaining in a positive territory. However, the technical oscillators are weakening their momentum. The MACD is standing beneath its trigger line above the zero level, while the RSI is ticking down above the neutral threshold of 50.
If the price remains above the 2,320 support then the price may re-challenge the 2,400 round number before touching the record high of 2,431.48. Rising further, the price may hit the next handles such as 2,500 and the 261.8% Fibonacci extension level of the down leg from 2,088 to 1,810 at 2,515.
On the other hand, a decline beneath the 2,320 level could open the way towards the 161.8% Fibonacci of 2,245, which stands slightly beneath the 50-day SMA. Even lower, the 2,222 line and the 2,195 support may halt bearish actions.
To sum up, gold prices are failing to improve their upside movements in the short-term view, but the broader outlook is still bullish.
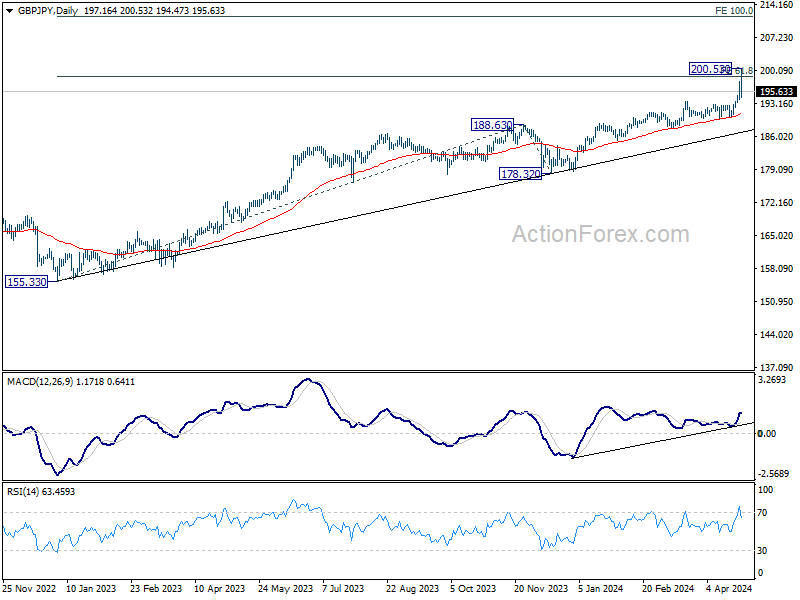
GBP/JPY Daily Outlook
Daily Pivots: (S1) 195.21; (P) 196.57; (R1) 199.17; More..
GBP/JPY's steep retreat indicates short term topping at 200.53. Intraday bias is turned neutral for consolidations first. But outlook will remain bullish as long as 193.51 resistance turned support holds. Firm break of 200.53 will resume larger up trend.
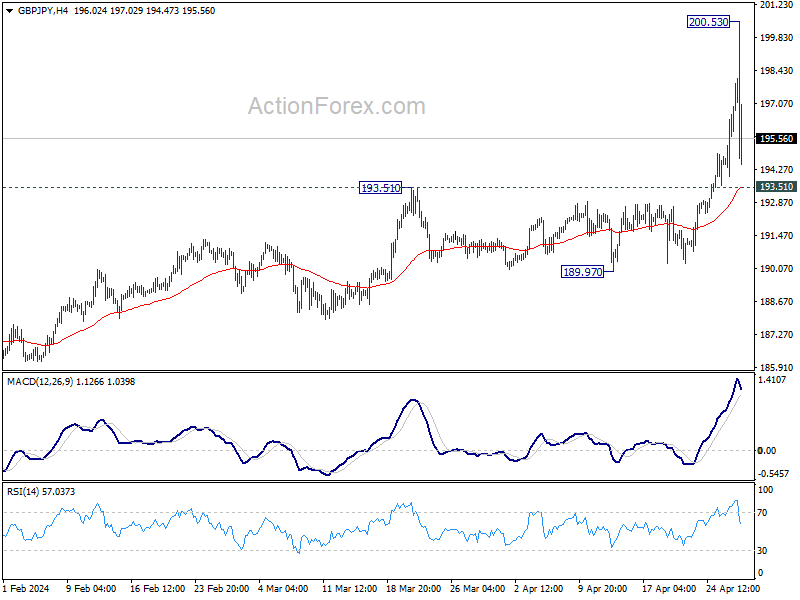
In the bigger picture, current rally is part of the up trend from 123.94 (2020 low). Sustained break of 61.8% projection of 155.33 to 188.63 from 178.32 at 198.89 will pave the way to 100% projection at 211.65. Break of 189.97 support is needed to be the first sign of medium term topping. Otherwise, outlook will remain bullish in case of retreat.
EUR/JPY Daily Outlook
Daily Pivots: (S1) 167.37; (P) 168.38; (R1) 170.30; More...
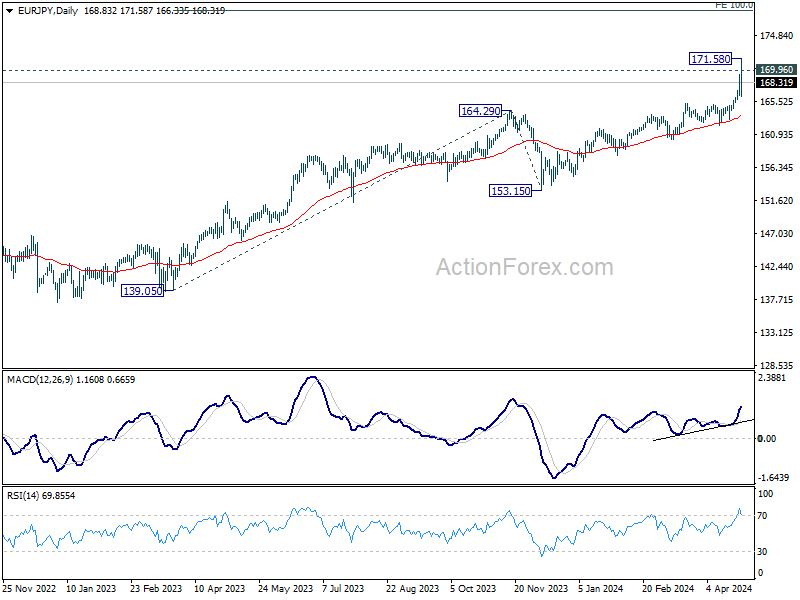
EUR/JPY's steep retreat indicates short term topping at 171.58 already. Intraday bias is turned neutral for some consolidations first. But outlook will remain bullish as long as 165.33 resistance turned support holds. Above 171.58 will resume larger up trend to 178.39 projection level next.
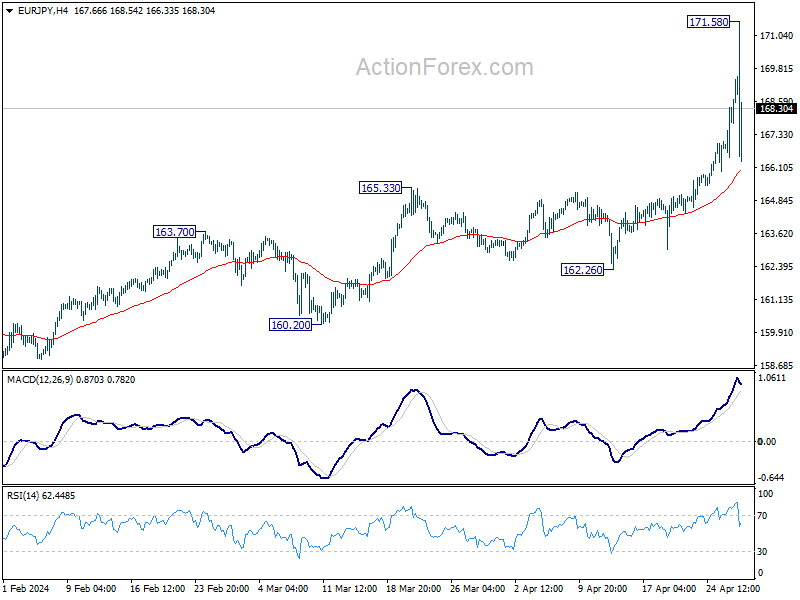
In the bigger picture, current rally is part of the up trend from 114.42 (2020 low), which is still in progress. Decisive break of 169.96 (2008 high) will pave the way to 100% projection of 139.05 to 164.29 from 153.15 at 178.39. On the downside, break of 162.26 support is needed to be the first sign of medium term topping. Otherwise, outlook will stay bullish in case of retreat.
EUR/GBP Daily Outlook
Daily Pivots: (S1) 0.8550; (P) 0.8567; (R1) 0.8576; More...
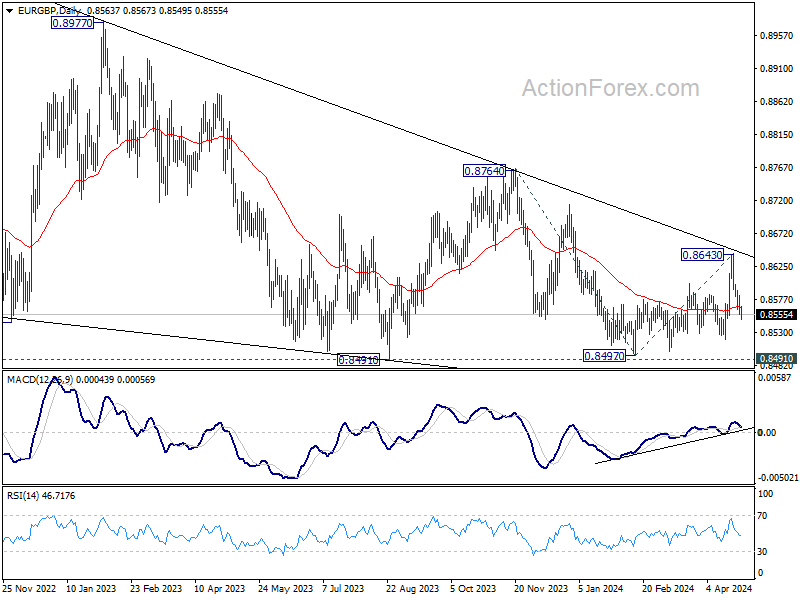
Intraday bias in EUR/GBP remains on the downside at this point. Corrective rebound from 0.8497 should have completed at 0.8643, after rejection by trend line resistance. Deeper fall would be seen to retest 0.8491/7 support zone. On the upside, above 0.8582 minor resistance will turn intraday bias neutral first.
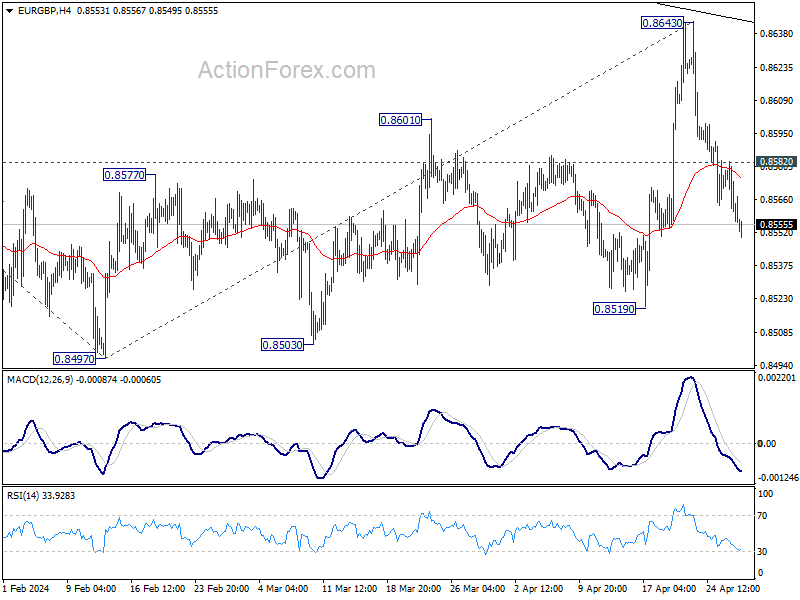
In the bigger picture, outlook remains bearish as EUR/GBP is capped below medium term falling trendline. That is, down trend from 0.9267 (2022 high) is still in progress. Firm break of 0.8491/7 will target 100% projection of 0.8764 to 0.8497 from 0.8643 at 0.8376.