Sample Category Title
USD/JPY Jumpy as Japan’s Core CPI Eases
The Japanese yen showed some promise earlier, gaining as much as 0.48% against the US dollar as it rose to 153.59. However, it has pared those gains and is trading in Europe at 154.58, down 0.04%.
Japan’s core CPI falls to 2.6%
Japan’s nationwide CPI, which excludes fresh food, rose 2.6% y/y in March, down from 2.8% in February but higher than the market estimate of 2.7%. Core CPI has now exceeded the Bank of Japan’s 2% target for 24 consecutive months. The deceleration was driven by a decrease in food inflation but the yen’s weakness prevented a sharper drop in inflation.
The “core-core” CPI reading, which excludes fresh food and energy, dropped from 3.2% to 2.9% in March, below the forecast of 3%. This marked the first time that the index has fallen below 3% since November 2022.
While consumer inflation continues to slow, the Bank of Japan is more focused on services inflation, as it believes that services inflation together with higher wage growth are the recipe to ensuring that inflation remains sustainable at the 2% target.
The yen is down almost 10% since the start of the year and the sharp depreciation in such a short period has Tokyo concerned. The Ministry of Finance last intervened in the currency markets in late 2022 when the yen traded around 152. With the yen falling this week to 154.78, a 34-year old low, the markets are on alert for the possibility of another intervention.
The weak yen could also have a significant impact on rate policy. On Thursday, BoJ Governor Kazuo Ueda said that the Bank might raise interest rates again if the yen’s decline led to a significant rise in inflation. The BoJ lifted rates out of negative policy in March but the yen has weakened since then.
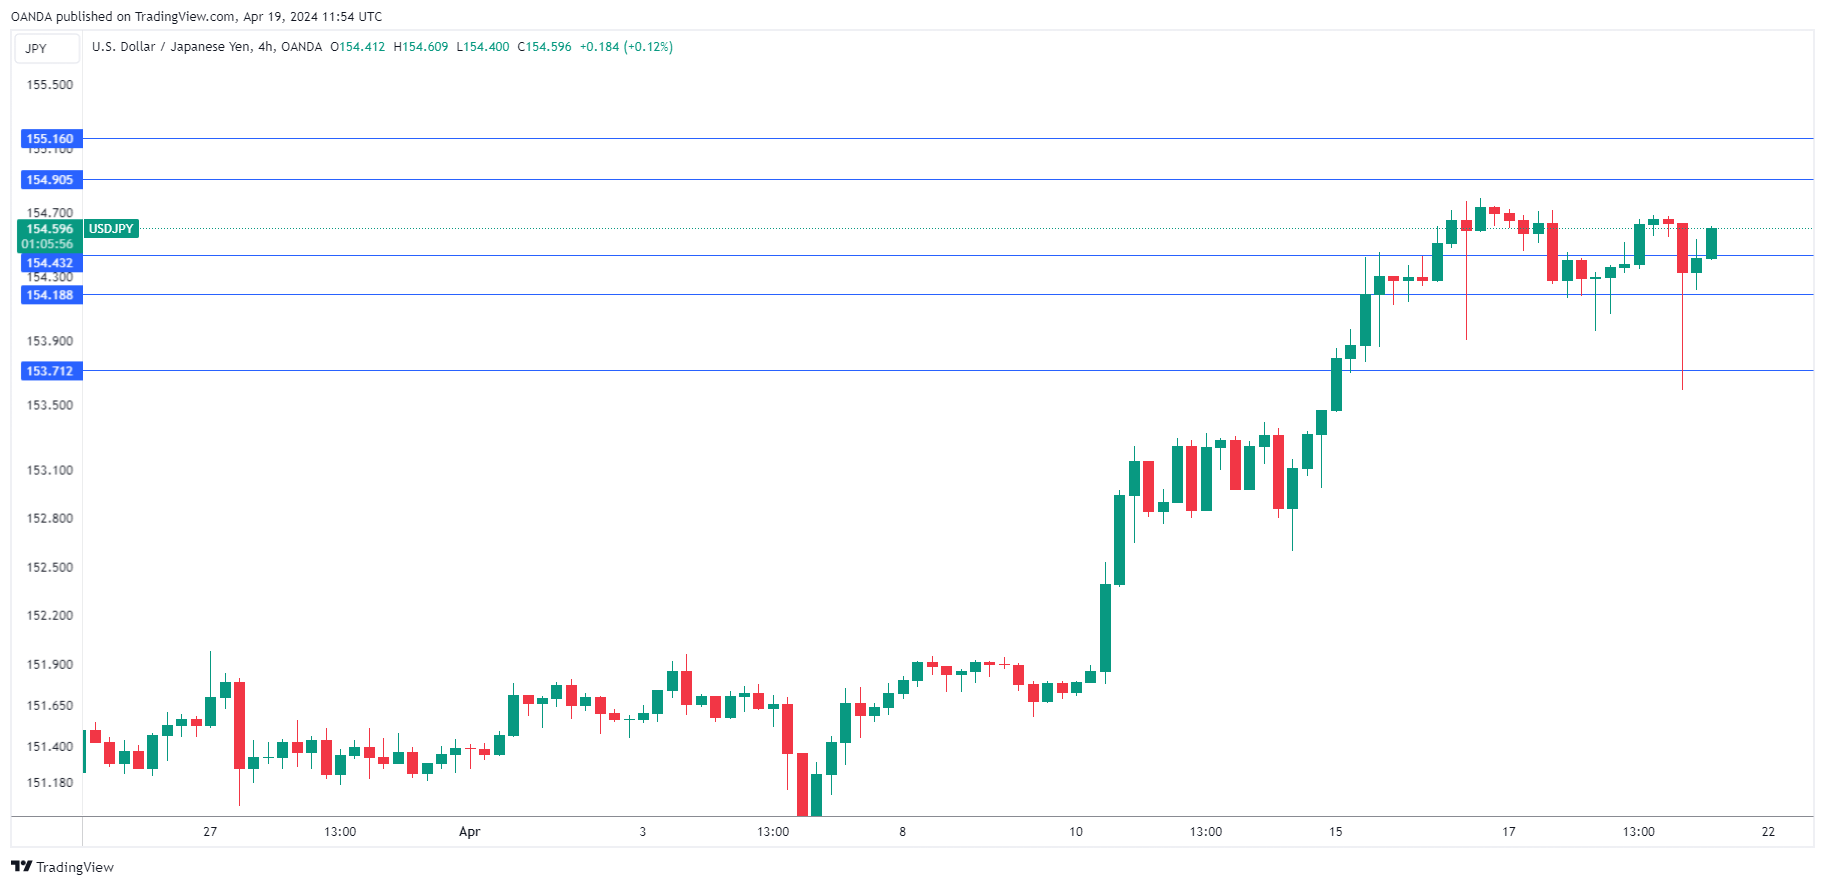
USD/JPY Technical
- USD/JPY tested resistance at 154.43 earlier. Above, there is resistance at 154.71
- There is support at 154.11 and 153.83
EUR/USD Mid-Day Outlook
Daily Pivots: (S1) 1.0626; (P) 1.0658; (R1) 1.0675; More...
Intraday bias in EUR/USD remains neutral and outlook is unchanged. While stronger recovery cannot be ruled out, upside should be limited by 1.0723 support turned resistance. On the downside, break of 1.0601 will resume the decline from 1.1138 to 100% projection of 1.1138 to 1.0694 from 1.0980 at 1.0536 next.
In the bigger picture, price actions from 1.1274 are viewed as a corrective pattern to rise from 0.9534 (2022 low). Current fall from 1.1138 is seen as the third leg. While deeper decline is would be seen to 1.0447 and possibly below. Strong support should emerge from 61.8% retracement of 0.9534 to 1.1274 at 1.0199 to complete the correction.
Market Calm Restored After Middle East Tensions Subside
Financial markets have steadied following a brief period of heightened volatility triggered by fears of escalating conflict in the Middle East. Initial concerns about a full-scale confrontation were alleviated. Both Israel and Iran played down the significance of recent explosions near an Iranian military base, suggesting a broader conflict might be avoided for now. As a result, while major European indices and US futures are trading lower, losses remain contained. WTI crude oil has retracted to around 82 after a temporary spike above 86, and gold has settled back below 2400 handle.
In currency markets, Swiss Franc is currently the strongest performer this week, followed by Canadian Dollar and Euro. Conversely, Yen is the weakest, with Kiwi and the Aussie also underperforming. Dollar and Sterling are positioning in the middle. With no significant economic data expected in the US session today, the markets are anticipated to close the week without major fluctuations, maintaining a calm posture after today's geopolitical scare.
In Europe, at the time of writing, FTSE is down -0.49%. DAX is down -0.63%. CAC is down -0.12%. UK 10-year yield is down -0.0218 at 4.258. Germany 10-year yield is down -0.011 at 2.489. Earlier in Asia, Nikkeifell -2.66%. Hong Kong HSI fell -0.99%. China Shanghai SSE fell -0.29%. Singapore Strait Times fell -0.35%. Japan 10-year JGB yield fell -0.034 to 0.837.
UK retail sales flat in Mar, misses expectations
In the UK, retail sales volumes was unchanged in March, falling short of the modest 0.3% mom growth anticipated by analysts. The performance within the retail sector was varied: automotive fuel and non-food store sales saw increases of 3.2% and 0.5%, respectively, which were offset by declines in food stores and non-store retailers, dropping by 0.7% and 1.5%.
On a quarterly basis, retail sales volumes rising 1.9% in the three months to March, a recovery attributed to the bounce back from particularly low sales volumes experienced during the Christmas shopping season.
BoJ's Ueda: Impact of weak Yen on inflation could lead to policy shift
During a press conference today, BoJ Governor Kazuo Ueda highlighted the potential economic repercussions of the persistently weak yen, particularly its effect on trend inflation through increased costs of imported goods.
"There's a possibility the weak yen could push up trend inflation through rises in imported goods prices," Ueda noted, indicating that such a scenario "might lead to a change in monetary policy."
At the same occasion, Finance Minister Shunichi Suzuki pointed out that exchange rates are not solely influenced by interest rate differentials. Various other factors, such as each country's current account balance, market participants' sentiment, and speculative trade, drive currency moves," Suzuki explained.
Japan's CPI core slows to 2.6% in Mar, CPI core-core down to 2.9%
In March, Japan observed a subtle cooling in core inflation, though levels persistently exceed BoJ's target.
Core CPI, which excludes food prices, slowed from 2.8% yoy to 2.6% yoy, slightly under the expectation of 2.7% yoy, marking a continued stretch above BoJ's 2% target for two full years.
Further detail is seen in the core-core CPI, excluding both food and energy, which decreased from 3.2% yoy to 2.9% yoy. This marks the seventh consecutive month of deceleration and brings this measure below 3% level for the first time since November 2022.
Meanwhile, headline CPI dipped slightly from 2.8% year-on-year to 2.7%, aligning with analysts' forecasts.
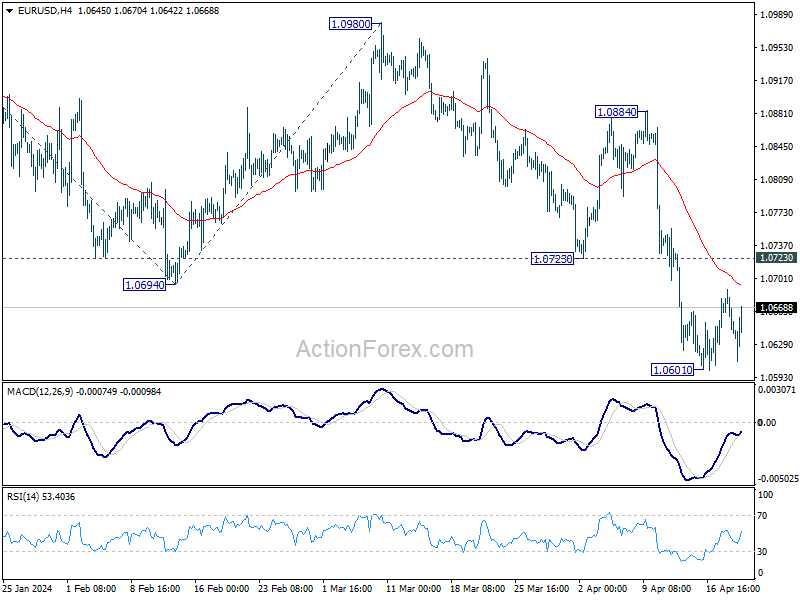
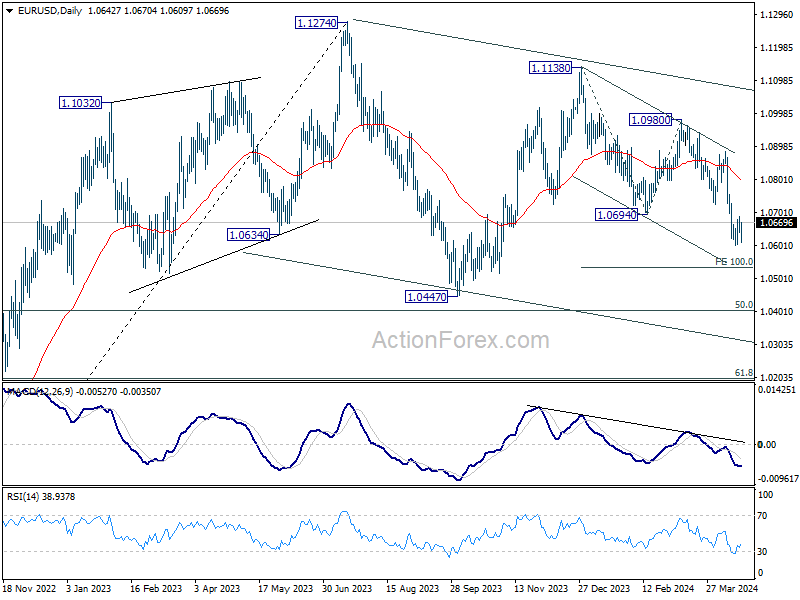
EUR/USD Mid-Day Outlook
Daily Pivots: (S1) 1.0626; (P) 1.0658; (R1) 1.0675; More...
Intraday bias in EUR/USD remains neutral and outlook is unchanged. While stronger recovery cannot be ruled out, upside should be limited by 1.0723 support turned resistance. On the downside, break of 1.0601 will resume the decline from 1.1138 to 100% projection of 1.1138 to 1.0694 from 1.0980 at 1.0536 next.
In the bigger picture, price actions from 1.1274 are viewed as a corrective pattern to rise from 0.9534 (2022 low). Current fall from 1.1138 is seen as the third leg. While deeper decline is would be seen to 1.0447 and possibly below. Strong support should emerge from 61.8% retracement of 0.9534 to 1.1274 at 1.0199 to complete the correction.
Economic Indicators Update
| GMT | Ccy | Events | Actual | Forecast | Previous | Revised |
|---|---|---|---|---|---|---|
| 23:30 | JPY | National CPI Y/Y Mar | 2.70% | 2.70% | 2.80% | |
| 23:30 | JPY | National CPI core Y/Y Mar | 2.60% | 2.70% | 2.80% | |
| 23:30 | JPY | National CPI core-core Y/Y Mar | 2.90% | 3.20% | ||
| 06:00 | GBP | Retail Sales M/M Mar | 0.00% | 0.30% | 0.00% | |
| 06:00 | EUR | Germany PPI M/M Mar | 0.20% | 0.00% | -0.40% | |
| 06:00 | EUR | Germany PPI Y/Y Mar | -2.90% | -4.10% |
Halving Helped Bitcoin Digest Sell-off
Market picture
The crypto market was relatively quick to digest the sell-off that gripped markets following Israel’s attack on Iran. The capitalisation rose 4.7% in 24 hours to $2.33 trillion, but this is down from $2.62 trillion seven days earlier.
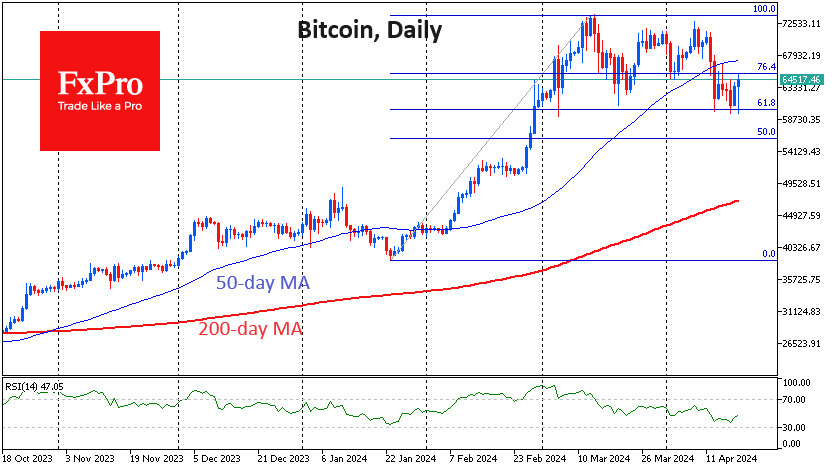
Halving and strong technical support are supporting a ‘buy on dips’ pattern in Bitcoin, and this is affecting the rest of the cryptocurrencies. The halving will take place on Saturday night. The technical picture now suggests that BTCUSD is successfully holding within a corrective pattern, finding support on dips to the 61.8% Fibonacci retracement level of the rally from the January lows.
However, bullish positions are not as strong as they were earlier in the month, with the 50-day moving average acting as resistance. A strong rally above $67 will be needed to overcome this bearish signal.
News background
JPMorgan allowed bitcoin to fall after it halved based on an analysis of open interest in bitcoin futures. In addition, the market remains overbought.
Historically, major post-halving gains occur in 6-18 months, and major price changes become statistically less likely as market size increases, Coinify noted.
Analyst PlanB, creator of the Stock-to-Flow model, said the current halving cycle is no different from previous ones. He expects bitcoin to peak at $100K in 2024 and $300K next year.
The Finder platform presented the results of a survey of 31 cryptocurrency and financial technology experts. Bitcoin could reach $122K in 2024 and $109K by the end of the year.
According to BitInfoChart, bitcoin transaction fees spiked on the back of user activity in anticipation of the launch of Runes, a new interchangeable token standard on the BTC blockchain. The average commission exceeded $16.
XAU/USD: Gold Spikes Above $2,400 Again as Deteriorating Geopolitical Situation Boosts Demand
Gold probed above $2400 level for the second time, inflated by increased safe-haven demand following Israel’s attack on Iran early Friday.
Although the spike above $2400 (the metal’s price reached $2417) was so far short-lived, near-term focus remains at the upside, as fears of further escalation in the region will continue to fuel demand.
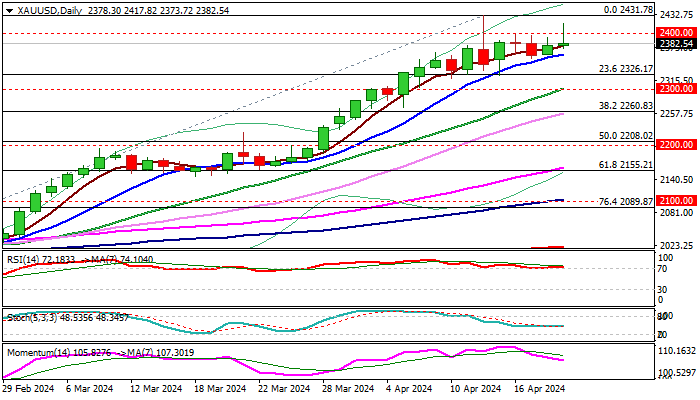
Technical picture is firmly bullish, as indicators are in bullish setup and recent dips were contained by rising 10DMA.
However, overbought RSI and weakening positive momentum warn that price may hold in extended consolidation, before larger bulls resume, as next target at $2500 is coming in focus.
Rising 10DMA ($2363) offers immediate support, with extended dips to find ground above $2300 (psychological, reinforced by rising 20DMA) to keep larger bulls unharmed.
Conversely, loss of $2300 handle to weaken near-term structure and risk test of next pivotal support at $2260 (Fibo 38.2% of $1984/$2431).
Res: 2400; 2417; 2431; 2500.
Sup: 2362; 2364; 2326; 2300.
GBP/USD Edges Higher After Flat Retail Sales
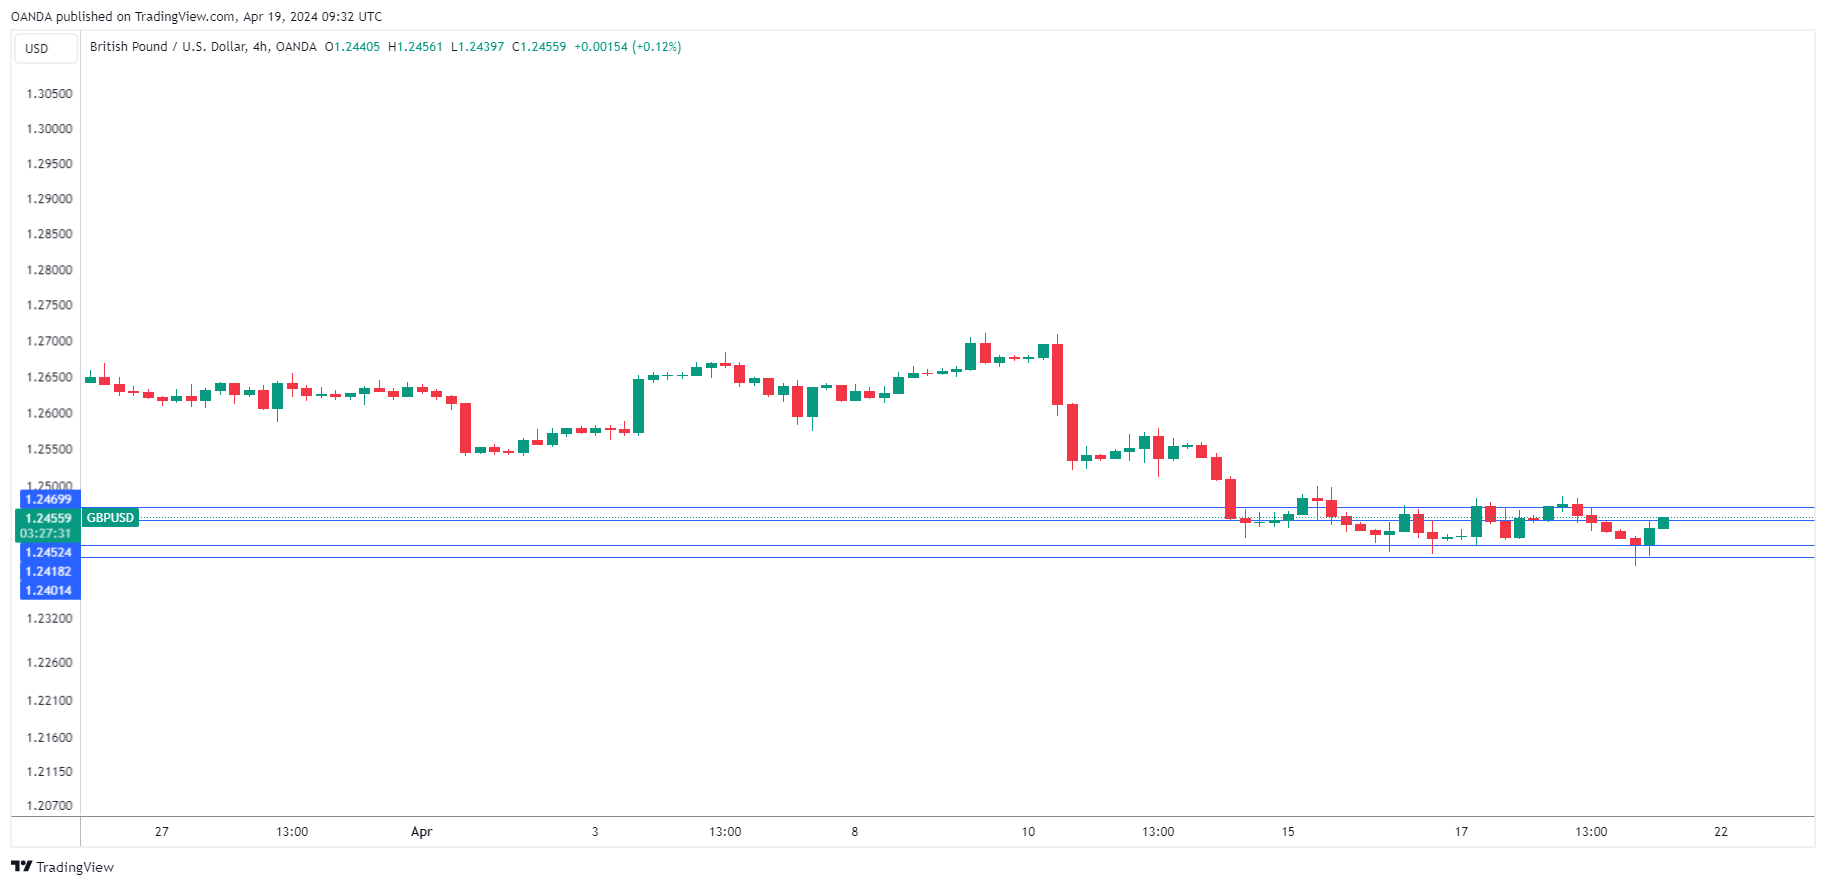
The British pound dipped 0.30% earlier today but has managed to recover the losses. In the European session, GBP/USD is trading at 1.2451, up 0.12%.
Retail sales misses estimate
The UK release retail sales were flat in March, after a revised 0.1% gain in February and missing the market estimate of 0.3%. Fuel sales were higher but were offset by weaker food sales. This was a disappointment for retailers as hopes that the Easter holiday would boost March sales failed to materialize. On a yearly basis, retail sales rose 0.8%, up from a revised -0.3% in February and just above the market forecast of 0.7%.
The weak release was impacted by heavy rains in March, which kept consumers away from shops. Even without the adverse weather, consumers are sour about the economy and holding tight to the purse strings. Retail sales have been bumpy in 2024 but could show improvement in the coming months. The weather will improve in the coming months and the Paris Olympics and Taylor Swift concerts are expected to lead to an increase in consumer spending and demand.
The Bank of England remains cautious about trimming rates and the consensus view is that the BoE won’t lower rates until September. The BoE remains cautious, especially after Federal Reserve Chair Powell said this week that it will delay rate cuts due to rising inflation. Morgan Stanley is more dovish and expects a rate cut in June, arguing that UK inflation has dropped to 3.2% and will fall below the BoE’s 2% target in the second quarter.
GBP/USD Technical
- GBP/USD tested support at 1.2418 and 1.2401 earlier. Below, there is support at 1.2367
- There is resistance at 1.2452 and 1.2469
Gold Hits Record High Amid Growing Geopolitical Tensions
Gold prices have soared past 2400.00 USD, reaching a new record high on Friday. This marks the fifth consecutive week of gains for the precious metal, fuelled by increasing market demand for "safe-haven" assets amid escalating geopolitical tensions and uncertain global economic conditions.
The recent sharp increase in geopolitical tensions, particularly in the Middle East, has overshadowed optimistic remarks from Federal Reserve officials. The Fed's monetary authorities are currently inclined towards gradual interest rate cuts throughout the year, given the persistent strength of inflation and the robust state of the US economy. However, the deepening conflict, especially with Iran's involvement, has heightened concerns about the stability of the region, diminishing hopes for a quick diplomatic resolution.
Gold's role as a defensive asset has been reinforced under these circumstances, with expectations that its price could climb even higher if the Middle East conflict continues escalating. Investor interest in gold will likely to persist as long as the situation remains volatile.
The focus on gold as a safe investment has largely overshadowed other economic indicators, including fluctuations in the value of the US dollar and other currencies.
Technical analysis of XAU/USD
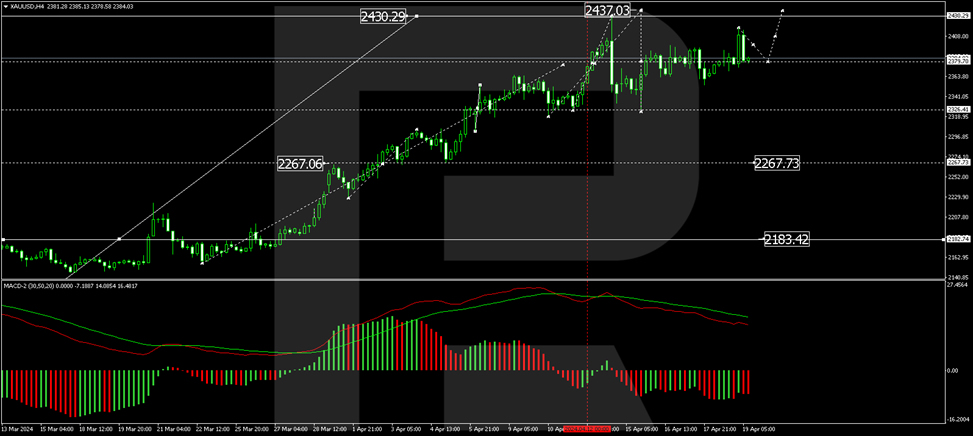
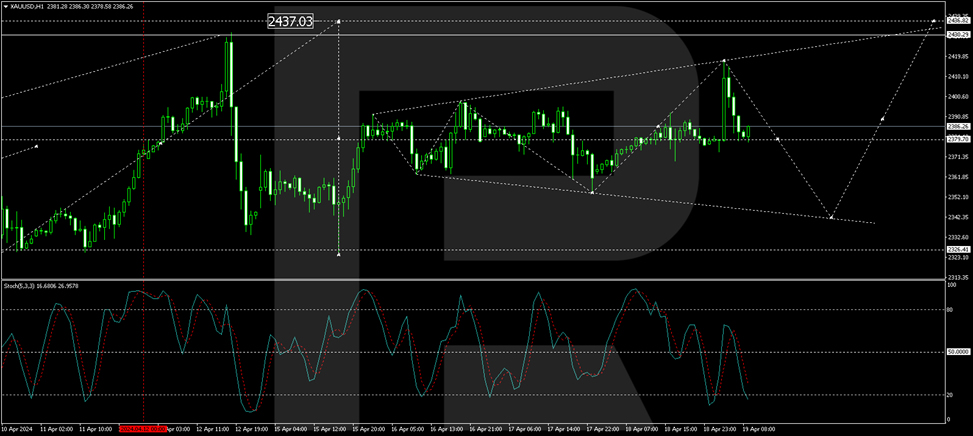
On the H4 chart of XAU/USD, a broad consolidation range has formed around 2379.70. Exiting this range upward opens the potential to target 2437.00. Following this, a correction to the level of 2323.23 might commence, possibly extending to 2183.42. This scenario is supported by the MACD indicator, with its signal line positioned above zero but poised to decline towards new lows.
On the H1 chart, XAU/USD exhibits a diverging "Triangle" formation around 2379.70. A downward movement to 2342.42 could occur, followed by an upward trajectory to 2437.00. Upon reaching this peak, a decline to 2323.23 is anticipated. This corrective movement is the initial target. The Stochastic oscillator, with its signal line currently above 20, is expected to rise towards 80, suggesting potential upward movements within this framework.
Escalation Between Iran and Israel: How the Price of Brent Oil Reacts
On the night of Thursday into Friday, reports emerged that Israel had attacked Iran following Iran's attack on Israel over the weekend.
Let's remember that we wrote on Monday that after a 300 drone and missile attack on Israel over the weekend, the price of Brent oil did not rise. Perhaps this happened because Iran's attack was then expected after the attack on its diplomatic mission, and warnings were published in the media.
And the initial reaction of financial markets to the escalation tonight looked more dramatic - there was a jump in prices for protective assets:
→ gold rose in price to USD 2,410 and above;
→ the Swiss franc and the Japanese yen have risen in price;
→ oil and US Treasury bonds rose in price.
There was also a sale of risky assets — Bitcoin, for example, fell below the USD 60k level. Moh Siong Sim, currency strategist at the Bank of Singapore, told Reuters: "It's pretty obvious the market is nervous. I think markets are at this stage in a flight-to-safety mode.”
As the morning approached, new information began to appear in Europe:
→ An Iranian official told Reuters that there was no missile attack;
→ CNN writes that Iranian air defenses intercepted three drones, and the United States did not approve of the Israeli attack;
→ According to the IAEA, there was no damage to Iran’s nuclear facilities after the Israeli strike.
→ According to ABC News, air traffic has resumed in Iran.
As a result, prices moved towards the closing levels of yesterday's trading — V-like patterns formed on the charts of the mentioned instruments.
The oil market can be considered the most susceptible to the influence of nightly news, since Iran is one of the top 10 countries in oil production.
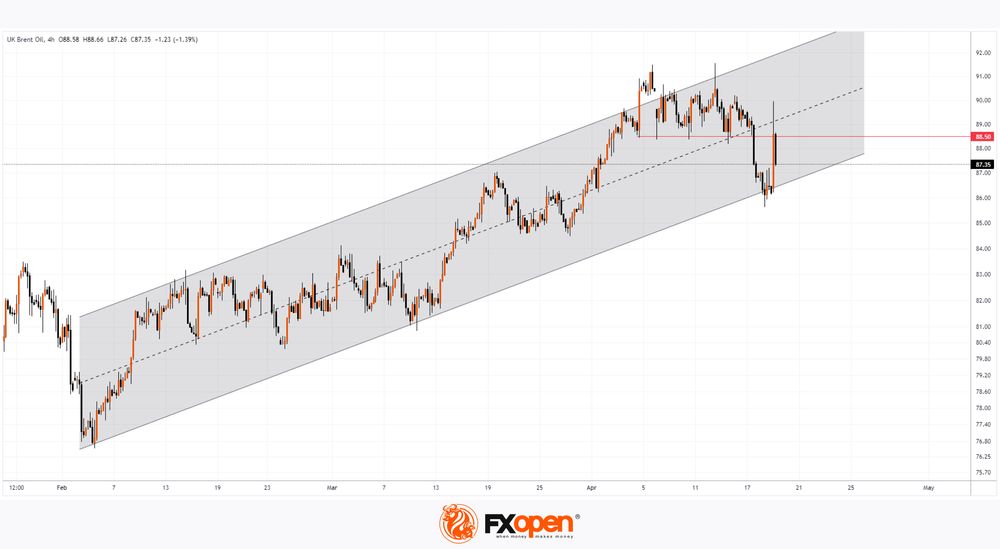
Technical analysis of the Brent oil chart shows that:
→ the price rebounded from the level of the lower border of the ascending black channel (as we wrote yesterday);
→ however, supply forces intensified and returned the price closer to the lower border;
→ at the same time, a bearish inverted V pattern has formed on the Brent price chart today, and the median line of the channel shows signs of resistance;
→ it is also acceptable to expect that the former support at USD 88.50 will provide resistance when the price attempts to rise.
If a further round of escalation between Iran and Israel does not occur, it is possible that the Brent price will break down the current black ascending channel. And this may be welcomed by the US administration, where presidential elections are getting closer and closer.
GBPJPY Range Trading Continues
- GBPJPY is in the red today, not far from its recent high
- It continues to hover inside a rectangle structure
- Momentum indicators are in waiting mode for the next key events
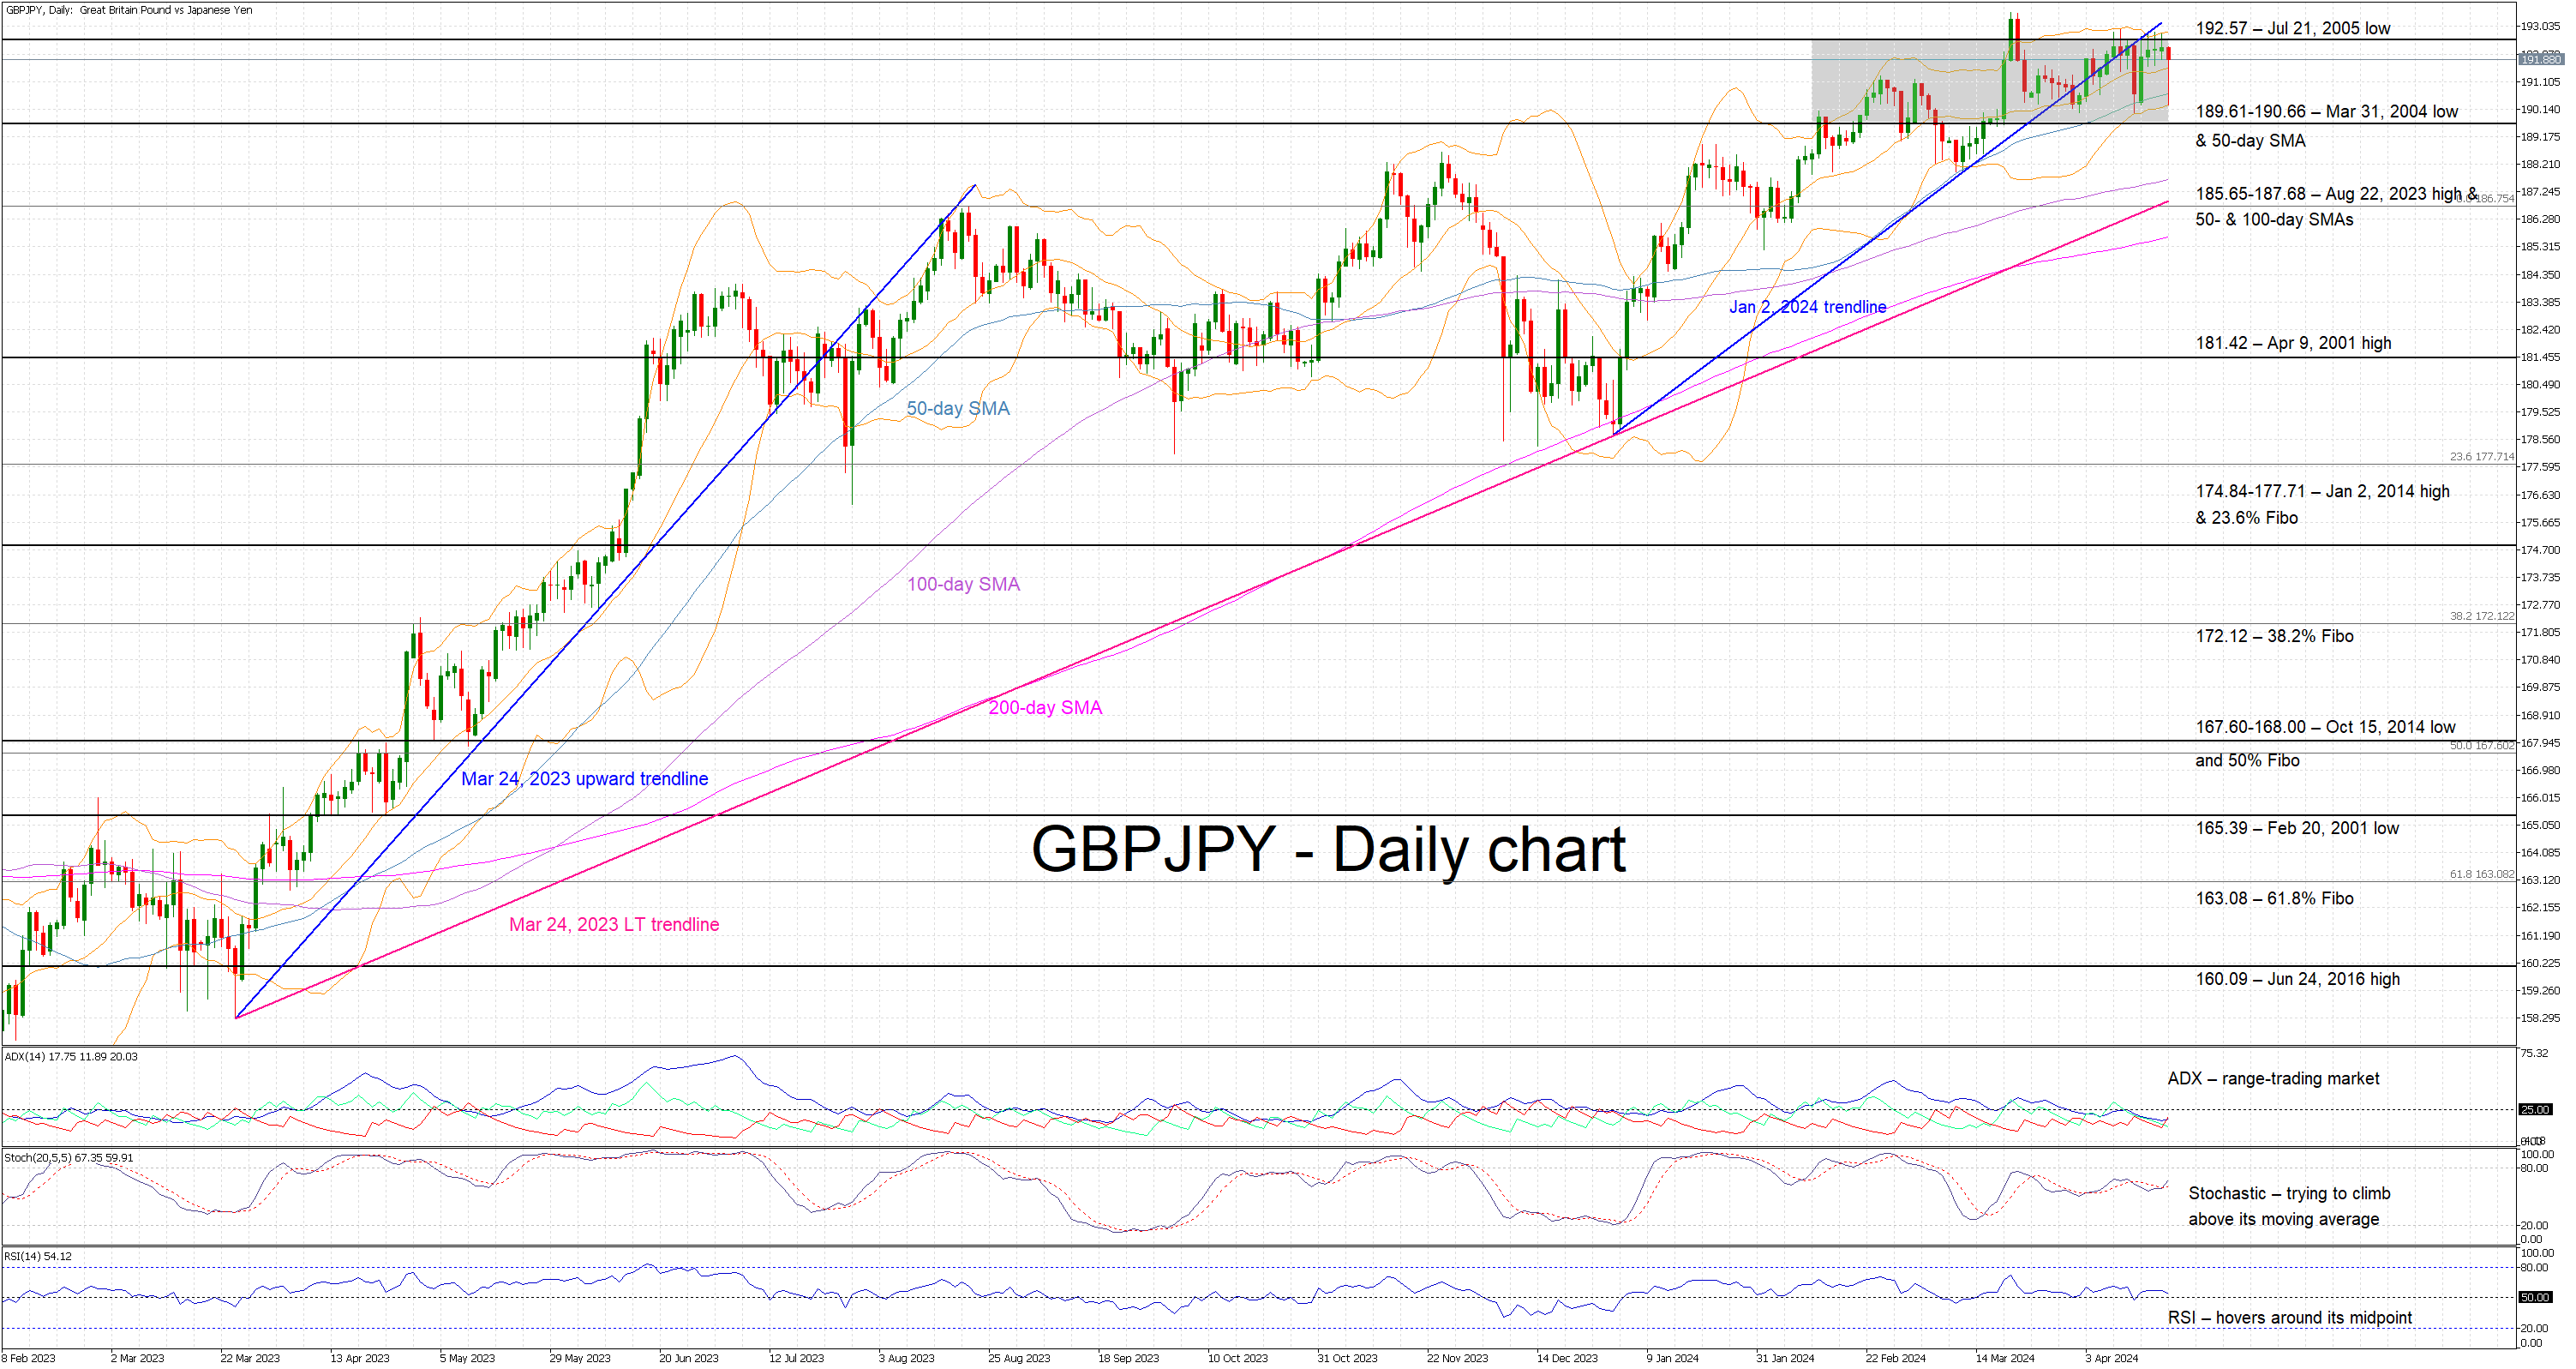
GBPJPY is trading lower today as the market is digesting the latest developments in the Middle East and the lower Japanese inflation prints, and also prepares for next week’s BoJ meeting. Following an aggressive pace of ascension, GBPJPY appears to have settled inside a rectangle with the upper boundary set by the July 21, 2005 low of 192.57. The barrage of verbal interventions by Japanese officials could have also contributed to this range trading activity, which is clearly depicted in the momentum indicators.
More specifically, the Average Directional Movement Index (ADX) remains stuck below its 25-threshold, signaling a trendless market. Similarly, the RSI continues to hover around 50, confirming the current indecisiveness of market participants. More importantly, the stochastic oscillator is trying to edge above its moving average, but such a move needs to pick up pace in order to be seen as a strong signal.
Should the bulls remain confident, they could test the resistance set by the July 21, 2005 low at 192.57 and then try to lead GBPJPY back above the January 2, 2024 ascending trendline. They could then have the chance to record a new 2024 high, above the current 193.52 high, with the next plausible target being in the 195.00 area.
On the other hand, the bears are desperate to regain market control and gradually push GBPJPY towards the 189.61-190.66 range, which is populated by the March 31, 2004 low and the 50-day simple moving average (SMA). If successful, they could then have a go at testing the support set by the 185.65-187.68 area that is defined by the August 22, 2023 high and the 100- and 200-day SMAs.
To sum up, range trading in GBPJPY continues as market participants have taken a back seat due to the geopolitical developments monopolizing the newsflow.
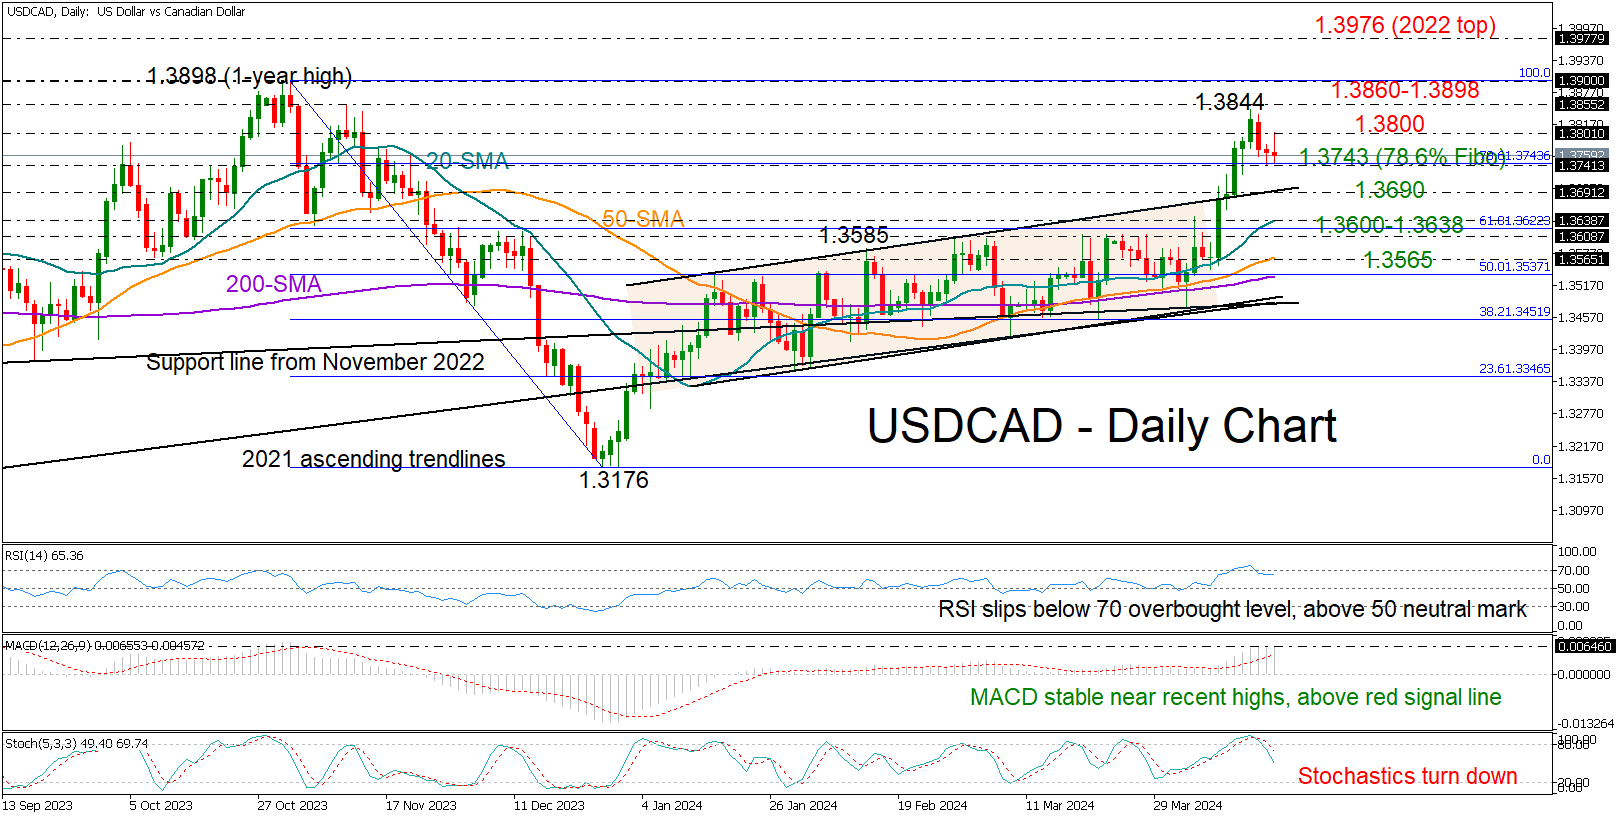
USDCAD Puts Rally on Hold Near 1.3800 Caution Zone
- USDCAD pauses aggressive bull run near five-month high
- Faces resistance around 1.3800, but remains supported above 1.3690
USDCAD attempted to re-enter the 1.3800 territory earlier today after its pullback from a five-month high of 1.3844 on Wednesday. But upside forces faded soon, forcing the price to pull back to Thursday’s closing price of 1.3765.
The RSI and the stochastic oscillator have exited the overbought territory, justifying the latest negative turn in the price. That said, the RSI is still comfortably elevated above its 50 neutral mark and the MACD is well above its red signal line, providing a ray of hope that the bulls could still show up.
Should the bears break below the 78.6% Fibonacci retracement of the November-December downleg at 1.3743, there is a possibility of another decline to retest the upper band of the broken bullish channel at 1.3690. An extension lower could stabilize somewhere between the 20-day simple moving average (SMA) and the 1.3600 round level. If not, the sell-off could continue towards the 50-day SMA at 1.3565.
In the positive scenario, where the pair closes back above 1.3800, it may face another tough battle within the 2023 peak area of 1.3860-1.3898. Once the border is successfully penetrated, the next target will be the 2022 top of 1.3976, while higher, the bulls might encounter resistance somewhere between the 1.4040 barrier seen in May 2020 and the psychological level of 1.4100.
To summarize, USDCAD has switched to a neutral mode and is awaiting a decisive move above 1.3800 or below 1.3690 to determine its next direction.