Sample Category Title
USDCAD Reaches New 2024 High; Could This Move Continue?
- USDCAD trades higher again, tests strong resistance level
- It is the bulls' first attempt to break above the current trend channel
- Momentum indicators are mixed with a possible bearish divergence developing
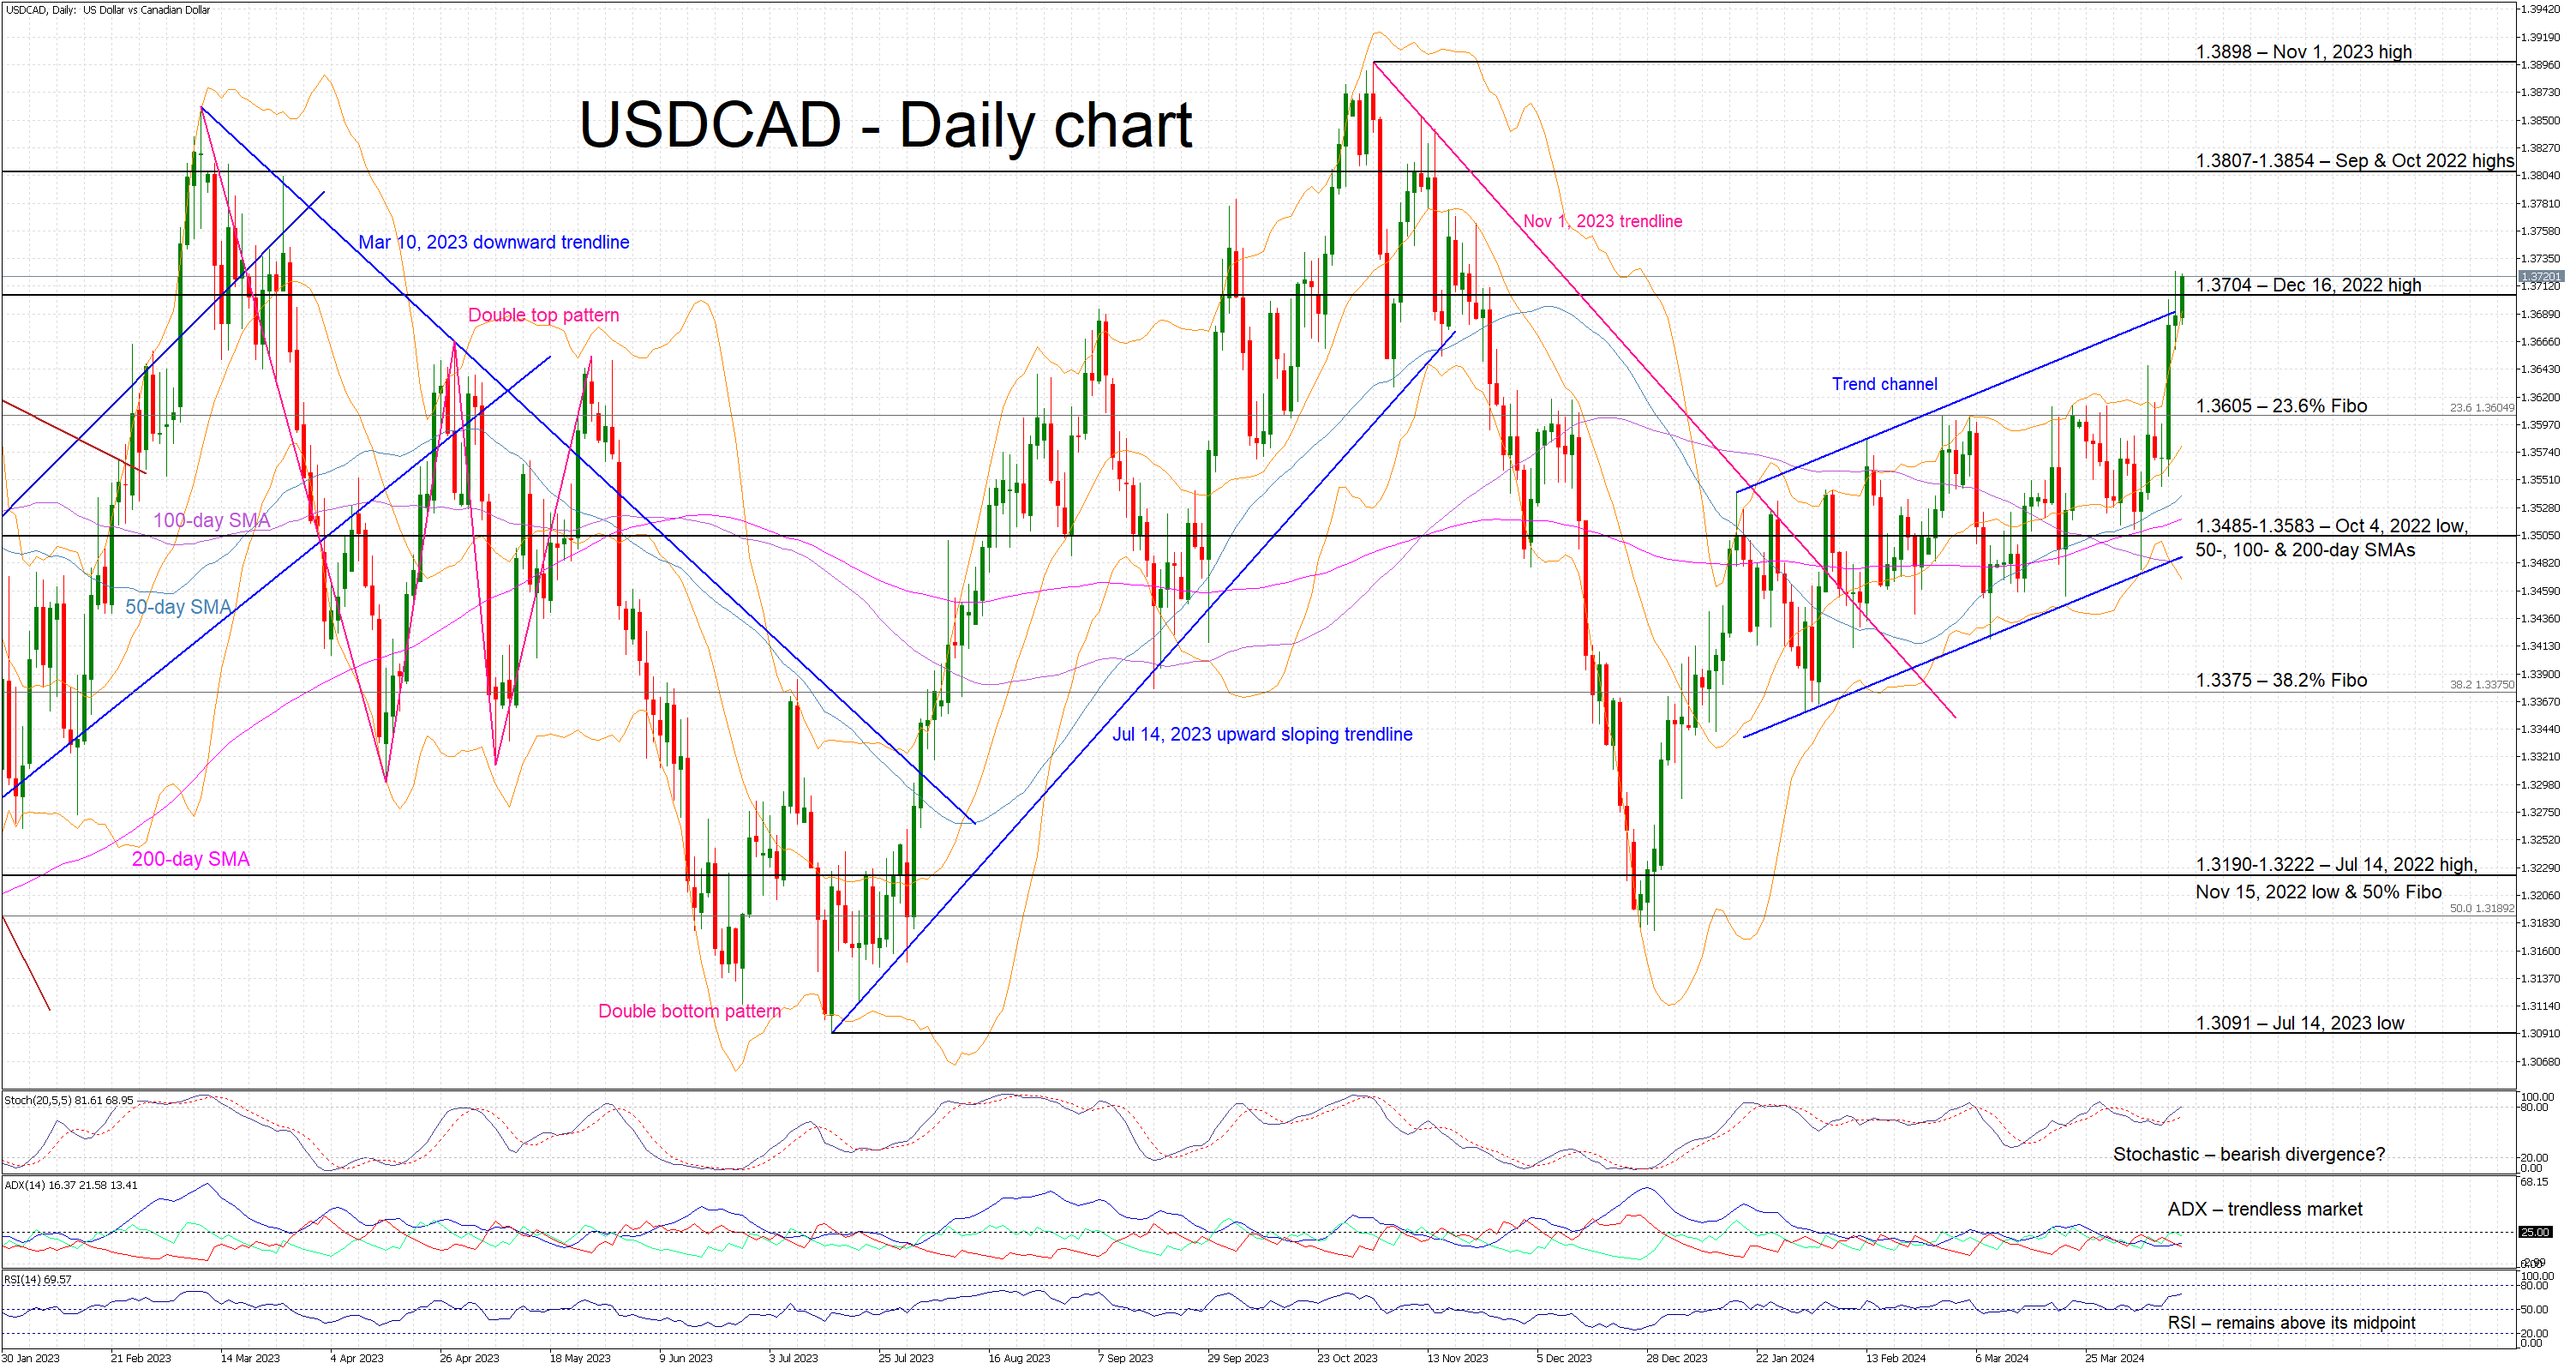
USDCAD is trading higher again today, recording its fourth consecutive green candle and reaching a new 5-month high. USDCAD is trying to break decisively above the upward sloping trend channel that has been in place since the start of 2024 and it is now testing the resistance set at the 1.3704 level.
Momentum indicators are mostly mixed as only the RSI is sending a strong bullish signal. The Average Directional Movement Index (ADX) is uninterested in the current movement as it remains stuck below its 25-threshold. More importantly, the stochastic oscillator is edging higher towards its overbought territory, but a divergence is gradually developing. The higher high recorded in USDCAD is matched with a lower high in the stochastic oscillator and thus opening the door to a bearish divergence.
Should the bulls remain in control of the market, they could try to keep USDCAD above the December 16, 2022 high at 1.3704 and have a go at staging a rally towards the 1.3807-1.3854 area. If successful, they could then have the chance to test the resistance set by the 2023 high at 1.3898.
On the flip side, the bears are trying to stop the current advance. They could firstly try to push USDCAD back inside the trend channel and then attempt a sell-off towards the 23.6% Fibonacci retracement of the April 5, 2022 – October 13, 2022 uptrend at 1.3605 level.
To sum up, USDCAD bulls are trying to take advantage of the current dollar-positive market momentum, but they need a strong move higher in order to establish their dominance in this pair and record another 2024 high.
GBP/JPY Daily Outlook
Daily Pivots: (S1) 191.80; (P) 192.19; (R1) 192.81; More.....
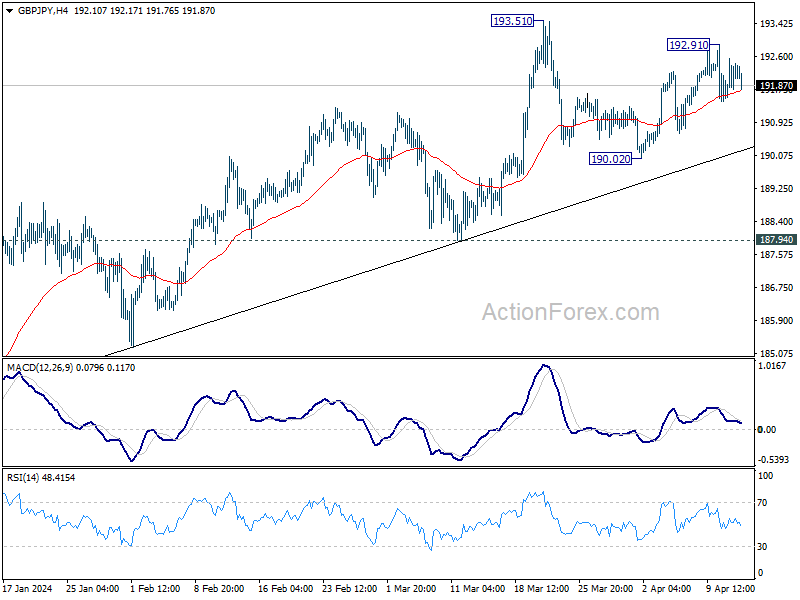
Intraday bias in GBP/JPY remains neutral and outlook is unchanged. Consolidation from 193.51 is extending but further rally is expected as long as 190.02 support holds. On the upside, break of 193.51 will resume larger up trend to 195.86 long term resistance. On the downside, though, break of 190.02 will turn bias to the downside for 187.94 support instead.
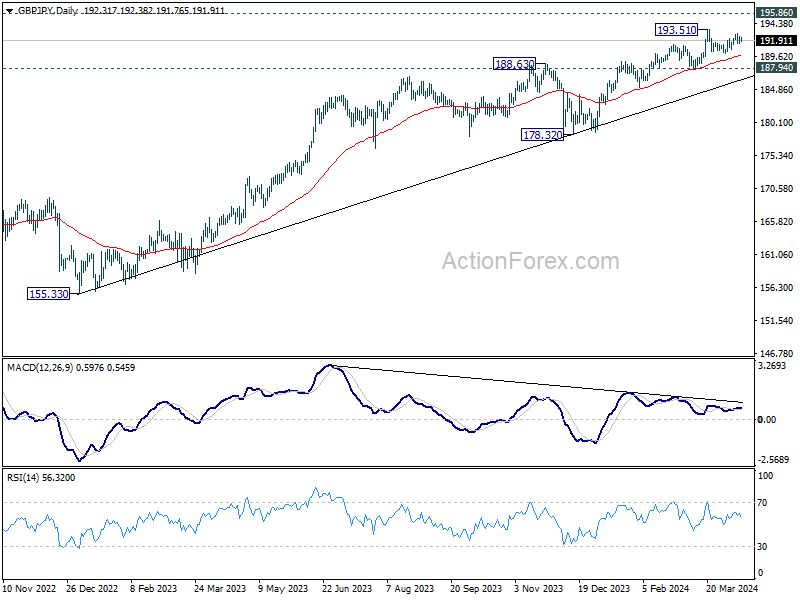
In the bigger picture, current rally is part of the up trend from 123.94 (2020 low), and is in progress for 195.86 long term resistance (2015 high). Break of 187.94 support is needed to be the first sign of medium term topping. Otherwise, outlook will remain bullish in case of retreat.
EUR/JPY Daily Outlook
Daily Pivots: (S1) 164.00; (P) 164.35; (R1) 164.75; More...
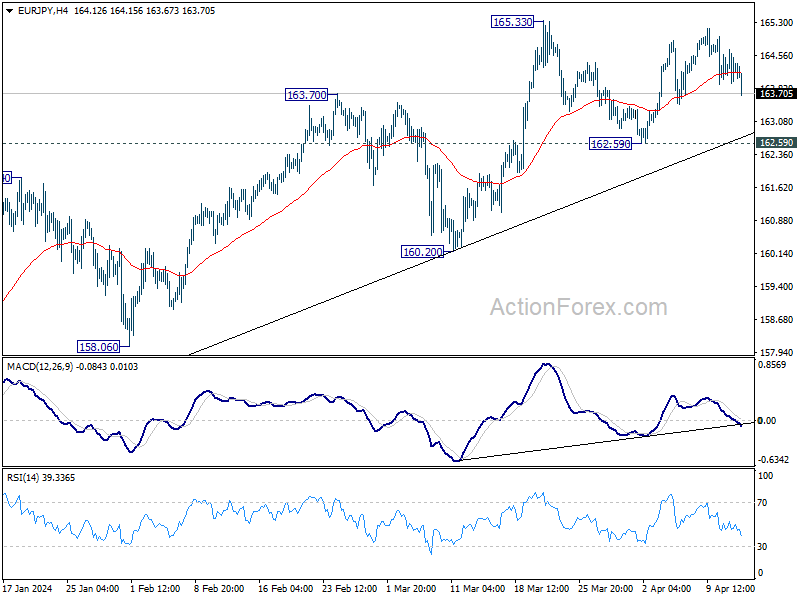
Intraday bias in EUR/JPY remains neutral as consolidation from 165.33 is extending. But outlook stays bullish as long as 162.59 support holds. On the upside, firm break of 165.33 will resume larger up trend towards 169.96 key resistance next. On the downside, though, break of 162.59 will turn bias to the downside for 160.20 support next.
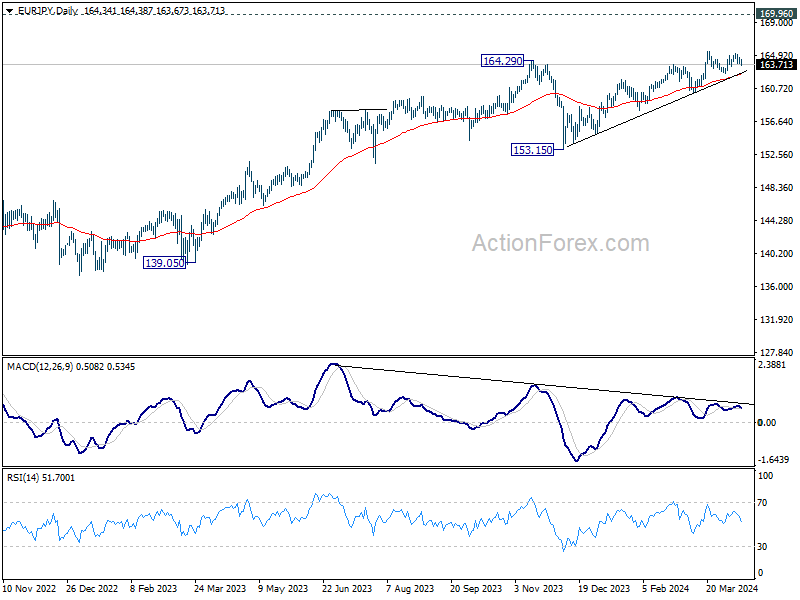
In the bigger picture, current rally is part of the up trend from 114.42 (2020 low), which is still in progress. Next target is 169.96 (2008 high). Break of 160.20 support is needed to be the first sign of medium term topping. Otherwise, outlook will stay bullish in case of retreat.
EUR/GBP Daily Outlook
Daily Pivots: (S1) 0.8531; (P) 0.8555; (R1) 0.8569; More...
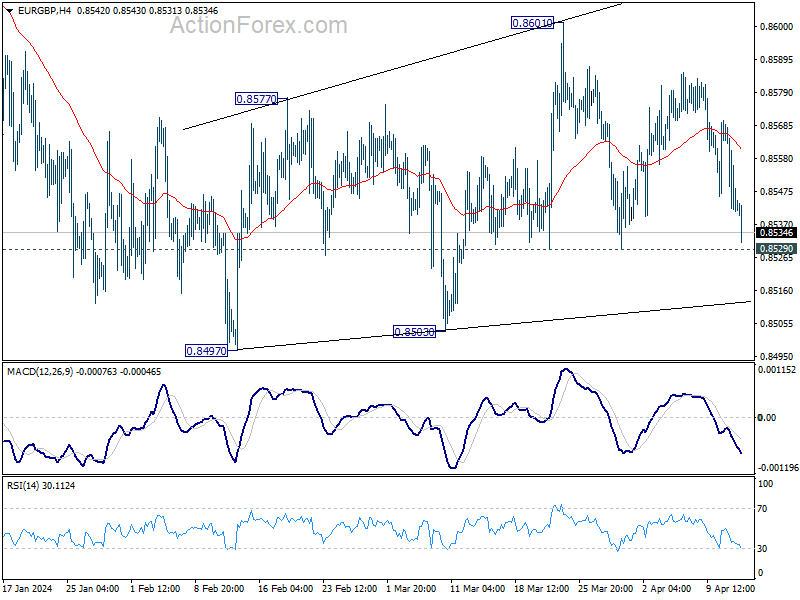
Immediate focus is now on 0.8529 support in EUR/GBP with current decline. Decisive break there argue that the corrective recovery from 0.8497 has completed at 0.8601. Intraday bias will be back on the downside for retesting 0.8497 low next. On the upside, break of 0.8601 will resume the rebound instead.
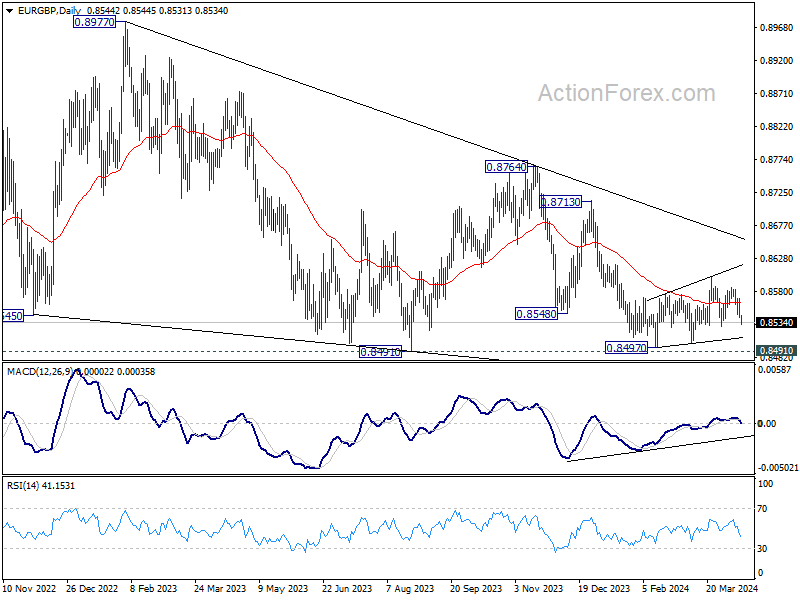
In the bigger picture, there is no clear sign that down trend from 0.9267 has completed, despite loss of downside momentum as seen in D MACD. As long as 0.8713 resistance holds, the down trend will remain in favor to resume through 0.8491 low at la later stage.
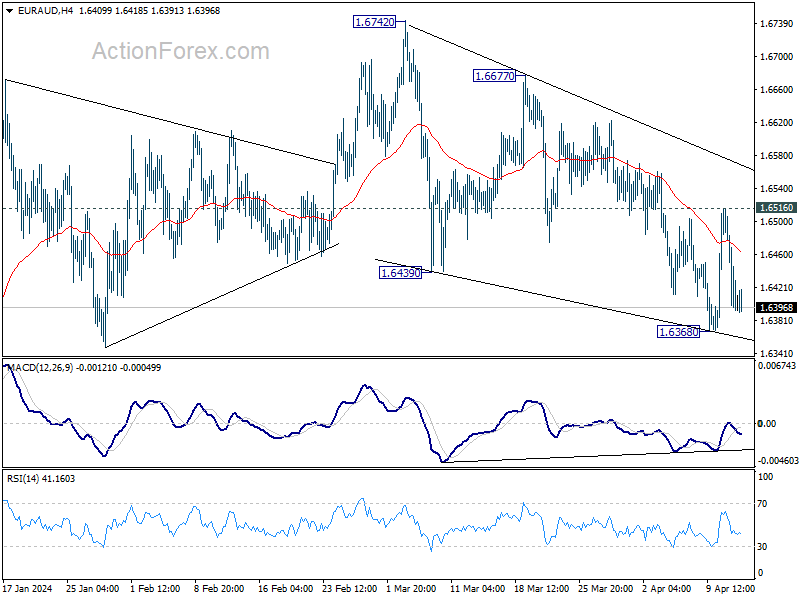
EUR/AUD Daily Outlook
Daily Pivots: (S1) 1.6361; (P) 1.6440; (R1) 1.6484; More...
Intraday bias in EUR/AUD remains neutral at this point. On the downside, below 1.6368 will resume the fall from 1.6742 towards 1.6127 low. Nevertheless, break of 1.6516 will turn bias back to the upside for stronger rebound.
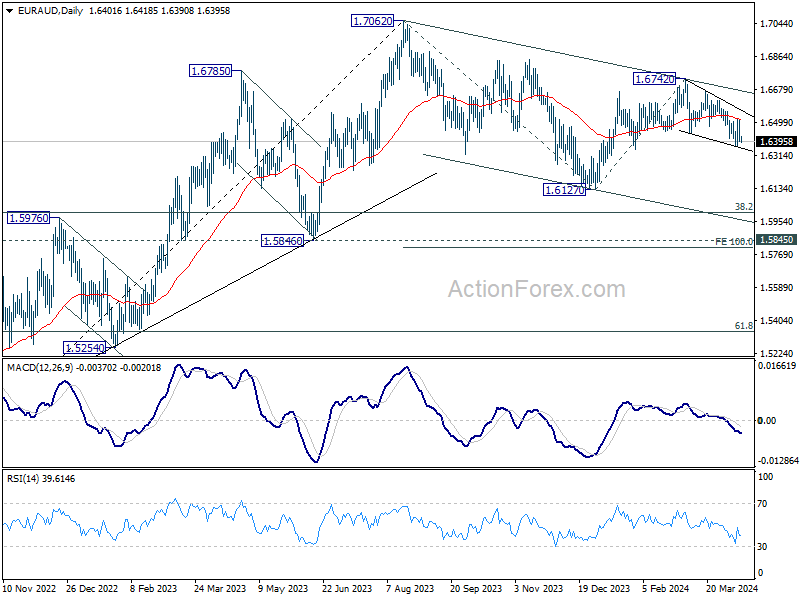
In the bigger picture, fall from 1.7062 medium term top is seen as a correction to the up trend from 1.4281 (2022 low). The correction is still in progress with fall from 1.6742 as the third leg. Strong support is expected around 1.5846 and 38.2% retracement of 1.4281 to 1.7062 at 1.6000 to bring rebound.
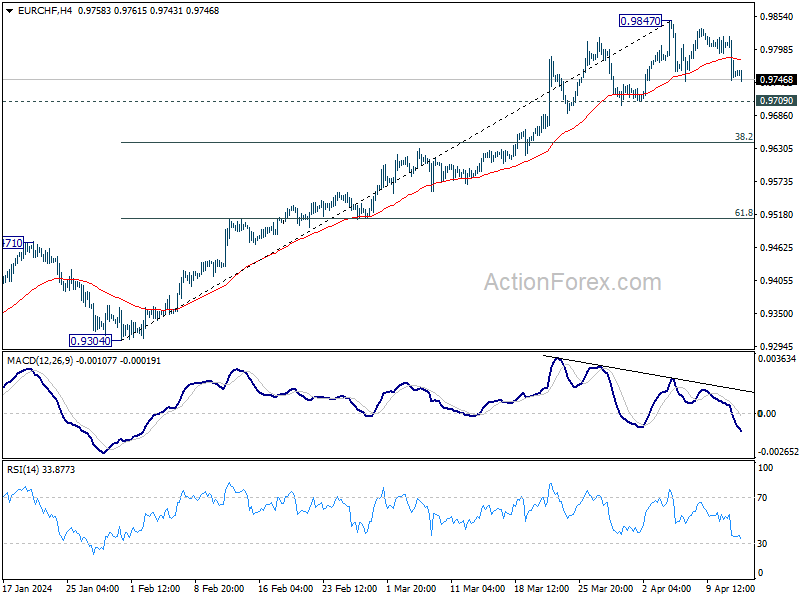
EUR/CHF Daily Outlook
Daily Pivots: (S1) 0.9732; (P) 0.9776; (R1) 0.9805; More...
Intraday bias in EUR/CHF remains neutral as consolidation from 0.9847 is still extending. Near term outlook will remain bullish as long as 0.9709 support holds. Break of 0.9847 will resume larger rise from 0.9252. However, considering bearish divergence condition in 4H MACD, break of 0.9709 will confirm short term topping, and turn bias back to the downside for deeper pullback.
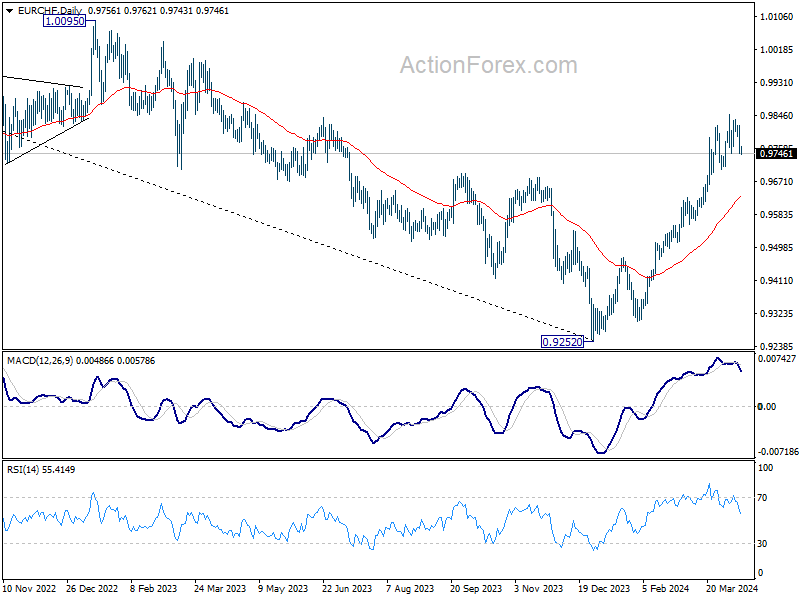
In the bigger picture, a medium term bottom should be in place at 0.9252 already, on bullish convergence condition in W MACD. Rise from there would now target 38.2% retracement of 1.2004 (2018 high) to 0.9252 (2023 low) at 1.0303, even as a correction to the down trend from 1.2004. This will remain the favored case as long as 55 D EMA (now at 0.9625) holds.
Dollar Holds Better Cards Against Both Euro and Pound
Markets
The ECB laid the groundwork for a June rate cut yesterday and that was basically all there was to say about it. Lagarde revealed some wanted to cut rates already and reports afterwards wrote about a handful of officials that needed extra convincing to rally behind the decision to stand pat for a little while longer. European yields erased a kneejerk move lower with markets expecting a June move for some time now. Changes in the swap curve ranged between +1.1 and 4.8 bps with a higher open accounting for most of the gains. US Treasury yields from the 5y tenor on wiped out earlier losses and moved to fresh YtD highs, adding 2.7-5.7 bps. A mediocre $22bn 30y auction with a slight tail and weaker bidding metrics had little market impact. The front end hovered sideways near the recent highs. The 2y could resist an intraday test of the 5% level after another solid reading of weekly jobless claims though. The US dollar maintained the upper hand against an overall weak euro. EUR/USD dropped to 1.0699 before paring losses to 1.0726. USD/JPY eked out another 34y-high of 153.27. Sterling licked its wounds after Wednesday’s sell-off against USD. GBP/USD fights to keep the 1.25 support zone alive. EUR/GBP slipped though, with all of the steady April “gains” now wiped out. BoE policymaker Greene hit the wires often these past few days. She voted to keep rates steady in recent meetings and her comments suggest she’ll continue to do so for some time to come. Greene said she is still far off backing rate reductions with wage growth and the risk of inflation persistence still too high. She sided with her hawkish colleagues Haskel and Mann in that markets have been too optimistic in their rates pricing. UK money markets have adjusted their thinking in recent days to just 50 bps of cuts this year though.
We’ll get some more views of central bankers today and they could spark some intraday movement. Speeches by Schmid (Kansas City) and Bostic (Atlanta) are worth the attention after the recent string of stellar US data. Collins (Boston) performs as well but gave some flavour yesterday already. She noted current policy may be less restrictive than expected and less easing this year than thought earlier may be warranted. Collins is part of the neutral camp and its interesting to see this side adopts a more hawkish view. The first ECB speakers after the meeting just came in as well, with Kazaks typically pioneering. He just stated that barring surprises there will be a cut in June and said that if inflation continues to fall, the ECB can continue doing so. Turning to markets, we’ll look for a technically significant weekly close in US yields above the recently conquered resistance levels (eg. 4.54% in the 10y). Some more hawkish Fed speeches could prompt another test of the 5% by the 2y but a clean break ahead of the weekend is unlikely. The dollar holds the better cards against both the euro and the pound. EUR/USD is nearing the 1.07 pivot again and GBP/USD holds close to 1.25 this morning. Which will break first?
News & Views
The Bank of Korea held its policy rate stable at 3.5% for a 10th consecutive time. Economic growth is forecast to prolong its improving trend and (core) inflation to continue its slowing trend. The latter still remains high though and there are high uncertainties regarding monetary policies in major countries, FX volatility, and geopolitics. It is premature to be confident that inflation will converge to target given this high degree of uncertainty. The Board will maintain a restrictive monetary policy stance for a “sufficient” period of time until such confidence is established. The previous statement referred to a “sufficiently long” period. BoK governor Rhee ruled out a policy rate cut in H1 2024 but added that all entire board members believe that such move can’t be ruled out in H2 2024 in the case that CPI slows to 2.3% at the end of this year as forecast. KRW weakness this morning adds to USD strength earlier this week. USD/KRW surged from levels around 1350 on Wednesday to 1375 currently, the highest since November 2022.
Gas prices spiked by 7.5% yesterday after Russian attacks on two Ukrainian underground gas storage facilities. Russia targeted similar facilities in earlier strikes. Although still operating, it highlights potential risks for storing gas should Europe’s stockpiles become full. Ukraine has more storage capacity than any other European nation. The benchmark European gas future (Dutch TTF) rose to €30/MWh, matching the highest level since early February.
Cliff Notes: Expectations Tested
Key insights from the week that was.
In Australia, the latest update on Westpac-MI Consumer Sentiment was somewhat discouraging. February’s gain, initially viewed as a tentative sign of a recovery in confidence, has largely reversed over March and April, the headline index declining 1.8% then 2.4% to 82.4 in April, just above the average of the six months to January (81.0). Australian consumers are experiencing one of the most drawn-out cycles of deep pessimism in the past fifty years, second only, since the survey began in the 70s, to the sharp economic recession of the early 1990s.
The component detail highlighted households’ ongoing concerns around cost of living and the inflation outlook; views on the 5-year economic outlook and ‘time to buy a major household item’ were down sharply in April (–4.4% and –6.6%). Though views on family finances improved at margin this month, they remain very weak. The upcoming Stage 3 tax cuts will benefit, but consumers are unconvinced of any near-term relief with respect to monetary policy – mortgage rate expectations lifted slightly in April.
In this week’s essay, Chief Economist Luci Ellis explores the broader implications of cross-country policy divergence, taking into consideration both monetary and fiscal policy.
Other data updates received this week continued to reinforce recent trends. The latest NAB business survey reported a modest fall in business conditions (–1pt to +9), continuing the downtrend from well above average levels in 2022 to a little below the 10-year average currently. Having experienced a decline in forward orders in 10 of the past 12 months, businesses are cautious over the outlook, with confidence around average levels (+1pt to +1). Encouragingly for inflation, the survey continues to report moderating labour cost and price pressures, now at their lowest levels in around two years. As is the case for consumers, any sustained lift in conditions and confidence is unlikely to be achieved until both the upcoming tax cuts and the beginning of the easing cycle works its way through the economy.
Finally, housing finance approvals posted a slight increase in February (+1.5%), the gains tilted slightly more to owner-occupiers (+1.6%) than investors (+1.2%). Of note, revisions to the monthly profile trimmed the cumulative decline over November to January from –7.9% to –3.4%, making approvals recent performance look a little firmer than initially reported. That said, state outcomes have been generally flat to slightly negative over the past three months, albeit with wide tails – Victoria (–4.8%qtr) and WA (+5.3%qtr).
In the US, the March CPI surprised to the upside, rising 0.4%mth and 3.5%yr. Most of the upward pressure was outside the direct control of policy – energy contributed positively for the first time since February 2023, and the continuing surge in motor vehicle insurance premiums saw transport costs jump. The shelter component also continued to give outsized support to aggregate inflation, both because of its extreme weight and as shelter inflation continues to moderate slowly from its historic highs. Excluding shelter, annual CPI inflation has averaged 1.7%yr the past 11 months, with all annual outcomes over the period between 1.0%yr and 2.3%yr. Note, these outcomes include supercore services’ strength – the current concern of the market. On the broader CPI ex-shelter view, the FOMC have achieved their aim and are positioned to increasingly focus on the downside risks evident in the business surveys regarding employment and investment.
The minutes of the FOMC's March meeting showed the Committee is making this transition, though at this stage still have meaningful lingering concerns over inflation. The pace at which these fade will be determined by the strength of consumer demand and nonfarm payrolls.
In Europe, the European Central Bank remained on hold but opened the door for a first rate cut in June. An addition to the opening statement set the foundation noting, "If the Governing Council’s updated assessment of the inflation outlook, the dynamics of underlying inflation and the strength of monetary policy transmission were to further increase its confidence that inflation is converging to the target in a sustained manner, it would be appropriate to reduce the current level of monetary policy restriction."
In the press conference there were references to easing underlying inflation, moderating wage growth and firms partly absorbing increases in labour costs. While progress in inflation has been seen, services inflation has remained sticky at around 4.0%, accounting for more than 70% of total inflation. The ECB's Bank Lending Survey meanwhile points to policy having a restrictive impact with business loan demand falling sharply and credit conditions tightening. Data in the lead up to the June meeting should give the ECB sufficient confidence to begin easing.
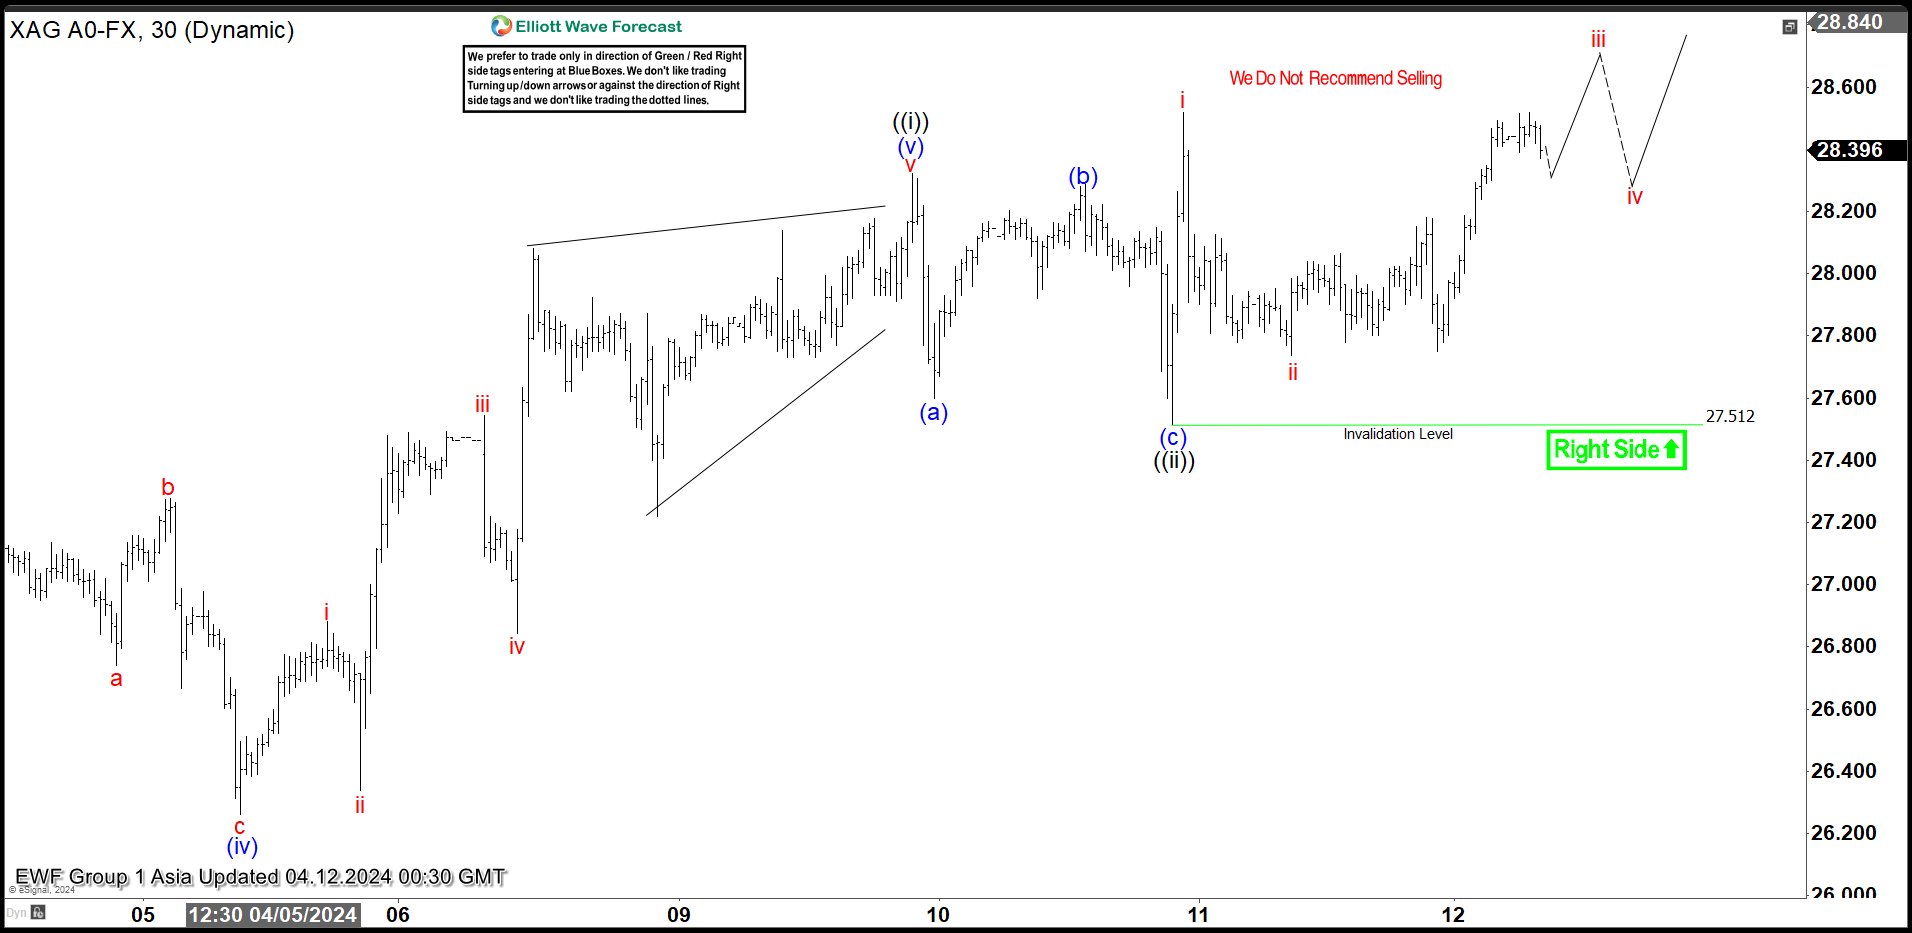
Silver (XAGUSD) Looking to Extend Higher in a Nest
Short term Elliott Wave view in Silver (XAGUSD) suggests that cycle from 3.27.2024 low is ongoing as a 5 waves impulse. Up from 3.27.2024 low, wave (i) ended at 25.38 and pullback in wave (ii) ended at 24.73. The metal extended higher in wave (iii) towards 27.33 and pullback in wave (iv) ended at 26.26. Final leg wave (v) ended at 28.32 which completed wave ((i)). Pullback in wave ((ii)) unfolded as a zigzag structure where wave (a) ended at 27.6. Wave (b) higher ended at 28.28 and wave (c) lower ended at 27.51 which completed wave ((ii)).
The metal has turned higher in wave ((iii)). Up from wave ((ii)), wave i ended at 28.51 and pullback in wave ii ended at 27.73. Expect the metal to continue higher in wave iii, then it should pullback in wave iv before extending higher again in wave v to complete wave (i) of ((v)). Near term, as far as pivot at 27.5 low stays intact, expect pullback to find support in 3, 7, or 11 swing for further upside.
Silver (XAGUSD) 30 Minutes Elliott Wave Chart
XAGUSD Elliott Wave Video
https://www.youtube.com/watch?v=2YiXSZJfvbw
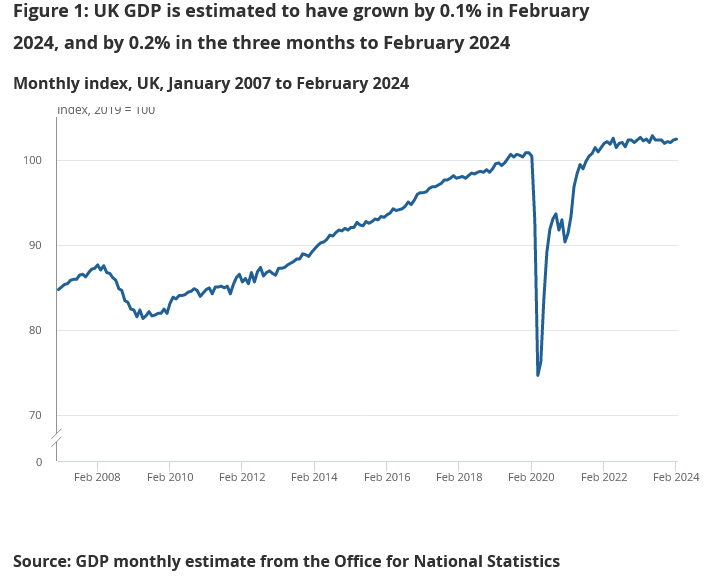
UK GDP rises 0.1% mom in Feb, led by production
UK GDP grew 0.1% mom in February, matched expectations. Services grew by 0.1% mom. Production output grew 1.1% mom, and was the largest contributor to growth in the month. Construction output fell -1.9% mom.
For the three months to February, compared with the three months to November 2023, GDP has grown 0.2%. Services rose 0.2%. Production grew 0.7%. Construction fell -1.0%.