
Sample Category Title
EUR/USD Mid-Day Outlook
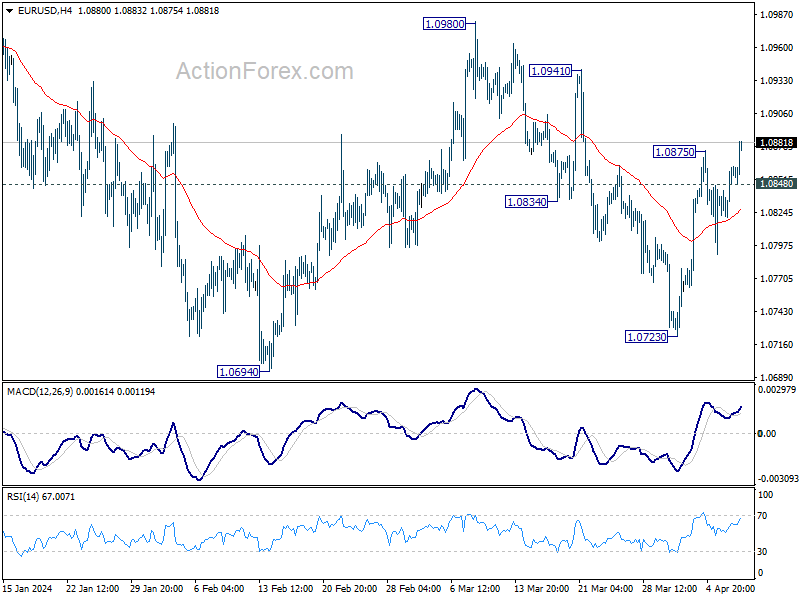
Daily Pivots: (S1) 1.0833; (P) 1.0847; (R1) 1.0874; More...
Intraday bias in EUR/USD is back on the upside with break of 1.0875 resistance. Rise from 1.0723 would now target 1.0941 resistance first. On the downside, though, below 1.0848 minor support will turn intraday bias neutral gain.
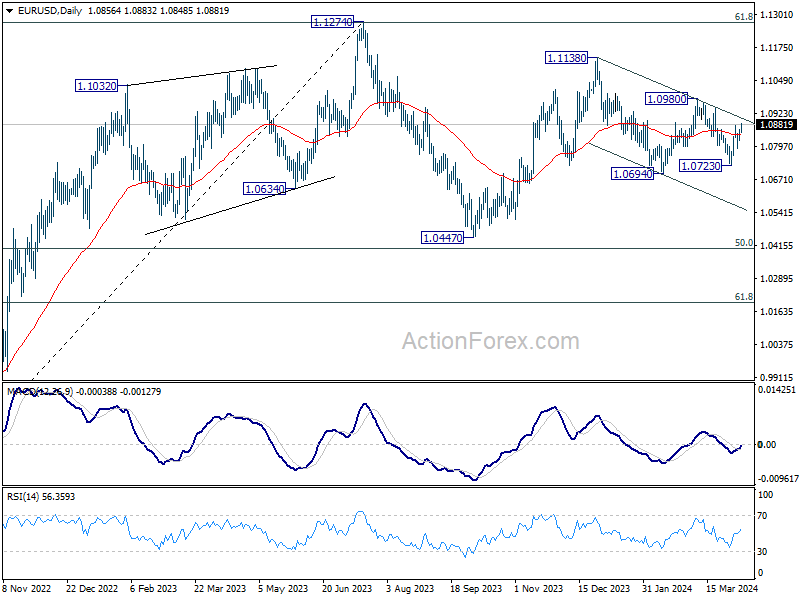
In the bigger picture, price actions from 1.1274 are viewed as a corrective pattern to rise from 0.9534 (2022 low). Rise from 1.0447 is seen as the second leg. While further rally could cannot be ruled out, upside should be limited by 1.1274 to bring the third leg of the pattern. Meanwhile, sustained break of 1.0694 support will argue that the third leg has already started for 1.0447 and possibly below.
GBP/USD Mid-Day Outlook
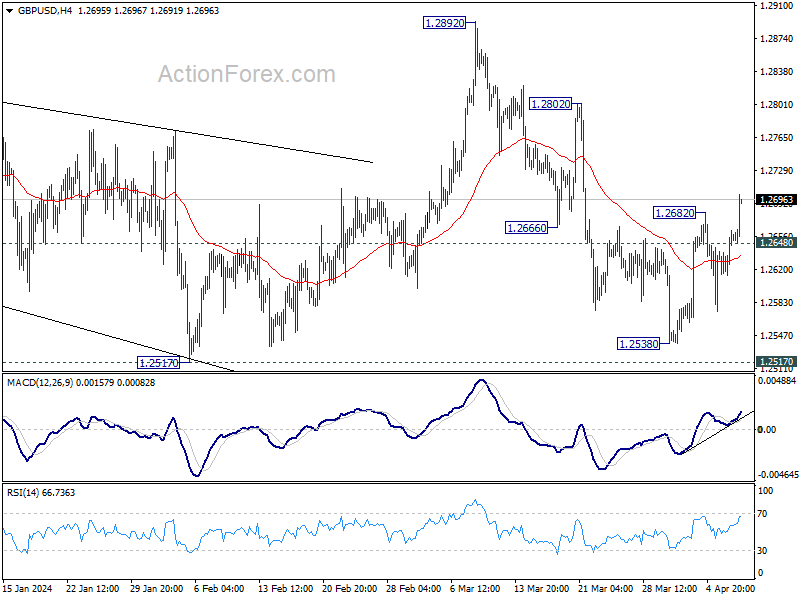
Daily Pivots: (S1) 1.2624; (P) 1.2644; (R1) 1.2675; More...
Intraday bias in GBP/USD is back on the upside with break of 1.2682. Rebound from 1.2538 would target 1.2802 resistance first. On the downside, though, below 1.2648 minor support will turn intraday bias neutral again.
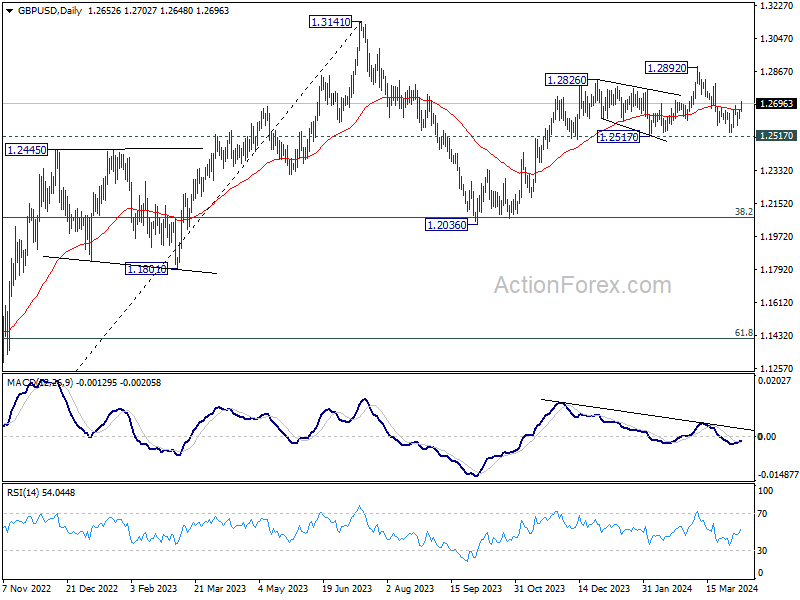
In the bigger picture, price actions from 1.3141 medium term top are seen as a corrective pattern to up trend from 1.0351 (2022 low). Rise from 1.2036 is seen as the second leg, which might still be in progress. But upside should be limited by 1.3141 to bring the third leg of the pattern. Meanwhile, break of 1.2517 support will argue that the third leg has already started for 38.2% retracement of 1.0351 (2022 low) to 1.3141 at 1.2075 again.
Dollar Declines Without Clear Cause: Strategic Positioning Before Inflation Data?
Dollar falls broadly today and stays weak as markets enter into US session. The underlying cause of this sell-off remains somewhat ambiguous, as there were no significant economic data releases to directly attribute the currency's selloff. The slight retreat in treasury yields, specifically the 10-year yield just gyrating between 4.35-4.40, appears insufficient to solely account for the Dollar's dip. Additionally, market sentiment does not clearly lean towards risk-on, evidenced by European indexes trading in the red while US futures saw marginal rises. This situation raises questions about whether traders are preemptively betting on the anticipated US CPI data set for release tomorrow.
Meanwhile, tomorrow's financial calendar is notably packed with major events that could potentially redefine market dynamics. Apart from US inflation data, RBNZ and BoC will announce rate decisions, and FOMC minutes are scheduled for release. This confluence of events suggests that the currency market is poised for significant volatility, with the prospects for a dramatic shift in positionings.
In terms of currency performance today, Dollar emerges as the biggest loser, trailed by Canadian Dollar and then Yen. On the other end of the spectrum, Kiwi stands out as the strongest, followed by Aussie and Sterling, while Euro and the Swiss Franc find themselves in middle positions.
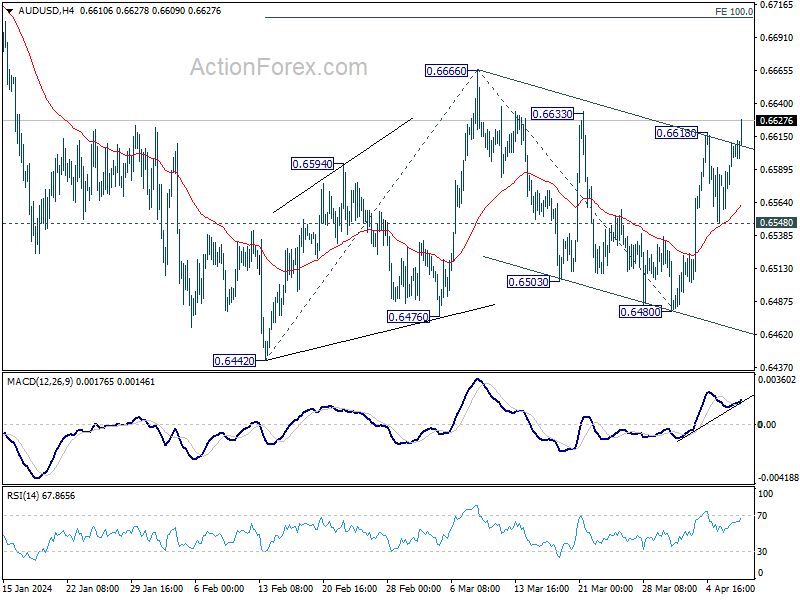
Technically, AUD/USD's break of 0.6618 resistance indicates resumption of the rebound from 0.6480. Also, the development affirms the case that rise from 0.6480 is the third leg of the pattern from 0.6442. Further rise should be seen to 0.6666 first. Firm break there will target 100% projection of 0.6442 to 0.6666 from 0.6480 at 0.6704 next.
In Europe, at the time of writing, FTSE is up 0.20%. DAX is down -0.51%. CAC is down -0.21%. UK 10-year yield is down -0.0476 at 4.037. Germany 10-year yield is down -0.042 at 2.397. Earlier in Asia, Nikkei rose 1.08%. Hong Kong HSI rose 0.57%. China Shanghai SSE rose 0.05%. Singapore Strait Times rose 0.67%. Japan 10-year JGB yield fell -0.0070 to 0.785.
BoJ's Ueda: Economic and price developments could trigger monetary stimulus reduction
Speaking to the parliament today, BoJ Governor Kazuo Ueda highlighted the possibility of future reduction in monetary stimulus, contingent on the alignment of economic and price conditions with current projections.
"If economic and price conditions move in line with our current projections, trend inflation will gradually accelerate. If so, we must consider reducing the degree of stimulus," he explained.
A significant point of consideration as outlined by Governor Ueda revolves around the outcomes of annual wage negotiations and their subsequent reflection in actual data. "We'll also check at each policy meeting whether rising wages will be reflected in services prices, he added.
NZ NZIER business confidence tumbles, high interest rates deepen pessimism
In Q1, New Zealand's business community signaled a stark downturn in confidence, with NZIER business confidence index plunging from -9.9 to -23.7 . This dramatic drop is accompanied by reversal in firms' trading activity expectations for the coming quarterly, from 6.6 to -11.5, as well as retrospective decline in past three months' trading activity from 6.7 to -23.2.
NZIER attributes this downturn to the effect of heightened interest rates, which appear to be fulfilling their role in tempering demand to alleviate inflationary pressures. Moreover, the looming uncertainty surrounding the new Government's fiscal strategies, particularly in terms of spending adjustments and cutbacks in the public sector, is exacerbating business caution.
Detailed further illuminates the current economic challenges, with a net 11% of firms having reduced their workforce in the March quarter, albeit with slightly positive hiring intentions moving forward. Investment intentions are also on the downturn, with a net 14% of businesses intending to cut back on plant and machinery investment, and a net 8% planning to curtail investment in buildings over the next year.
Australia Westpac consumer sentiment falls to 82.4, prolonged pessimism
Australia Westpac Consumer Sentiment Index marked a decrease of -2.4% mom to 82.4 in April. This downturn extends the index's streak below the neutral threshold of 100 to nearly two years, underscoring a prolonged period of consumer pessimism.
Westpac's analysis attributes the lack of recovery in consumer sentiment primarily to the ongoing inflationary pressures that have gripped Australia. Over the past three years, consumer prices have risen significantly, outpacing wage growth by six percentage points. This inflationary trend, coupled with the notable rise in interest rates and increased tax burdens, has significantly strained household incomes, subjecting them to prolonged financial duress.
As attention turns to RBA's next meeting in May, Westpac anticipates no change to the official cash rate. This forecast hinges significantly on the upcoming March quarter CPI update, due on April 24, which is expected to play a crucial role in shaping the RBA's stance.
Australia NAB business confidence rises to 1, cost pressures show slight relief
Australia NAB Business Confidence rose from 0 to 1 in March. Business Conditions fell from 10 to 9. Trading Conditions and employment conditions held steady at 15 and 6 respectively. But profitability conditions decline notably from 10 to 6.
Alan Oster, NAB's Chief Economist, pointed out the unusual situation where business conditions have been "a little above average" and confidence "a little below average" for an extended period. This, according to Oster, reflects a cautious outlook among firms regarding the future, even as the economy shows signs of resilience.
Further details from the report indicate a softening in cost pressures. Labor cost growth decelerated to 1.6% on quarterly equivalent basis, down from 2.0%. Purchase cost growth slowed to 1.4% from 1.8%. Additionally, there was a moderation in product price growth to 0.7% from 1.2%, with retail price growth slightly reducing to 1.3% from 1.4%. Despite these easing pressures, cost concerns remain high, with retail price growth still elevated.
Oster interprets these figures as being aligned with expectations that the journey towards inflation normalization will be "gradual". Q1 PI result later in April is expected to further reinforced this view.
GBP/USD Mid-Day Outlook
Daily Pivots: (S1) 1.2624; (P) 1.2644; (R1) 1.2675; More...
Intraday bias in GBP/USD is back on the upside with break of 1.2682. Rebound from 1.2538 would target 1.2802 resistance first. On the downside, though, below 1.2648 minor support will turn intraday bias neutral again.
In the bigger picture, price actions from 1.3141 medium term top are seen as a corrective pattern to up trend from 1.0351 (2022 low). Rise from 1.2036 is seen as the second leg, which might still be in progress. But upside should be limited by 1.3141 to bring the third leg of the pattern. Meanwhile, break of 1.2517 support will argue that the third leg has already started for 38.2% retracement of 1.0351 (2022 low) to 1.3141 at 1.2075 again.
Economic Indicators Update
| GMT | Ccy | Events | Actual | Forecast | Previous | Revised |
|---|---|---|---|---|---|---|
| 22:00 | NZD | NZIER Business Confidence Q1 | -25 | -2 | ||
| 23:01 | GBP | BRC Like-For-Like Retail Sales Y/Y Mar | 3.20% | 1.80% | 1.00% | |
| 00:30 | AUD | Westpac Consumer Confidence Apr | -2.40% | -1.80% | ||
| 01:30 | AUD | NAB Business Confidence Mar | 1 | 0 | ||
| 01:30 | AUD | NAB Business Conditions Mar | 9 | 10 | ||
| 05:00 | JPY | Consumer Confidence Mar | 39.5 | 39.7 | 39.1 | |
| 06:00 | JPY | Machine Tool Orders Y/Y Mar P | -3.80% | -8.00% | ||
| 06:45 | EUR | France Trade Balance (EUR) Feb | -5.2B | -7.0B | -7.4B | -7.2B |
| 10:00 | USD | NFIB Business Optimism Index Mar | 88.5 | 90.2 | 89.4 |
Australian Dollar Extends Gains Despite Soft Confidence Data
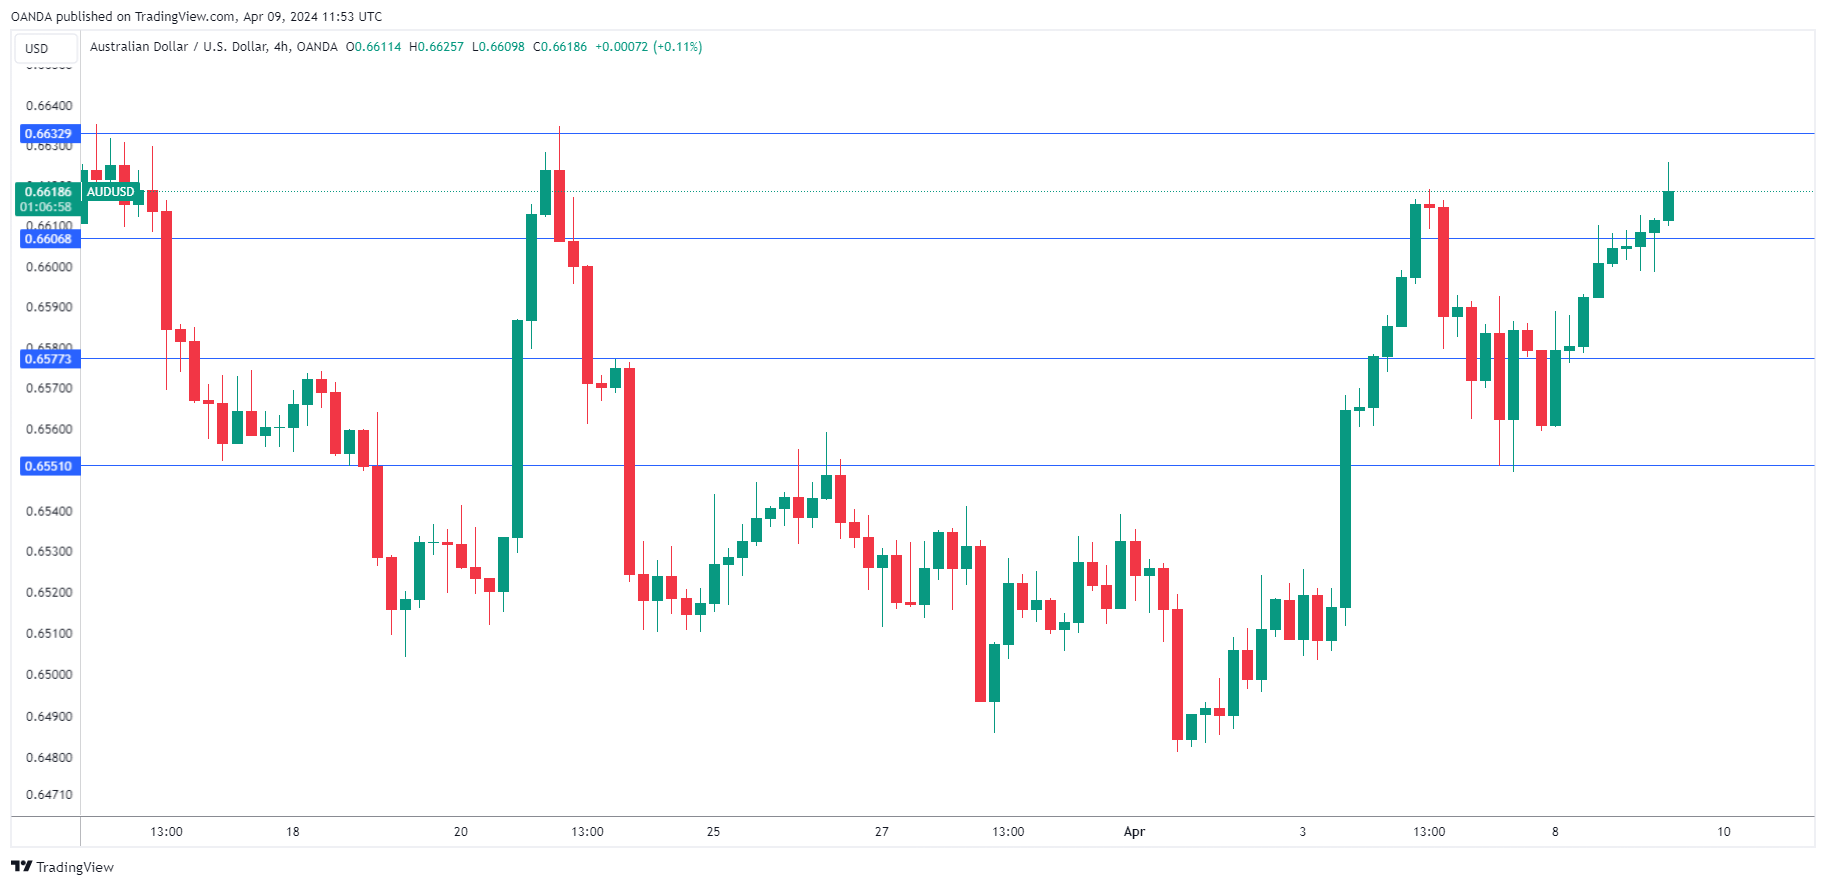
The Australian dollar is in positive territory on Tuesday. In the European session, AUD/USD is trading at 0.6620, up 0.25%.
Consumer confidence sags
Australian consumers have been pessimistic about the economy and their mood soured even more in April. The Westpac consumer confidence index fell 2.4% to 82.4, well below the 100 line which separates pessimism from optimism. This missed the market estimate of a 0.5% gain. Consumers continue to feel squeezed by stubborn inflation and high interest rates and are not confident that the Reserve Bank of Australia will lower rates anytime soon.
The business sector isn’t showing much confidence either, as the National Australia Bank business confidence index rose from 0 to +1 index point in March, which is below average. This was better than expected, as the markets expected a 3-point decline. The silver lining was business conditions, which dropped 1 point to +9 index points in March, which still remains above average.
Australia’s economy is struggling, but the RBA is in no rush to lower rates as inflation has been persistently high and the current rate of 3.4% is above the target band of 2-3%. Core inflation remains stickier, as the trimmed mean rose in February from 3.8% to 3.9%.
RBA policy makers are concerned that inflation could rise if they lower rates too soon. As well, a rate cut would have more impact on the economy if the Federal Reserve were to lower rates first. The RBA meets next in May but the markets aren’t expecting an initial rate cut before September at the earliest.
AUD/USD Technical
- AUD/USD tested resistance at 0.6606 earlier. Above, there is resistance at 0.6632
- 0.6577 and 0.6551 are providing support
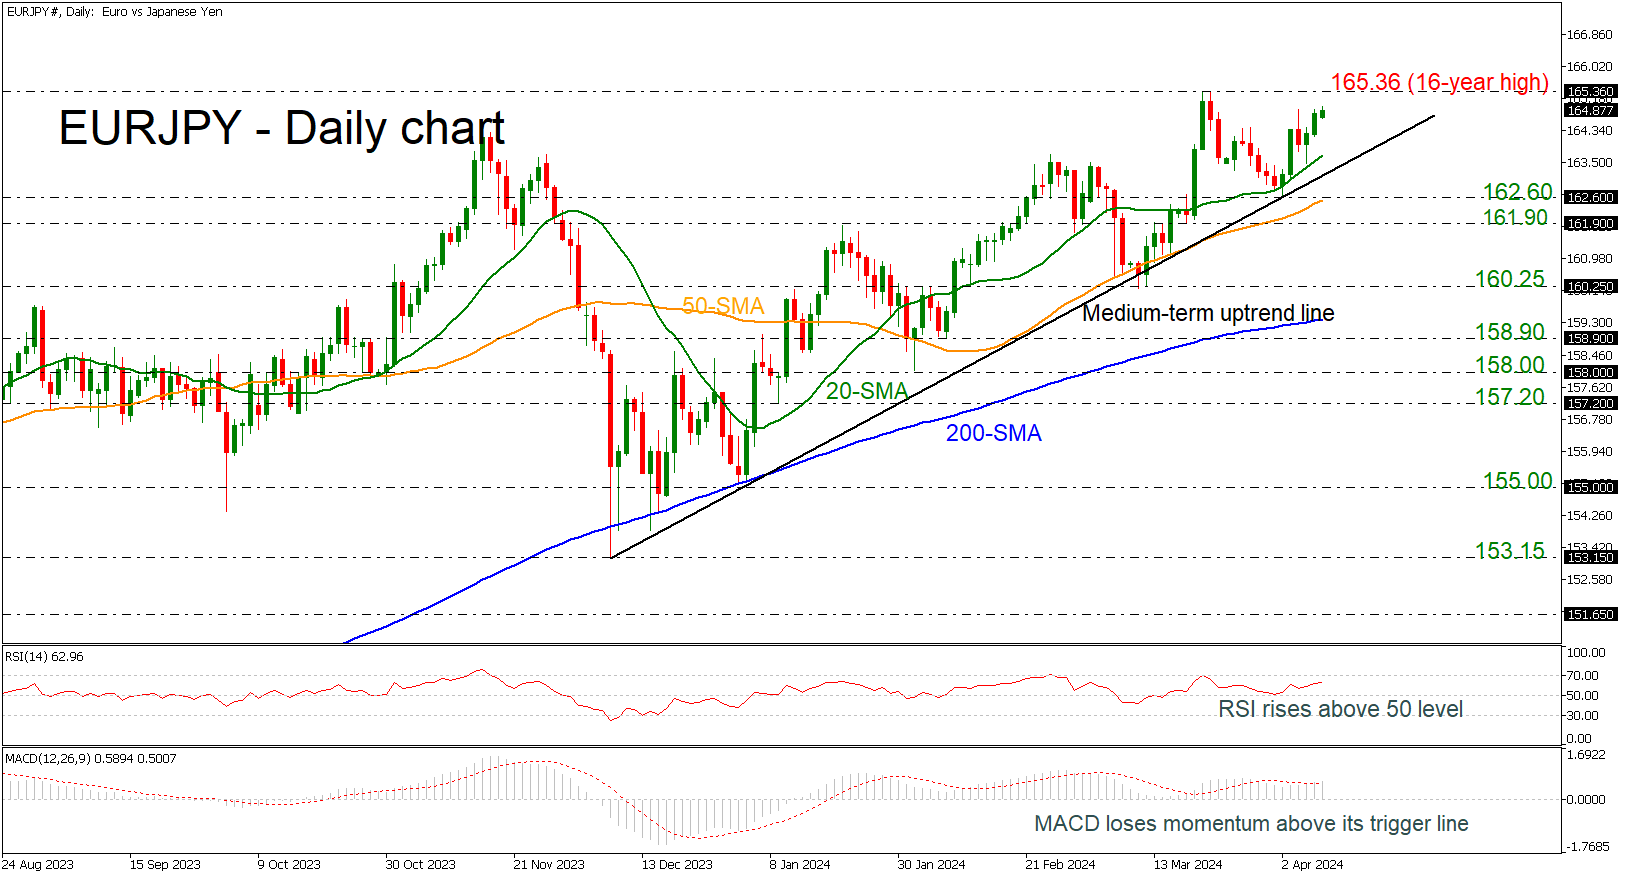
EURJPY Rises Towards 16-Year High
- EURJPY rebounds off uptrend line
- Price holds above SMAs
- Oscillators indicate more bullish movements
EURJPY is climbing higher after the turning point near the medium-term ascending trend line and is moving towards the 16-year high of 165.36. The market has been developing within an uptrend since December 7 with the technical oscillators confirming an upside tendency. The RSI is moving higher above the neutral threshold of 50, while the MACD is crossing above its trigger line.
Should the pair manage to strengthen its positive momentum, the next resistance could come around 165.36. A break above it would shift the bias to a more bullish one and open the way towards the next psychological numbers of 166.00, 167.00 and 168.00 until the price meets the July 2007 peak of just under 169.00.
However, if prices are unable to break higher, the risk would shift to the downside, with the 20-day simple moving average (SMA) at 163.70 coming into focus, as well as the uptrend line at 163.20. A drop lower would signal a downside retracement until the 50-day SMA, which overlaps with the 162.60 support and the 161.90 barrier underneath.
In a nutshell, EURJPY is looking bullish in the short- and medium-term timeframes, but a decline beneath the 200-day SMA at 159.40 could switch the bias to bearish.
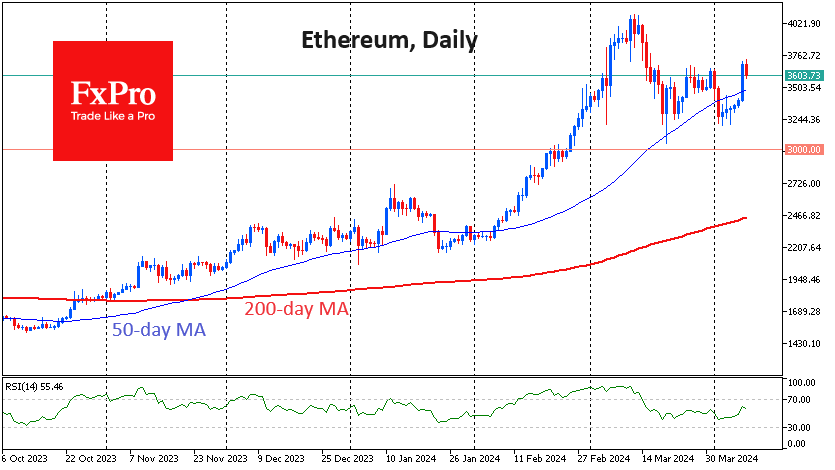
Bitcoin Proves That It is Bull Market Now
Market Picture
The cryptocurrency market added 2.2% in 24 hours to $2.66 trillion, with heavy buying in “older” altcoins. The Cryptocurrency Fear and Greed Index climbed to 80 – extreme greed – the highest since 27 March.
Bitcoin added over 5% during the day on Monday, rising to $72.8K at its peak, about 1k below its all-time high. The ease of gains was another reminder that this is a bull market for cryptocurrencies. The corrective pullback from the March highs gave bitcoin a needed respite, allowing for further upward movement.
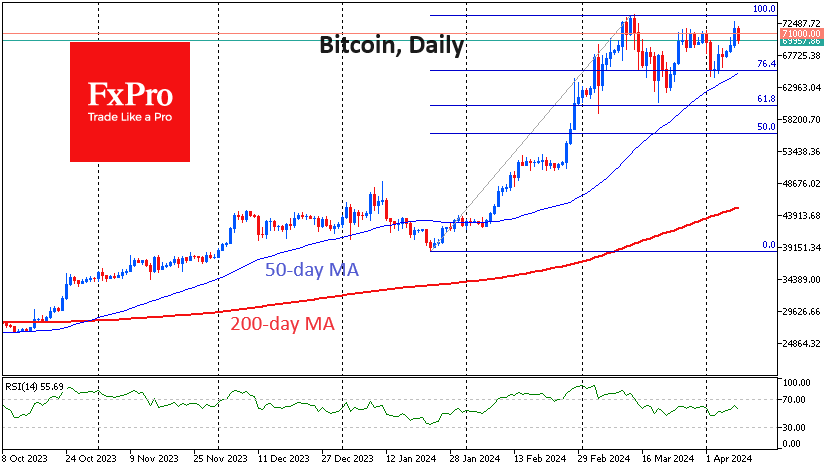
Ethereum rallied throughout Monday, adding about 10% and surpassing $3700, its highest since March 15. There has been a pullback since Tuesday morning, but it looks more like an attempt to take profits after six consecutive days of gains than the start of a decline. Technically, the bullish signal in ETHUSD’s rise is a sharp move above the 50-day moving average on Monday. An equally strong downside momentum would be required to reverse the positive scenario.
According to CoinShares, crypto fund investments rose by $646 million last week after inflows of $862 million a week earlier. Bitcoin investments were up $663 million, Solana was up $4 million, Litecoin was up $4.4 million, and Ethereum was down $23 million. Signs of the hype around ETFs are waning. Trading volume last week fell to $17.4bn for the week, down from $43bn in the first week of March, CoinShares noted.
News background
The inflow of funds into spot bitcoin ETFs is likely to continue until the halving, Sentiment expects but does not venture to predict investor behaviour after the event.
Cryptocurrency market capitalisation will double to over $5 trillion in 2024, according to Ripple CEO Brad Garlinghouse. He said he is “very optimistic” about the emergence of spot bitcoin-ETFs in the US, which are “bringing real institutional money to the table for the first time”.
Cardano blockchain co-founder Charles Hoskinson revealed two major updates, one of which is due in 2024. He said the Chang hardfork is scheduled for the second quarter, which will be the largest upgrade since the launch of Vasil in September 2022.
Solana developers are looking for solutions to combat network congestion, but that will take time, Solana Labs co-founder Anatoly Yakovenko said. The blockchain has faced a spate of failed transactions in recent weeks due to the meme-token boom and a significant increase in DEX trading volumes in the ecosystem.
Users have discovered several adverts used to steal cryptocurrencies on the Ethereum Etherscan blockchain browser website.
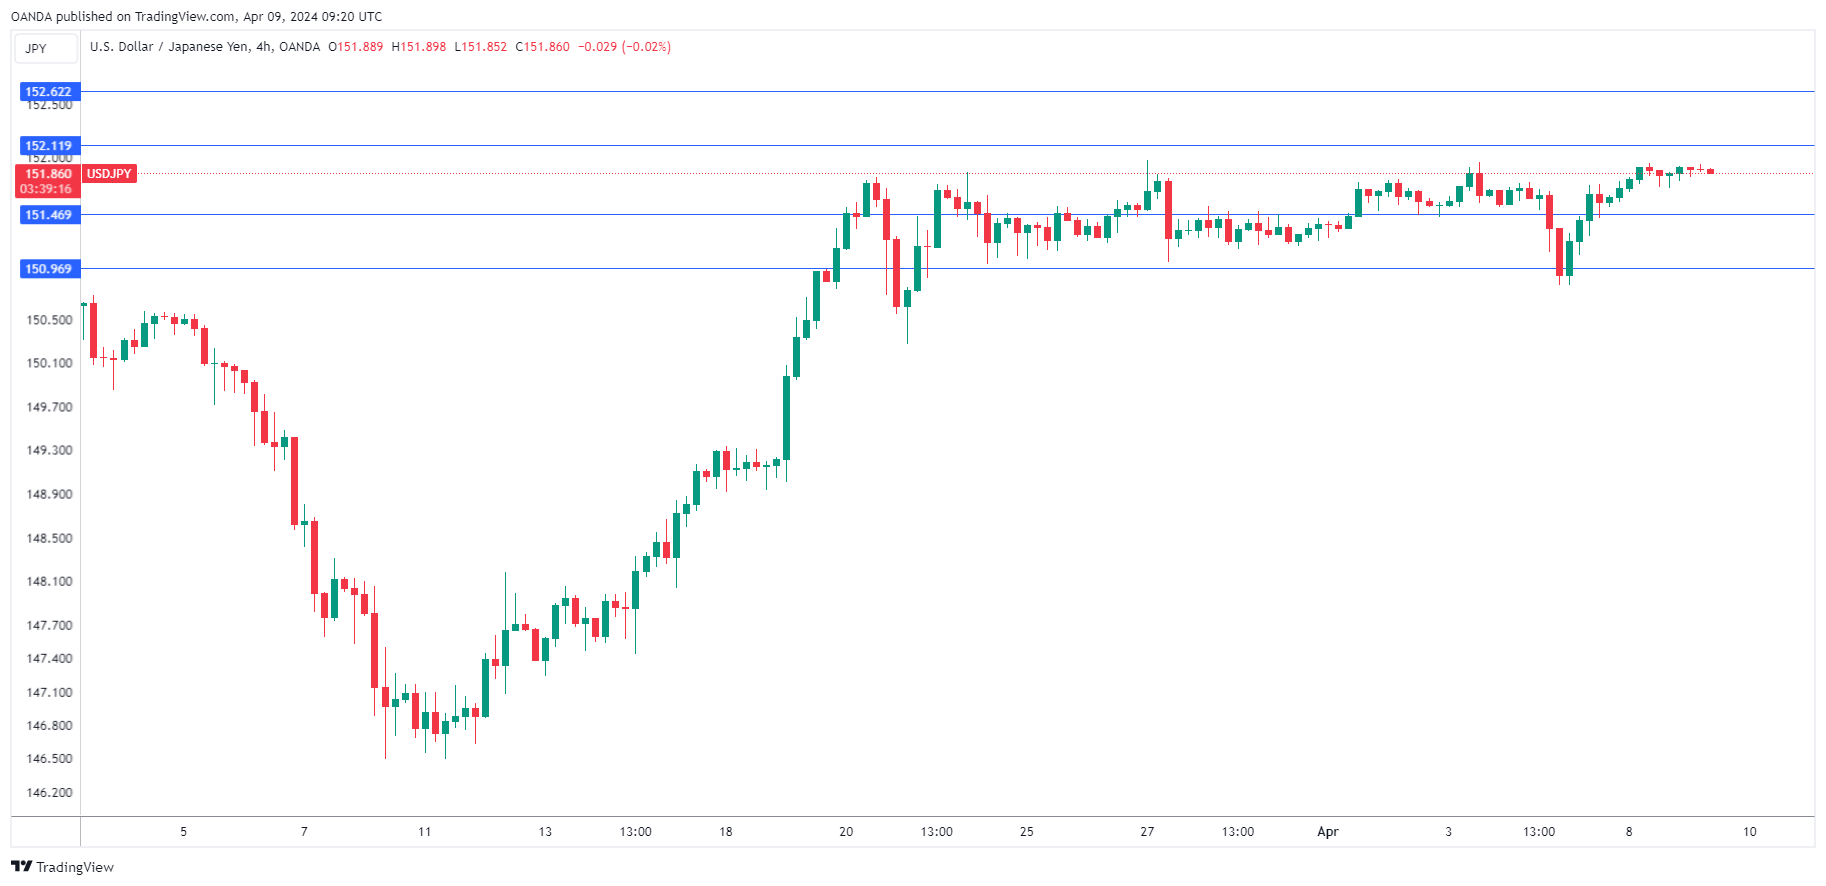
Japanese Yen Steady as Intervention Worries Continue
The Japanese yen is drifting on Tuesday. In the European session, USD/JPY is trading at 151.88, up 0.02%.
It’s as light data calendar today. Japan’s average cash earnings rose 1.8% y/y in February after a 2% gain in January. This beat the market estimate of 1.4%. Still, the better-than-expected wage growth release didn’t provide a boost to the yen.
Is 152 a line in the sand for Tokyo?
The yen continues to trade at multi-year lows, which has raised fears of intervention from the Ministry of Finance (MOF). The yen fell to a 34-year low of 151.97 in March and there are concerns that the 152 line could be a line in the sand for intervention. At the same time, Japanese officials have often said that they are more concerned about excessive moves from the yen rather than a particular exchange rate. That could mean there is even more room for the yen to fall before triggering a response from Tokyo.
The MoF last intervened in October 2022 when the yen fell close to the 152 line. Currently, it has resorted to verbal intervention in an attempt to stop speculators from selling the yen, warning that all measures are on the table.
The Bank of Japan made a major shift in policy in March when it lifted rates out of negative territory, but this has failed to shore up the yen. A key reason is that the US/Japan rate differential remains wide – after inflation, Japan’s 10-year yield is around 0.65, versus 2% in the US. The BoJ hasn’t signaled that it will be following up with further rate hikes, which means that the yen is unlikely to show much improvement without intervention.
USD/JPY Technical
- USD/JPY faces resistance at 1.52.12 and 152.62
- There is support at 151.47 and 150.97
Yen Weakens Amid Intervention Concerns and Interest Rate Differentials
The Japanese yen is experiencing a notable decline against the US dollar, with the USD/JPY pair currently hovering around 151.88 on Tuesday. Despite the US dollar's instability, driven primarily by fluctuations in Treasury bond yields, the yen faces significant downward pressure.
Market participants remain cautious, particularly as the USD/JPY pair approaches levels that had previously triggered currency interventions by Japanese authorities. Despite aggressive verbal measures from Japan aimed at bolstering the yen, these efforts have shown limited success. Finance Minister Shunichi Suzuki has reiterated Japan's commitment to addressing the yen's excessive depreciation, echoing his earlier statements about readiness to intervene against further declines in its value.
However, the prospect of intervention, although a genuine threat, has thus far prevented the yen from breaching the 152.00 mark.
This substantial interest rate differential between the US Federal Reserve and the Bank of Japan (BoJ) is a critical factor contributing to the yen's weakness. While the BoJ has only recently moved away from its negative interest rate policy, setting its lending rate back to zero, the Federal Reserve maintains a fund rate of 5.5% per annum, with no cuts implemented thus far.
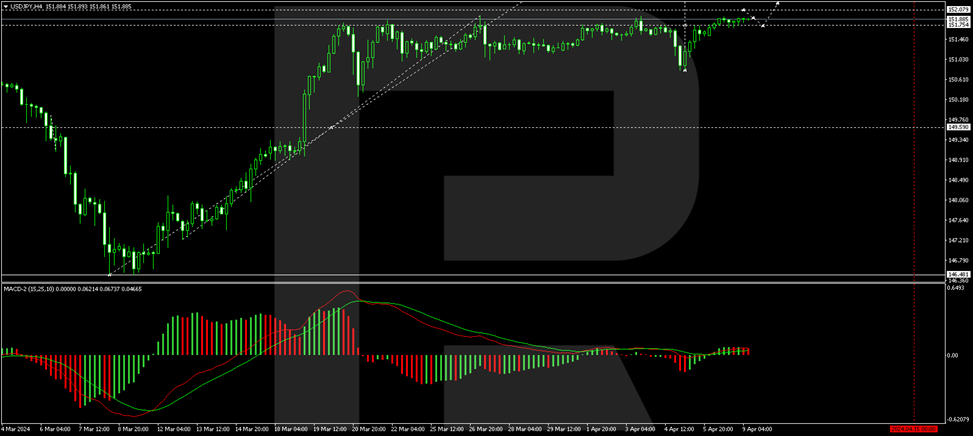
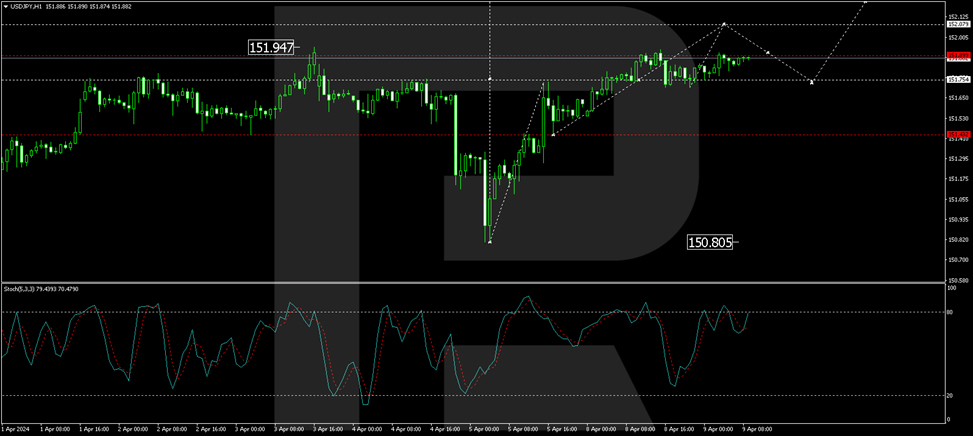
Technical analysis of USD/JPY
On the H4 chart, the USD/JPY pair has completed a growth wave to 151.75 and corrected to the 150.80 level. Another growth wave to 151.75 has been observed today, with the market forming a consolidation range around this level. An upward breakout from this range could lead to a rise to 152.07. After reaching this level, a correction to 151.75 (testing from above) may occur, followed by an increase to 152.70. This scenario is supported by the MACD oscillator, with its signal line above zero and poised to reach new highs.
On the H1 chart, support at 151.75 has bolstered the development of a growth structure to 152.07. After achieving this target, a correction to 151.75 may be seen, potentially leading to further growth towards 152.70, the main target of the growth wave. The Stochastic oscillator confirms this analysis with its signal line above 50 and preparing to ascend to 80.
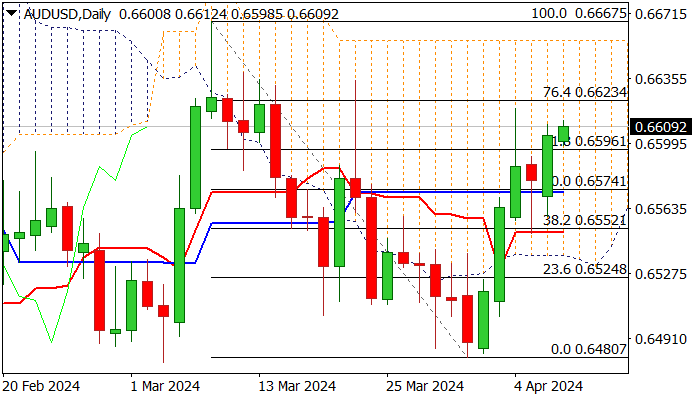
AUD/USD: Aussie Dollar Keeps Bullish Bias ahead of US Inflation Report
AUDUSD is trading within a narrow range on Tuesday morning but keeps slight bullish bias following Monday’s 0.5% advance and a positive signal on daily close above 0.6597 (100DMA / Fibo 61.8% of 0.6675/0.6480 bear-leg).
Aussie dollar was boosted by rise in iron ore, but markets are likely to reduce the speed until release of US inflation data on Wednesday, which will provide more information for the US central bank about the timing of the first rate cut and impact the dollar.
Immediate support lays at 0.6597, ahead of daily Kijun-sen (0.6574), which should hold and keep near-term bias with bulls, guarding lower pivot at 0.6552 (daily Tenkan-sen / broken Fibo 38.2%).
Initial resistances at 0.6623/34 (Fibo 76.4% / Mar 23 spike high) mark upper pivots, violation of which to expose key barriers at 0.6656/67 (daily cloud top / Mar 8 high).
Res: 0.6623; 0.6634; 0.6656; 0.6667.
Sup: 0.6597; 0.6574; 0.6552; 0.6524.
SPX Perfect Buying Opportunity At The Blue Box Area
In this technical blog, we will look at the past performance of the 1-hour Elliott Wave Charts of SPX. We presented to members at the elliottwave-forecast. In which, the rally from the 05 January 2024 low unfolded as an impulse structure and showed a bullish sequence. Suggested that the index should see more upside extension to complete the impulse sequence. Therefore, we advised members not to sell the index & buy the dips in 3, 7, or 11 swings at the blue box areas. We will explain the structure & forecast below:
SPX 1-Hour Elliott Wave Chart From 4.05.2024
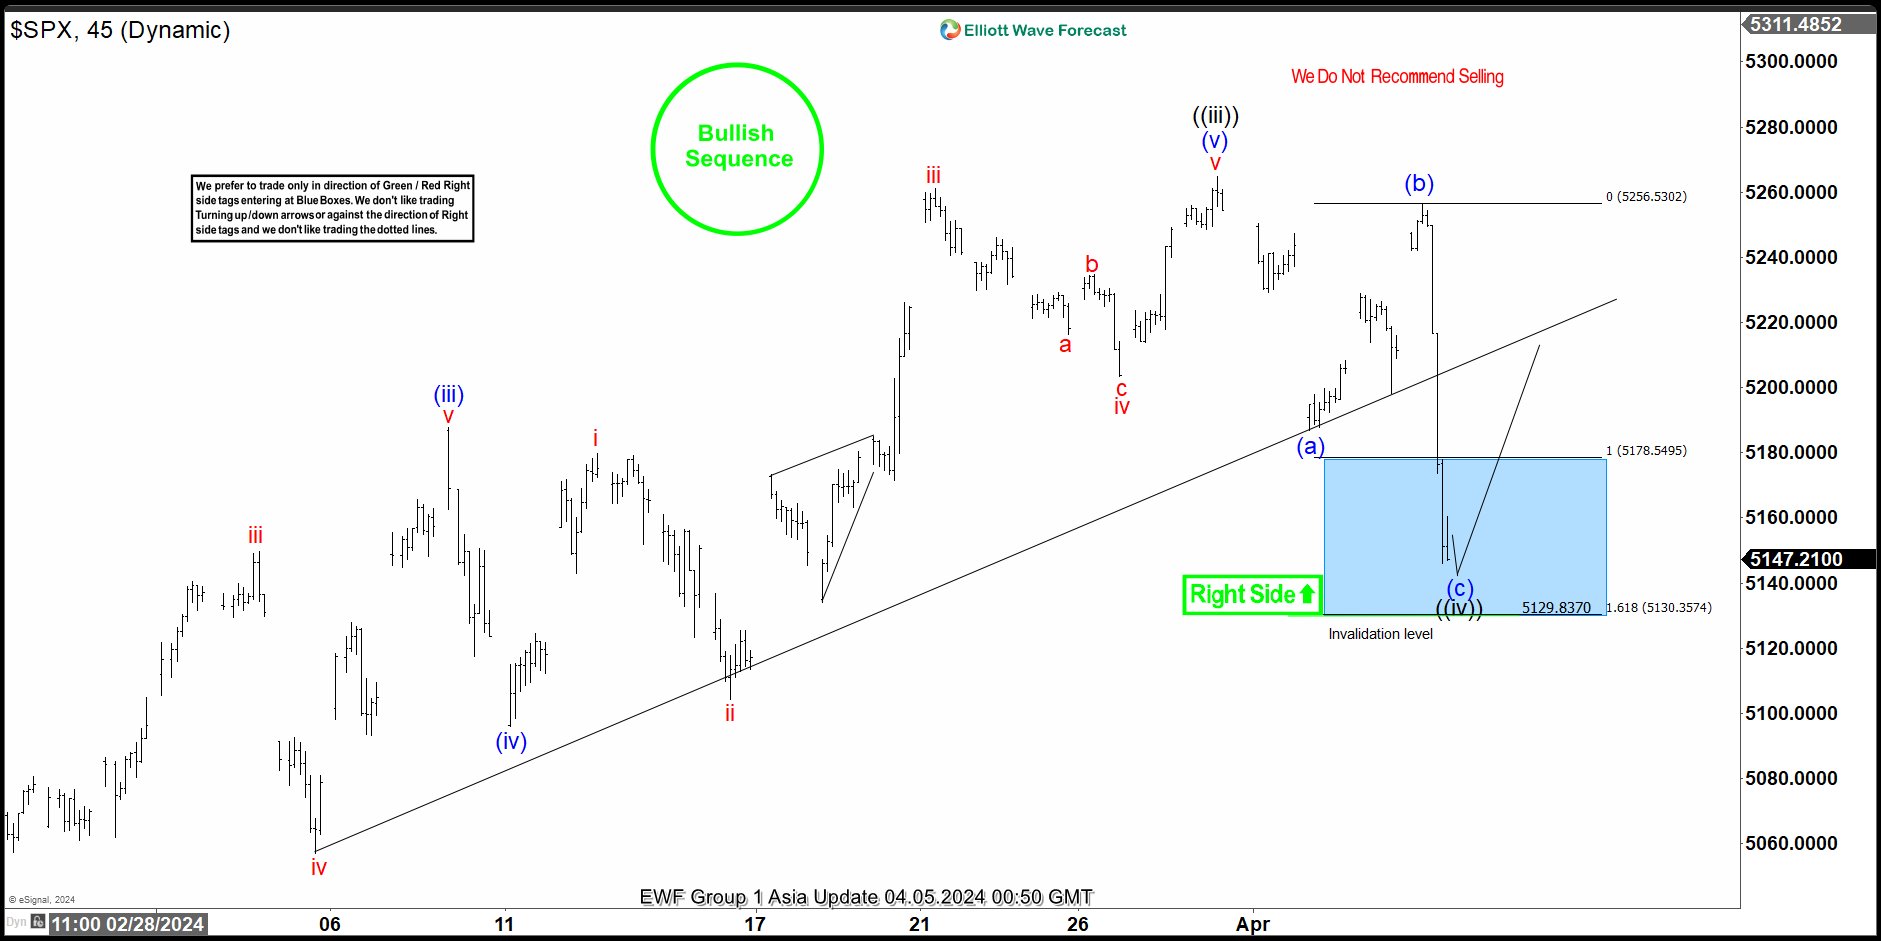
Here’s the 1-hour Elliott wave chart from the 4/05/2024 Asia update. In which, the short-term cycle from the 1/17/2024 low ended in wave ((iii)) as impulse at $5264.85 high. Down from there, the index made a pullback in wave ((iv)) to correct that cycle. The internals of that pullback unfolded as Elliott wave zigzag structure where wave (a) ended at $5186.71 low. Wave (b) bounce ended at $5256.59 high and wave (c) managed to reach the blue box area at $5178.54- $5130.35. From there, buyers were expected to appear looking for the next leg higher or for a 3 wave bounce minimum.
SPX Latest 1-Hour Elliott Wave Chart 4.09.2024
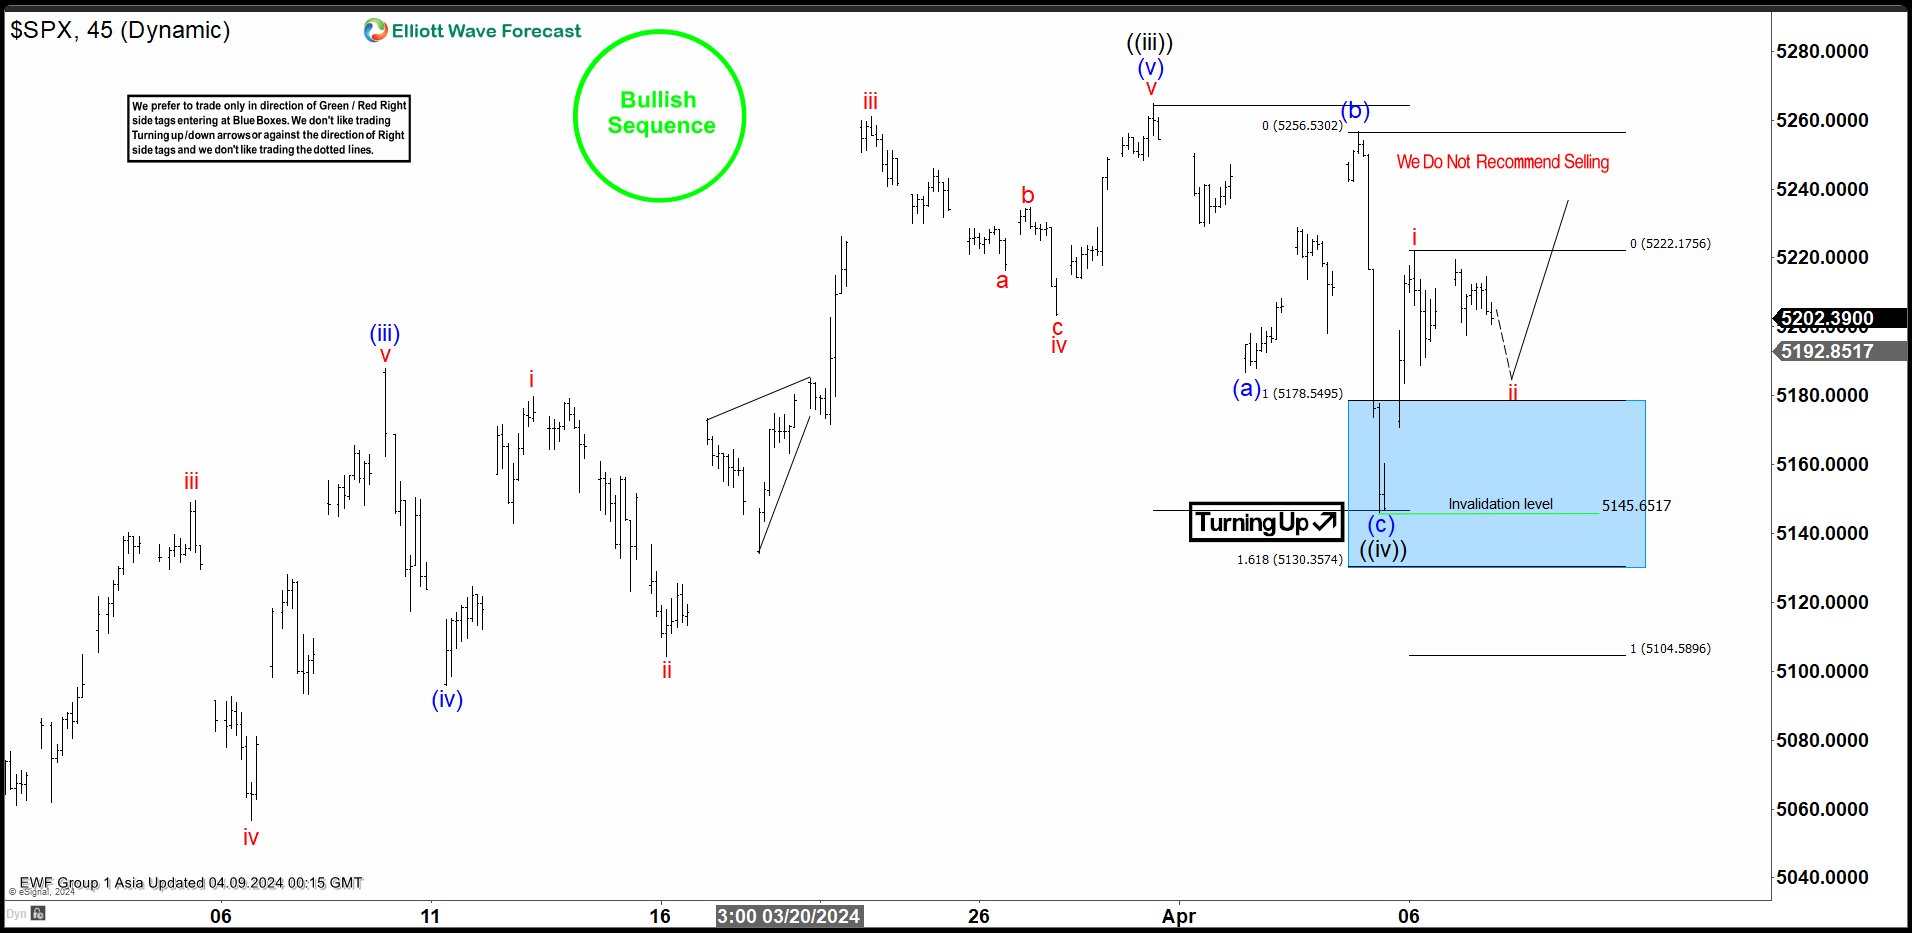
This is the latest 1-hour Elliott wave Chart from the 4/09/2024 Asia update. In which the index is showing a reaction higher taking place, right after ending the zigzag correction within the blue box area. Allowed members to create a risk-free position shortly after taking the long position at the blue box area. However, a break above $5264.85 high is still needed to confirm the next extension higher towards $5292- $5338 area higher and avoid double correction lower.