Sample Category Title
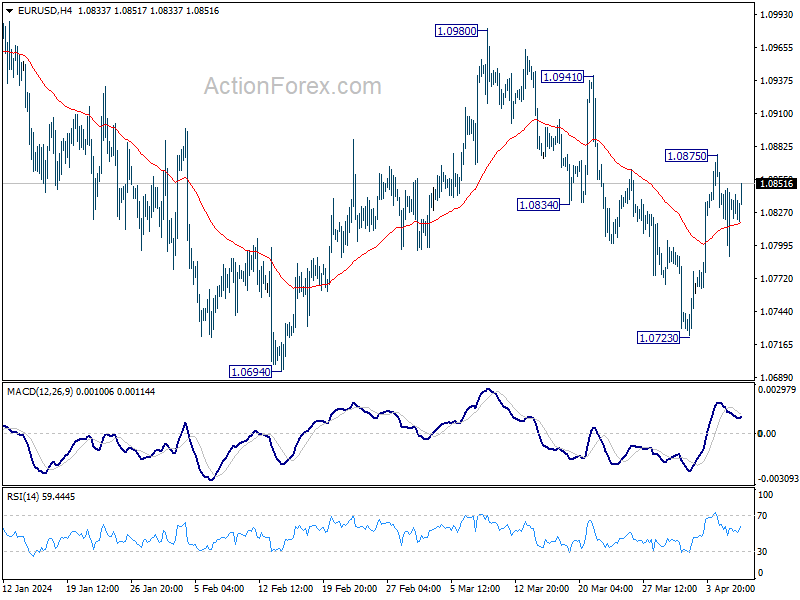
EUR/USD Mid-Day Outlook
Daily Pivots: (S1) 1.0803; (P) 1.0826; (R1) 1.0859; More...
Outlook in EUR/USD is unchanged and intraday bias stays neutral first. On the downside, decisive break of 1.0694/0723 support zone will resume whole fall from 1.1138. On the upside, though, break of 1.0875 will resume the rebound from 1.0723 towards 1.0980 resistance instead.
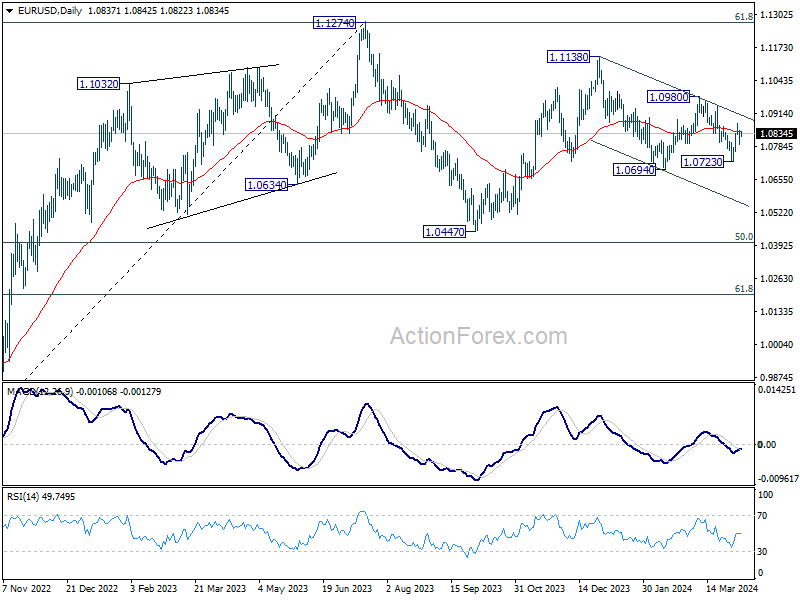
In the bigger picture, price actions from 1.1274 are viewed as a corrective pattern to rise from 0.9534 (2022 low). Rise from 1.0447 is seen as the second leg. While further rally could cannot be ruled out, upside should be limited by 1.1274 to bring the third leg of the pattern. Meanwhile, sustained break of 1.0694 support will argue that the third leg has already started for 1.0447 and possibly below.
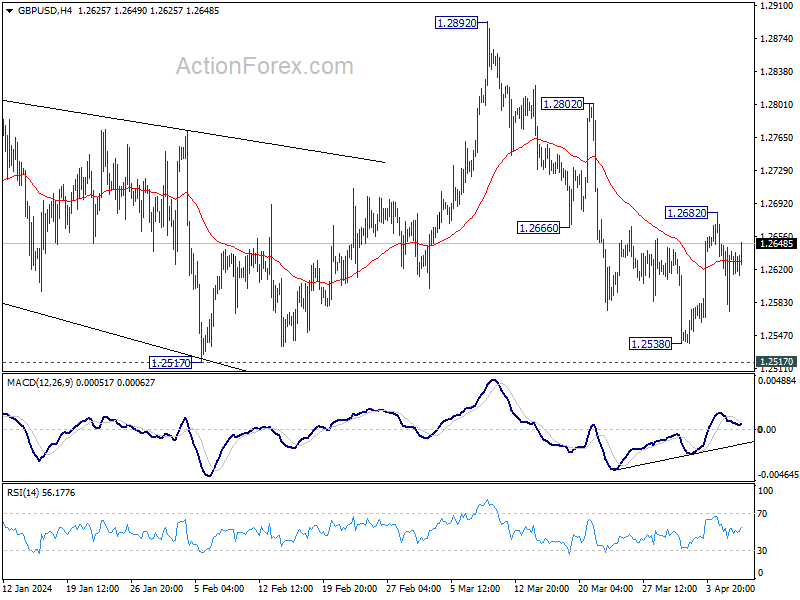
GBP/USD Mid-Day Outlook
Daily Pivots: (S1) 1.2592; (P) 1.2621; (R1) 1.2666; More...
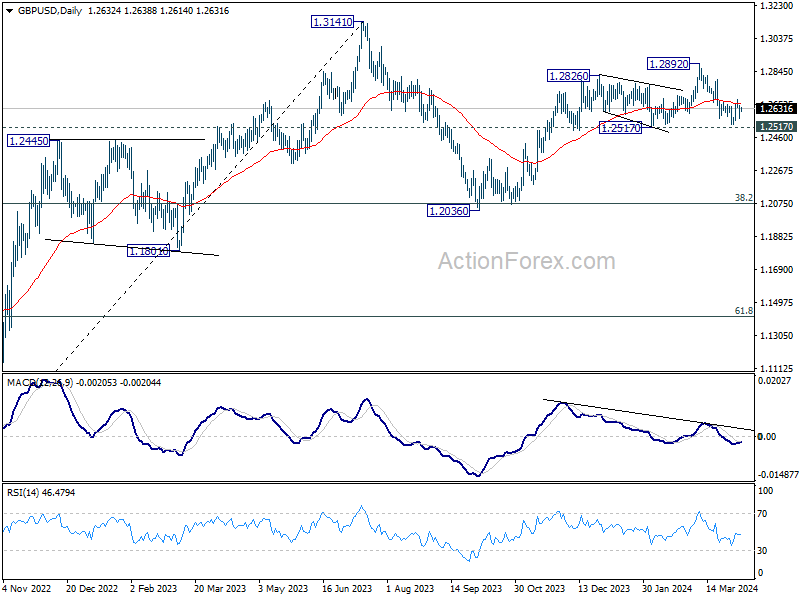
No change in GBP/USD's outlook and intraday bias stays neutral. On the downside, decisive break of 1.2517/38 support zone will suggest that rise from 1.2036 has completed at 1.2892 already, and turn near term outlook bearish. On the upside, however, firm break of 1.2682 will suggest that fall from 1.2892 has completed at 1.2538. Intraday bias will be turned back to the upside for 1.2802 resistance next.
In the bigger picture, price actions from 1.3141 medium term top are seen as a corrective pattern to up trend from 1.0351 (2022 low). Rise from 1.2036 is seen as the second leg, which might still be in progress. But upside should be limited by 1.3141 to bring the third leg of the pattern. Meanwhile, break of 1.2517 support will argue that the third leg has already started for 38.2% retracement of 1.0351 (2022 low) to 1.3141 at 1.2075 again.
USD/JPY Mid-Day Outlook
Daily Pivots: (S1) 151.04; (P) 151.40; (R1) 151.98; More...
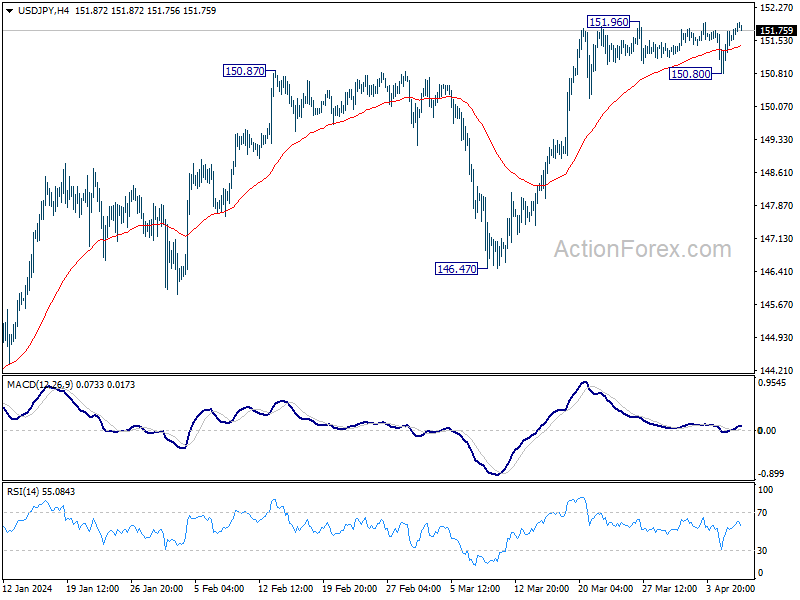
No change in USD/JPY's outlook as range trading continues. Intraday bias remains neutral at this point. On the downside, break of 150.80 will turn bias back to the downside for deeper pull back to 55 D EMA (now at 149.65). On the upside, however, sustained break of 151.93 key resistance will confirm long term up trend resumption.
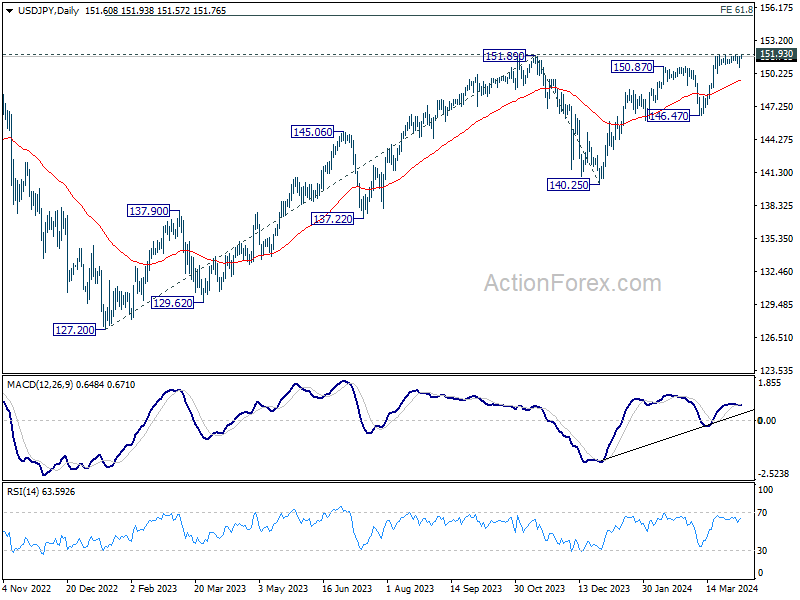
In the bigger picture, correction from 151.87 (2023) high could have completed at 140.25 already. Rise from 127.20 (2023 low), as part of the long term up trend, is probably ready to resume. Decisive break of 151.93 resistance (2022 high) will confirm this bullish case. Next medium term target will be 61.8% projection of 127.20 to 151.89 from 140.25 at 155.20. This will remain the favored case as long as 146.47 support holds, in case of another pullback.
USD/CHF Mid-Day Outlook
Daily Pivots: (S1) 0.8988; (P) 0.9029; (R1) 0.9061; More....
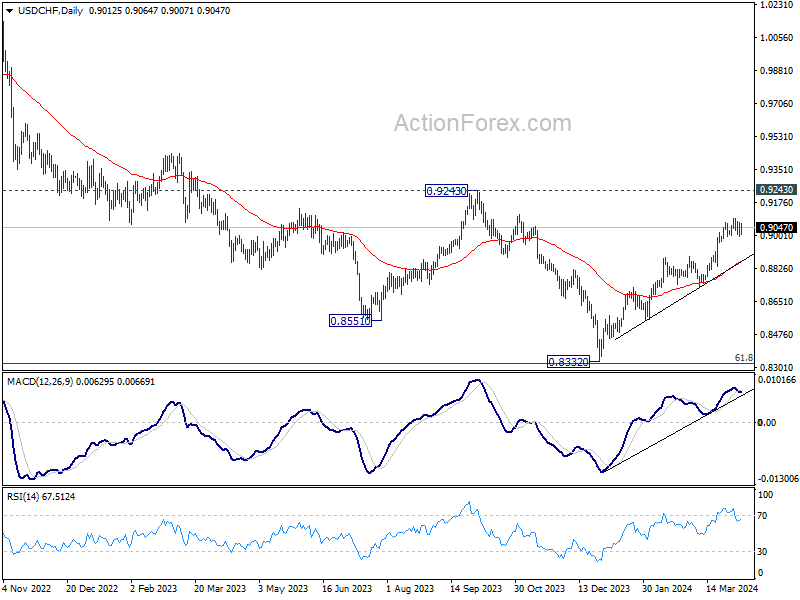
USD/CHF recovers today but stays below 0.9094 resistance. Intraday bias remains neutral and more consolidations would be seen. Deeper decline cannot be ruled out, but outlook will stay bullish as long as 0.8884 resistance turned support holds. On the upside, break of 0.9094 will resume larger rise from 0.8332 to 0.9243 key resistance.
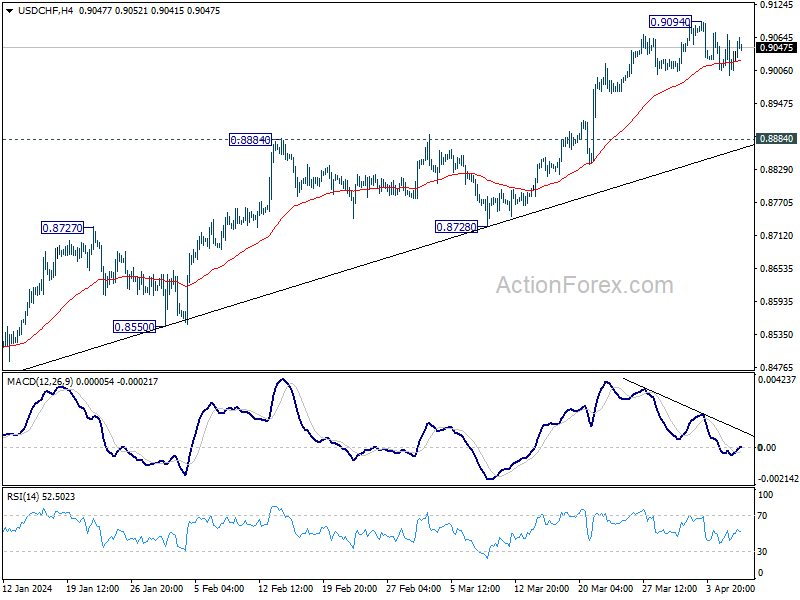
In the bigger picture, price actions from 0.8332 medium term bottom as tentatively seen as developing into a corrective pattern to the down trend from 1.0146 (2022 high). Further rise would be seen as long as 0.8728 support holds. But upside should be limited by 0.9243 resistance, at least on first attempt.
Swiss Franc and Yen Soft on Rising Yields and Metals
Benchmark treasury yields in US and Europe rise notably in a day of relatively slow news flow. At the same time, Copper is extending recent up trend while Gold edged higher to new record. European stock indexes are seeing appreciable gains, and US futures indicate a positive start.
These development keeps Swiss Franc and Yen as the worst performers for the day so far. Australian Dollar is leading other commodity currencies higher. Dollar, Euro and Sterling are positioned in the middle with the greenback having a slight disadvantage.
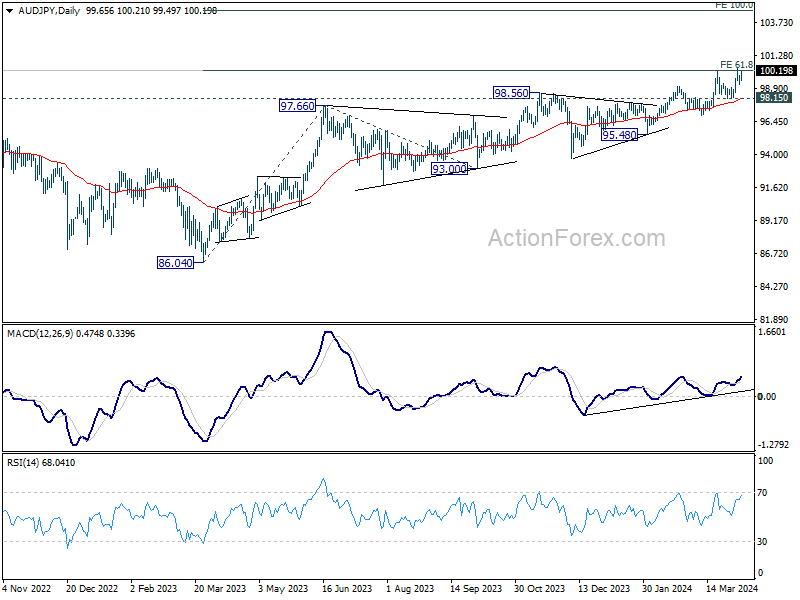
Technically, AUD/JPY is currently the top mover for the month, up over 1.5%. Near term outlook will stay bullish as long as 98.15 support holds. Sustained trading above 61.8% projection of 86.04 to 97.66 from 93.00 at 100.18 could prompt further upside acceleration to 100% projection at 104.62 in the medium term.
In Europe, at the time of writing, FTSE is up 0.36%. DAX is up 0.80%. CAC is up 0.85%. UK 10-year yield is up 0.0344 at 4.108. Germany 10-year yield is up 0.038 at 2.445. Earlier in Asia, Nikkei rose 0.91%. Hong Kong HSI rose 0.05%. China Shanghai SSE fell -0.72%. Singapore Strait Times fell -0.07%. Japan 10-year JGB yield rose 0.0201 to 0.792.
Eurozone Sentix confidence rises to -5.9, yet momentum remains tepid
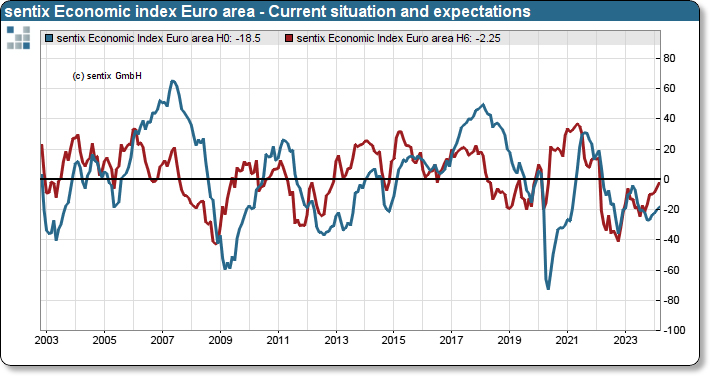
Eurozone Sentix Investor Confidence index surged from -10.5 to -5.9 in April, surpassing expectations of -8.3. This marks the sixth consecutive increase, reaching its highest since February 2022. Similarly, Current Situation Index climbed from -18.5 to -16.3, reflecting the highest point since June 2023 after six successive rises. Additionally, Expectations Index rose from -2.3 to 5.0, recording its seventh straight increase and the highest level since February 2022.
Sentix's analysis suggests that despite the positive direction of economic momentum, the pace remains subdued. This sluggishness is attributed largely to the ongoing relative weakness of the German economy.
While the incremental economic improvement is a positive sign, it simultaneously tempers expectations for inflation reduction and subsequent central bank interest rate cuts.
Investors maintain anticipation for a more accommodative monetary policy stance within the Eurozone. Nevertheless, should the global economy sees a significant upturn, these aspirations for interest rate reductions may not materialize as expected.
Japan's nominal wages rise 1.8% yoy in Feb, real wages down -1.3% yoy
Japan's nominal labor cash earnings rose by 1.8% yoy in February, aligning with market expectations and marking a 26-month streak of increases. Monthly wages saw 2.0% yoy increase, with regular pay rising by 2.2% yoy. However, over-time pay decreased of -1.0% yoy, and special payments fell significantly by -5.5% yoy.
Real wages fell by 1.3% yoy, marking the 23rd consecutive month of decline. This trend underscores the continuing issue of rising living costs eroding purchasing power of Japanese workers,
A Ministry of Health, Labor, and Welfare official noted, "We will monitor how growth in nominal pay will develop while price gains are weighing down real wages."
USD/CHF Mid-Day Outlook
Daily Pivots: (S1) 0.8988; (P) 0.9029; (R1) 0.9061; More....
USD/CHF recovers today but stays below 0.9094 resistance. Intraday bias remains neutral and more consolidations would be seen. Deeper decline cannot be ruled out, but outlook will stay bullish as long as 0.8884 resistance turned support holds. On the upside, break of 0.9094 will resume larger rise from 0.8332 to 0.9243 key resistance.
In the bigger picture, price actions from 0.8332 medium term bottom as tentatively seen as developing into a corrective pattern to the down trend from 1.0146 (2022 high). Further rise would be seen as long as 0.8728 support holds. But upside should be limited by 0.9243 resistance, at least on first attempt.
Economic Indicators Update
| GMT | Ccy | Events | Actual | Forecast | Previous | Revised |
|---|---|---|---|---|---|---|
| 23:30 | JPY | Labor Cash Earnings Y/Y Feb | 1.80% | 1.80% | 2.00% | |
| 23:50 | JPY | Current Account (JPY) Feb | 1.37T | 1.99T | 2.73T | 2.75T |
| 05:00 | JPY | Eco Watchers Survey: Current Mar | 49.8 | 51.6 | 51.3 | |
| 05:45 | CHF | Unemployment Rate Mar | 2.30% | 2.20% | 2.20% | |
| 06:00 | EUR | Germany Industrial Production M/M Feb | 2.10% | 0.60% | 1.00% | 1.30% |
| 06:00 | EUR | Germany Trade Balance (EUR) Feb | 21.4B | 25.1B | 27.5B | 27.6B |
| 08:30 | EUR | Eurozone Sentix Investor Confidence Apr | -5.9 | -8.3 | -10.5 |
Eurozone Sentix confidence rises to -5.9, yet momentum remains tepid
Eurozone Sentix Investor Confidence index surged from -10.5 to -5.9 in April, surpassing expectations of -8.3. This marks the sixth consecutive increase, reaching its highest since February 2022. Similarly, Current Situation Index climbed from -18.5 to -16.3, reflecting the highest point since June 2023 after six successive rises. Additionally, Expectations Index rose from -2.3 to 5.0, recording its seventh straight increase and the highest level since February 2022.
Sentix's analysis suggests that despite the positive direction of economic momentum, the pace remains subdued. This sluggishness is attributed largely to the ongoing relative weakness of the German economy.
While the incremental economic improvement is a positive sign, it simultaneously tempers expectations for inflation reduction and subsequent central bank interest rate cuts.
Investors maintain anticipation for a more accommodative monetary policy stance within the Eurozone. Nevertheless, should the global economy sees a significant upturn, these aspirations for interest rate reductions may not materialize as expected.
Gold Hits New Record High Amid Favourable Factors
Gold's price soared to a new record high on Monday, stabilising around 2344.00 USD per troy ounce. A confluence of factors is currently bolstering the precious metal's value.
Geopolitical tensions in the Middle East are a significant driver, positioning gold as a preferred "safe-haven" investment. Additionally, central banks worldwide are increasing their gold reserves, while global exchange-traded funds (ETFs) that track the metal's price continue to show keen interest.
Recent US job market data for March surpassed expectations, indicating a robust end to the first quarter for the US economy. These developments could impact the Federal Reserve's interest rate decisions, as lower rates diminish the opportunity cost of holding gold, further supporting its price increase.
Since the start of the year, gold has appreciated over 12% in value, showcasing an impressive performance for what is traditionally viewed as a conservative asset.
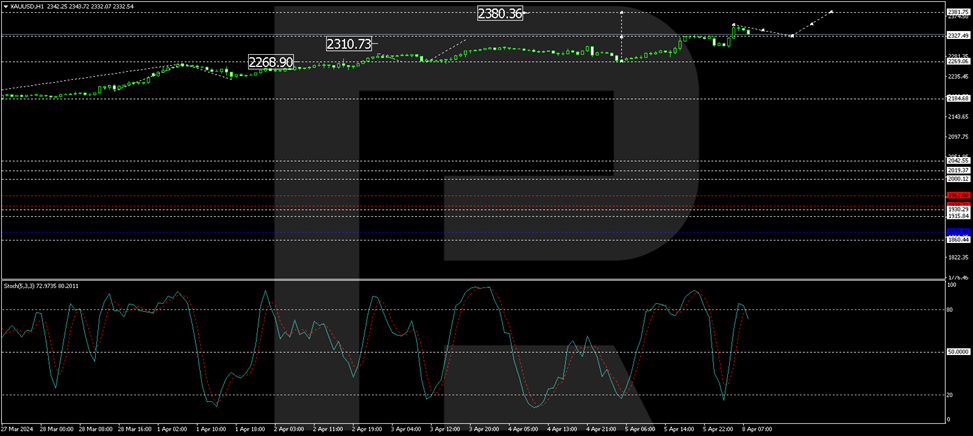
XAU/USD technical analysis
The H4 chart for XAU/USD indicates that a growth wave reached 2330.00, followed by the formation of a consolidation range around this level. This range has now expanded to 2353.85. A technical retracement to 2330.00 is anticipated (testing from above), with potential subsequent growth to 2380.33 as a local target. The MACD indicator, with its signal line well above zero and pointing upwards, supports this growth scenario.
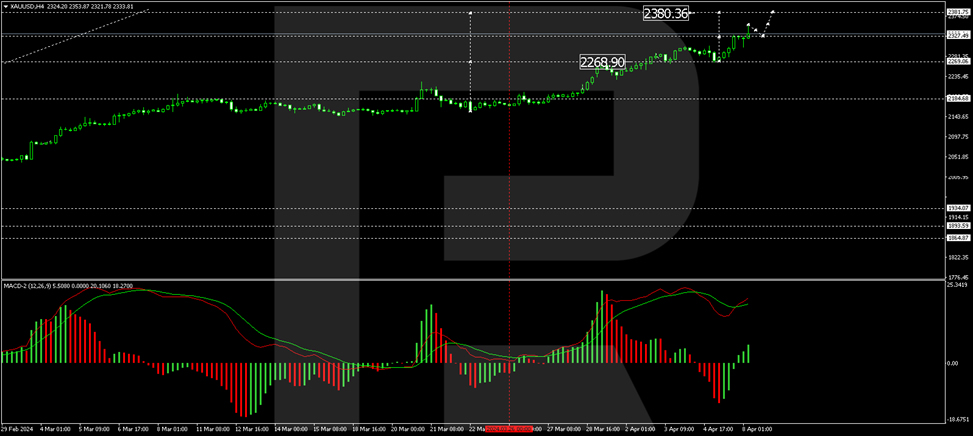
On the H1 chart, XAU/USD established support at 2269.00, completing a growth structure to 2330.53. A consolidation range has formed around this level, now extended to 2353.85. A corrective move to 2327.50 (testing from above) is expected, potentially leading to a new growth wave towards 2386.36. This forecast is confirmed by the Stochastic oscillator, with its signal line preparing to drop to 50 before climbing back to 80.
SPX 500: Fed Dovish Pivot Narrative is at Risk
- Higher oil prices have led to higher inflationary expectations in the US via the breakeven rates.
- Recent rise in inflationary expectations coupled with recent “less dovish” Fed Speak from Fed officials Kashkari, and Bostic has revived the “higher for longer” interest rates environment.
- Higher commodities prices led by oil may see an uptick in US CPI data.
- Potential negative implication for S&P 500 as its recent steep rally from the October 2023 low has reached an extremely overbought technical level.
Last week, we witnessed several key events, economic data releases, and intermarket price action movements that may lead to a repositioning and rethinking of the earlier much hyped-up, Fed’s dovish pivot narrative that supported a resurgence of broad-based risk-on behaviour after the Fed’s FOMC monetary policy meeting in December last year.
Federal Reserve Bank of Minneapolis President Kashkari has joined the “less dovish outlier” camp together with his colleague, Fed Atlanta President Bostic who advocated the Fed should be more patient in cutting its Fed funds rate this year, and Kashkari has turned out to be the “most hawkish” official at this juncture as his public speech on last Thursday, 4 April stated that that interest rate cuts may not be needed in 2024 if progress on fighting inflation has stalled, especially if the US economy remains in a robust state.
This latest rhetoric and guidance from Fed officials Kashkari and Bostic have paled against Fed Chair Powell’s insistence that Fed funds rate cuts are likely to take place this year, and potentially three cuts before 2024 ends after the recently concluded FOMC meeting in March.
Less dovish Fed officials’ guidance and rosy March’s NFP have pushed back rate cuts expectations
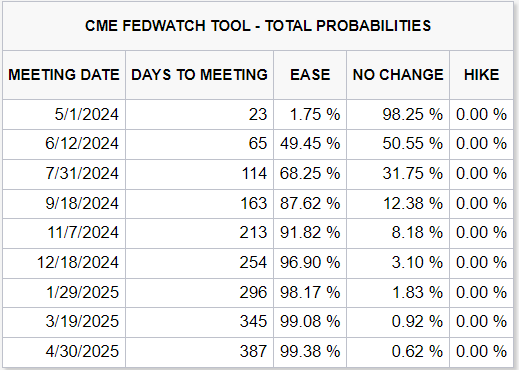
Fig 1: Probability of Fed funds rate outcome as of 8 Apr 2024 (Source: CME FedWatch Tool, click to enlarge chart)
Coupled with the latest red-hot US non-farm payroll jobs data for March that surpassed expectations significantly; +303K versus consensus of +200K, and above February’s print of +270K. Also, the upbeat March’s NFP data saw the highest number of jobs added in the past ten months.
All in all, the expectation of the first Fed rate cut has been dialled back again, right now market participants in the Fed funds rate futures market have pushed back the first interest rate cut in the US to occur in July’s FOMC with a probability of 68% (see Fig 1) while the probability of a rate cut in June FOMC has been reduced to 49% from an earlier chance of 76% right after the recent 20 March FOMC meeting based on data obtained from CME FedWatch Tool.
The crux is likely rising inflationary expectations due to higher WTI oil prices
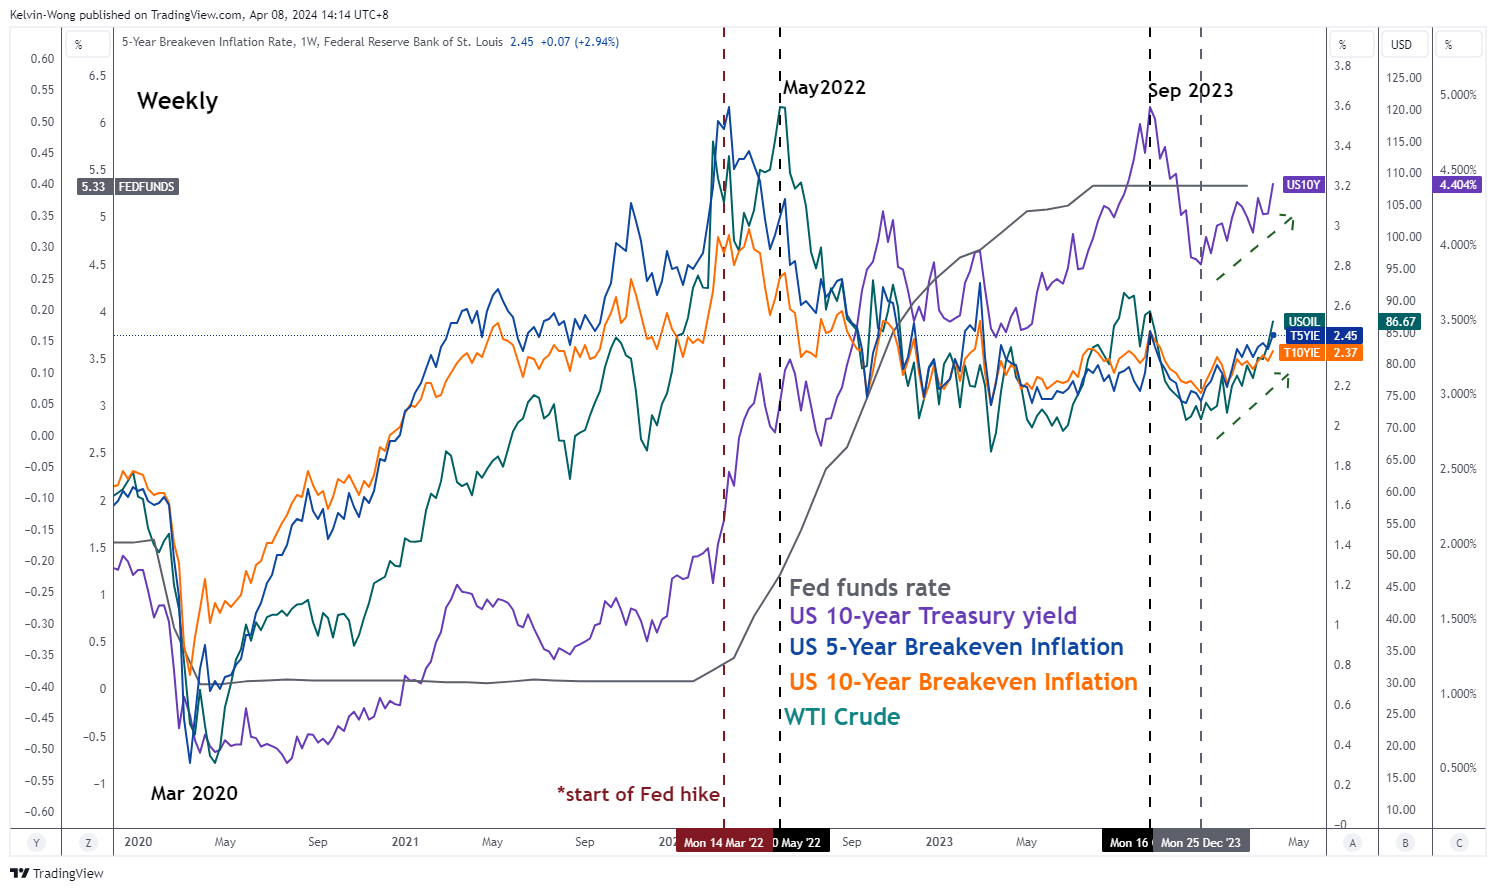
Fig 2: Correlation movements of US 5-year & 10-year breakeven inflation rates with WTI crude & US 10-year Treasury yield as of 5 Apr 2024 (Source: TradingView, click to enlarge chart)
Based on recent past data since the start of the latest Fed funds rate hike cycle that occurred in mid-March 2022, the rallies seen in both the US 5-year and 10-year breakeven inflation rates (in a nutshell, the breakeven rates are inferred as forward-looking 5-year and 10-year inflationary expectations from today based on market transacted prices derived from US Treasury Inflation-Protected Securities, TIPS) preceded the start of the interest rate hike cycle.
On a closer examination, the movement of West Texas crude oil (WTI) has a direct correlation with both the US 5-year and 10-year breakeven rates where three of them rose significantly in unison from November 2021 to February 2022 before the Fed hiked rates.
Right now, the 5-year and 10-year breakeven rates may have formed a medium-term bottom on 25 December 2023 as it rallied by 33 bps to 21 bps to 2.45% and 2.37% respectively in line with a rally of +24% seen in WTI crude oil which in turn also pushed up the US 10-year Treasury yield to a five-month high at 4.40% on last Friday, 5 April (see Fig 2).
Potential implications (1) – Higher US CPI may revive the higher for longer interest rates narrative
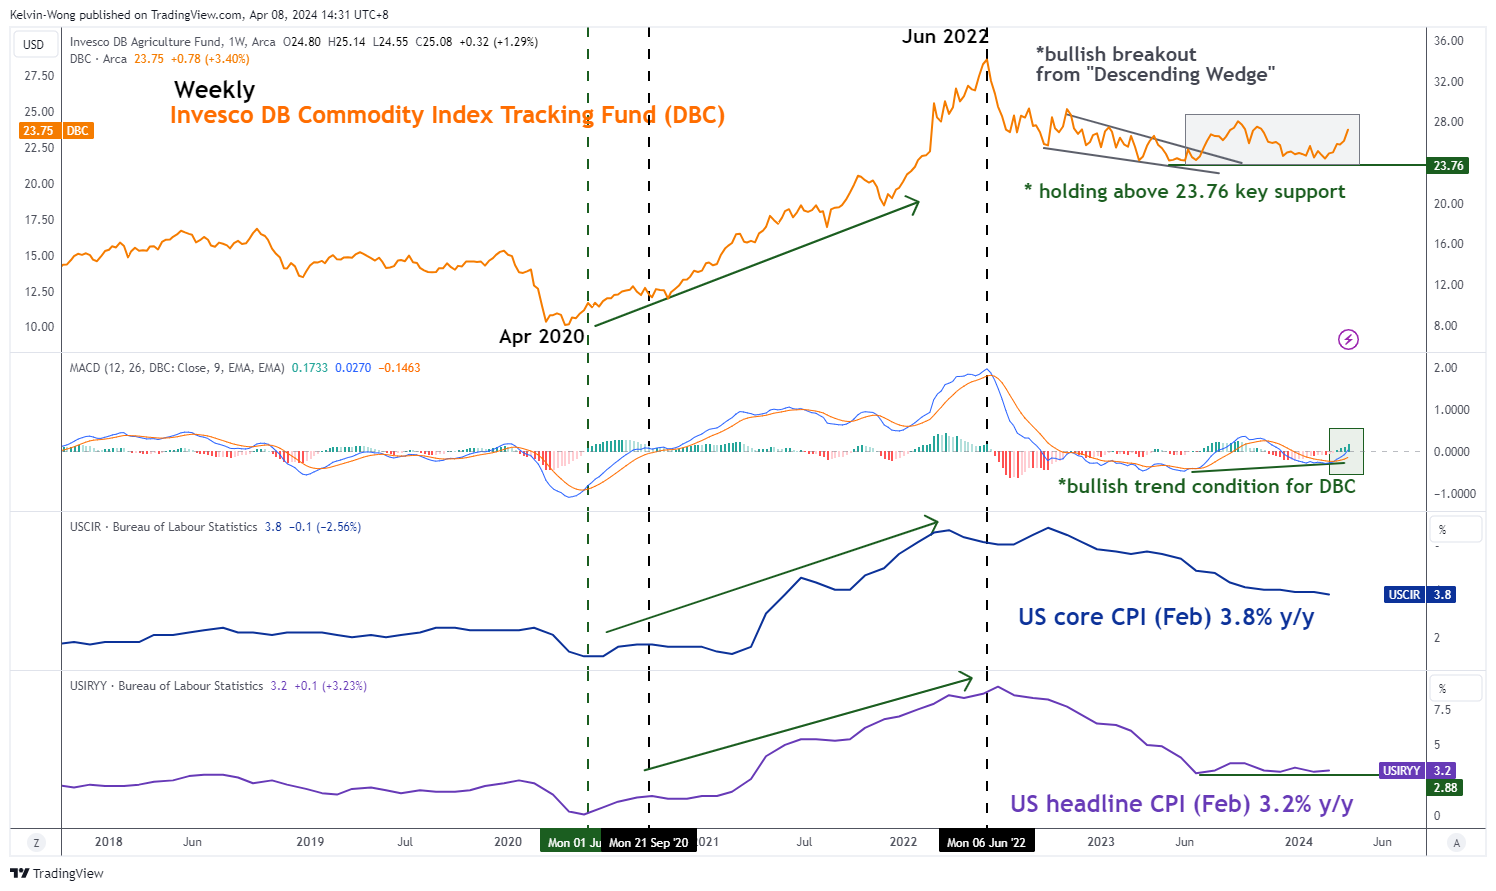
Fig 3: Invesco DB Commodity Index Tracking Fund major trend with US CPI as of 5 Apr 2024 (Source: TradingView, click to enlarge chart)
An important point to note is CPI data that gauges inflationary trends are lagging in nature as they are calculated based on prior month prices of a basket of selected goods and services.
Market-transacted prices of commodities are likely to be more forward-looking and can have a significant impact on the CPI-inflationary trends that manifest in the following months thereafter.
Headline inflation or primarily goods-based inflation (including food & energy) has a high direct linkage to prices of tradable commodities.
Using the Invesco DB Commodity Index Tracking Fund (DBC), a broad-based commodities futures exchange-traded fund with its highest weightage holding of 56% concentrated in energy-related futures and 21% (second highest) weightage in agriculture-related futures in conjunction with the trend movements of both the US headline and core CPI y/y rates to conduct an intermarket analysis (see Fig 3).
Based on historical price actions, movements seen in the DBC tend to lead over the headline and core CPI inflation trends. Before the prior significant upsurge in the US inflation rates from September 2020 to June 2022, the weekly MACD trend indicator of the DBC flashed a bullish crossover signal earlier in June 2020 that preceded the change of DBC’s major trend from bearish to bullish.
A new positive element has been detected in the most recent movement of the weekly MACD trend indicator of DBC where it has flashed out a bullish crossover condition and inched higher above its zero-centreline last week. These observations suggest a potential emergence of a major uptrend phase for DBC.
If history plays out again, the current positive momentum element inherent in the DBC may lead to at least a further potential medium-term upmove in DBC which in turn could translate to a possible uptick in inflationary pressures in the real economy in H2 2024 that may put the Fed dovish pivot narrative in jeopardy, and further reduces the expected number of Fed funds rate cut in 2024.
Potential implications (2) – Higher oil prices may trigger a multi-week corrective decline in the S&P 500
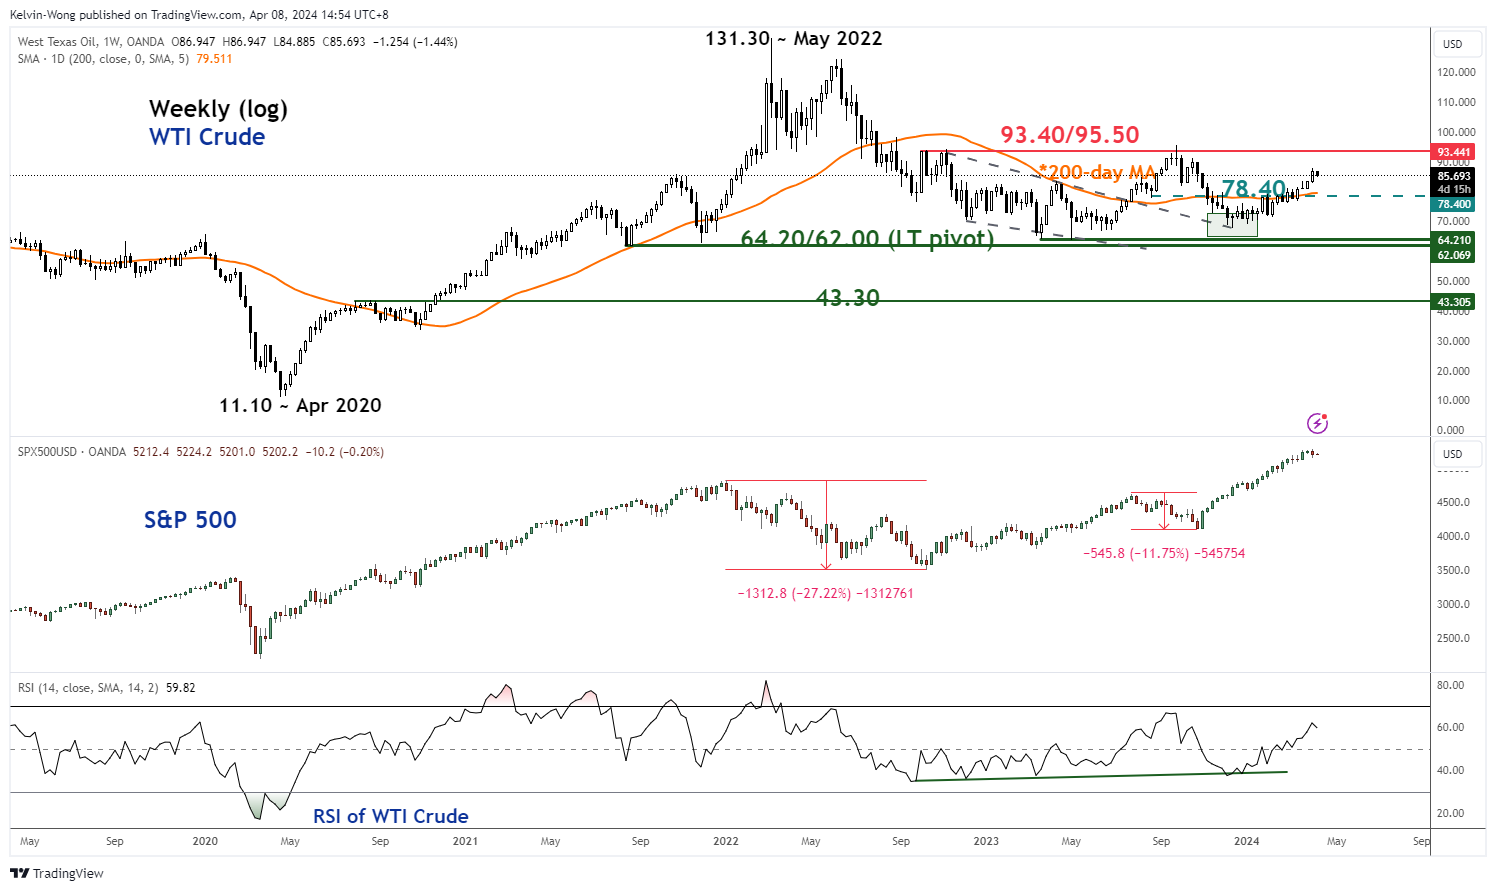
Fig 4: WTI crude major trend with S&P 500 as of 5 Apr 2024 (Source: TradingView, click to enlarge chart)
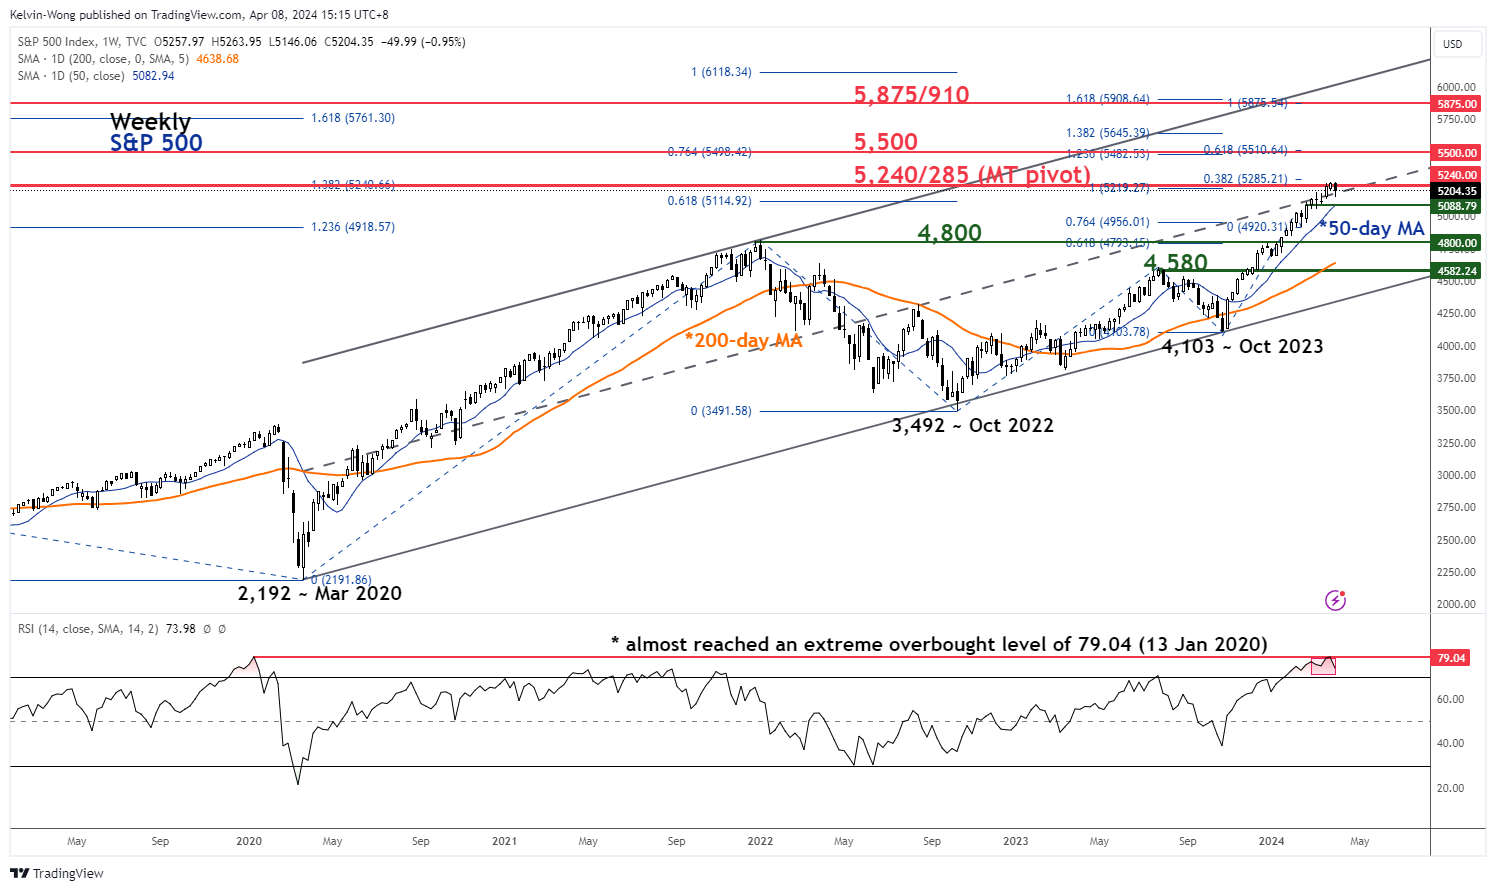
Fig 5: S&P 500 major trend as of 5 Apr 2024 (Source: TradingView, click to enlarge chart)
Based on correlation analysis, the prior major uptrend phase of WTI crude from April 2020 to May 2022 has led to adverse movement in the S&P 500 with a lead time as the S&P 500 shaped a medium-term multi-week corrective decline of -27% thereafter from January 2022 to October 2022.
A smaller scale rally in oil prices was also seen most recently in the late summer months of last year when WTI crude broke above its 200-day moving average and rallied from July 2023 to September 2023, and during this period, the S&P 500 shaped a corrective decline of -12%.
Interestingly, bullish momentum has resurfaced in WTI crude as it continued to rally for four weeks after it broke above its 200-day moving average again in late February 2024 within a potential major basing configuration that has now formed since March 2023 (see Fig 4).
In addition, the daily RSI momentum indicator of the S&P 500 has almost reached an extreme outbought level of 79.04 last seen on 13 January 2020 which increases the odds that a medium-term multi-week corrective decline may unfold next after a steep rally of +28% from October 2023 swing low (see Fig 5).
Watch the 5,280 key medium-term pivotal resistance, and a break below the 50-day moving average now acting as a support at around 5,090 may expose the next medium-term support of 4,800.
EURUSD Undecided Near Converging SMAs
- EURUSD fluctuates near its 50- and 200-day SMAs
- Forms two successive doji candles, unable to adopt a direction
- Momentum indicators strengthen but remain negative
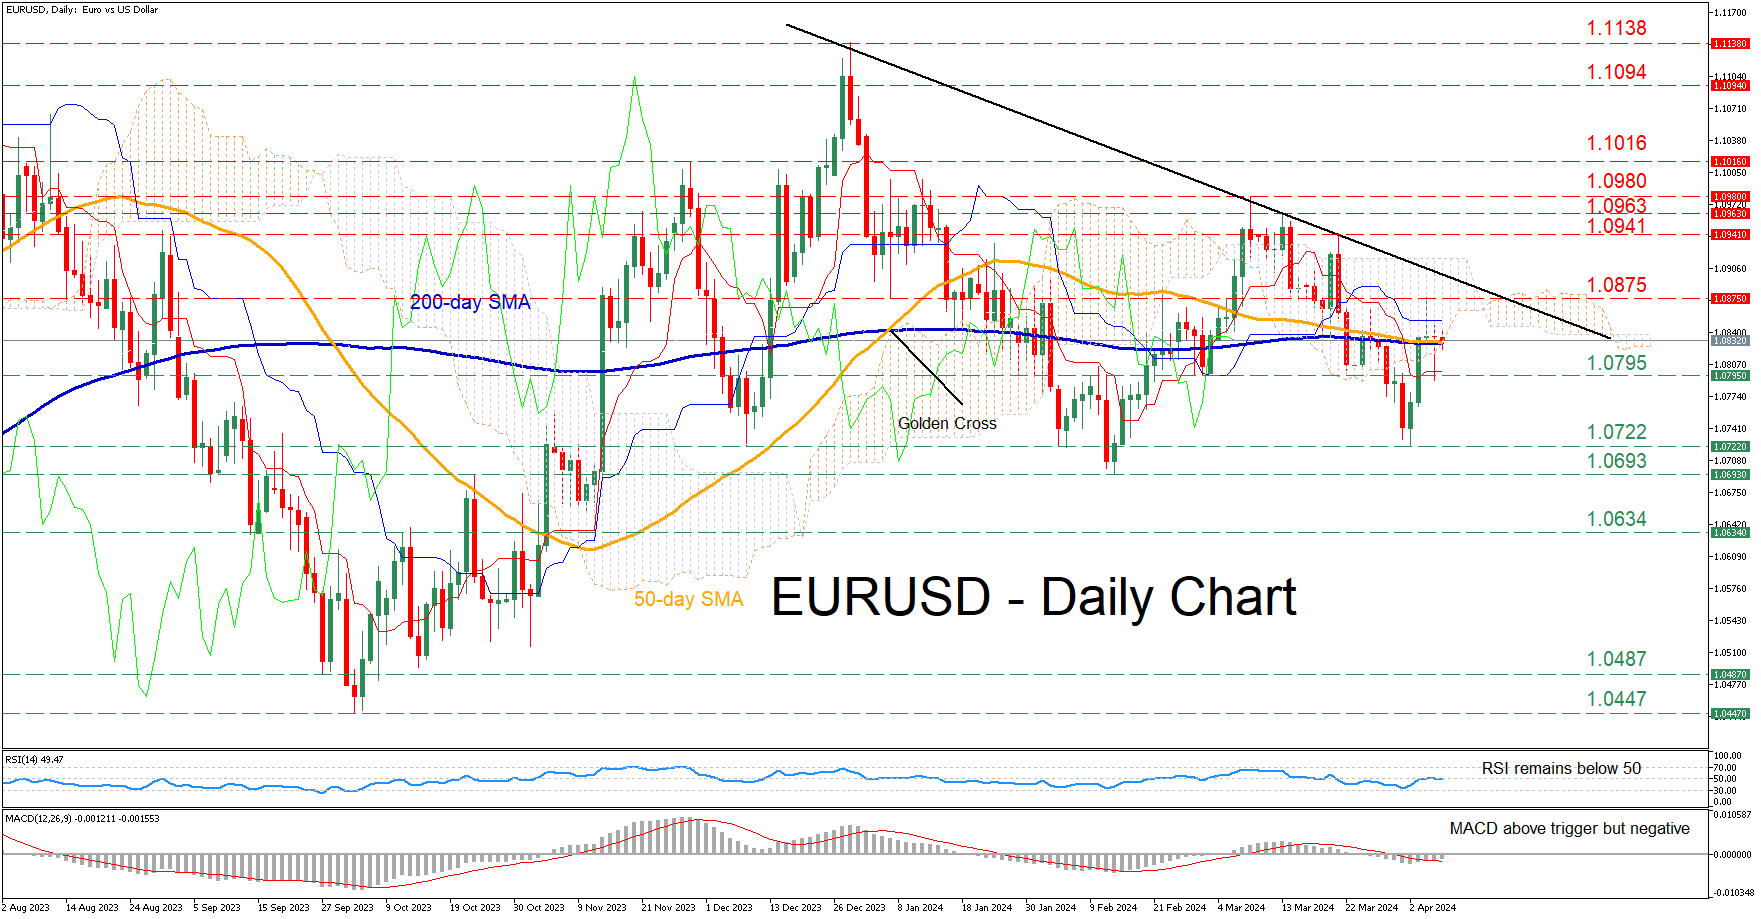
EURUSD experienced an aggressive decline before finding its feet at 1.0722, a region that also held strong in February. Despite its attempt to rebound, the pair has met strong resistance at the congested region that includes both the 50- and 200-day simple moving averages (SMAs) as well as the lower boundary of the Ichimoku cloud.
Should the recovery falter, the pair might test the February-March support of 1.0795. Sliding beneath that floor, the price may descend towards the recent bottom of 1.0722, which also provided support in December and February. Even lower, the 2024 low of 1.0693 could provide downside protection.
Alternatively, should the bulls conquer the converging SMAs, the recent resistance of 1.0875 could curb initial advances. A break above that region could pave the way for a series of lower highs such as 1.0941, 1.0963 and 1.0980 that constitute a descending trendline.
In brief, EURUSD has been rangebound in the last couple of sessions as moves both to the upside and downside got rejected. Meanwhile, the completion of a death cross between its 50- and 200-day SMAs could potentially trigger a new round of weakness.
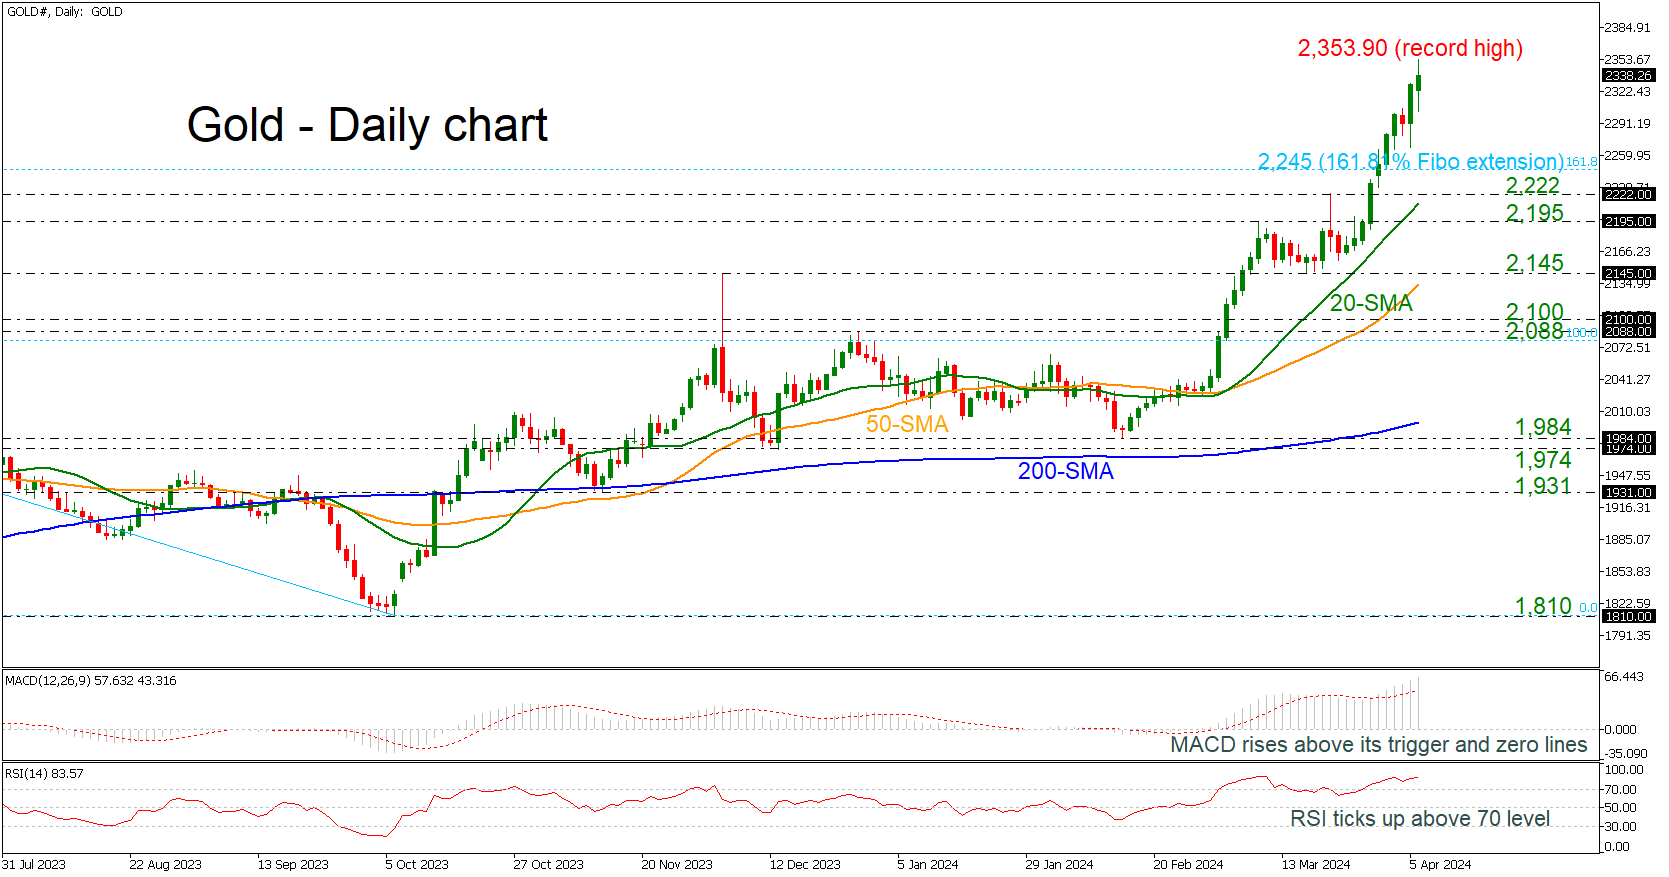
Gold Unlocks Fresh All-time High Again
- Gold reaches 2,353.90 above 161.8% Fibonacci extension
- MACD and RSI move higher in overbought regions
Gold prices are experiencing a fresh higher high today around the 2,353.90 level, successfully surpassing the 161.8% Fibonacci extension level of the downward move from 2,079 to 1,810 at 2,245.
The bullish rally started after the rebound off the 1,984 support with the technical oscillators suggesting even further upside structure. The MACD is standing above its trigger and zero lines, while the RSI is pointing up in the overbought territory.
As the price is moving higher, the next resistance levels to have in mind is the psychological number of 2,400 ahead of the 261.8% Fibonacci extension of 2,515.
On the flip side, a dive beneath the 161.8% Fibonacci of 2,245 could take the market towards the immediate support lines of 2,222 and 2,195, which encapsulates the 20-day simple moving average (SMA) at 2,213. Below that, the 2,145 barricade and the 50-day SMA at 2,134 may halt bearish actions.
Summarizing, the broader outlook in the precious metal is strongly positive and only a decline beneath the 200-day SMA, which is standing at 1,999 may switch the view to a bearish one.