Sample Category Title
Gold Hits New Record High Amid Favourable Factors
Gold's price soared to a new record high on Monday, stabilising around 2344.00 USD per troy ounce. A confluence of factors is currently bolstering the precious metal's value.
Geopolitical tensions in the Middle East are a significant driver, positioning gold as a preferred "safe-haven" investment. Additionally, central banks worldwide are increasing their gold reserves, while global exchange-traded funds (ETFs) that track the metal's price continue to show keen interest.
Recent US job market data for March surpassed expectations, indicating a robust end to the first quarter for the US economy. These developments could impact the Federal Reserve's interest rate decisions, as lower rates diminish the opportunity cost of holding gold, further supporting its price increase.
Since the start of the year, gold has appreciated over 12% in value, showcasing an impressive performance for what is traditionally viewed as a conservative asset.
XAU/USD technical analysis
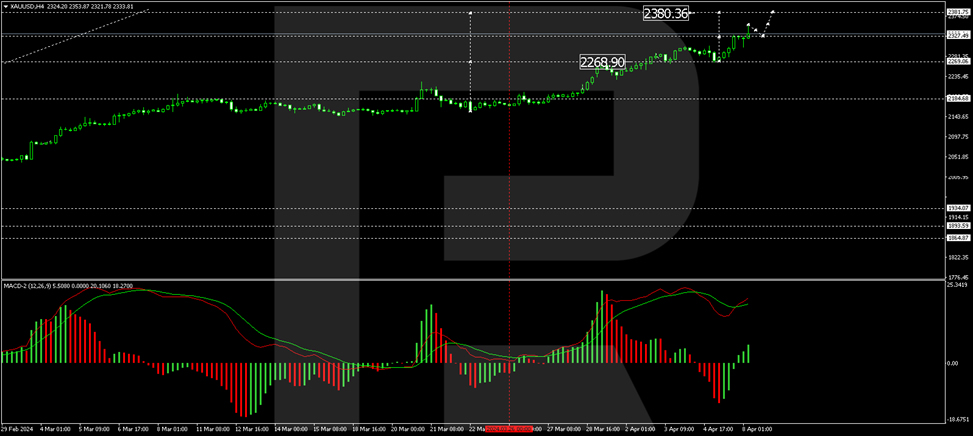
The H4 chart for XAU/USD indicates that a growth wave reached 2330.00, followed by the formation of a consolidation range around this level. This range has now expanded to 2353.85. A technical retracement to 2330.00 is anticipated (testing from above), with potential subsequent growth to 2380.33 as a local target. The MACD indicator, with its signal line well above zero and pointing upwards, supports this growth scenario.
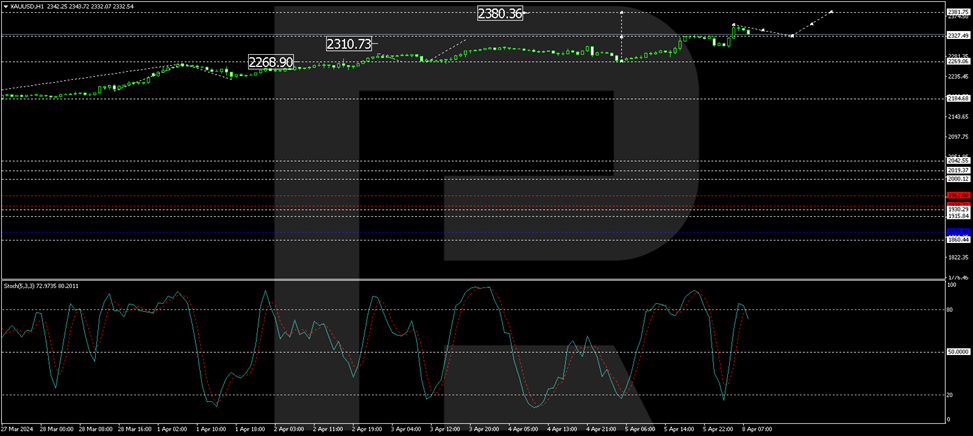
On the H1 chart, XAU/USD established support at 2269.00, completing a growth structure to 2330.53. A consolidation range has formed around this level, now extended to 2353.85. A corrective move to 2327.50 (testing from above) is expected, potentially leading to a new growth wave towards 2386.36. This forecast is confirmed by the Stochastic oscillator, with its signal line preparing to drop to 50 before climbing back to 80.
SPX 500: Fed Dovish Pivot Narrative is at Risk
- Higher oil prices have led to higher inflationary expectations in the US via the breakeven rates.
- Recent rise in inflationary expectations coupled with recent “less dovish” Fed Speak from Fed officials Kashkari, and Bostic has revived the “higher for longer” interest rates environment.
- Higher commodities prices led by oil may see an uptick in US CPI data.
- Potential negative implication for S&P 500 as its recent steep rally from the October 2023 low has reached an extremely overbought technical level.
Last week, we witnessed several key events, economic data releases, and intermarket price action movements that may lead to a repositioning and rethinking of the earlier much hyped-up, Fed’s dovish pivot narrative that supported a resurgence of broad-based risk-on behaviour after the Fed’s FOMC monetary policy meeting in December last year.
Federal Reserve Bank of Minneapolis President Kashkari has joined the “less dovish outlier” camp together with his colleague, Fed Atlanta President Bostic who advocated the Fed should be more patient in cutting its Fed funds rate this year, and Kashkari has turned out to be the “most hawkish” official at this juncture as his public speech on last Thursday, 4 April stated that that interest rate cuts may not be needed in 2024 if progress on fighting inflation has stalled, especially if the US economy remains in a robust state.
This latest rhetoric and guidance from Fed officials Kashkari and Bostic have paled against Fed Chair Powell’s insistence that Fed funds rate cuts are likely to take place this year, and potentially three cuts before 2024 ends after the recently concluded FOMC meeting in March.
Less dovish Fed officials’ guidance and rosy March’s NFP have pushed back rate cuts expectations
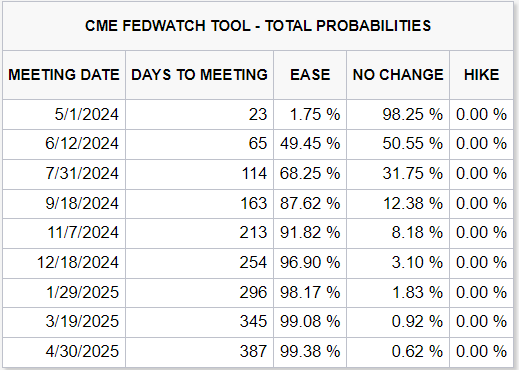
Fig 1: Probability of Fed funds rate outcome as of 8 Apr 2024 (Source: CME FedWatch Tool, click to enlarge chart)
Coupled with the latest red-hot US non-farm payroll jobs data for March that surpassed expectations significantly; +303K versus consensus of +200K, and above February’s print of +270K. Also, the upbeat March’s NFP data saw the highest number of jobs added in the past ten months.
All in all, the expectation of the first Fed rate cut has been dialled back again, right now market participants in the Fed funds rate futures market have pushed back the first interest rate cut in the US to occur in July’s FOMC with a probability of 68% (see Fig 1) while the probability of a rate cut in June FOMC has been reduced to 49% from an earlier chance of 76% right after the recent 20 March FOMC meeting based on data obtained from CME FedWatch Tool.
The crux is likely rising inflationary expectations due to higher WTI oil prices
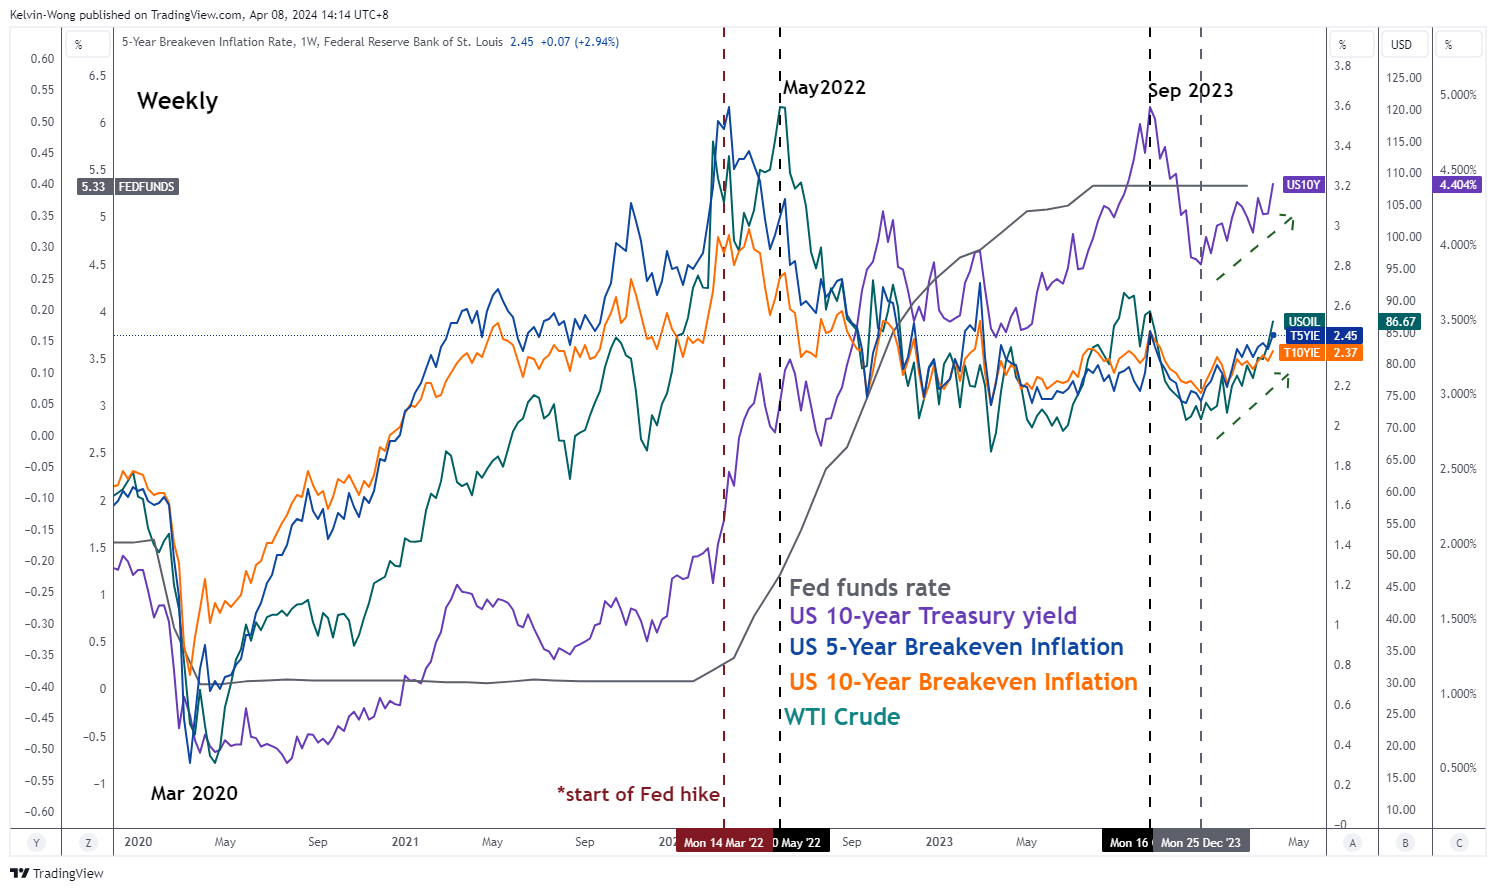
Fig 2: Correlation movements of US 5-year & 10-year breakeven inflation rates with WTI crude & US 10-year Treasury yield as of 5 Apr 2024 (Source: TradingView, click to enlarge chart)
Based on recent past data since the start of the latest Fed funds rate hike cycle that occurred in mid-March 2022, the rallies seen in both the US 5-year and 10-year breakeven inflation rates (in a nutshell, the breakeven rates are inferred as forward-looking 5-year and 10-year inflationary expectations from today based on market transacted prices derived from US Treasury Inflation-Protected Securities, TIPS) preceded the start of the interest rate hike cycle.
On a closer examination, the movement of West Texas crude oil (WTI) has a direct correlation with both the US 5-year and 10-year breakeven rates where three of them rose significantly in unison from November 2021 to February 2022 before the Fed hiked rates.
Right now, the 5-year and 10-year breakeven rates may have formed a medium-term bottom on 25 December 2023 as it rallied by 33 bps to 21 bps to 2.45% and 2.37% respectively in line with a rally of +24% seen in WTI crude oil which in turn also pushed up the US 10-year Treasury yield to a five-month high at 4.40% on last Friday, 5 April (see Fig 2).
Potential implications (1) – Higher US CPI may revive the higher for longer interest rates narrative
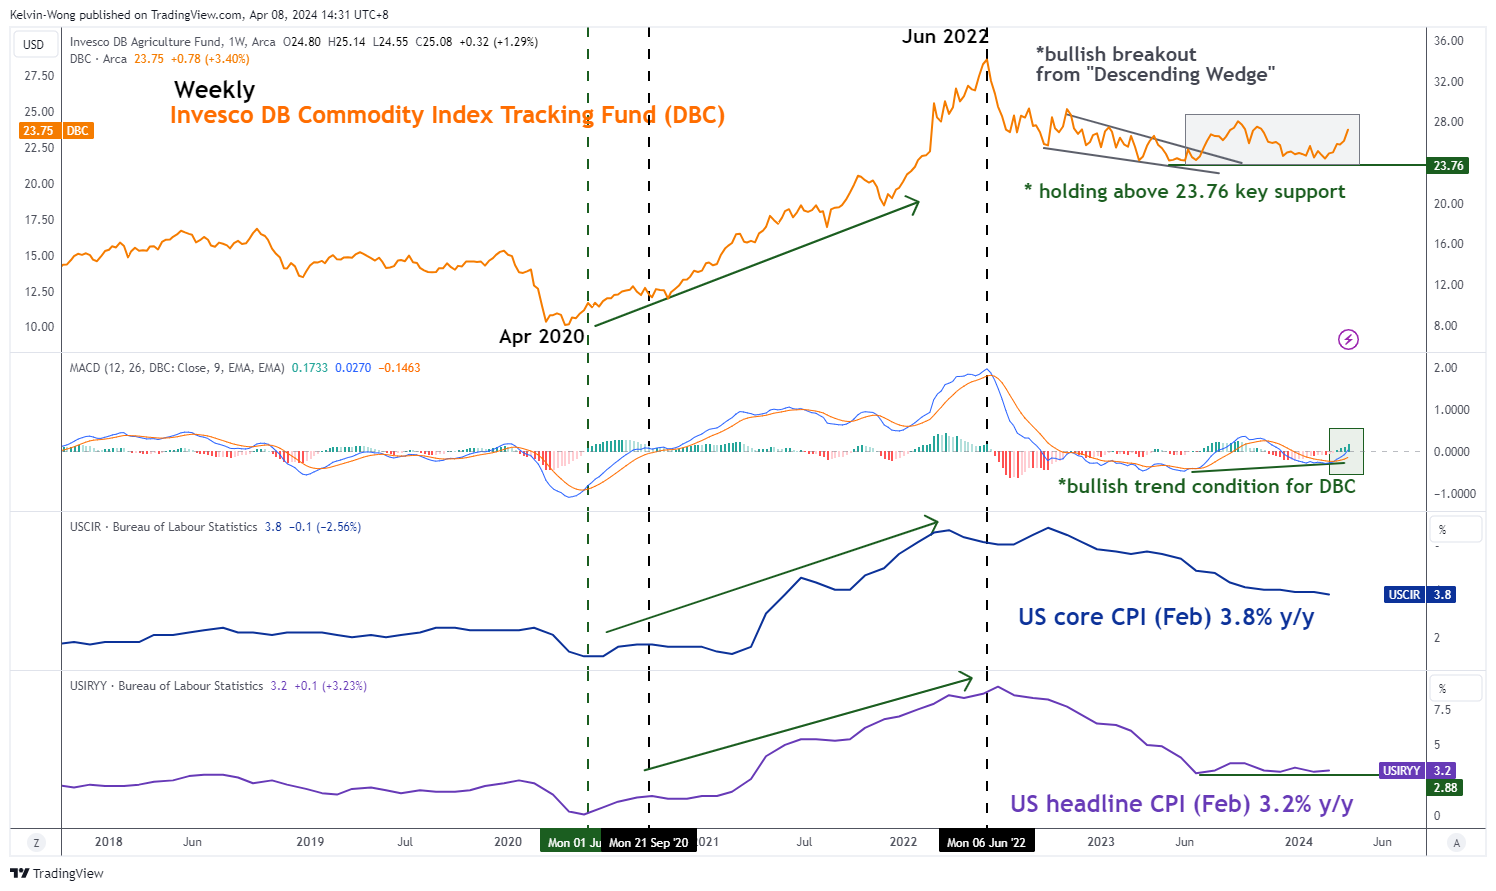
Fig 3: Invesco DB Commodity Index Tracking Fund major trend with US CPI as of 5 Apr 2024 (Source: TradingView, click to enlarge chart)
An important point to note is CPI data that gauges inflationary trends are lagging in nature as they are calculated based on prior month prices of a basket of selected goods and services.
Market-transacted prices of commodities are likely to be more forward-looking and can have a significant impact on the CPI-inflationary trends that manifest in the following months thereafter.
Headline inflation or primarily goods-based inflation (including food & energy) has a high direct linkage to prices of tradable commodities.
Using the Invesco DB Commodity Index Tracking Fund (DBC), a broad-based commodities futures exchange-traded fund with its highest weightage holding of 56% concentrated in energy-related futures and 21% (second highest) weightage in agriculture-related futures in conjunction with the trend movements of both the US headline and core CPI y/y rates to conduct an intermarket analysis (see Fig 3).
Based on historical price actions, movements seen in the DBC tend to lead over the headline and core CPI inflation trends. Before the prior significant upsurge in the US inflation rates from September 2020 to June 2022, the weekly MACD trend indicator of the DBC flashed a bullish crossover signal earlier in June 2020 that preceded the change of DBC’s major trend from bearish to bullish.
A new positive element has been detected in the most recent movement of the weekly MACD trend indicator of DBC where it has flashed out a bullish crossover condition and inched higher above its zero-centreline last week. These observations suggest a potential emergence of a major uptrend phase for DBC.
If history plays out again, the current positive momentum element inherent in the DBC may lead to at least a further potential medium-term upmove in DBC which in turn could translate to a possible uptick in inflationary pressures in the real economy in H2 2024 that may put the Fed dovish pivot narrative in jeopardy, and further reduces the expected number of Fed funds rate cut in 2024.
Potential implications (2) – Higher oil prices may trigger a multi-week corrective decline in the S&P 500
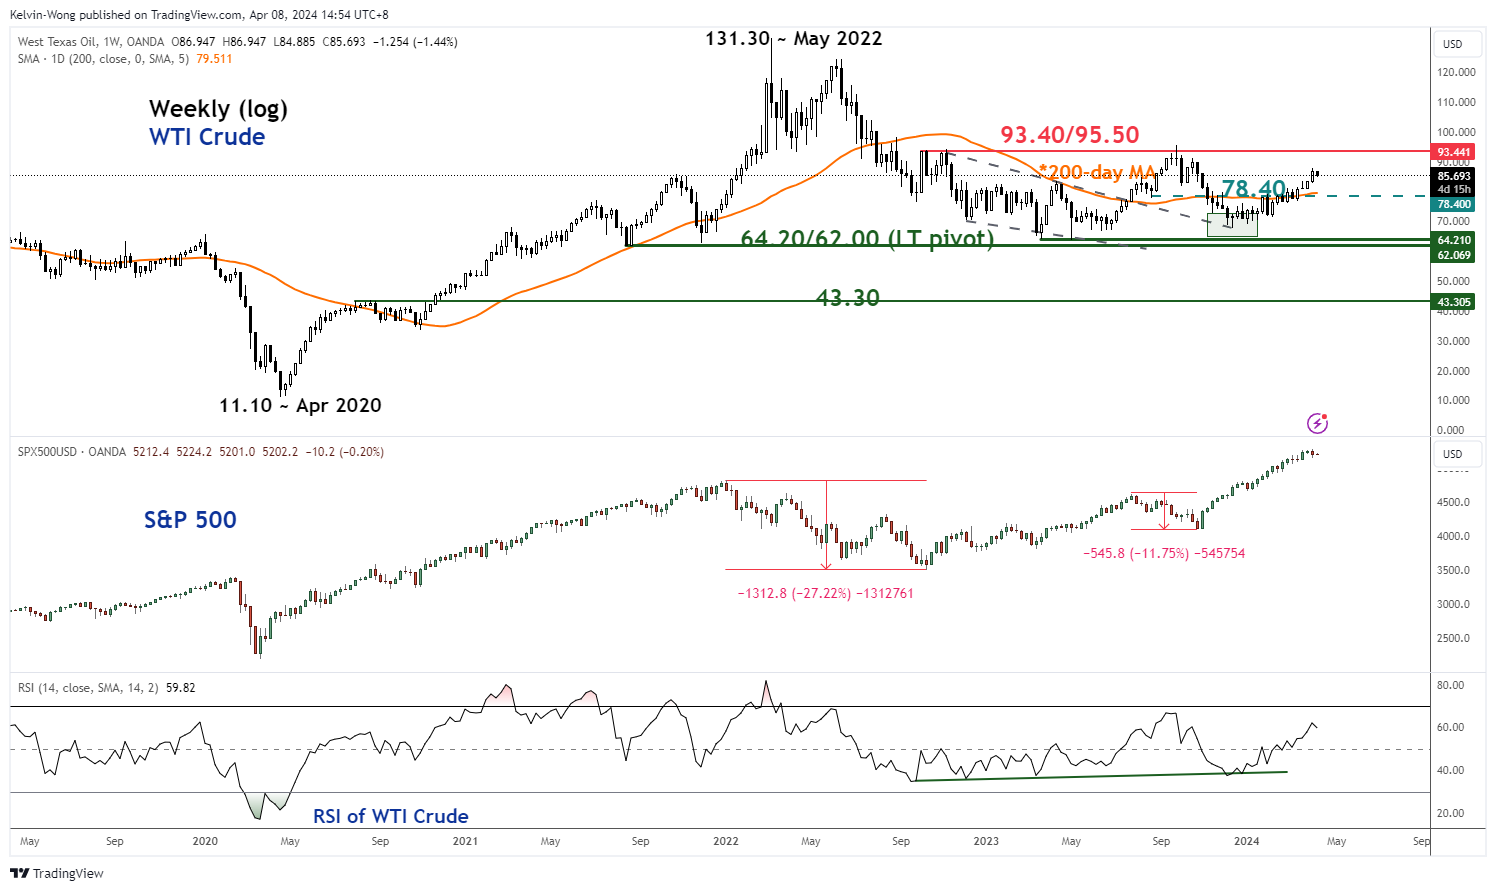
Fig 4: WTI crude major trend with S&P 500 as of 5 Apr 2024 (Source: TradingView, click to enlarge chart)
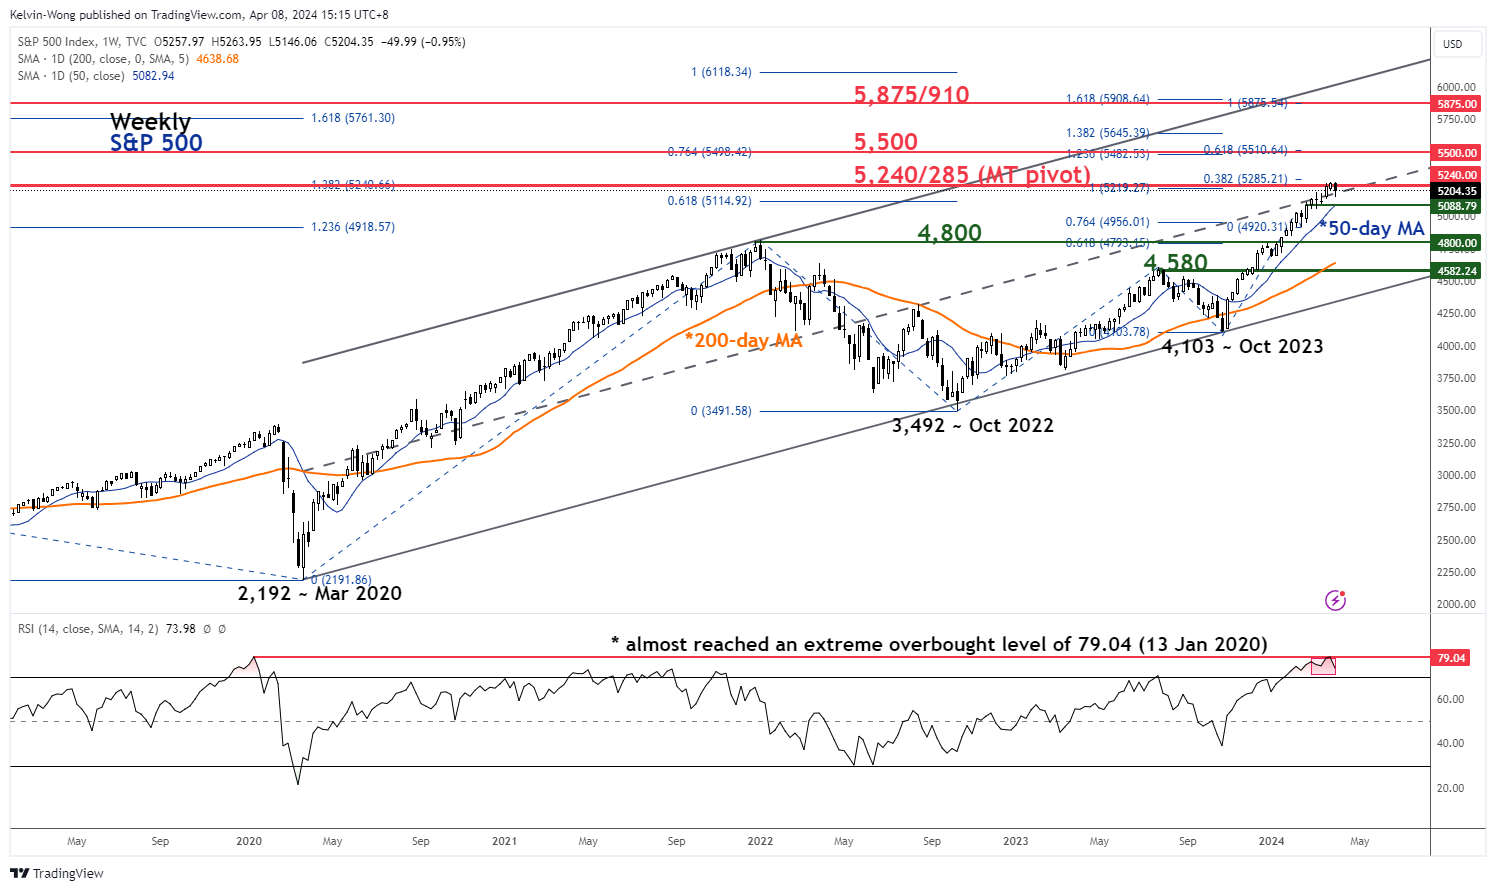
Fig 5: S&P 500 major trend as of 5 Apr 2024 (Source: TradingView, click to enlarge chart)
Based on correlation analysis, the prior major uptrend phase of WTI crude from April 2020 to May 2022 has led to adverse movement in the S&P 500 with a lead time as the S&P 500 shaped a medium-term multi-week corrective decline of -27% thereafter from January 2022 to October 2022.
A smaller scale rally in oil prices was also seen most recently in the late summer months of last year when WTI crude broke above its 200-day moving average and rallied from July 2023 to September 2023, and during this period, the S&P 500 shaped a corrective decline of -12%.
Interestingly, bullish momentum has resurfaced in WTI crude as it continued to rally for four weeks after it broke above its 200-day moving average again in late February 2024 within a potential major basing configuration that has now formed since March 2023 (see Fig 4).
In addition, the daily RSI momentum indicator of the S&P 500 has almost reached an extreme outbought level of 79.04 last seen on 13 January 2020 which increases the odds that a medium-term multi-week corrective decline may unfold next after a steep rally of +28% from October 2023 swing low (see Fig 5).
Watch the 5,280 key medium-term pivotal resistance, and a break below the 50-day moving average now acting as a support at around 5,090 may expose the next medium-term support of 4,800.
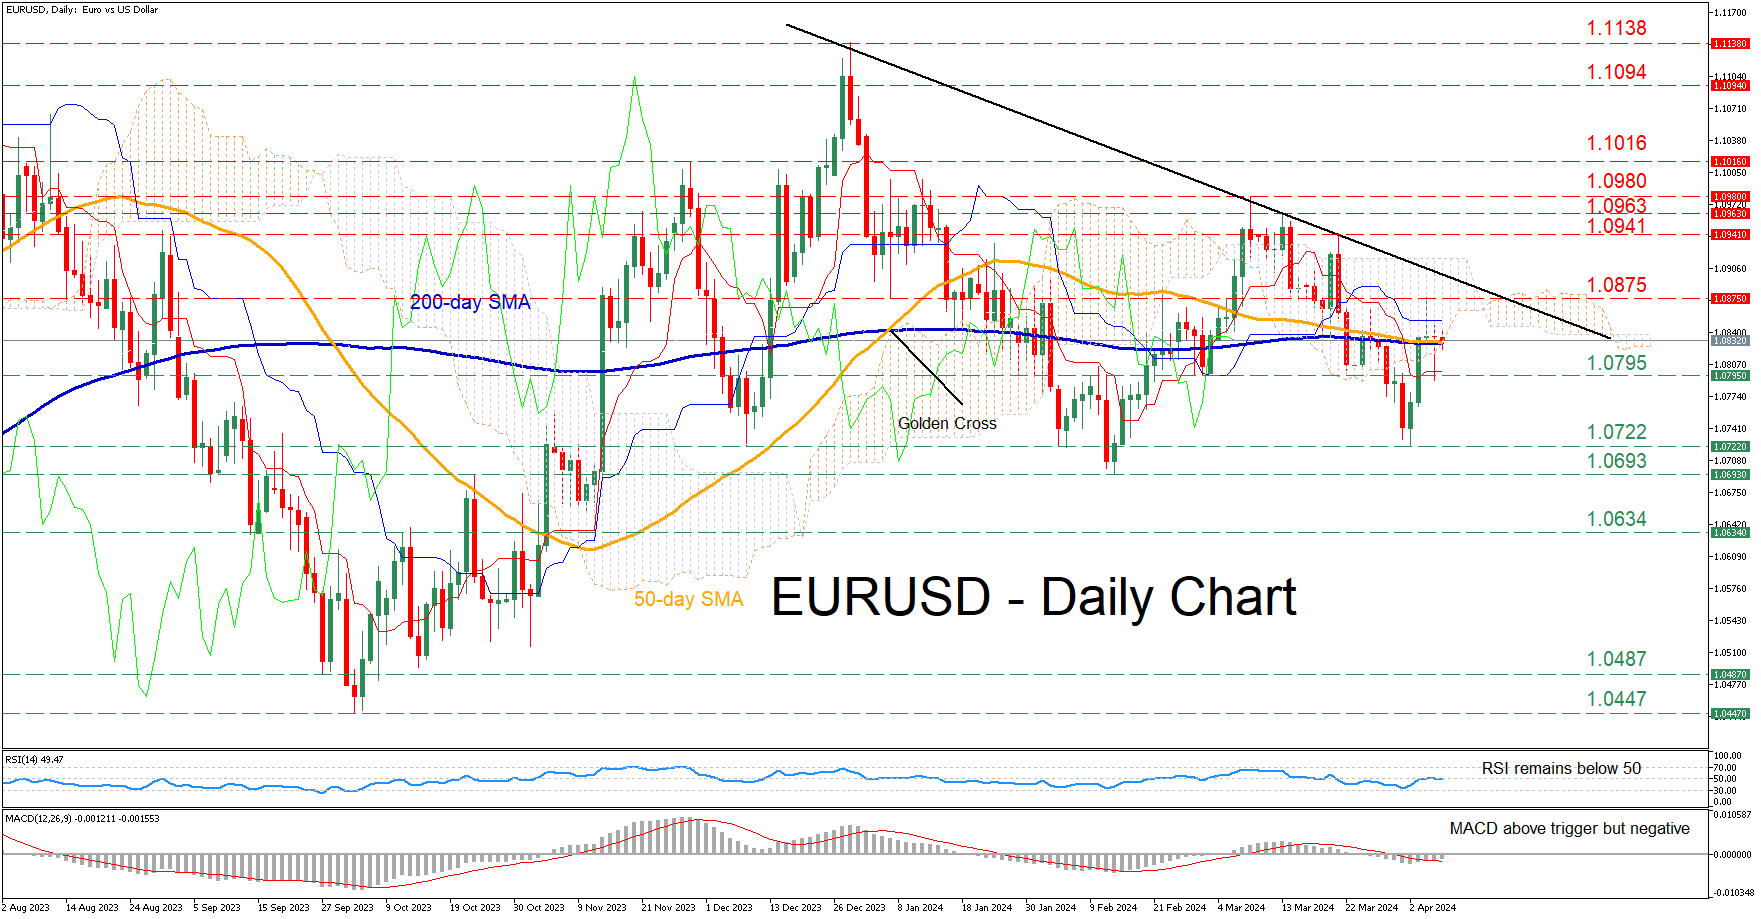
EURUSD Undecided Near Converging SMAs
- EURUSD fluctuates near its 50- and 200-day SMAs
- Forms two successive doji candles, unable to adopt a direction
- Momentum indicators strengthen but remain negative
EURUSD experienced an aggressive decline before finding its feet at 1.0722, a region that also held strong in February. Despite its attempt to rebound, the pair has met strong resistance at the congested region that includes both the 50- and 200-day simple moving averages (SMAs) as well as the lower boundary of the Ichimoku cloud.
Should the recovery falter, the pair might test the February-March support of 1.0795. Sliding beneath that floor, the price may descend towards the recent bottom of 1.0722, which also provided support in December and February. Even lower, the 2024 low of 1.0693 could provide downside protection.
Alternatively, should the bulls conquer the converging SMAs, the recent resistance of 1.0875 could curb initial advances. A break above that region could pave the way for a series of lower highs such as 1.0941, 1.0963 and 1.0980 that constitute a descending trendline.
In brief, EURUSD has been rangebound in the last couple of sessions as moves both to the upside and downside got rejected. Meanwhile, the completion of a death cross between its 50- and 200-day SMAs could potentially trigger a new round of weakness.
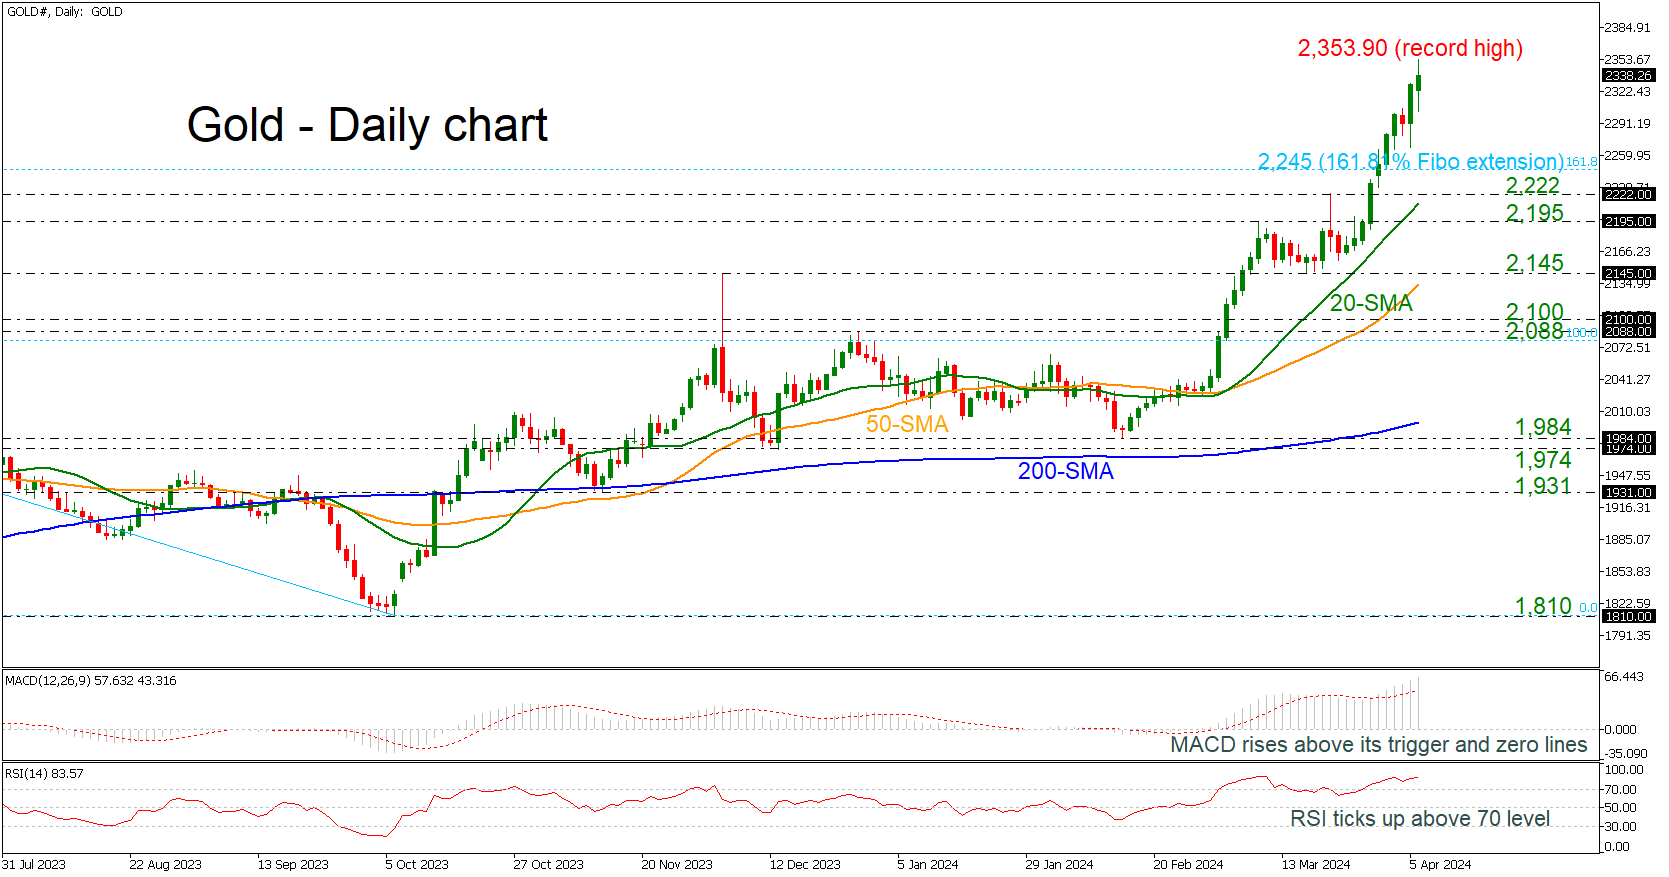
Gold Unlocks Fresh All-time High Again
- Gold reaches 2,353.90 above 161.8% Fibonacci extension
- MACD and RSI move higher in overbought regions
Gold prices are experiencing a fresh higher high today around the 2,353.90 level, successfully surpassing the 161.8% Fibonacci extension level of the downward move from 2,079 to 1,810 at 2,245.
The bullish rally started after the rebound off the 1,984 support with the technical oscillators suggesting even further upside structure. The MACD is standing above its trigger and zero lines, while the RSI is pointing up in the overbought territory.
As the price is moving higher, the next resistance levels to have in mind is the psychological number of 2,400 ahead of the 261.8% Fibonacci extension of 2,515.
On the flip side, a dive beneath the 161.8% Fibonacci of 2,245 could take the market towards the immediate support lines of 2,222 and 2,195, which encapsulates the 20-day simple moving average (SMA) at 2,213. Below that, the 2,145 barricade and the 50-day SMA at 2,134 may halt bearish actions.
Summarizing, the broader outlook in the precious metal is strongly positive and only a decline beneath the 200-day SMA, which is standing at 1,999 may switch the view to a bearish one.
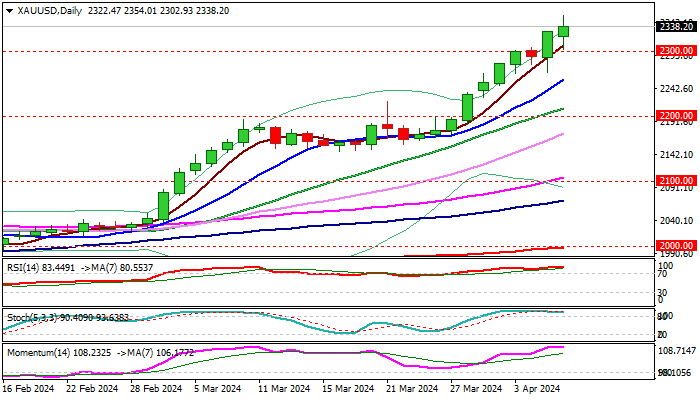
XAU/USD: Gold Hits New Record High Above $2,300
Gold continues to trend higher and posted new record high ($2354) in early Monday trading, in extension of last week’s 4% advance, which generated strong bullish signal on weekly close above psychological $2300 barrier.
The metal remains well supported by strong safe-haven demand, as well as expectations that the Fed will cut rates (as early as June) which deflates dollar.
Gold gained almost 14% since the start of the year, with the strongest acceleration higher seen in March, when the price rose nearly 10%, marking the biggest monthly gains since July 2020.
Bulls firmly hold grip despite strongly overbought technical studies (day/week/month) and eye next target at $2400, but some corrective action should be anticipated.
Broken $2300 barrier reverted to initial support, followed by rising 10DMA ($2256) and strong supports at 2200 zone (rising 20DMA / psychological) which should contain dips and mark a healthy correction of a larger uptrend.
Res: 2354; 2400; 2426; 2500.
Sup: 2300; 2256; 2222; 2200.
BTC/USD Analysis: Bitcoin Price Rises Ahead of Halving
The halving (reduction of block mining rewards) is expected to occur on April 19-20.
Theoretically, Bitcoin mining will become less profitable, leading to a reduction in coin supply. Given unchanged demand, this should drive up the BTC/USD price. Ripple CEO Brad Garlinghouse has forecasted that the cryptocurrency market cap will double by the end of 2024, reaching $5 trillion, with Bitcoin's halving contributing to this growth.
In practice, Bitcoin price is influenced by too many factors to conclusively prove the bullish impact of halving. For instance, looking at history, the last halving occurred on May 11, 2020, and the price increased by approximately 12% in the following week. On the other hand, today's Bitcoin price might already reflect the imminent halving.
Nevertheless, the market currently shows predominantly positive sentiment, as over the weekend, BTC/USD price rose by around 2.5%.
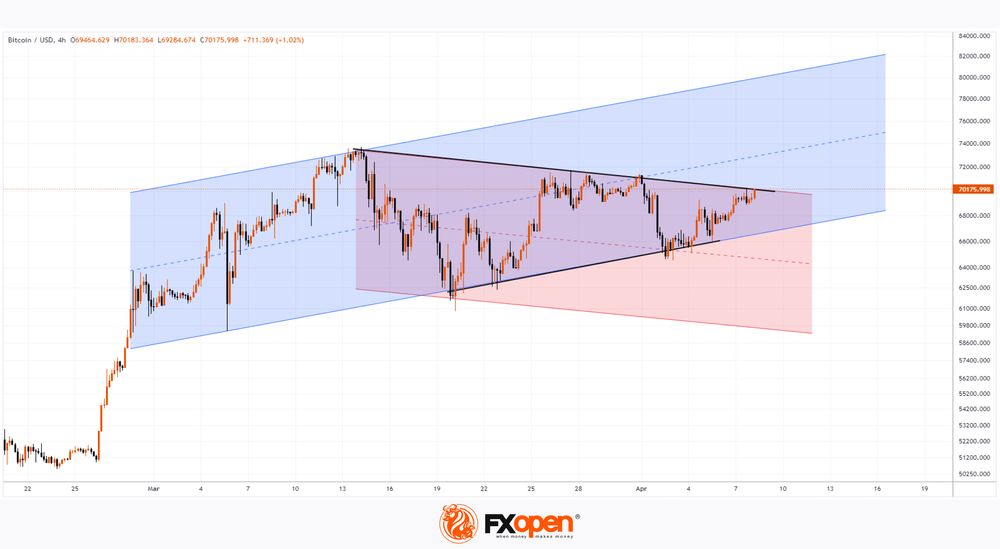
According to the technical analysis of the BTC/USD chart today:
→ From April 2-4, there was no downward pressure on the market to push the price below the lower boundary of the ascending channel (shown in blue), which remains relevant.
→ Conversely, a series of higher lows forming since April 2 indicates bullish intentions to break above the descending channel (shown in red).
Therefore, the approaching halving and associated positive expectations could lead to:
→ Breaking above the consolidating zone (shown with black lines).
→ Overcoming a significant resistance level near the psychological mark of $70,000 per coin.
In this scenario, the nearest target for bulls could be the median line of the blue ascending channel.
FXOpen offers the world's most popular cryptocurrency CFDs*, including Bitcoin and Ethereum. Floating spreads, 1:2 leverage — at your service. Open your trading account now or learn more about crypto CFD trading with FXOpen.
*At FXOpen UK and FXOpen AU, Cryptocurrency CFDs are only available for trading by those clients categorised as Professional clients under FCA Rules and Professional clients under ASIC Rules respectively. They are not available for trading by Retail clients.
This article represents the opinion of the Companies operating under the FXOpen brand only. It is not to be construed as an offer, solicitation, or recommendation with respect to products and services provided by the Companies operating under the FXOpen brand, nor is it to be considered financial advice.
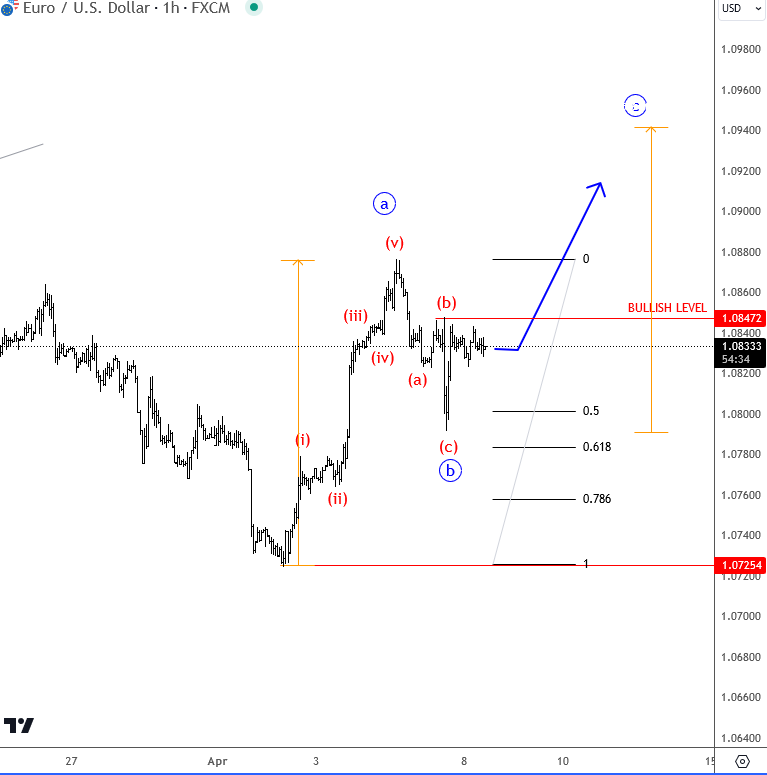
EUR/USD: Short-term bullish, till ECB
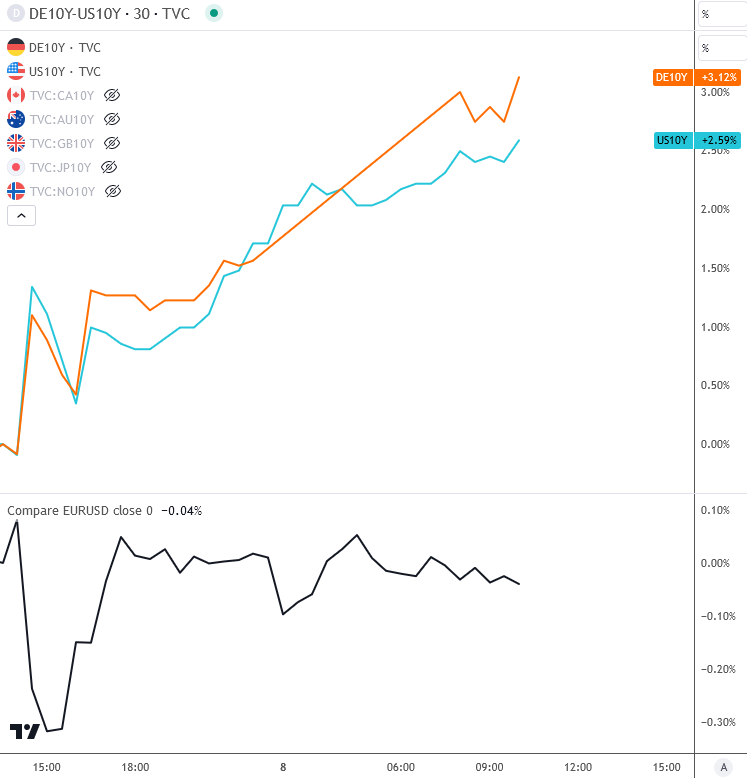
EURUSD stabilized last week, firstly with five five waves up from 10725 which marks an important short-term low, and then bounced after a wave set-back despite strong US jobs data. We see nice wave b correction that is now pointing to higher prices near-term only; possibly wave C up to 1.09-1.0940 area till ECB this Thursday. A slightly higher rates in Germany compared to one in US can be one of the reasons why EURUSD pair holds the support.
US Money Markets Increasingly Push a First Cut by Fed Further into Time
Markets
Friday’s March payrolls were strong across the board. Employment topped all estimates by growing 303k, wage growth was solid and the unemployment rate eased back to 3.8% despite an uptick in the participation rate. The first Fed governors commenting after the release erred to the hawkish side. Dallas president Logan said there’s no urgency in cutting rates, adding that the risk of cutting too soon is higher than being late. She’s worried about disinflation stalling. Fed governor Bowman continues to see upside inflation risks and isn’t comfortable with cutting until disinflation returns. Both Logan and Bowman stated the possibility of a higher neutral rate, which would limit the Fed’s overall cutting capacity. US yields across the maturity spectrum revisited the YtD highs. We expected the break higher would need confirmation from Wednesday’s US CPI (March). Yet, it’s already happening as we speak. Granted, Asian dealings usually just pick up where US financial markets left off but the technical breaks are there. Apart moving beyond the YtD high, the US 2-y yield also surpasses resistance from the 200dMA to trade around 4.78%. The 10-y tenor jumped above the 4.40% resistance (50% recovery on the 2023Q4 decline) this morning and eked out further gains to a new 2024 high. US money markets increasingly push a first cut by the Fed further into time and will look for additional evidence supporting their case in a reaccelerating (headline) CPI. The dollar neither on Friday neither this morning really stands to benefit from the yield support, despite being driven by the real component and concentrating at the front-end of the curve (>10 bps). EUR/USD rebounded from an intraday-low just south of 1.08 to close unchanged at 1.0837. It’s hanging around these levels this morning. Rising German yields offer only part of the explanation since the move higher was only a fraction of what happened in the US (1.2-3.9 bps). A surprisingly resilient risk environment (US stock markets rose up to 1.2%) is a second piece of the puzzle. Equally astounding is the ongoing rally in gold, with new record highs for the shiny metal (again) today. Oil prices retreated sub $90/barrel with a partial retreat by Israeli forces from southern Gaza easing some of the geopolitical/supply concerns. Other than inflation figures in the US, the eco calendar gives the stage to the ECB on Thursday. Frankfurt won’t have the desired wage negotiation data by then, giving Lagarde an easy way out of tricky questions. It does have input from the Bank Lending Survey (Tuesday). The central bank of Canada and New Zealand both meet on Wednesday and US banks kick off the Q1 earnings season on Friday. A slew of Fed speeches are scattered across the week.
News & Views
Peter Pellegrini has won the presidential elections in Slovakia this weekend as he defeated the pro-Western candidate Ivan Korcok. Pellegrini is an ally of Prime Minister Robert Fico and is seen as Russia-friendly. Pellegrini secured 53.1% of the votes. Even as the president in Slovakia has only limited executive powers, the victory of Pellegrini is seen as supporting a policy of the country further withdrawing its support for Ukraine. Pellegrini who, as a president, can veto laws and can nominate judges, also might support reforms of the government with respect to criminal law and media that might be contested by the EU. Despite his Pro-Russian, Ukraine sceptic stance, Pellegrini reiterated that Slovakia will remain a strong member of EU and Nato.
In a news conference on Friday, Governor of the National Bank of Poland (NBP) Glapinski said that the NBP didn’t discuss rate cuts at last week’s policy meeting. He even indicated that no one is talking about 2024 rate cuts altogether. The room for rate cuts in 2025 will depend on the inflation figures at the end of this year. Glapinski reiterated that there is still a high the degree of uncertainty. Polish CPI in Q4 is seen in a wide range between 3.9% (if anti-inflation measures are maintained) and 7.5% (if fully removed). Glapinski sees current decline in inflation as temporary (1.9% Y/Y in March) as higher VAT on food prices will filter through in coming months. Glapinski is also worried about the inflationary impact of real wages rising fast together with a reacceleration of the economy. Polish 2-y swap yields jumped 9 bps Friday afternoon (5.43%), even as this was partially due to the overall rise in core yields post strong US payrolls. The zloty remains well bid. At EUR/PLN 4.28, the Polish currency is holding within reach of the strongest levels against the euro since February 2020. (YTD low 4.2749).
Will German Industry Continue to Look Weak
In focus today
Today, we look out for German industrial production data for February, which will give more information on the state of the German industry that is still very weak.
The first round of the central wage settlement in Norway is now underway. The framework for the settlement in the manufacturing sector is stated by the parties to involve a wage increase of 5.2 % this year, given that the wage drift will be as expected. This settlement works as a blueprint for the settlements in other sectors as well, so we expect that this estimate will stand when all the settlements are finished. In that case, this will be a bit higher than Norges Bank assumed in its March monetary policy report of 4.9% and will probably add to the recent reprising of cut expectations even in Norway.
Riksbank Governor Erik Thedéen is giving three speeches today, which largely deal with the standard theme of the economic situation and current monetary policy and are therefore not expected to differ remarkably.
The main events this week are US March CPI on Wednesday, and policy rate decisions from both New Zealand (Tuesday night) and the ECB (Thursday). We expect both to keep rates unchanged. We have gotten strong hints from the ECB that it will deliver its first rate cut in June, so the primary insight from Thursday's meeting will be whether they confirm this stance.
Economic and market news
What happened over the weekend
After gaining 4% last week, oil prices declined overnight with the Brent price dropping 1.6% to 89.71 USD/bbl as of this morning. This is due to expectations of easing tensions in the Middle East after Israel and Hamas committed to new peace talks in Egypt.
What happened Friday
Markets scaled back US rate cut expectations after the March non-farm payrolls figure exceeded expectations at +303,000 (consensus: +200,000). The jobs report also showed that average hourly earnings increased 0.3% m/m. This suggests that wage sum growth accelerated which is a concern for the Fed from an inflation perspective. We also got hawkish comments from the Fed's Logan and Bowman, with the latter saying that "inflation progress has stalled". USD was initially stronger but reversed and ended the day broadly unchanged, while the 2Y treasury added 9bp.
Bank of Japan governor Ueda said he expected inflation to accelerate from "summer towards autumn" due to the large wage increases agreed to during union negotiations in March. He reiterated that another rate hike would be data dependent but that it is on the table if the 2% inflation target is sustainably achieved.
Equities: Global equities ended higher on Friday, but lower for the week. Interesting on Friday was the reaction to the jobs report. At first glance, the very strong report sent yields higher while equity investors saw it as "too strong" and reacted negatively. However, later into the US cash session, equities turned around and ended sharply higher led by cyclical growth stocks. This is more or less how we see the coming period where strong macro data should continue to support risky assets while higher yields should be a temporary challenge. Asian markets are mostly higher this morning led by Japan. European futures are higher as well while US futures are lower.
FI: The main event this week is the ECB meeting on Thursday, where we look for a "confirmation" of a rate cut in June as discussed in our ECB preview as well as RTM Euroland, where we also discuss the outlook and market impact for a downgrade of France. The other main event is the US CPI data released on Wednesday together with the minutes of the latest FOMC meeting. If the data continues to surprise on the upside the market is expected to price out more rate cuts in 2024. This should put upwards pressure on US Treasury yields as seen last week, where 10Y Treasury yields rose some 20bp.
FX: EUR/USD ended the week slightly higher above the 1.08 mark after the stronger-than-expected US jobs report on Friday. Intervention talks sent USD/JPY a bit lower on Friday, but the move reversed, and the cross is trading just below 152 again. The Scandies had a good week, with both the NOK and the SEK appreciating against the EUR and the USD. EUR/NOK declined to around 11.60, while EUR/SEK fell to around 11.50. EUR/GBP trended higher for most of last week and ended around 0.8580.
GBP/JPY Daily Outlook
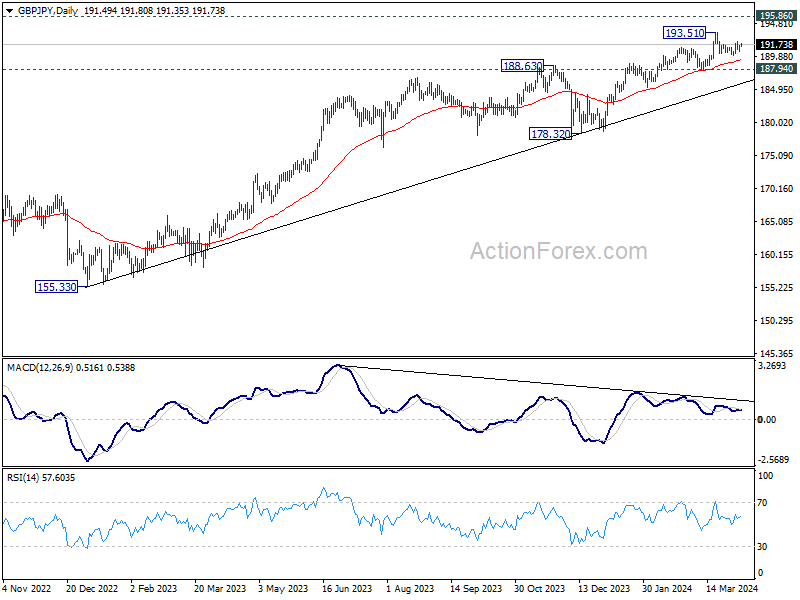
Daily Pivots: (S1) 191.00; (P) 191.31; (R1) 191.95; More.....
Intraday bias in GBP/JPY remains neutral and more consolidations could be seen below 193.51./ On the upside, break of 193.51 will resume larger up trend to 195.86 long term resistance. On the downside, though, break of 190.02 will turn bias to the downside for 187.94 support instead.
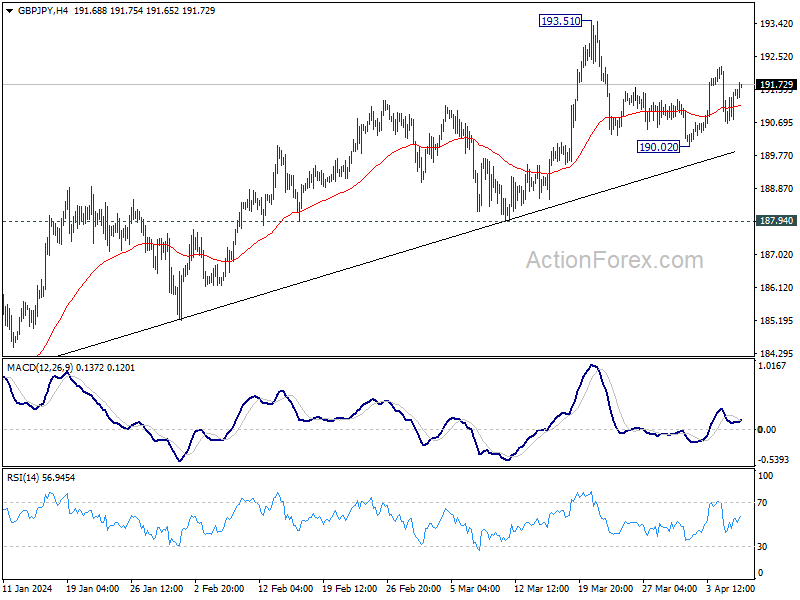
In the bigger picture, current rally is part of the up trend from 123.94 (2020 low), and is in progress for 195.86 long term resistance (2015 high). Break of 187.94 support is needed to be the first sign of medium term topping. Otherwise, outlook will remain bullish in case of retreat.