Sample Category Title
Forex and Cryptocurrency Forecast
EUR/USD: The Dollar Weakness Puzzle
What transpired with the EUR/USD pair last week? It behaved as expected on Monday, 01 April. However, starting from Tuesday, the situation deviated. Let's delve into the details. On the first day of April, data on business activity in the US industrial sector from the ISM for March showed the economy is on the rise: PMI increased from 47.8 to 50.3 points, crossing the 50-point threshold that separates growth from contraction. This marked the end of a downward trend lasting over 15 months. With this sector accounting for over 10% of the US GDP, the PMI growth is a vital indicator of an economy that easily withstands high interest rates. Thus, logically, this data benefited the dollar, pushing the pair to 1.0730 - its lowest since 15 February. The escalation of tensions in the Middle East also supported the strengthening of the American currency as a safe haven.
On the following day, Tuesday, preliminary data on inflation in Germany was released. The Consumer Price Index (CPI) in this powerhouse of the European economy showed a monthly increase of 0.4%, below the forecast of 0.6%. Year-on-year inflation slowed from 2.5% in February to 2.2% in March – the lowest since May 2021. The Harmonised Index of Consumer Prices (HICP) fell from 2.7% to 2.3%. Such a slowdown in inflation should have fuelled hopes for the ECB to soon start cutting rates, thereby weakening the euro further. However, instead of continuing its downward movement, EUR/USD reversed and moved north.
Wednesday revealed that inflation is declining not just in Germany but across the Eurozone as a whole. Year-on-year, the preliminary Core Consumer Price Index dropped from 3.1% to 2.9%, surpassing the expectations of 3.0%, and the CPI fell from 2.6% to 2.4% (y/y). Despite this, EUR/USD continued its stubborn climb.
The dollar was not aided by another batch of strong data from the US either. Published macroeconomic figures showed that the number of JOLTS job openings rose to 8.756 million in February compared to 8.748 million the previous month, better than the market forecast. Moreover, the volume of manufacturing orders in February increased by 1.4% after a decrease of 3.8% at the beginning of the year.
A trend reversal began to emerge following speeches by US Federal Reserve officials. For instance, Loretta Mester, President of the Cleveland Fed, stated that the central bank sees a significant risk in easing national monetary policy too soon, especially in the context of a strong labour market and steady economic growth. Jerome Powell, Chair of the Federal Reserve, echoed this sentiment in a speech at the Stanford Graduate School of Business, reiterating that there is no rush to cut rates as inflationary risks persist.
The situation returned to a logical path with a new batch of data from the US labour market released on 04 and 05 April. According to the ADP report on employment levels in the private sector, employers hired 184K new workers in March, exceeding the forecast of 148K and the previous figure of 155K. The Bureau of Labor Statistics (BLS) added to the picture with information that non-farm employment (NFP) in the US rose by 303K. This significantly surpassed market expectations of 200K. The BLS report also showed that the unemployment rate in the country dropped to 3.8% from 3.9%.
Given all of the above, it can be expected that the Fed will not rush to ease its monetary policy. The likelihood of a rate cut in June dropped to 61% from 70% a week ago, and according to economists at Commerzbank, it is virtually nil. Naturally, such a shift in expectations should support the strengthening of the national currency. Yet, this has not occurred. EUR/USD has not managed to consolidate below 1.0800, and its last chord was played at 1.0836.
As for the short-term forecast, as of the writing of this review on the evening of Friday, 05 April, 50% of experts voted for the strengthening of the dollar and further decline of the pair. 10% sided with the euro, and 40% took a neutral stance. Among the oscillators on D1, only 15% are coloured green, 35% red, with the majority in a state of indecision, coloured neutral grey. The trend indicators have a 60:40 ratio in favour of the greens. The nearest support for the pair is located in the 1.0795-1.0800 zone, followed by 1.0725, 1.0680-1.0695, 1.0620, 1.0495-1.0515, and 1.0450. Resistance zones are at 1.0865, 1.0895-1.0925, 1.0965-1.0980, 1.1015, 1.1050, and 1.1100-1.1140.
This upcoming week, on Wednesday, 10 April, a whole set of data on consumer inflation (CPI) in the United States will be released. That same day, the Minutes of the last FOMC (Federal Open Market Committee) meeting of the US Federal Reserve will be published. The key day of the week will undoubtedly be Thursday, 11 April, when the European Central Bank (ECB) meeting is scheduled. Market participants' attention will be focused not only on the regulator's decisions on the interest rate but also on subsequent comments by its leadership. That day, the Producer Price Index (PPI) and the number of initial jobless claims from US residents will also be published. The working week will conclude with the publication on 12 April of the revised German CPI and the University of Michigan's US Consumer Sentiment Index.
GBP/USD: A Result Close to Zero
Last week, final data on the Business Activity Index in the UK for March were revised downwards. The Services PMI was reduced from 53.8 to 53.1, the lowest figure since November of the previous year. A survey of financiers who make decisions at the Bank of England (BoE) showed a slight decrease in inflation expectations to 3.2% (y/y) and an anticipated reduction in wage sizes over the next year. It is noteworthy that these forecast indicators have decreased for the first time in seven months. However, this did not significantly affect GBP/USD dynamics; the tone of its quotes was set by the Dollar Index (DXY).
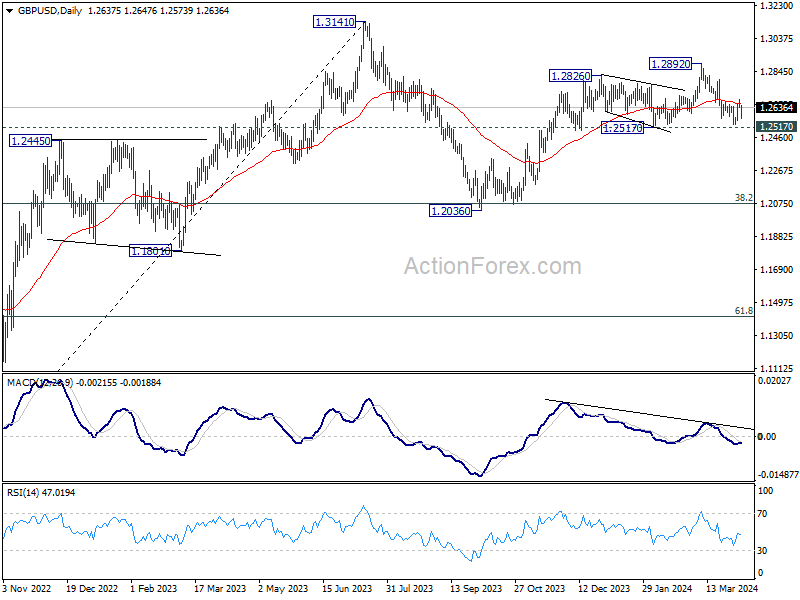
Starting the past week at 1.2635, the pair finished it at 1.2637. Thus, the result of the week can be considered zero. Analysts' opinions on the behaviour of GBP/USD in the near future are divided as follows: the majority (60%) voted for the pair's fall, 40% remained neutral, and no one wished to side with the bulls. The indicators on D1 are as follows: among the oscillators, 50% recommend selling, 10% suggest buying, and the remaining 40% are in the neutral zone. Trend indicators point south by 60%, north by 40%. If the pair moves south, it will encounter levels and support zones at 1.2575, 1.2500-1.2535, 1.2450, 1.2375, 1.2330, 1.2085-1.2210, 1.2110, and 1.2035-1.2070. In case of an increase, it will face resistance at levels 1.2695, 1.2755-1.2775, 1.2800-1.2820, 1.2880-1.2900, 1.2940, 1.3000, and 1.3140.
The calendar for the upcoming week highlights Friday, 12 April, when GDP statistics for the United Kingdom will be released. No other significant events affecting the country's economy are scheduled for the coming days.
USD/JPY: A Break Above 152.00 – A Matter of Time?
For two and a half weeks, USD/JPY has been moving in a sideways channel, unsuccessfully attempting to rise above 152.00. Fear of possible currency interventions by the Japanese Ministry of Finance prevents the bulls from breaking this resistance. While actual interventions have not yet occurred, there has been plenty of verbal intervention from high-ranking Japanese officials. For example, Finance Minister Shunichi Suzuki once again stated that the authorities are closely monitoring the situation and do not exclude any options to combat excessive currency movements.
Despite such statements, the yen remains under pressure, increasing the likelihood of the pair's bullish trend continuing. According to strategists at the American bank Brown Brothers Harriman (BBH), the continuation of the upward rally is just a matter of time. They write that a very gradual tightening of the Bank of Japan's policy, coupled with a softer than previously anticipated Federal Reserve easing cycle, serves as a fundamental catalyst.
The market sentiment, according to several analysts, does not contradict BBH's forecast. Currently, according to statistics, most traders (up to 80%) are in sell positions for USD/JPY, which increases the chances of the market moving against the crowd.
The pair finished last week at 151.61. As for its near future, 80% of experts (i.e., the same percentage as the traders) sided with the bears for the pair, voting for further strengthening of the American currency, while the remaining 20% voted otherwise. Technical analysis tools are clearly unaware of fears regarding possible currency interventions. Therefore, all 100% of trend indicators and 85% of oscillators on D1 point north, with only 15% of the latter looking south. The nearest support level is located in the zone of 150.85, 149.70-150.00, 148.40, 147.30-147.60, 146.50, 145.90, 144.90-145.30, 143.40-143.75, 142.20, and 140.25-140.60. Resistances are placed at the following levels and zones – 151.85-152.00, 153.15, and 156.25.
No significant events related to the Japanese economy are scheduled for the upcoming week.
CRYPTOCURRENCIES: A Week of Unexpected Announcements
After bitcoin reached a new historical high of $73,743 on 14 March, BTC/USD sharply pulled back, losing approximately 17.5%. A local minimum was recorded at $60,778. This moment marked a record outflow of funds from exchange-traded funds, with bitcoin accounting for 96%. The departure of institutional capital from the crypto sphere overlapped with many investors and miners' desire to secure profits after updating the price record. At the peak, the realized profit exceeded $2 billion per day, with a third attributable to investors in Grayscale. Analysts at JPMorgan, in a note to investors dated 21 March, mentioned the overbought condition of the cryptocurrency and the risk of a continued correction.
However, a further downfall did not occur; the market sentiment changed. While crypto funds continued to lose assets, crypto exchanges registered an increase in the withdrawal of coins to cold wallets. Whales and sharks returned to accumulating the main cryptocurrency, expecting new BTC records in anticipation of or following the halving. If the net outflow amounted to $888 million in the week of 18-24 March, it changed to an inflow of $860 million in the week of 25-31 March. The record for coin accumulation by hodlers was 25,300 BTC per day. Bitcoin reached a high of $71,675 on 27 March.
The first half of the past week brought a new wave of sales; however, analysts at Coinshares believe that the absolute majority of investment companies and hedge funds are not interested in lowering BTC quotes, and whales will try to prevent a collapse below $60,000. The absence of new price records in those days was compensated by a series of if not sensational, then at least unexpected announcements made by crypto influencers.
For instance, CoinChapter reported that the head of Tesla and SpaceX, Elon Musk, declared meme coins Dogecoin (DOGE) the official currency of the colony to be built on Mars. "The brave colonists heading to the Red Planet will be rough and ruthless people. They won't drag gold bars with them. They will need a fast and fun currency that embodies the spirit of space travel. Dogecoin meets all these criteria," Musk said. One might expect such inspiring words to propel the token's price to cosmic heights, but this did not happen. Instead, it slightly declined. This may be related to the fact that the aforementioned information appeared on 1 April – April Fool's Day or All Fools' Day. Thus, it's possible that Musk was merely joking with his fans by assigning DOGE the status of Martian currency.
Attention was also drawn to a statement by the founder of the cryptocurrency exchange FTX, Sam Bankman-Fried (SBF), who was sentenced to 25 years in prison. Arrest did not prevent him from giving an interview to ABC News. In it, SBF stated that if he or another FTX employee had remained as CEO, the clients of the bankrupt exchange "would have long returned their money" at the current rate. Hence, the question arises: why not give Sam such an opportunity? Let him first compensate the clients for their losses and then go to jail.
Sam Bankman-Fried is far from the only notable crypto figure of interest to US law enforcement agencies. Changpeng Zhao, co-founder and former CEO of the Binance exchange, also faced court proceedings. However, last week, he made headlines not in the criminal chronicle but in Forbes' new billionaire ranking, where he placed 50th with a net worth of $33 billion. (Bloomberg's own index attributes Zhao with assets amounting to an even larger sum – $45.1 billion). Note that the Forbes list also includes other representatives of the crypto industry. For example, Brian Armstrong, co-founder and CEO of Coinbase, was ranked 180th with $11.2 billion. In total, the publication counted 17 entrepreneurs associated with cryptocurrencies with a net worth of over a billion dollars.
Another unexpected statement came from the pen of "Rich Dad Poor Dad" author and entrepreneur Robert Kiyosaki. He is widely known for his numerous constant calls not to save "fake dollars" that will soon turn into worthless paper but to buy gold, silver, and bitcoin. Kiyosaki repeated this mantra again this time, not ruling out that bitcoin could ... crash to zero! According to him, it's possible that the first cryptocurrency is as much a fraud or a Ponzi scheme as the US dollar, euro, yen, or any other "fake" fiat currency.
As of the writing of this review on the evening of Friday, 05 April, bitcoin quotes are far from zero; the BTC/USD pair is trading around $67,680. The total market capitalization of the crypto market has slightly decreased and stands at $2.53 trillion ($2.68 trillion a week ago). The Crypto Fear & Greed Index fell from 80 to 79 points, remaining in the Extreme Greed zone.
We have already detailed the history and meaning of halvings in a previous review. Now, we remind you that the upcoming fourth halving is expected to take place soon, most likely on 20 April. After this event, according to Mark Yusko, CEO of Morgan Creek Capital, "interest in the asset will increase – many will enter FOMO mode. We should see a twofold increase in fair value. In the current cycle, it stands at ~$75,000 with downward adjustments. [...] Thus, [by the end of the year] we get $150,000," he shared his calculations on CNBC. Yusko also believes that "historically, about nine months after the event, a price peak will be formed before the next bear market."
The senior manager called the first cryptocurrency the "dominant token" and the "best form of gold". Regarding long-term prospects, the expert stated that bitcoin "can easily" increase tenfold over the next decade. Separately, the head of Morgan Creek Capital mentioned that his hedge fund likes Ethereum, Solana, and Avalanche, although they fall short of the "king-bitcoin". Mark Yusko did not mention Elon Musk's "Martian" Dogecoin at all...
Inflation Fears Resurface as Commodities Spike, Thwarting Central Bank Easing Hopes
Global financial markets are bracing for potential upheaval as geopolitical strains drive gold to new record while oil prices surge. This surge, alongside the rally in metals like Copper, ignites concerns over an inflation comeback. Such inflationary pressures, combined with a revival in manufacturing and service sectors, could deter major central banks from implementing significant monetary easing through the year. The markets' nervous response is evident in the stark pullback of stock indices, though a major reversal remains pending confirmation.
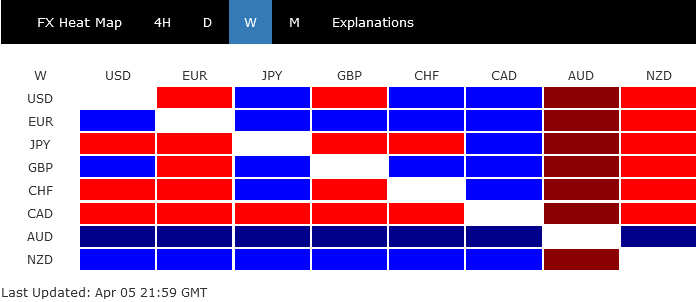
In the currency markets, Australian Dollar emerged resilient, finishing as the week's strongest contender, buoyed by the commodities boom rather than deterred by equity market dips. New Zealand Dollar claimed the second spot, albeit at a distance, while Euro clinched third place despite underwhelming inflation figures.
Conversely, Canadian Dollar found itself at the bottom, unable to capitalize on the oil rally but weighed down by disappointing job data. Yen also lagged, after being briefly buoyed by BoJ Governor's hints at further tightening. Swiss Franc, despite early losses post-weak CPI data sparking rate cut speculation, managed a third-place finish from the bottom.
Dollar and Sterling presented a mixed picture. Greenback, in particular, showed reluctance to rally despite rising yields, robust job data, and diminishing expectations for a Fed rate cut in June.
Global Markets Teeter on Correction Amid Cooling Monetary Easing Expectations
Global stock markets stand at a critical juncture, on the brink of a sizeable correction following last week's sharp retreat. This shift in sentiment arises as investors begin to take profits, reacting to tempered expectations for rapid monetary policy easing from the world's leading central banks.
On the one hand, recent economic indicators signaled a more robust footing than anticipated, notably in the US where job market continues to demonstrate resilience in terms of growth and wages. Further buoying sentiment, Eurozone's PMI Composite made an unexpected return to expansion in March, bolstered by strengthening services sector. Similarly, both UK manufacturing PMI and US ISM manufacturing data suggest return to growth, adding to the optimistic economic outlook.
On the other hand, this economic revival brings with it the specter of inflation, heightened by the marked increase in commodity prices recently, including copper and oil.
The prospect for stronger than expected economic growth diminishes the immediacy for central banks to implement aggressive rate cuts. At the same time, resurgence of inflationary pressures could deter central banks from taking more a proactive approach too.
In the US, the futures market now pegs the probability of a June rate cut by Fed at just 53%, following a strong set of NFP data. The prospects for a July rate reduction are higher at 73%. Yet it appears September may present the most probable window for initiating cuts, with odds surpassing 90%.
However, it's important to note the prevailing consensus among Fed officials suggests no rush to alter policy. Minneapolis Fed President Neel Kashkari has even hinted at the possibility of foregoing rate cuts entirely this year should inflation just moves sideway.
Across the Atlantic, ECB is still eyeing June for its inaugural rate decrease, contingent on forthcoming Q1 wage due data in May. However, the path beyond this initial cut is clouded with uncertainty, reflecting the complex balance between fostering economic recovery and managing inflation risks.
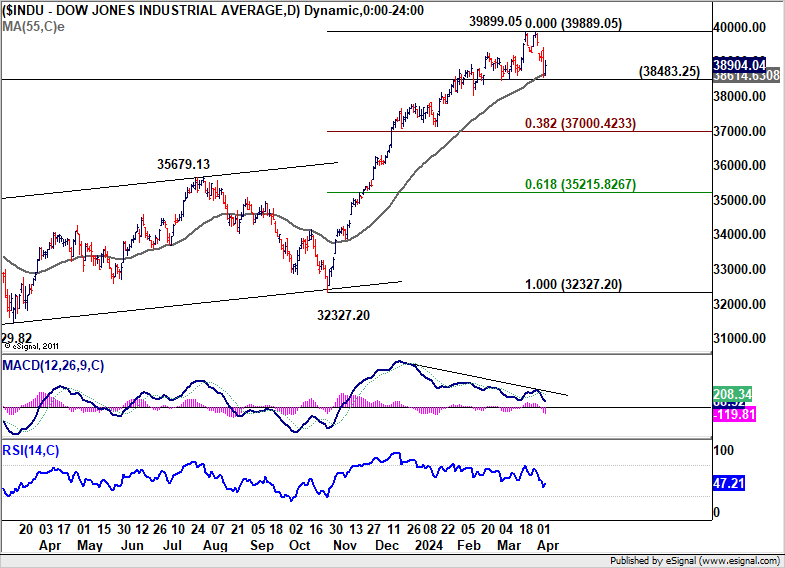
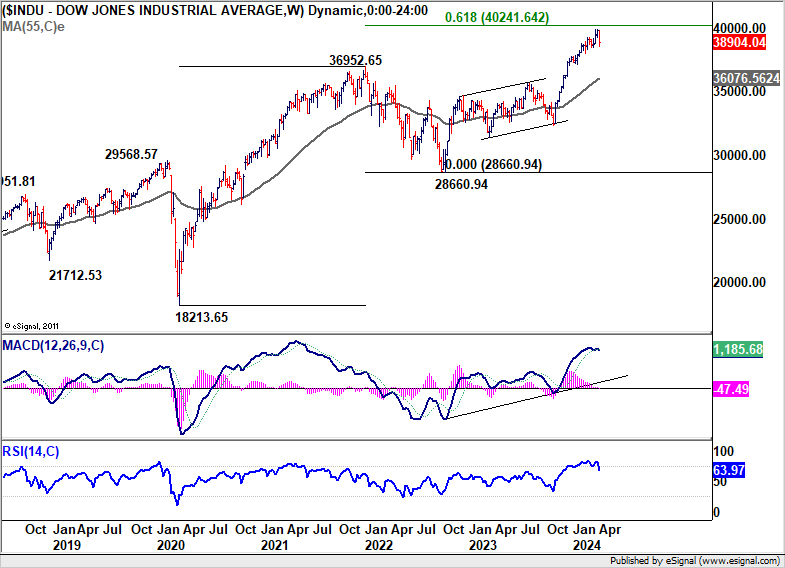
Technically, while DOW rebounded notably on Friday after drawing support from 55 D EMA, it still closed the week sharply lower. Considering bearish divergence condition in D MACD, it's possible that 39899.05 is already a medium term top. That came just ahead of 40000 handle, and 61.8% projection of 18213.65 to 336952.65 from 28660.94 at 40241.64.
Firm break of 38383.25 support will confirm this bearish case, and bring deeper fall to 38.2% retracement of 32327.30 to 39899.05 at 37000.42.
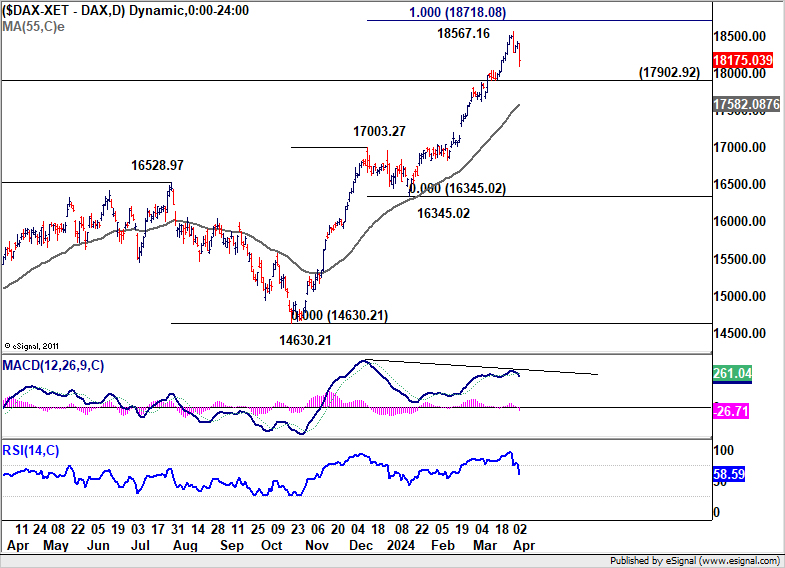
As for DAX, it's clearly losing upside momentum as seen in D MACD. While another rise cannot be ruled out yet, 100% projection of 14630.21 to 17003.27 from 16345.02 at 18718.08 should limited upside for the near term. Break of 17902.92 support will bring deeper fall to 55 D EMA (now at 17582.08) even as a correction to rise from 16345.02 only.
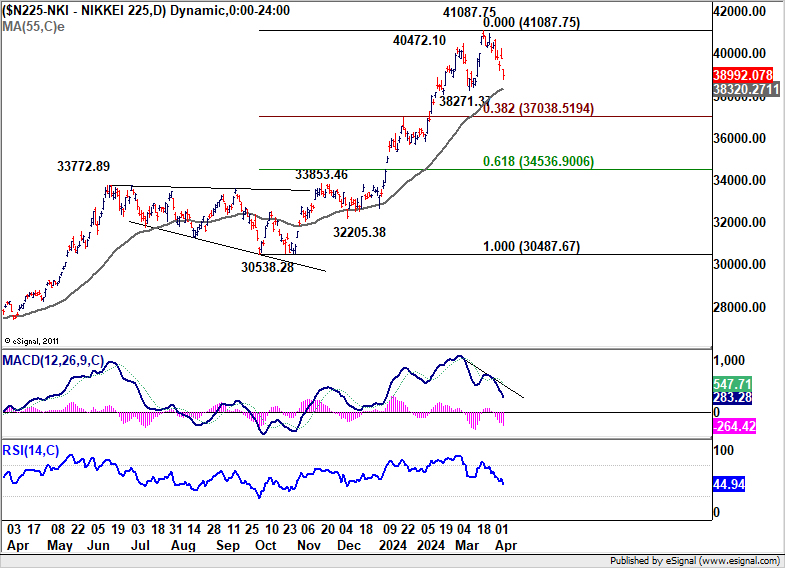
Nikkei's up trend also looks exhausted as seen in bearish divergence condition in D MACD, after failing to sustain above 40k handle again. Break of 55 D EMA (now at 38320.27) will argue that it's already correcting the five-wave rally from 30538.28. Deeper correction would then be seen to 38.2% retracement of 30538.28 to 41087.75 at 37038.51 and possibly below.
Commodities Rally: Copper and Oil Soar, Gold Reaches New Record
Copper prices surged to the highest levels in over a year, propelled by a combination of escalating supply risks and optimism for a revival in global demand. Reports have highlighted significant production challenges faced by Codelco, the Chilean state-owned entity and the world's largest copper producer, which is grappling with its lowest output in twenty-five years.
Furthermore, in China, copper smelters are reportedly on the brink of enacting a collective reduction in output, a move spurred by disruptions at major mining sites that have forced smelters to contend with unprecedentedly high costs for procuring mined ore.
On the demand side, the rally in Copper prices reflects broader anticipations of a rebound in global manufacturing, departure from the sector's year-long recession. The prospect of increased demand for Copper, buoyed by its essential role in various industries, including electronics and renewable energy, adds to the bullish sentiment surrounding the metal.
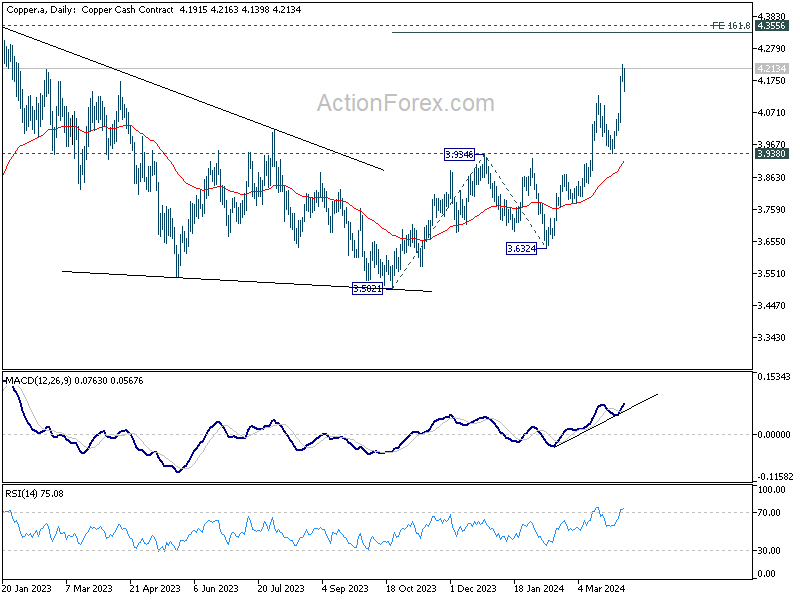
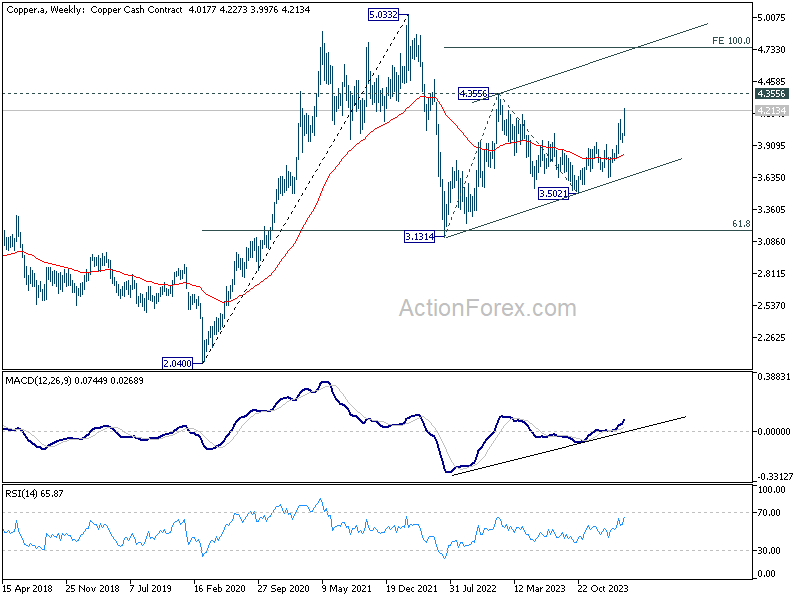
Technically, Copper's rally from 3.5021 resumed last week and hit as high as 4.2273. Next target is 161.8% projection of 3.5021 to 3.9346 from 3.6324 at 4.3322, which is close to 4.3556 (2023 high). The more important question is whether Copper is indeed resuming the rise from 3.1314 (2022 low) too. In this medium term bullish case, firm break of 4.3556 would pave the way to 100% projection of 3.1314 to 4.3556 from 3.5021 at 4.7263.
Oil prices accelerated to their highest levels in five months, marking significant weekly gains amidst escalating tensions in the Middle East. The closure of 28 Israeli embassies worldwide, sparked by fears of retaliatory strikes from Iran, underscores the geopolitical volatility. These developments follow a missile strike on Iran's consulate in Damascus which resulted in the death of a high-ranking general. Iran attributed the attack to Israel, which hasn't claimed responsibility.
Compounding the market's anxieties are recent Ukrainian offensives against Russian infrastructure, which have notably affected Russia's oil production capabilities. For the first time since the onset of the conflict, there is a tangible prospect of substantial Russian oil supplies being withdrawn from the market, a scenario that could exacerbate existing supply constraints.
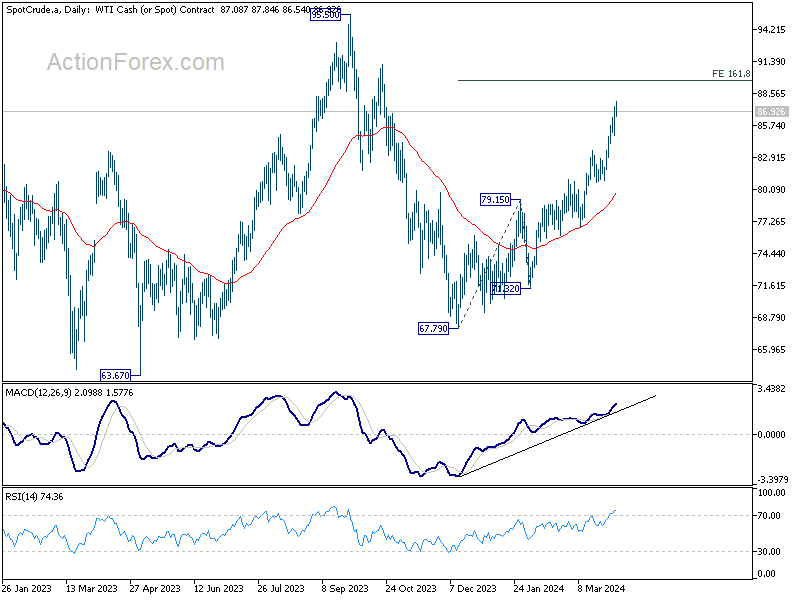
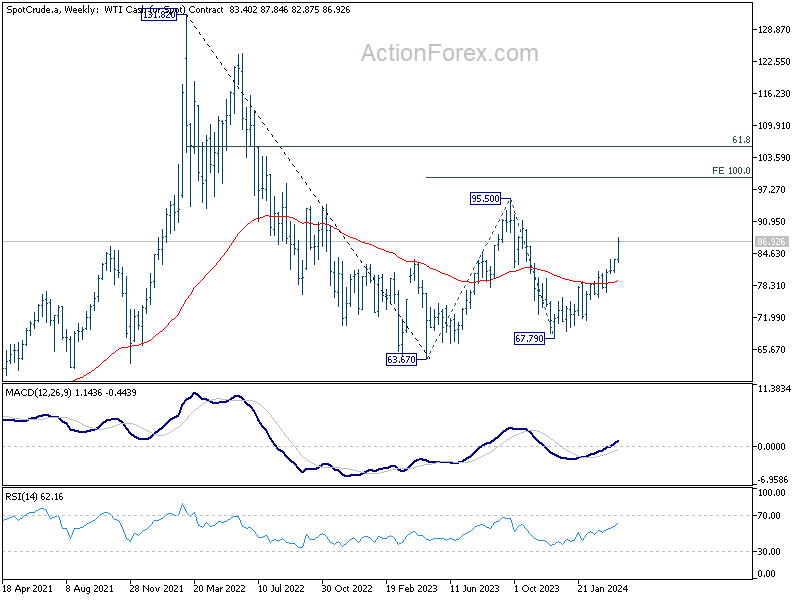
Technically, WTI crude oil is clearly in upside acceleration mode as seen in D MACD. Next target is 161.8% projection of 67.79 to 79.15 from 71.32 at 89.70. Firm break there will put 2023 high at 95.50 in radar. More importantly, if rise from 67.79, as the third leg of the pattern from 63.67, has the potential to climb to 100% projection of 63.67 to 95.50 from 67.79 at 99.62, which is close to 100 psychological level.
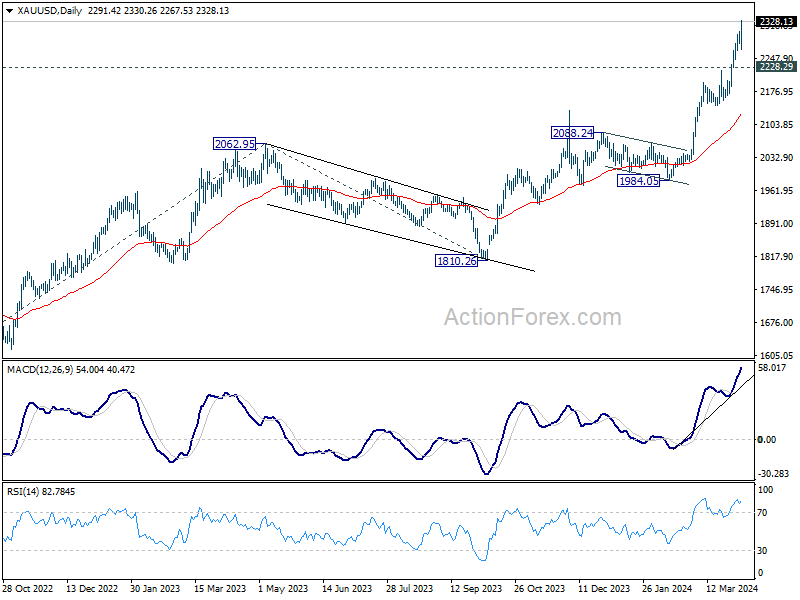
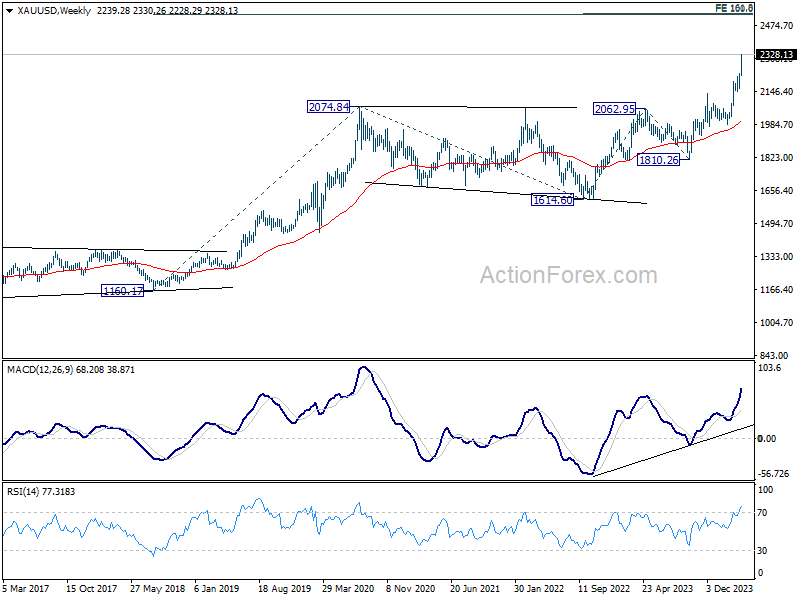
Gold extended its record run and accelerated to new high above 2300 mark last week. While the anticipation of global monetary policy easing has undoubtedly played a role in bolstering the precious metal's appeal, it appears that the escalating geopolitical risks are currently the more dominant driver. Additionally, reports of China's continued accumulation of gold reserves over the past 16 months underscore a strategic move to diversify away from US Dollar, further fueling gold's ascent.
Technically, near term outlook in Gold will stay bullish as long as 2228.29 support holds. Next target is cluster projection level at around 2500, 161.8% projection of 1614.60 to 2062.95 from 1810.26 at 2536.56 and 100% projection of 1160.17 to 2074.84 from 1614.60 at 2529.27. Break of 2228.29 will bring consolidations first before staging another rally.
Dollar's Hesitation Visible, Yet Upside Remains Slightly Favored
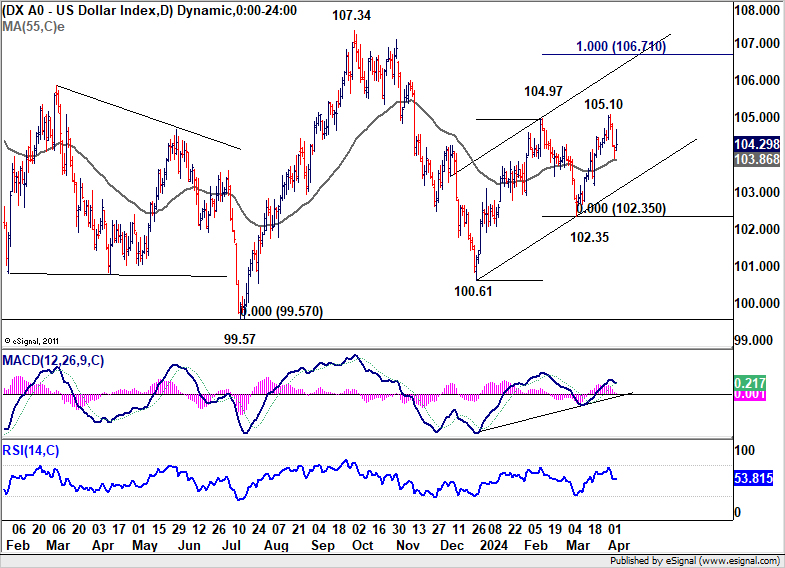
Dollar Index showed much hesitation to move higher last week. It seems that the greenback is more sensitive to bearish factors for now. For example, it's dragged down by weaker than expected ISM Services readings. Fed Chair Jerome Powell's comments, hinting that it's still on track for three cuts this year, also weighs. Meanwhile, strong non-farm payroll data could only give Dollar a brief lift. There is probably a need for the greenback to draw further cues from overall stock market sentiment for a more decisive move.
Technically, though, further rise remains in favor in Dollar Index as long as 55 D EMA (now at 103.86) holds. Rise from 102.35 is seen as the third leg of the pattern from 100.61. Break of 105.10 will target 100% projection of 100.61 to 104.97 from 102.35 at 106.71. Nevertheless, sustained trading below the EMA will dampen this bullish view and bring deeper fall back to 102.35 support instead.
AUD/USD Weekly Report
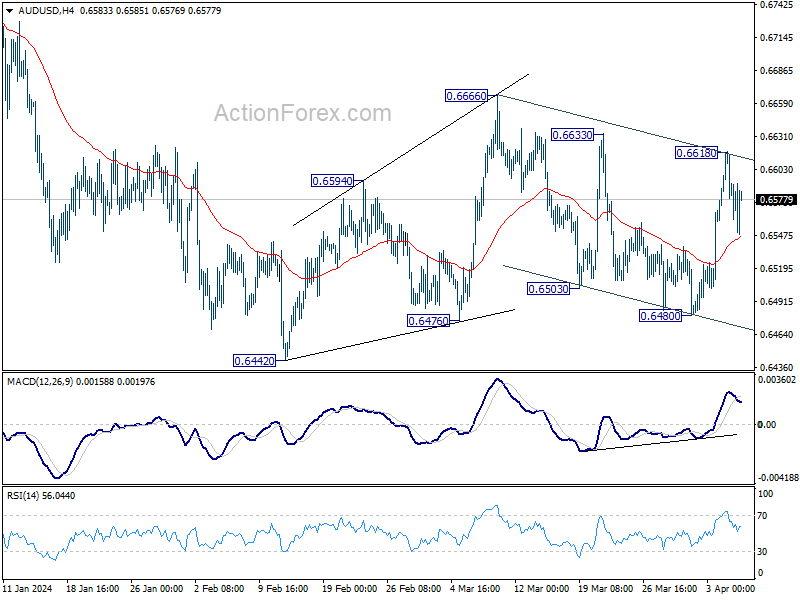
AUD/USD's strong was rebound last week was capped below 0.6666 resistance, and followed by equally steep decline. Initial bias remains neutral this week first, with focus on 0.6503 support. Decisive break there will indicate that larger fall from 0.6870 is ready to resume, and turn bias to the downside for 0.6442 low. For now, risk will stay on the downside as long as 0.6633 resistance holds, in case of recovery.
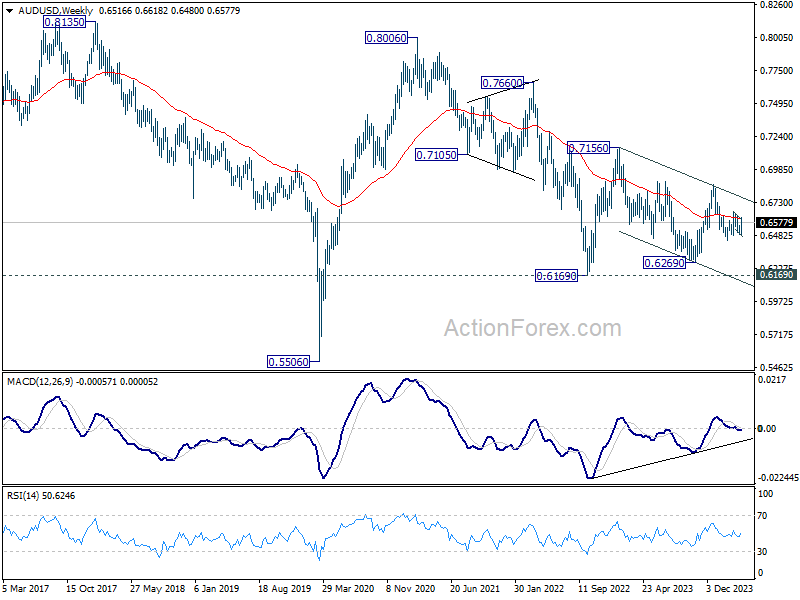
In the bigger picture, price actions from 0.6169 (2022 low) are seen as a medium term corrective pattern to the down trend from 0.8006 (2021 high). Fall from 0.7156 (2023 high) is seen as the second leg, which might still be in progress. Overall, sideway trading could continue in range of 0.6169/7156 for some more time. But as long as 0.7156 holds, an eventual downside breakout would be mildly in favor.
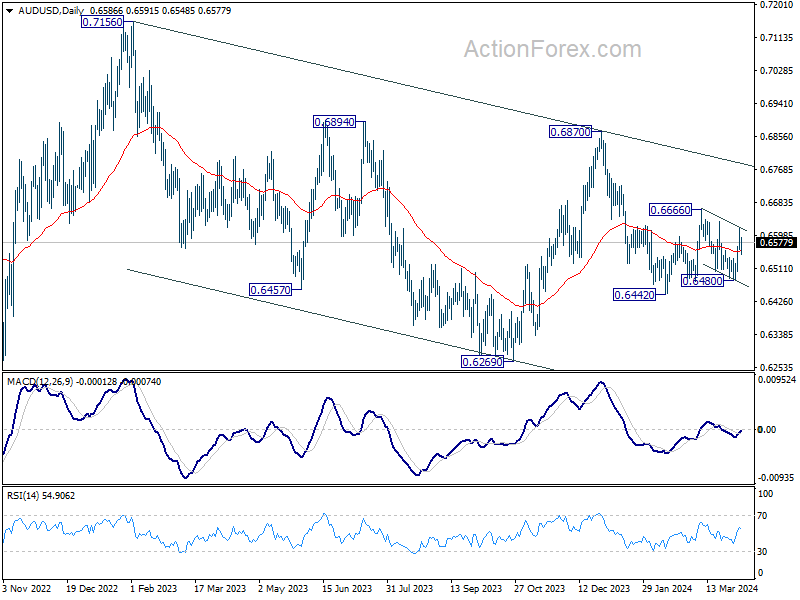
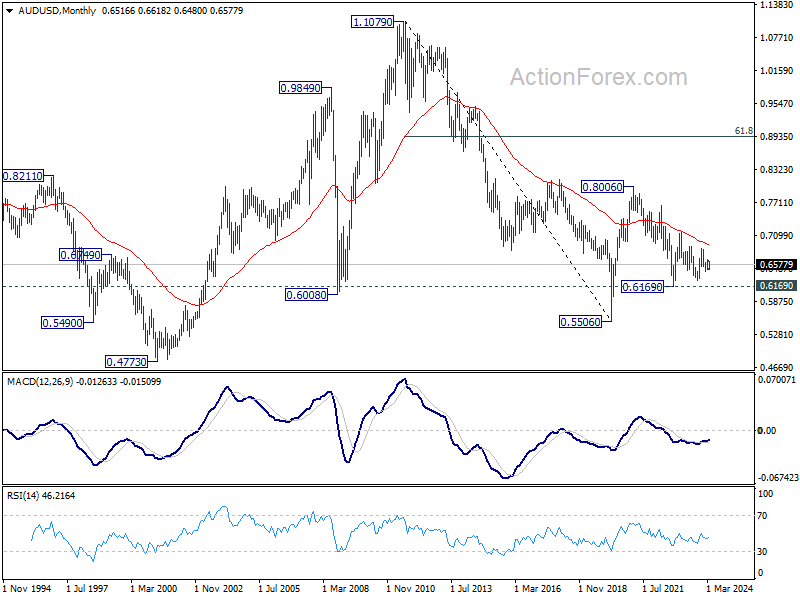
In the long term picture, the down trend from 1.1079 (2011 high) should have completed at 0.5506 (2020 low) already. It's unsure yet whether price actions from 0.5506 are developing into a corrective pattern, or trend reversal. But in either case, fall from 0.8006 is seen the second leg of the pattern. Hence, in case of deeper decline, strong support should emerge above 0.5506 to bring reversal.
EUR/USD Weekly Outlook
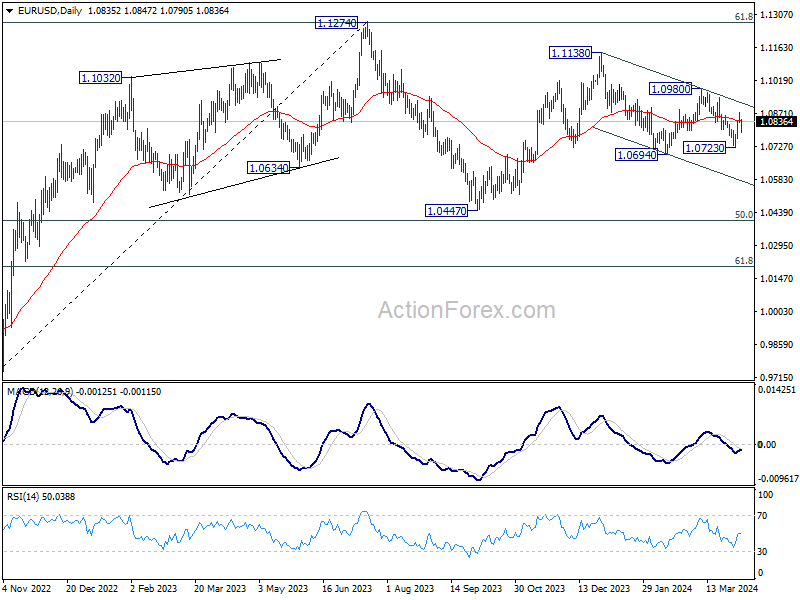
EUR/USD rebounded strongly to 1.0875 last week but retreated since then. Yet there was no follow through selling. Initial bias is turned neutral this week first. On the downside, decisive break of 1.0694/0723 support zone will resume whole fall from 1.1138. On the upside, though, break of 1.0875 will resume the rebound from 1.0723 towards 1.0980 resistance instead.
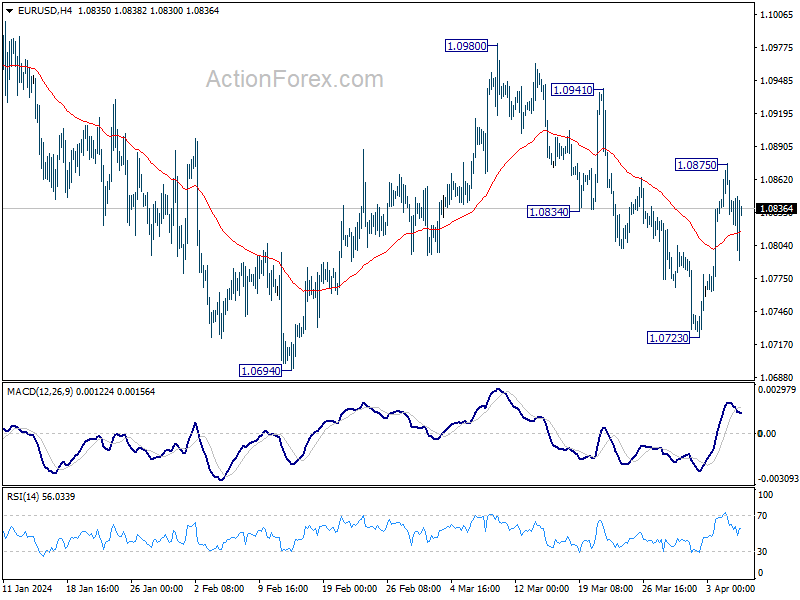
In the bigger picture, price actions from 1.1274 are viewed as a corrective pattern to rise from 0.9534 (2022 low). Rise from 1.0447 is seen as the second leg. While further rally could cannot be ruled out, upside should be limited by 1.1274 to bring the third leg of the pattern. Meanwhile, sustained break of 1.0694 support will argue that the third leg has already started for 1.0447 and possibly below.
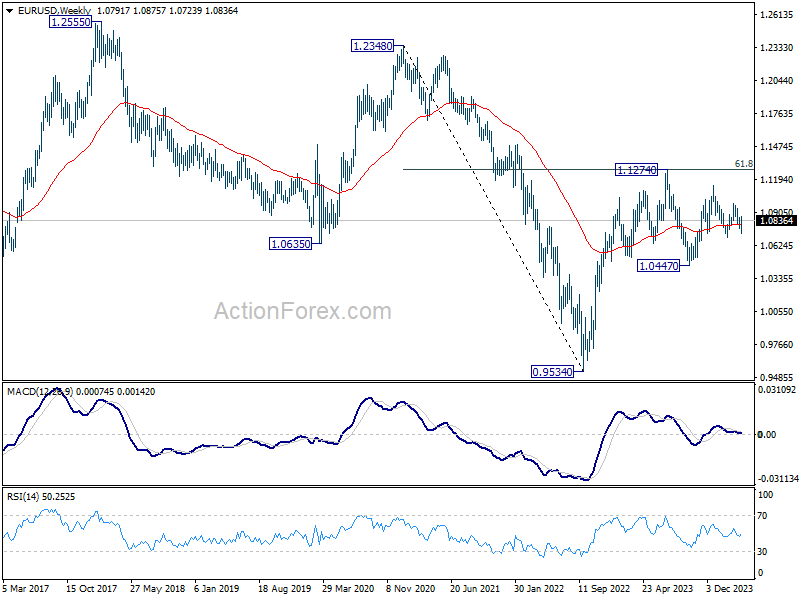
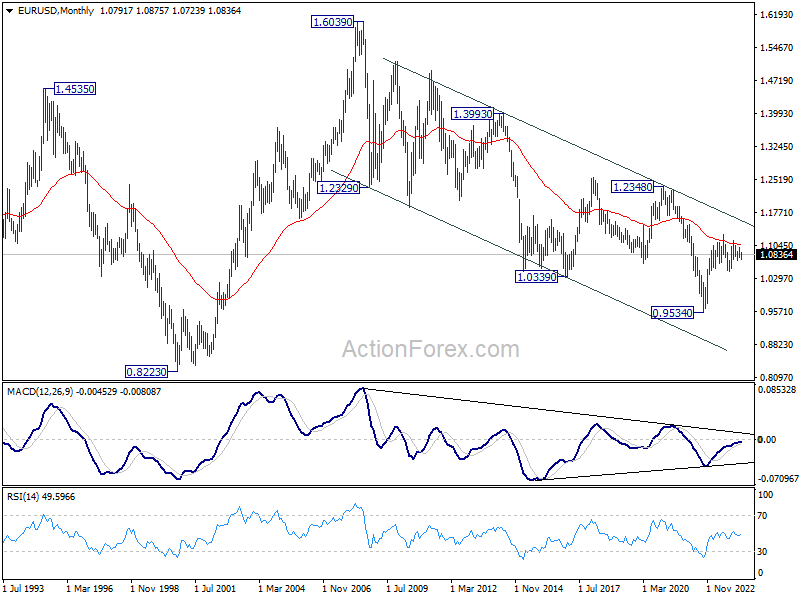
In the long term picture, a long term bottom is in place at 0.9534 on bullish convergence condition in M MACD. It's still early to call for bullish trend reversal with the pair staying inside falling channel in the monthly chart. Nevertheless, sustained trading above 55 M EMA (now at 1.1050) and break of 1.1274 resistance will raise the chance of reversal and target 1.2348 resistance for confirmation.
USD/JPY Weekly Outlook
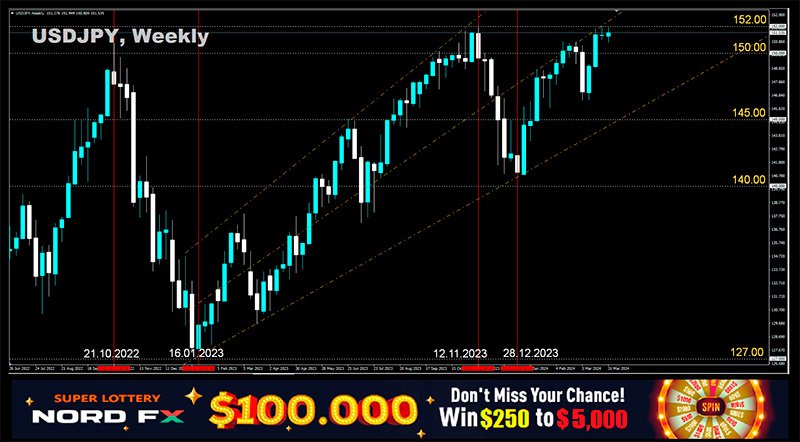
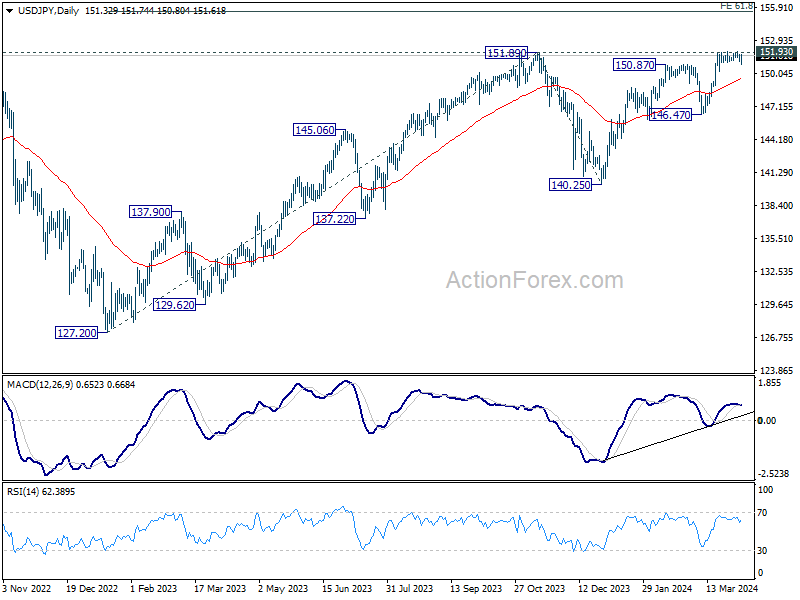
USD/JPY dipped to 150.80 last week but quickly recovered. Initial bias remains neutral this week first. On the downside, break of 150.80 will turn bias back to the downside for deeper pull back to 55 D EMA (now at 149.56). On the upside, however, sustained break of 151.93 key resistance will confirm long term up trend resumption.
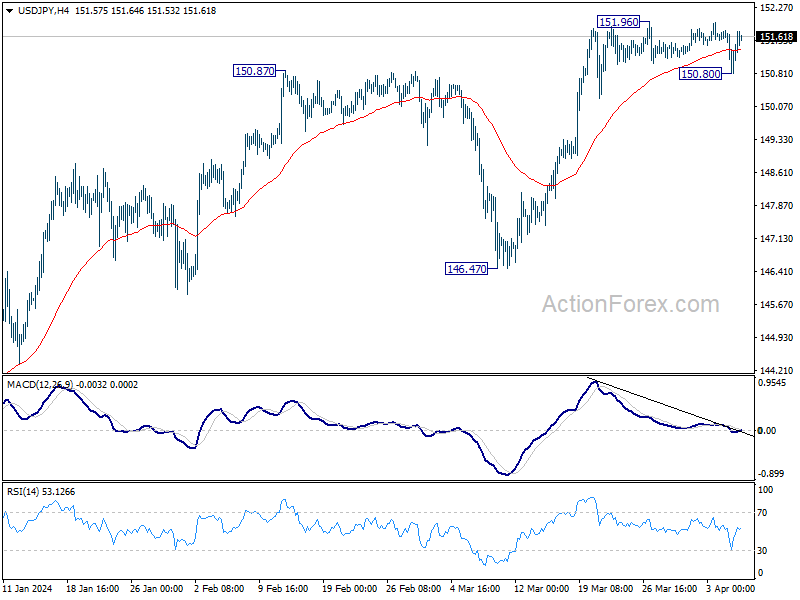
In the bigger picture, correction from 151.87 (2023) high could have completed at 140.25 already. Rise from 127.20 (2023 low), as part of the long term up trend, is probably ready to resume. Decisive break of 151.93 resistance (2022 high) will confirm this bullish case. Next medium term target will be 61.8% projection of 127.20 to 151.89 from 140.25 at 155.20. This will remain the favored case as long as 146.47 support holds, in case of another pullback.
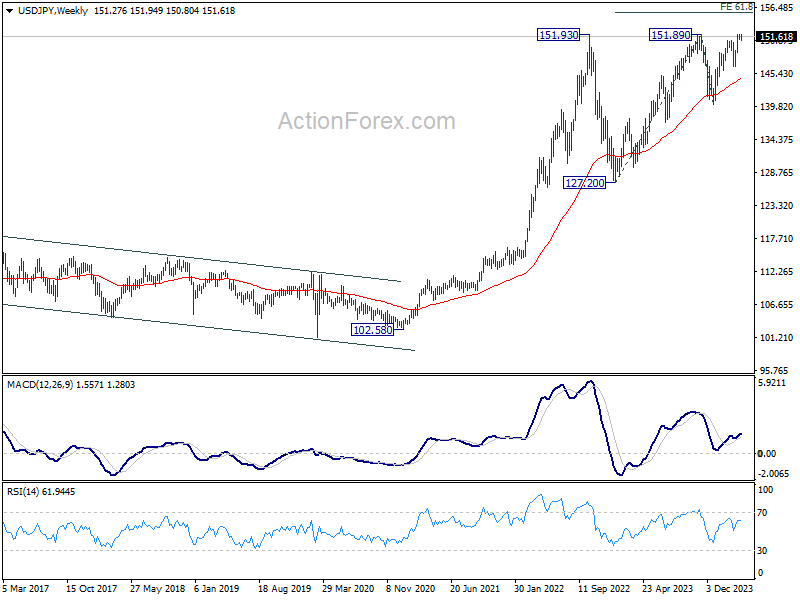
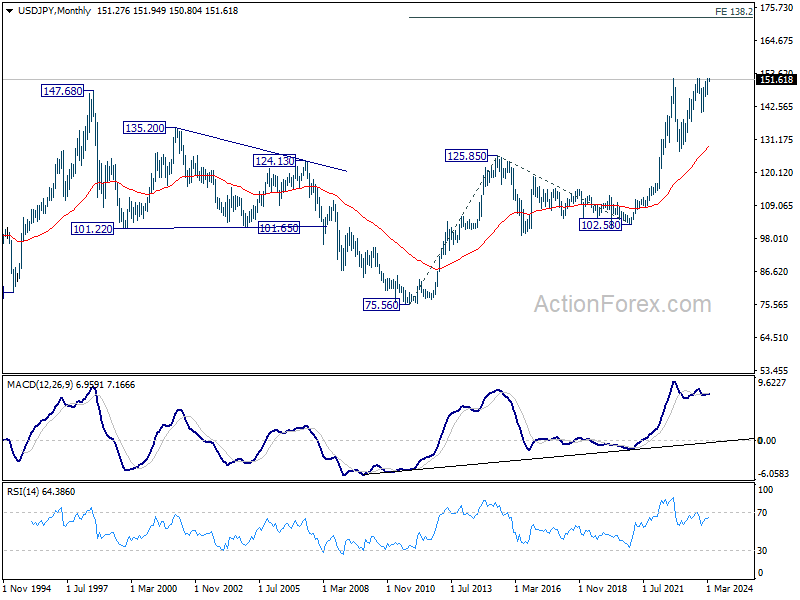
In the long term picture, as long as 127.20 support holds(2023 low), up trend from 75.56 (2011 low) is still in favor to continue through 151.93 (2022 high).
GBP/USD Weekly Outlook
GBP/USD rebounded strongly to 1.2682 last week but retreated since then. Yet, there was no follow through selling. Initial bias is turned neutral this week first. On the downside, decisive break of 1.2517/38 support zone will suggest that rise from 1.2036 has completed at 1.2892 already, and turn near term outlook bearish. On the upside, however, firm break of 1.2682 will suggest that fall from 1.2892 has completed at 1.2538. Intraday bias will be turned back to the upside for 1.2802 resistance next.
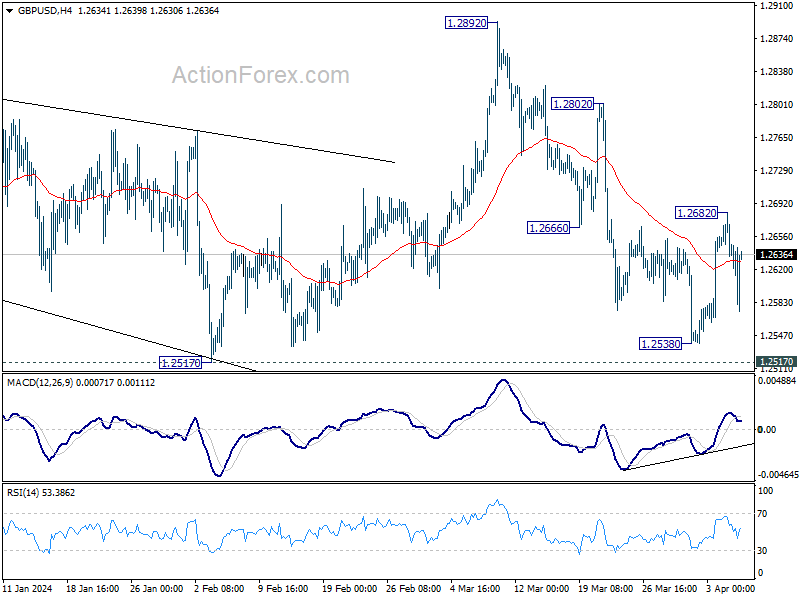
In the bigger picture, price actions from 1.3141 medium term top are seen as a corrective pattern to up trend from 1.0351 (2022 low). Rise from 1.2036 is seen as the second leg, which might still be in progress. But upside should be limited by 1.3141 to bring the third leg of the pattern. Meanwhile, break of 1.2517 support will argue that the third leg has already started for 38.2% retracement of 1.0351 (2022 low) to 1.3141 at 1.2075 again.
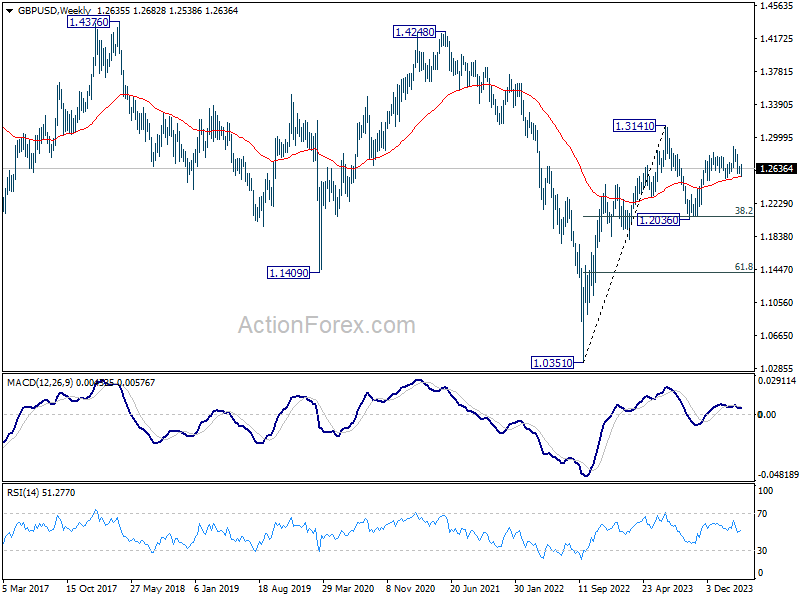
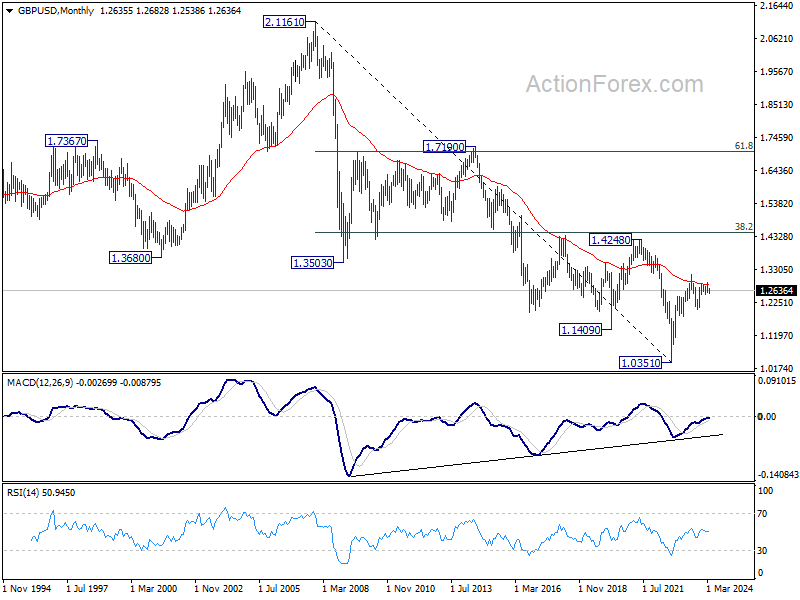
In the long term picture, a long term bottom should be in place at 1.0351 on bullish convergence condition in M MACD. But momentum of the rebound from 1.3051 argues GBP/USD is merely in consolidation, rather than trend reversal. Range trading is likely between 1.0351/4248 for some more time.
USD/CHF Weekly Outlook
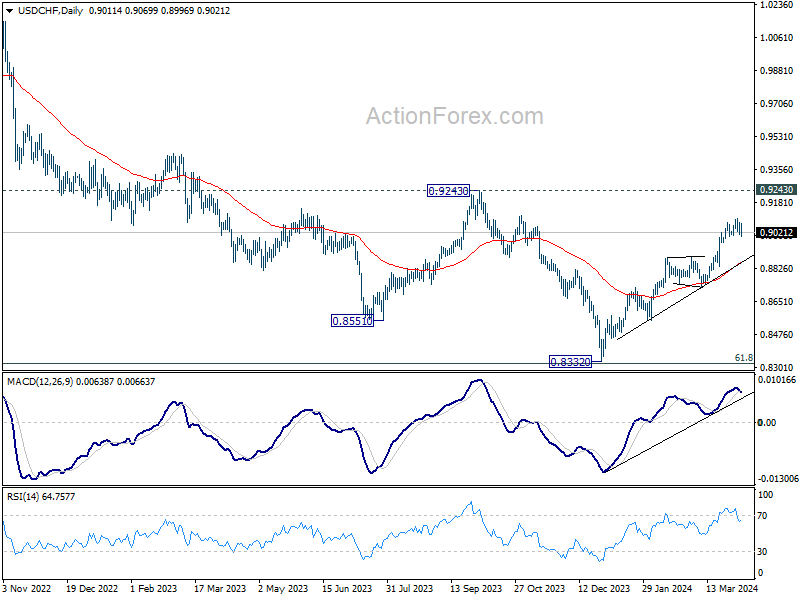
USD/CHF edged higher to 0.9094 last week but retreated again. Initial bias remains neutral this week for consolidations. Deeper decline cannot be ruled out, but outlook will stay bullish as long as 0.8884 resistance turned support holds. On the upside, break of 0.9094 will resume larger rise from 0.8332 to 0.9243 key resistance.
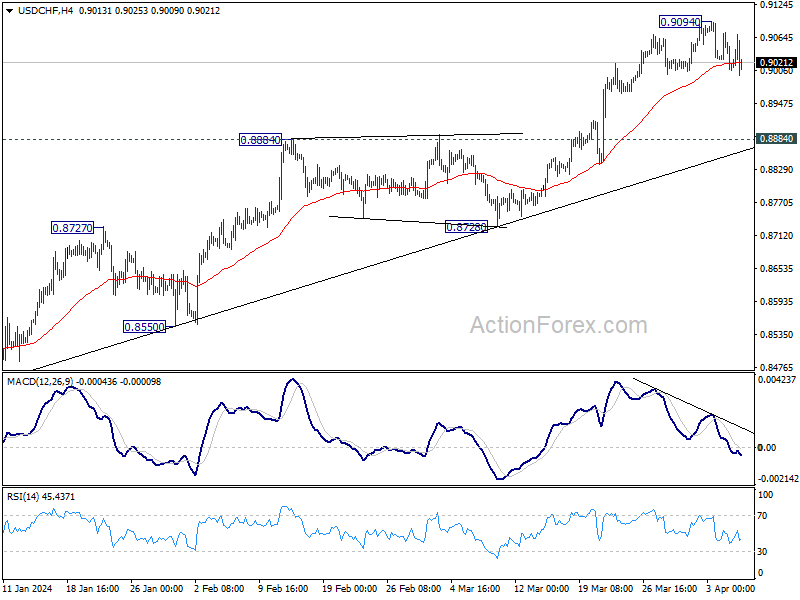
In the bigger picture, price actions from 0.8332 medium term bottom as tentatively seen as developing into a corrective pattern to the down trend from 1.0146 (2022 high). Further rise would be seen as long as 0.8728 support holds. But upside should be limited by 0.9243 resistance, at least on first attempt.
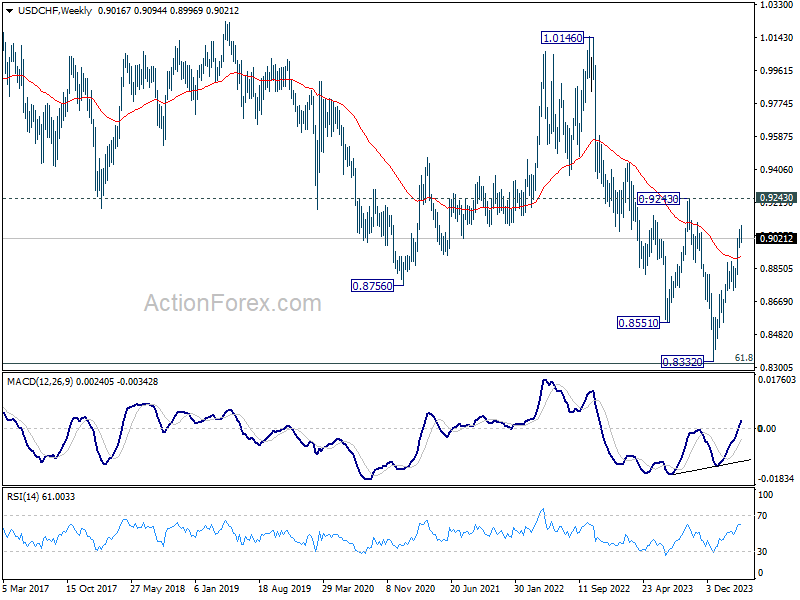
In the long term picture, price action from 0.7065 (2011 high) are seen as a corrective pattern to the multi-decade down trend from 1.8305 (2000 high). Strong rebound from 61.8% retracement of 0.7065 to 1.0342 (2016 high) will start the third leg as a medium term rally. But there will be no sign of long term reversal until firm break of 38.2% retracement of 1.8305 to 0.7065 at 1.1359.

AUD/USD Weekly Report
AUD/USD rebounded notably last week but upside was capped at 0.6618 and retreated. Initial bias is turned neutral this week first. On the upside, above 0.6618 will bring further rally to 0.6666 resistance. Break there will resume whole rebound from 0.6442. however, break of 0.6480 support will bring retest of 0.6442 low instead.
In the bigger picture, price actions from 0.6169 (2022 low) are seen as a medium term corrective pattern to the down trend from 0.8006 (2021 high). Fall from 0.7156 (2023 high) is seen as the second leg, which might still be in progress. Overall, sideway trading could continue in range of 0.6169/7156 for some more time. But as long as 0.7156 holds, an eventual downside breakout would be mildly in favor.
In the long term picture, the down trend from 1.1079 (2011 high) should have completed at 0.5506 (2020 low) already. It's unsure yet whether price actions from 0.5506 are developing into a corrective pattern, or trend reversal. But in either case, fall from 0.8006 is seen the second leg of the pattern. Hence, in case of deeper decline, strong support should emerge above 0.5506 to bring reversal.
USD/CAD Weekly Outlook
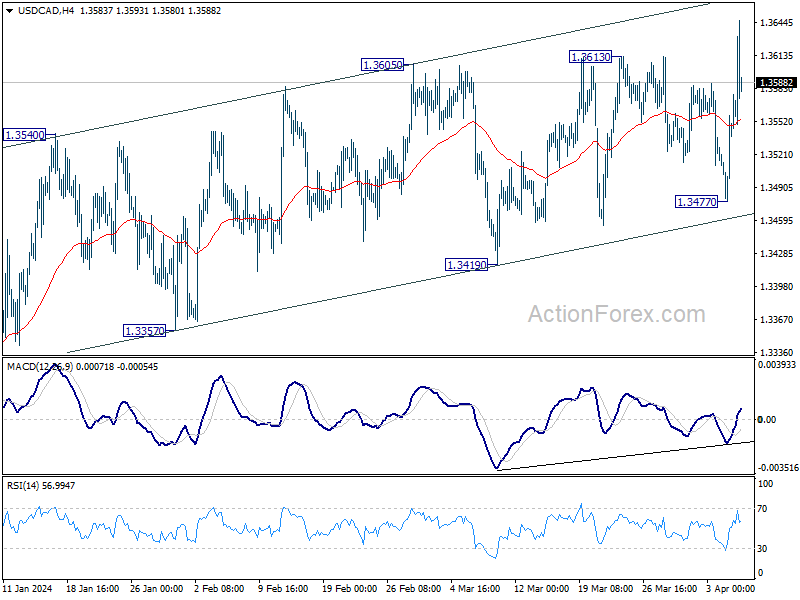
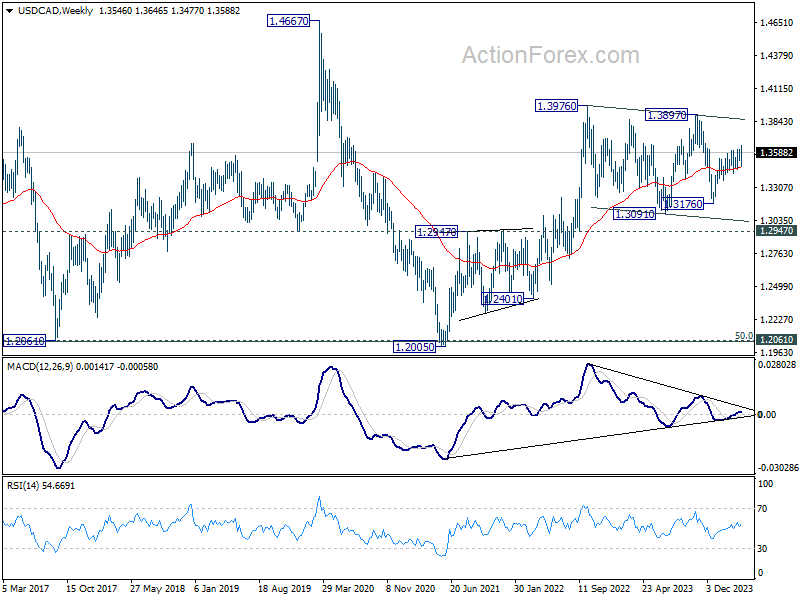
USD/CAD's rise from 1.3176 resumed by breaching 1.3613 resistance last week. Initial bias stays on the upside this week for channel resistance at 1.3665 first. Sustained break there would prompt upside acceleration towards 1.3897 resistance next. For now, near term outlook will stay bullish as long as 1.3477 support holds, in case of retreat.
In the bigger picture, price actions from 1.3976 (2022 high) are viewed as a corrective pattern only. In case of another fall, strong support should emerge above 1.2947 resistance turned support to bring rebound. Overall, larger up trend from 1.2005 (2021 low) is still expected to resume through 1.3976 at a later stage.
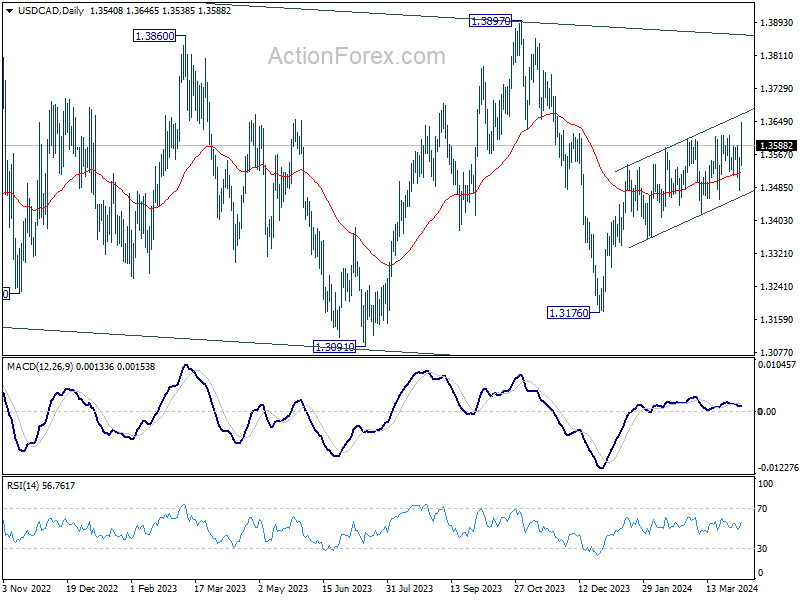
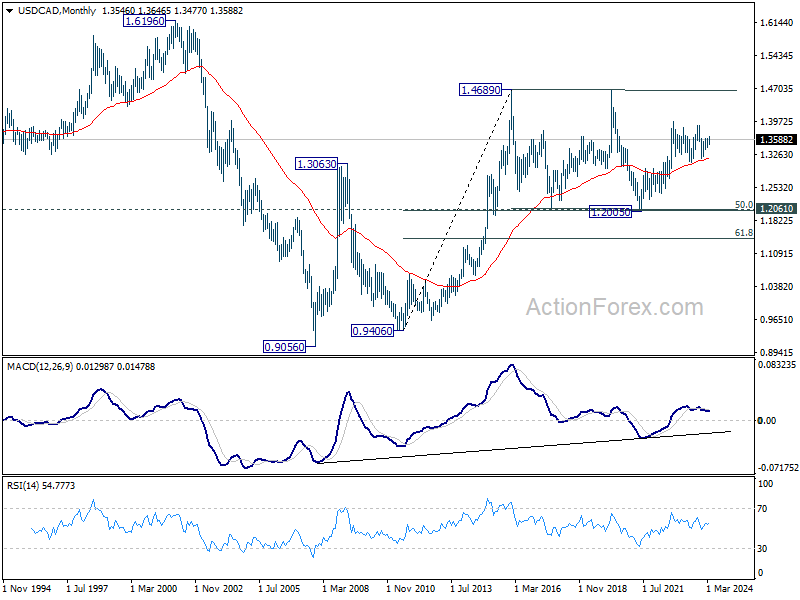
In the longer term picture, price actions from 1.4689 (2016 high) are seen as a consolidation pattern, which might have completed at 1.2005. That is, up trend from 0.9506 (2007 low) is expected to resume at a later stage. This will remain the favored case as long as 1.2947 resistance turned support holds.
GBP/JPY Weekly Outlook
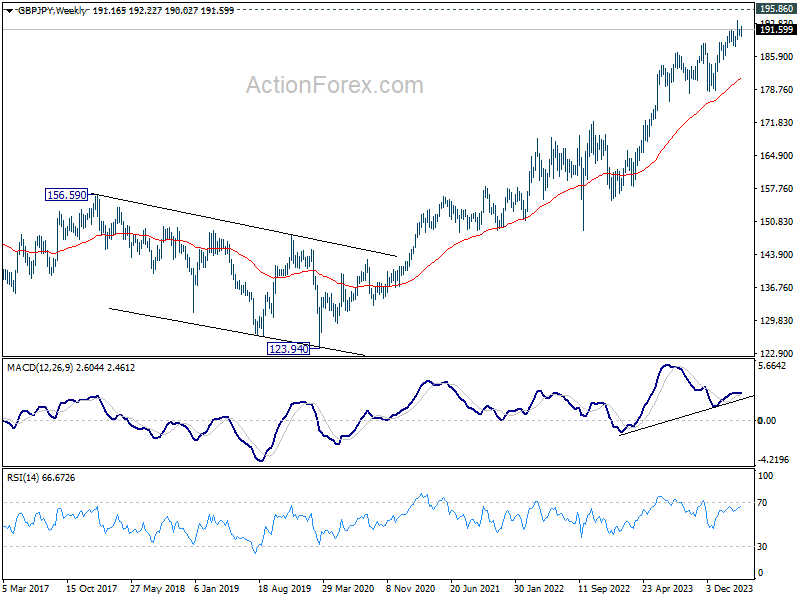
GBP/JPY rebounded after initial dip to 190.02 but failed to break through 193.51 resistance. Initial bias remains neutral this week for more consolidations. On the upside, break of 193.51 will resume larger up trend to 195.86 long term resistance. On the downside, though, break of 190.02 will turn bias to the downside for 187.94 support instead.
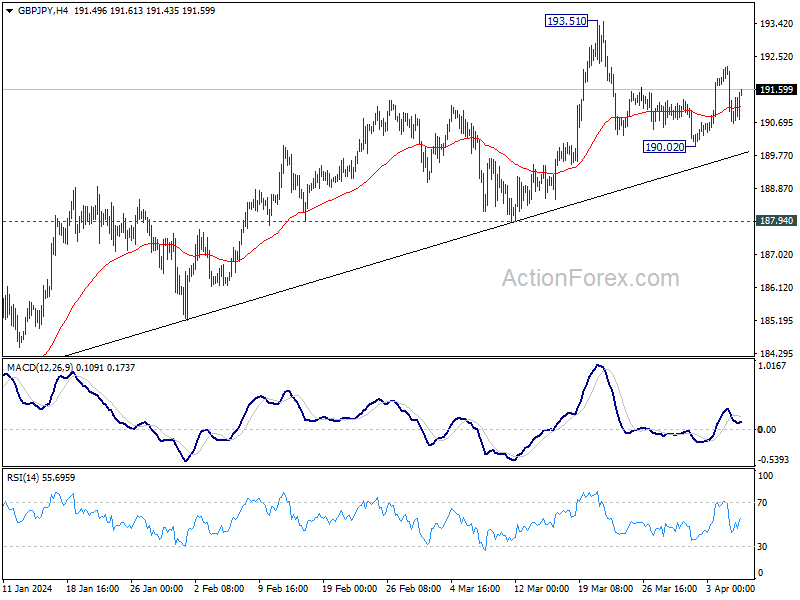
In the bigger picture, current rally is part of the up trend from 123.94 (2020 low), and is in progress for 195.86 long term resistance (2015 high). Break of 187.94 support is needed to be the first sign of medium term topping. Otherwise, outlook will remain bullish in case of retreat.
a href="https://www.actionforex.com/wp-content/uploads/2024/04/gbpjpy20240406w2.png">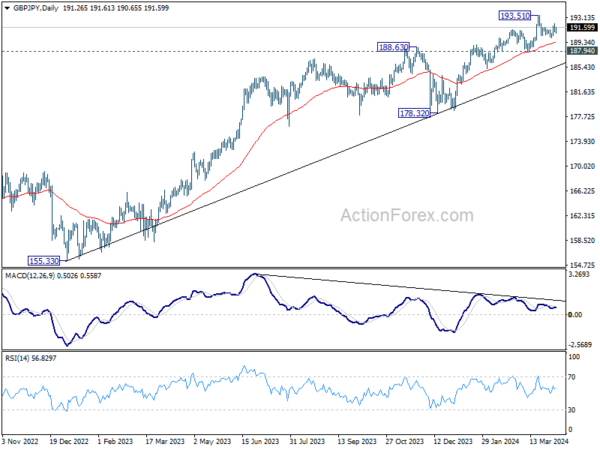
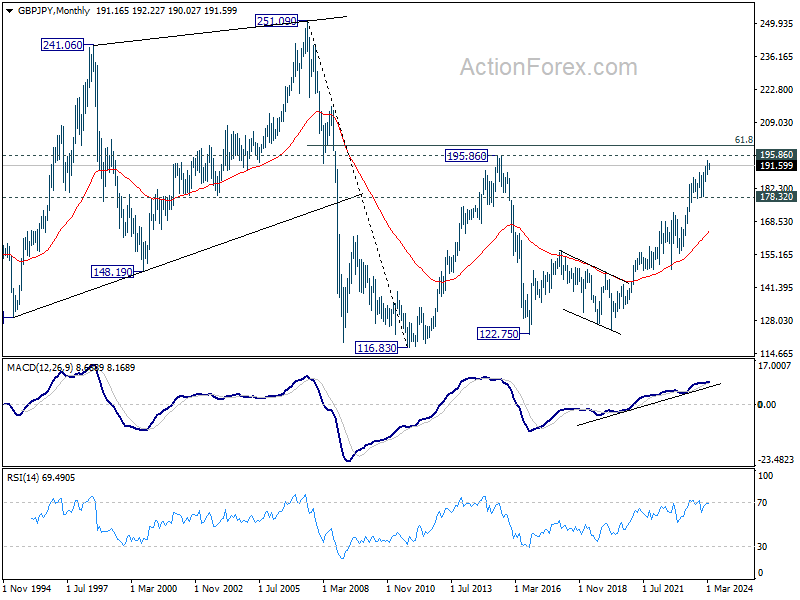
In the longer term picture, rise from 122.75 (2016 low) is seen as the third leg of the pattern from 116.83 (2011 low). Further rally will remain in favor as long as 178.32 support holds. Break of 195.86 (2015 high) is possible. But strong resistance could be seen from 61.8% retracement of 251.09 (2007 high) to 116.83 at 199.80 to limit upside, at least on first attempt.
<
EUR/JPY Weekly Outlook
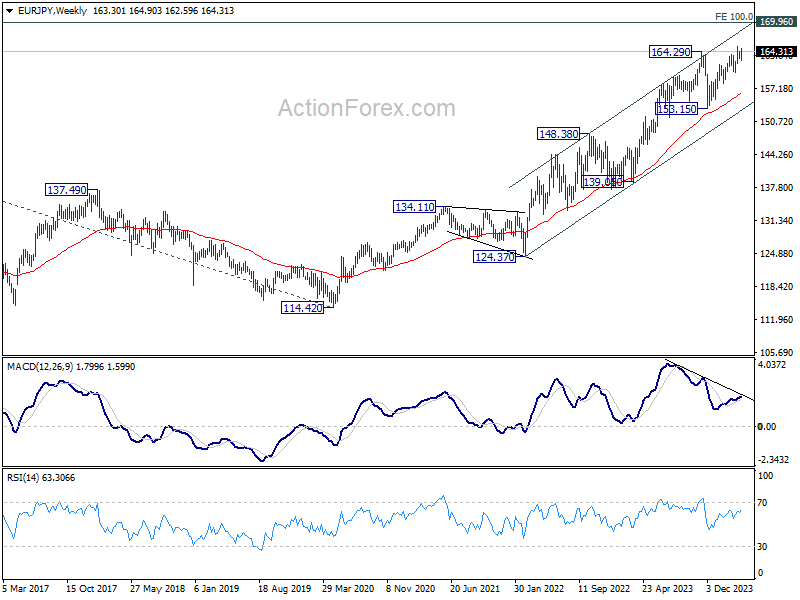
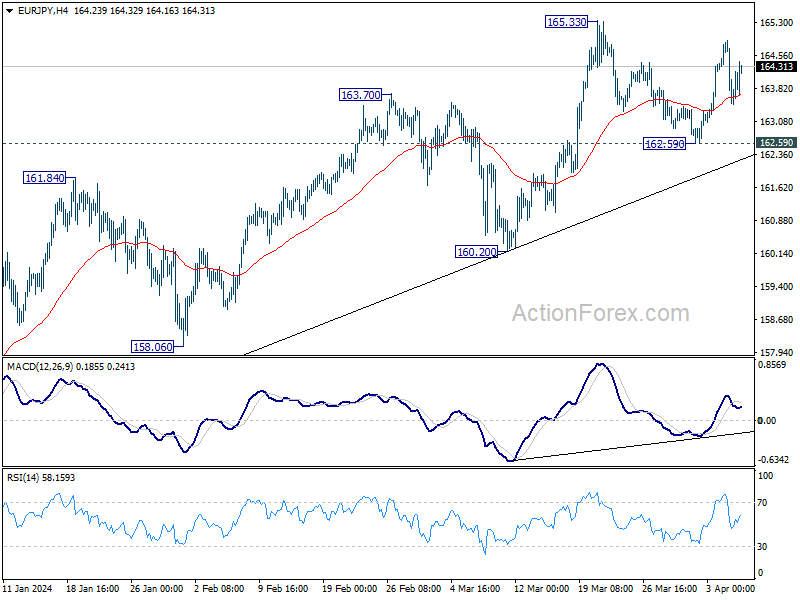
EUR/JPY rebounded after initial dip to 162.59 but failed to break through 165.33 resistance. Initial bias remains neutral this week first and more range trading could be seen. On the upside, firm break of 165.33 will resume larger up trend towards 169.96 key resistance next. On the downside, though, break of 162.59 will turn bias to the downside for 160.20 support next.
In the bigger picture, current rally is part of the up trend from 114.42 (2020 low), which is still in progress. Next target is 169.96 (2008 high). Break of 160.20 support is needed to be the first sign of medium term topping. Otherwise, outlook will stay bullish in case of retreat.
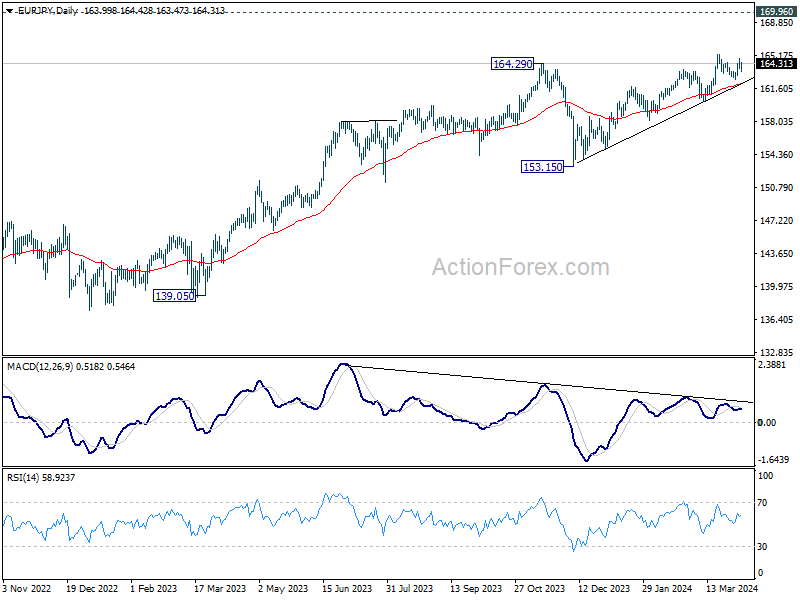
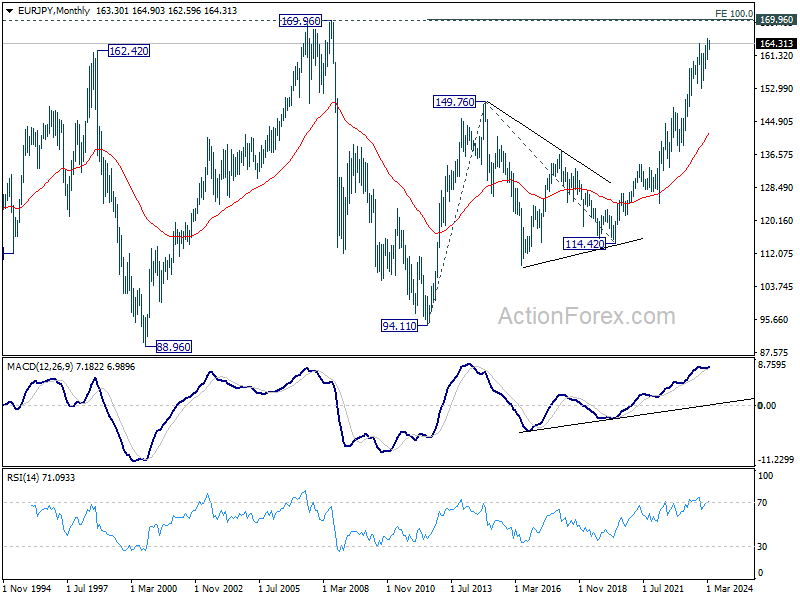
In the long term picture, rise from 114.42 (2020 low) is seen as the third leg of the whole up trend from 94.11 (2012 low). Next target is 100% projection of 94.11 to 149.76 from 114.42 at 170.07 which is close to 169.96 (2008 high). This will remain the favored case as long as 153.15 support holds.