Sample Category Title
Technical Outlook and Review
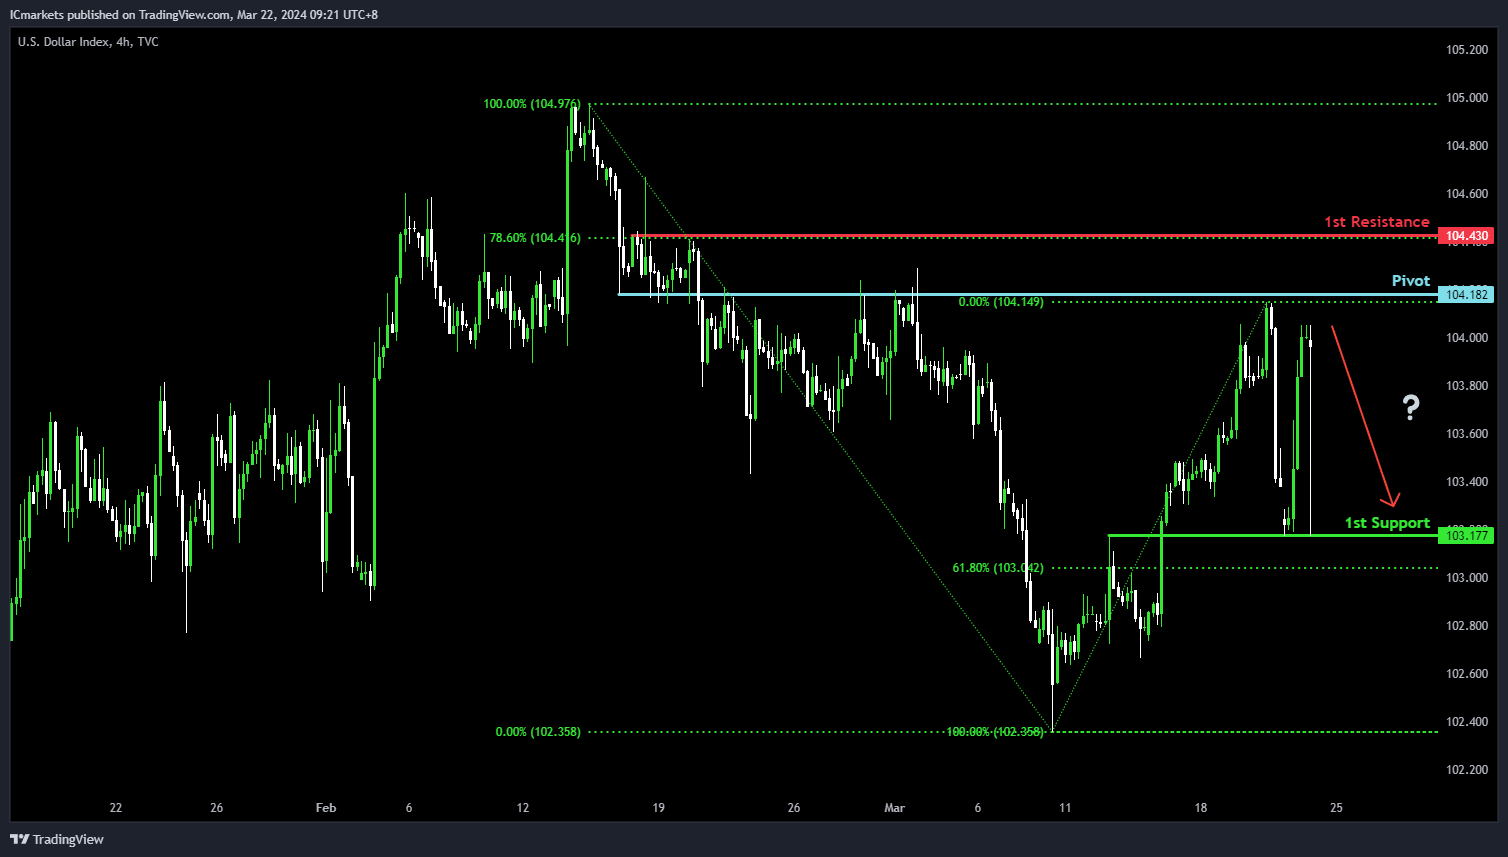
DXY:
The dollar index (DXY) chart currently demonstrates an overall bullish momentum. In this context, there is a potential scenario for price to rise towards the pivot before potentially making a bearish reaction and pull back towards the 1st support.
The pivot level at 104.18 is identified as an overlap resistance where price could potentially pull back from to drop lower. The 1st support level at 103.17 is marked as an overlap support that aligns close to the 61.80% Fibonacci Retracement level, reinforcing its significance as a key support level.
On the resistance side, the 1st resistance level at 104.43 is noted as a pullback resistance that aligns with the 78.60% Fibonacci Retracement level, potentially limiting any further upward movement.
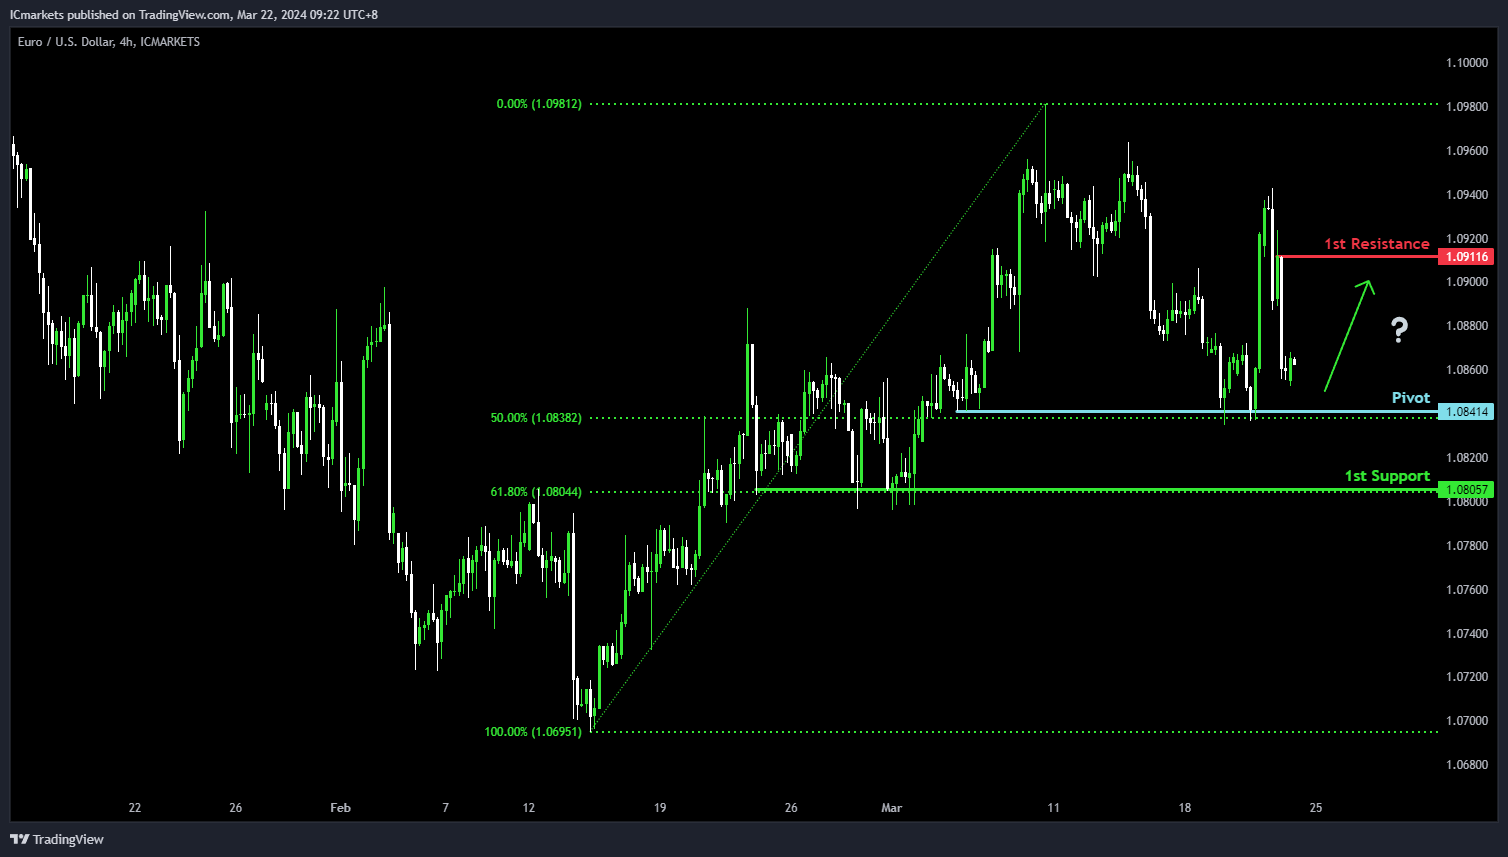
EUR/USD:
The EUR/USD chart currently demonstrates an overall bearish momentum. In this context, there is a potential scenario for price to continue falling towards the pivot before potentially making a weak bullish reaction.
The pivot level at 1.0841 is identified as a pullback support that aligns with the 50.00% Fibonacci Retracement level where price could potentially bounce from to move higher. The 1st resistance level at 1.0911 is noted as a pullback resistance, potentially limiting any further upward movement.
On the support side, the 1st support level at 1.0805 is marked as a pullback support that aligns with the 61.80% Fibonacci Retracement level, reinforcing its significance as a key support level.
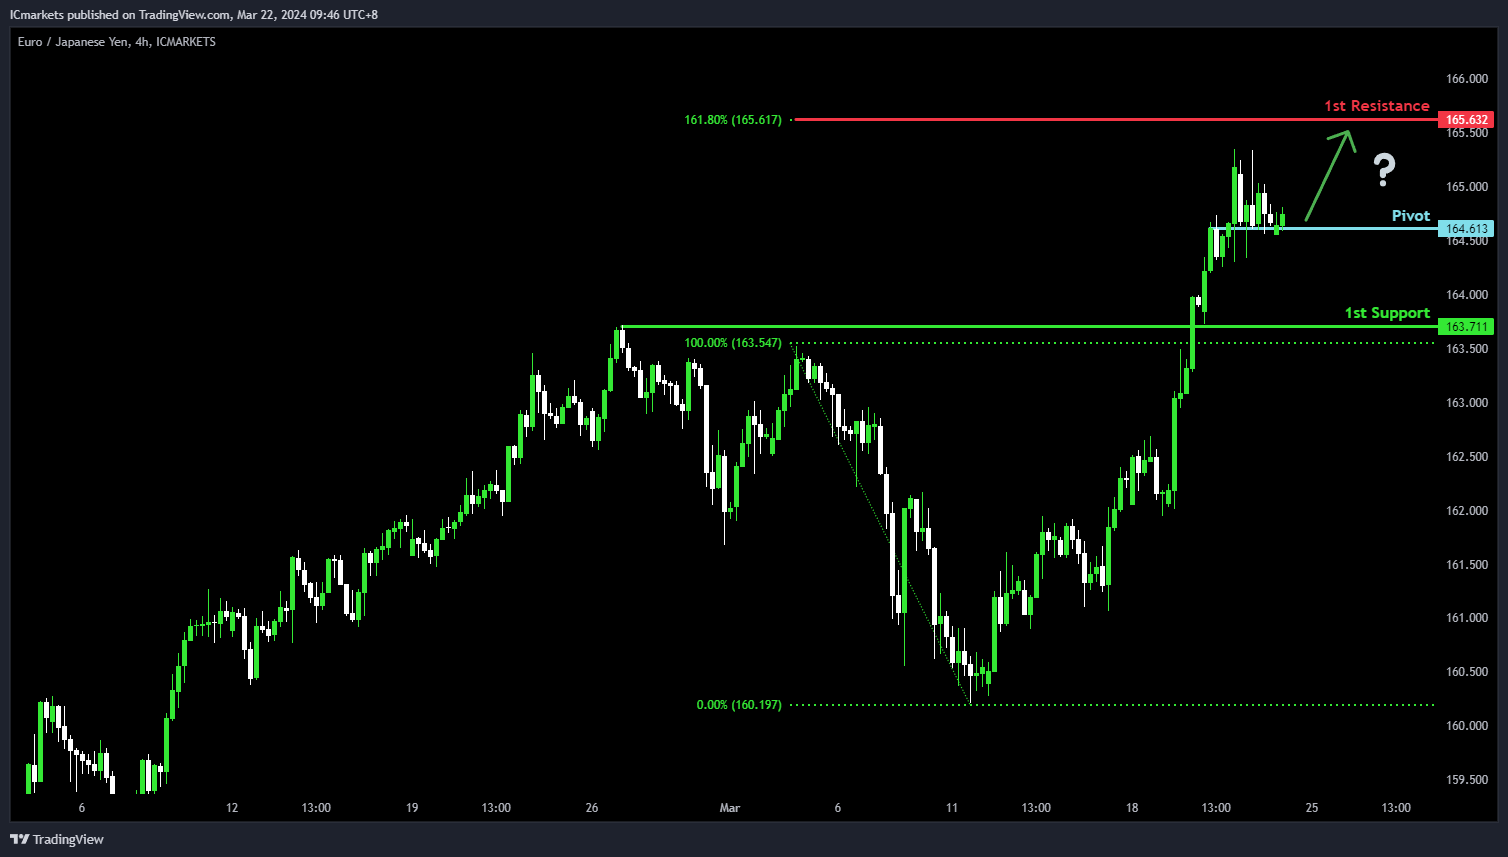
EUR/JPY:
The EUR/JPY chart currently demonstrates an overall bullish momentum. In this context, there is a potential scenario for price to potentially bounce off the pivot to rise towards the 1st resistance.
The pivot level at 164.61 is identified as an overlap support where price could potentially bounce from to rise higher. The 1st resistance level at 165.63 is noted as a resistance level that aligns with the 161.80% Fibonacci Extension level, potentially limiting any further upward movement.
On the support side, the 1st support level at 163.71 is marked as an overlap support, reinforcing its significance as a key support level.
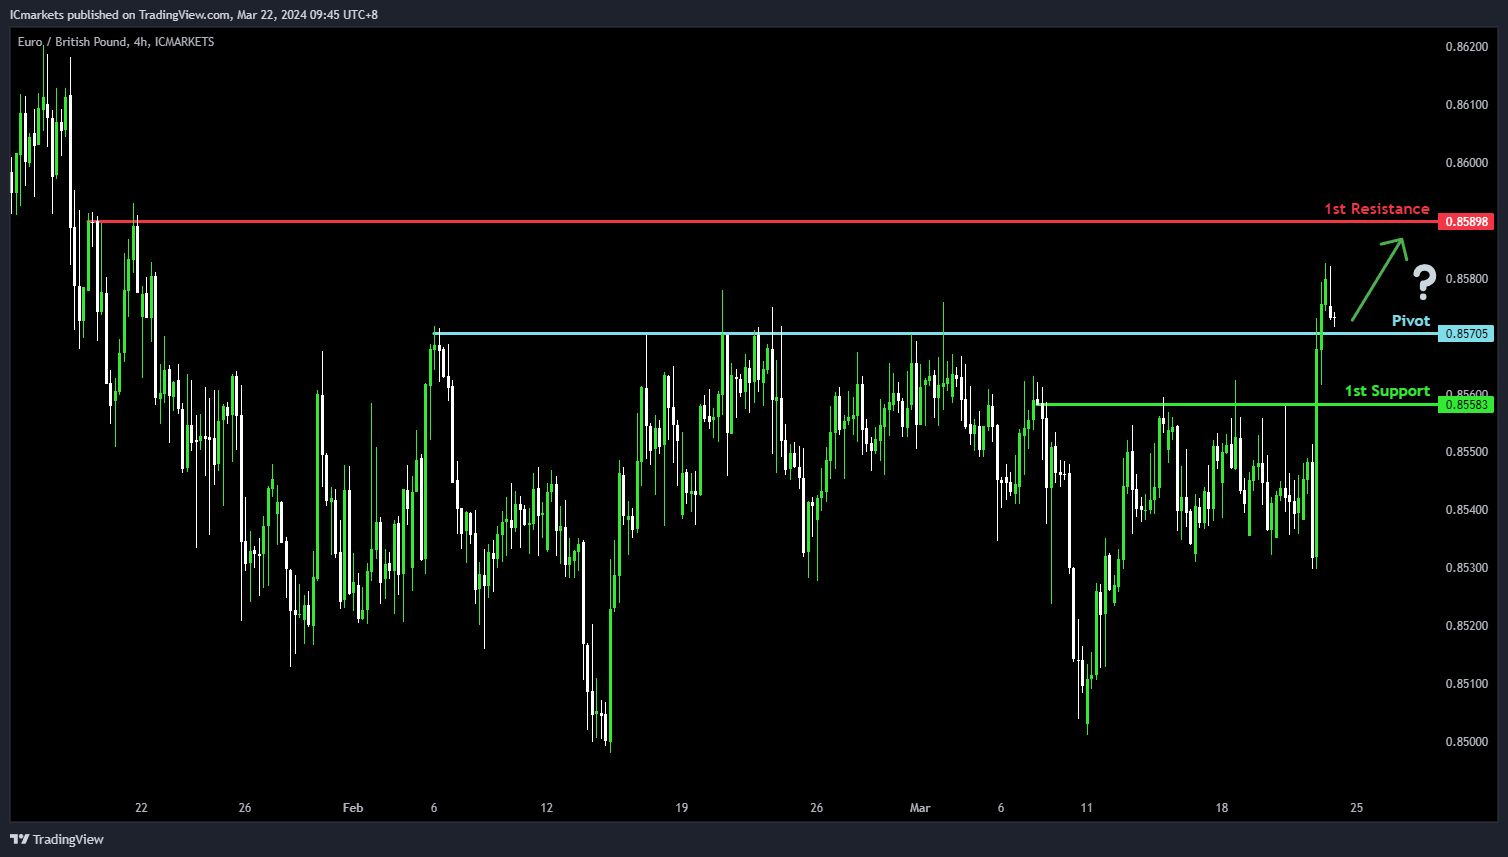
EUR/GBP:
The EUR/GBP chart currently demonstrates an overall bullish momentum. In this context, there is a potential scenario for price to potentially bounce off the pivot to rise towards the 1st resistance.
The pivot level at 0.8570 is identified as a pullback where price could potentially bounce from to rise higher. The 1st resistance level at 0.8589 is noted as a pullback resistance, potentially limiting any further upward movement.
On the support side, the 1st support level at 0.8558 is marked as a pullback support, reinforcing its significance as a key support level.
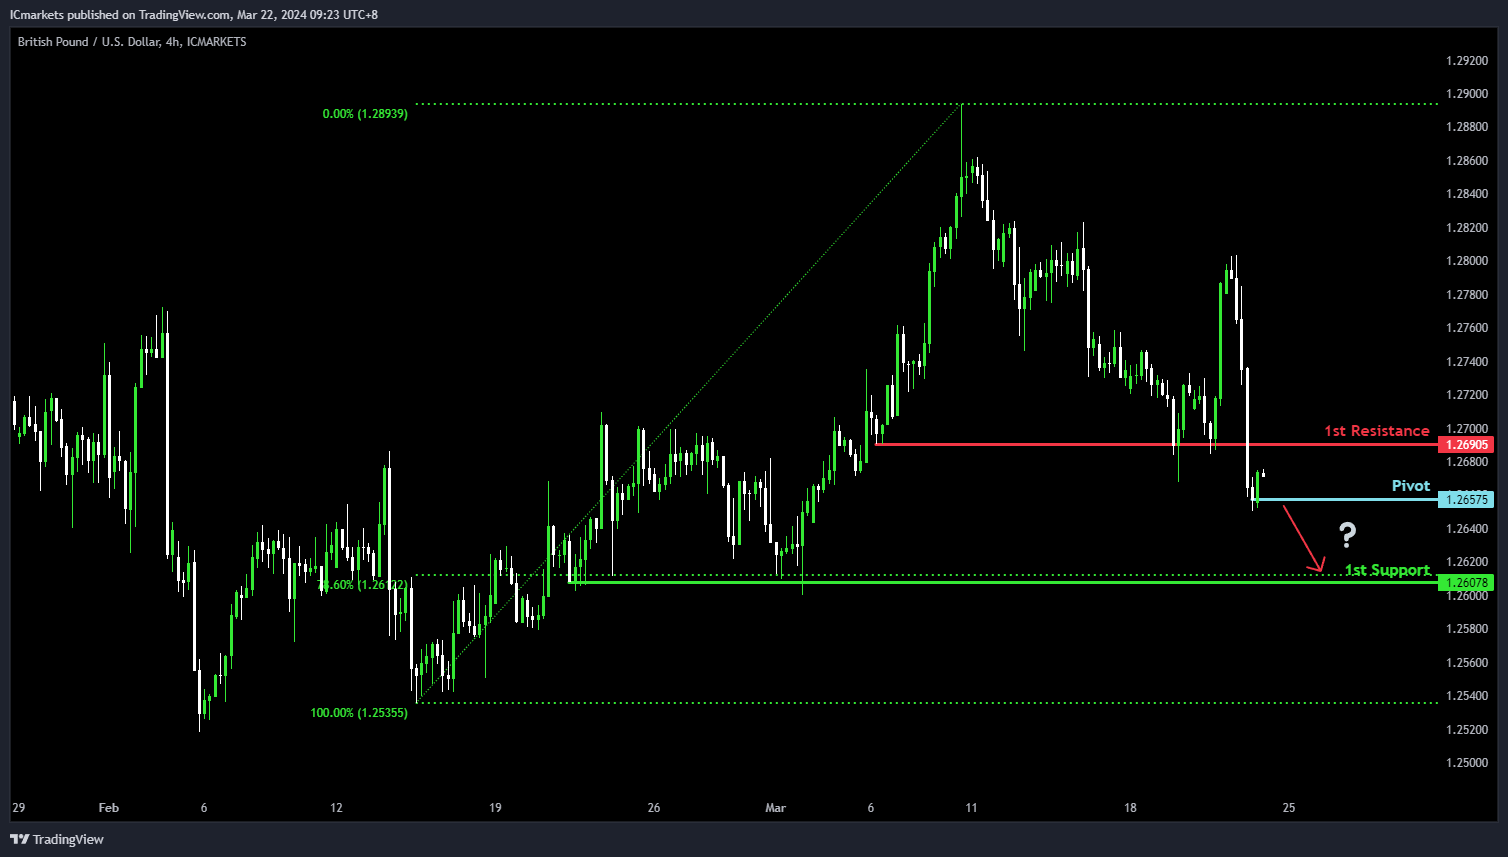
GBP/USD:
The GBP/USD chart currently demonstrates an overall bearish momentum. In this context, there is a potential scenario for price to break under the pivot and fall towards the 1st support.
The pivot level at 1.2657 is identified as a pullback support where price could potentially break under to continue the bearish momentum. The 1st support level at 1.2607 is marked as a pullback support that aligns with the 78.60% Fibonacci Retracement level, reinforcing its significance as a key support level.
On the resistance side, the 1st resistance level at 1.2690 is noted as a pullback resistance, potentially limiting any further upward movement.
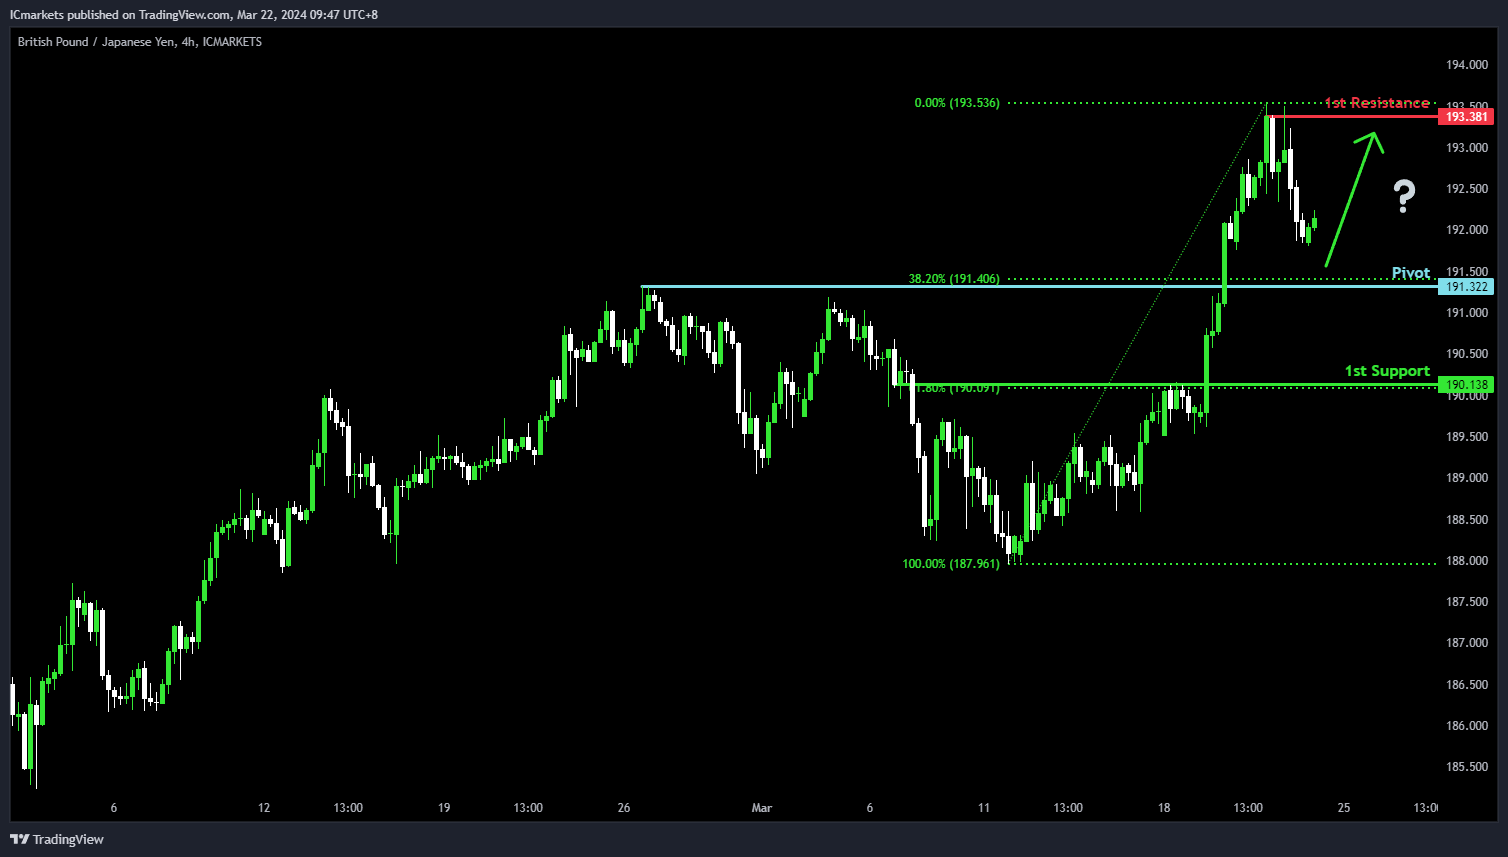
GBP/JPY:
The GBP/JPY chart currently demonstrates an overall bullish momentum. In this context, there is a potential scenario for price to potentially bounce off the pivot to rise towards the 1st resistance.
The pivot level at 191.32 is identified as a pullback support that aligns with the 38.20% Fibonacci Retracement level where price could potentially bounce from to rise higher. The 1st resistance level at 193.38 is noted as a pullback resistance, potentially limiting any further upward movement.
On the support side, the 1st support level at 190.13 is marked as an overlap support that aligns with the 61.80% Fibonacci Retracement level, reinforcing its significance as a key support level.
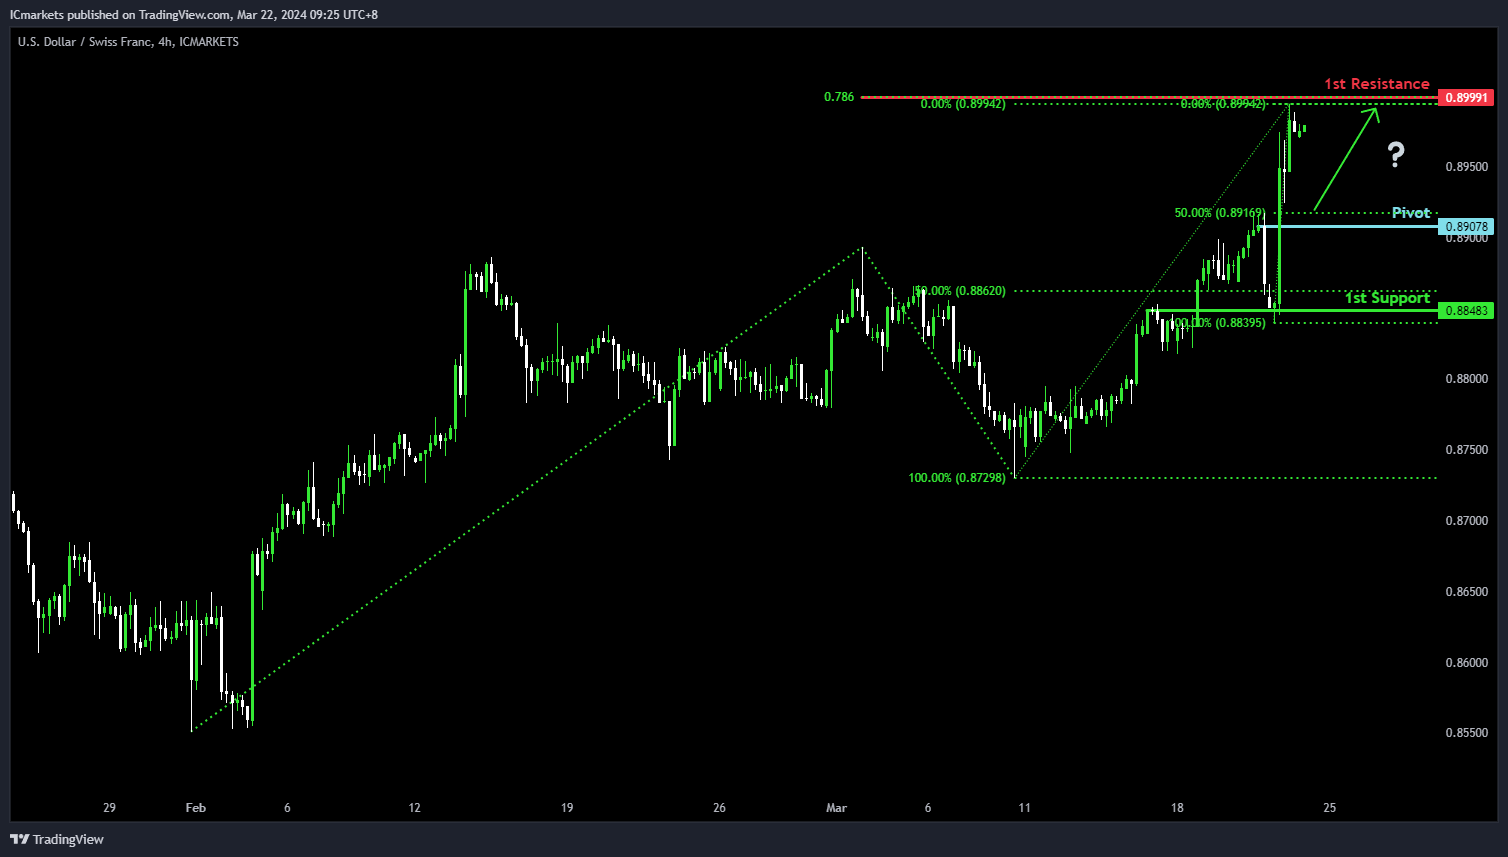
USD/CHF:
The USD/CHF chart currently demonstrates an overall bullish momentum. In this context, there is a potential scenario for price to potentially bounce off the pivot to rise towards the 1st resistance.
The pivot level at 0.8907 is identified as a pullback support that aligns close to the 50.00% Fibonacci Retracement level where price could potentially bounce from to rise higher. The 1st resistance level at 0.8999 is noted as a resistance level that aligns with the 78.60% Fibonacci Projection level, potentially limiting any further upward movement.
On the support side, the 1st support level at 0.8848 is marked as an overlap support that aligns close to the 50.00% Fibonacci Retracement level, reinforcing its significance as a key support level.
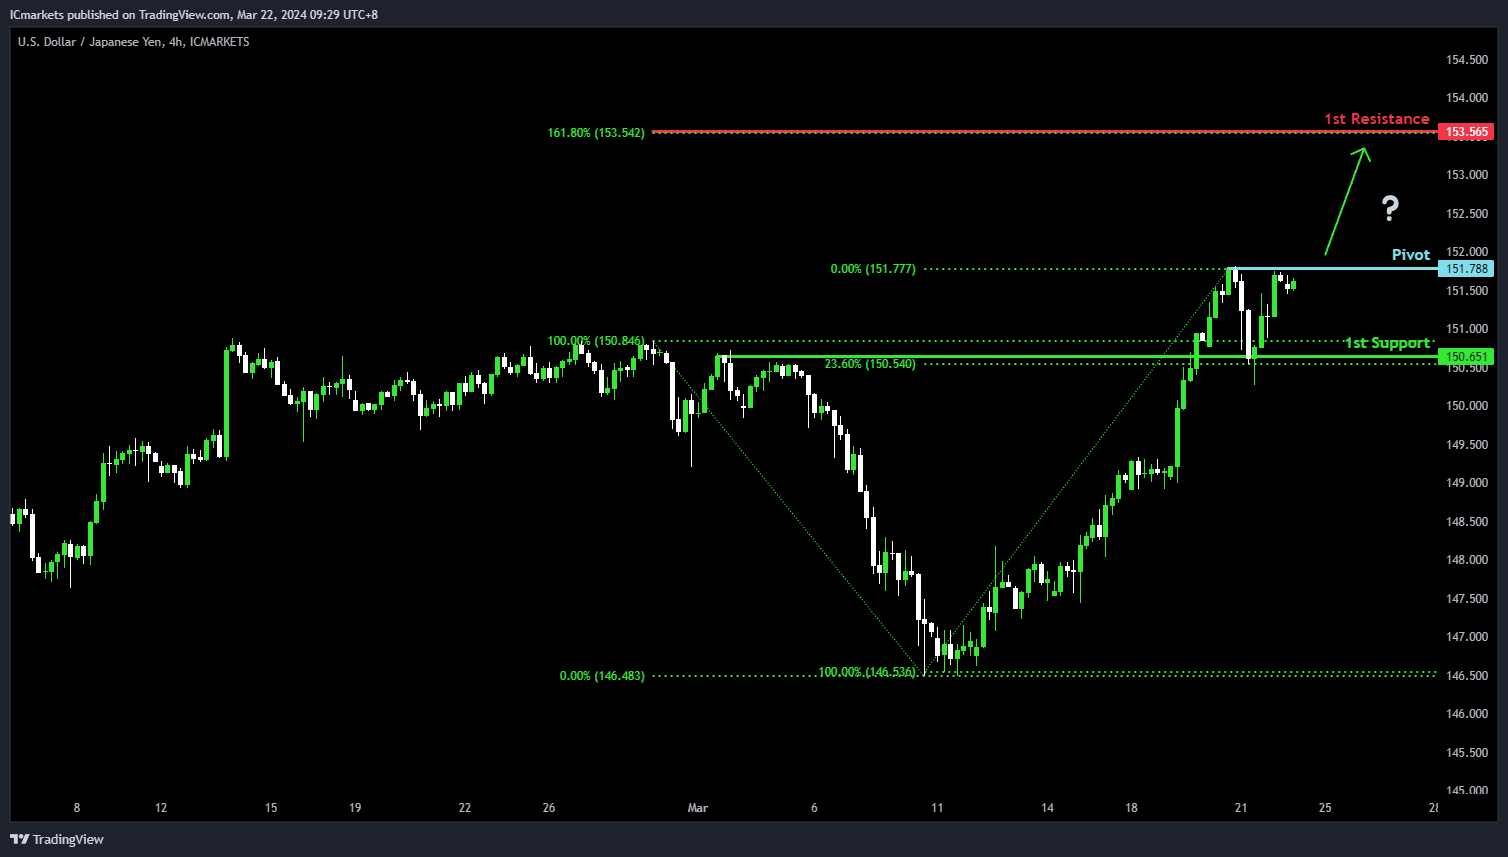
USD/JPY:
The USD/JPY chart currently demonstrates an overall bullish momentum. In this context, there is a potential scenario for price to potentially break above the pivot to rise towards the 1st resistance.
The pivot level at 151.78 is identified as a pullback resistance where price could potentially break above to rise higher. The 1st resistance level at 153.56 is noted as a resistance level that aligns with the 161.80% Fibonacci Extension level, potentially limiting any further upward movement.
On the support side, the 1st support level at 150.65 is marked as an overlap support that aligns close to the 23.60% Fibonacci Retracement level, reinforcing its significance as a key support level.
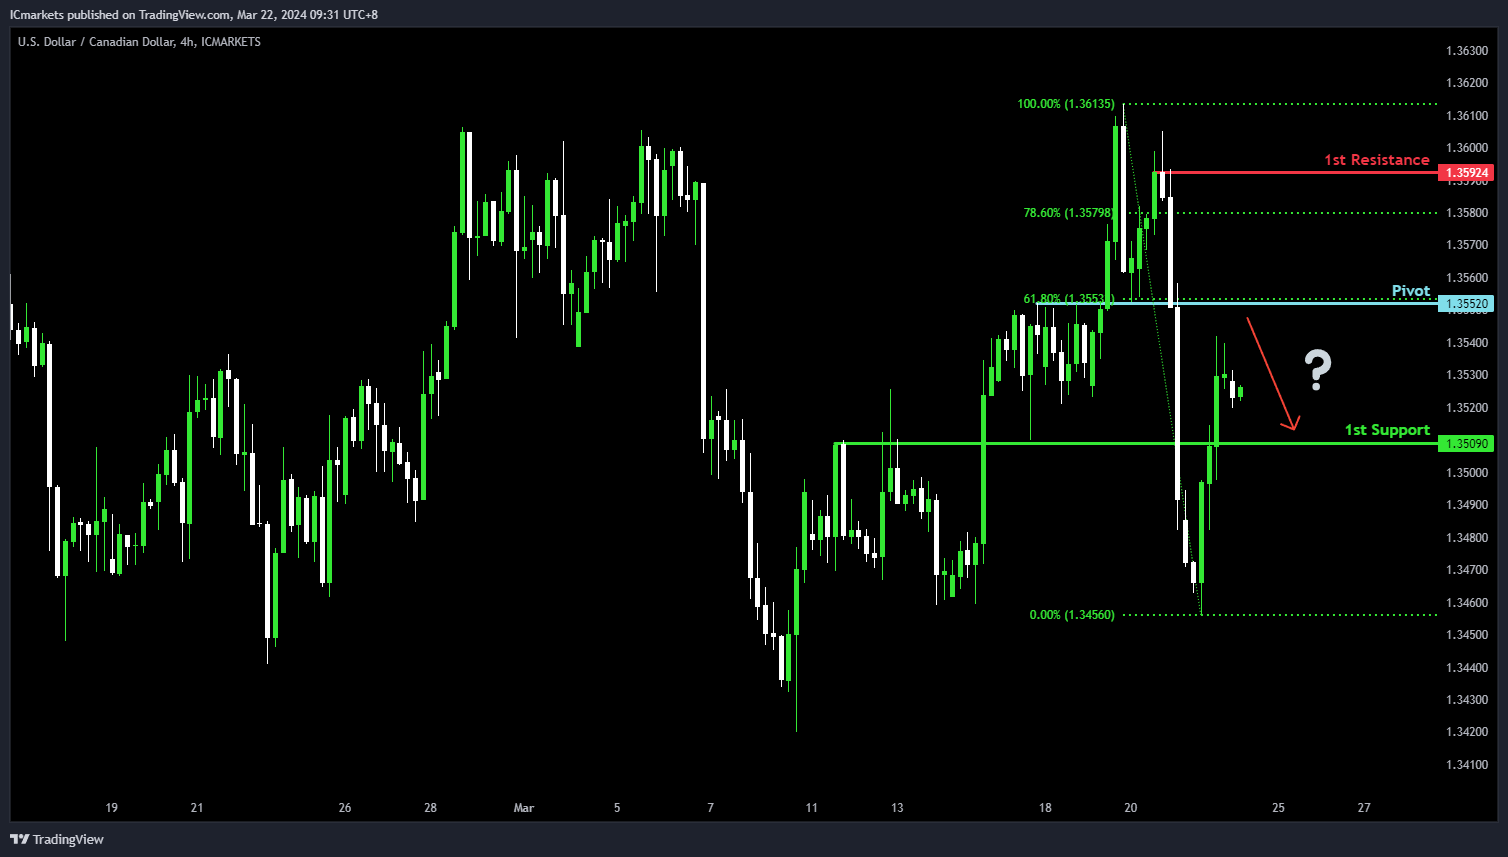
USD/CAD:
The USD/CAD chart currently demonstrates an overall bullish momentum. In this context, there is a potential scenario for price to rise towards the pivot and make a weak bearish reaction from here.
The pivot level at 1.3552 is identified as a pullback resistance that aligns with the 61.80% Fibonacci Retracement level where price could potentially make a weak bearish reaction. The 1st resistance level at 1.3592 is noted as a pullback resistance that sits above the 78.60% Fibonacci Retracement level, potentially limiting any further upward movement.
On the support side, the 1st support level at 1.3509 is marked as an overlap support, reinforcing its significance as a key support level.
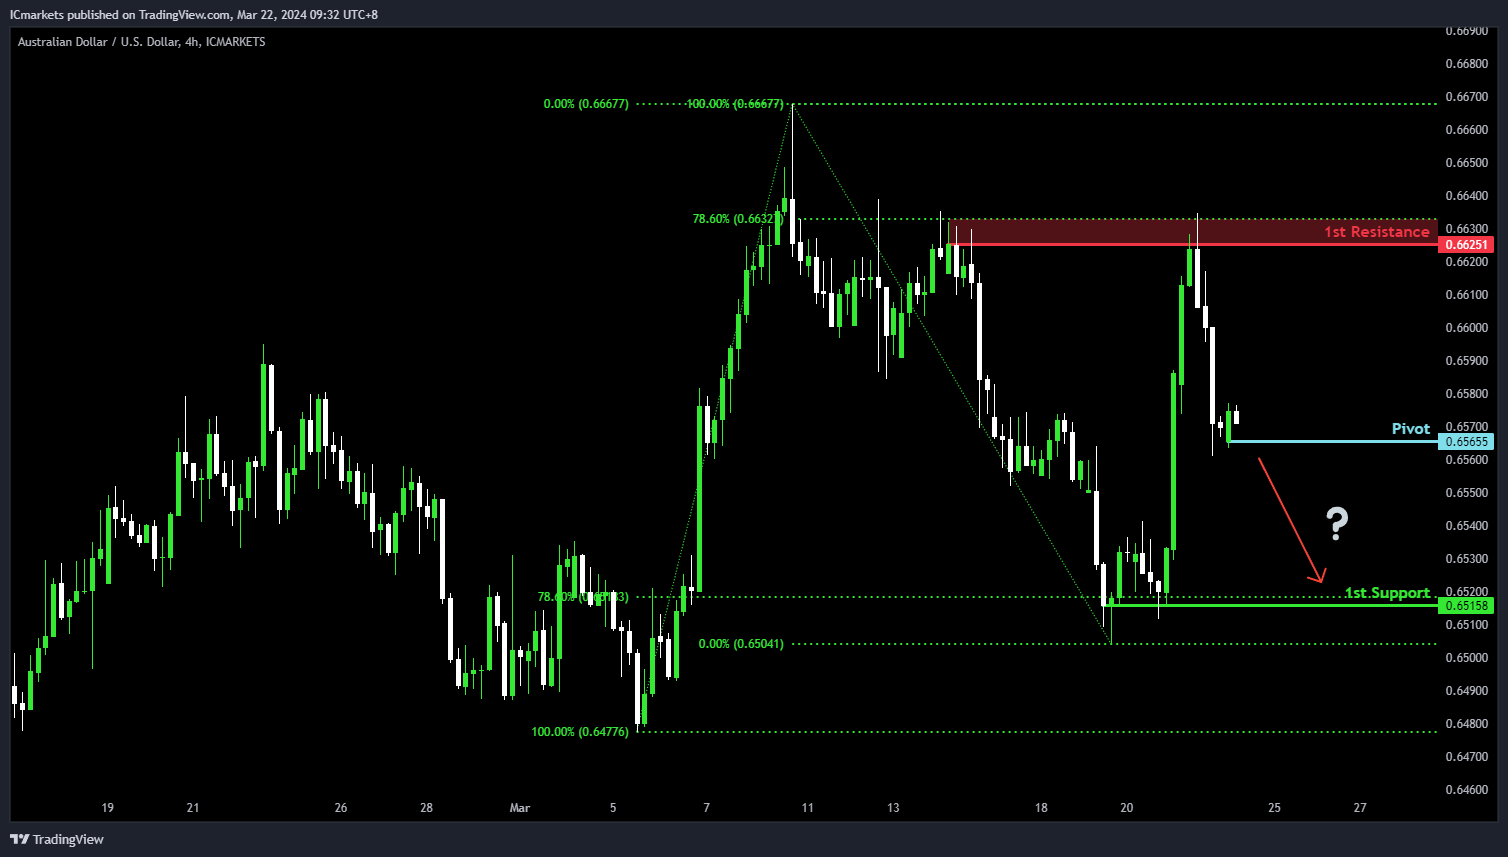
AUD/USD:
The AUD/USD chart currently demonstrates an overall bearish momentum. In this context, there is a potential scenario for price to break under the pivot and fall towards the 1st support.
The pivot level at 0.6565 is identified as a pullback support where price could potentially break under to drop lower. The 1st support level at 0.6515 is marked as a pullback support that aligns with the 78.60% Fibonacci Retracement level, reinforcing its significance as a key support level.
On the resistance side, the 1st resistance level at 0.6625 is noted as a pullback resistance that aligns close to the 78.60% Fibonacci Retracement level, potentially limiting any further upward movement.
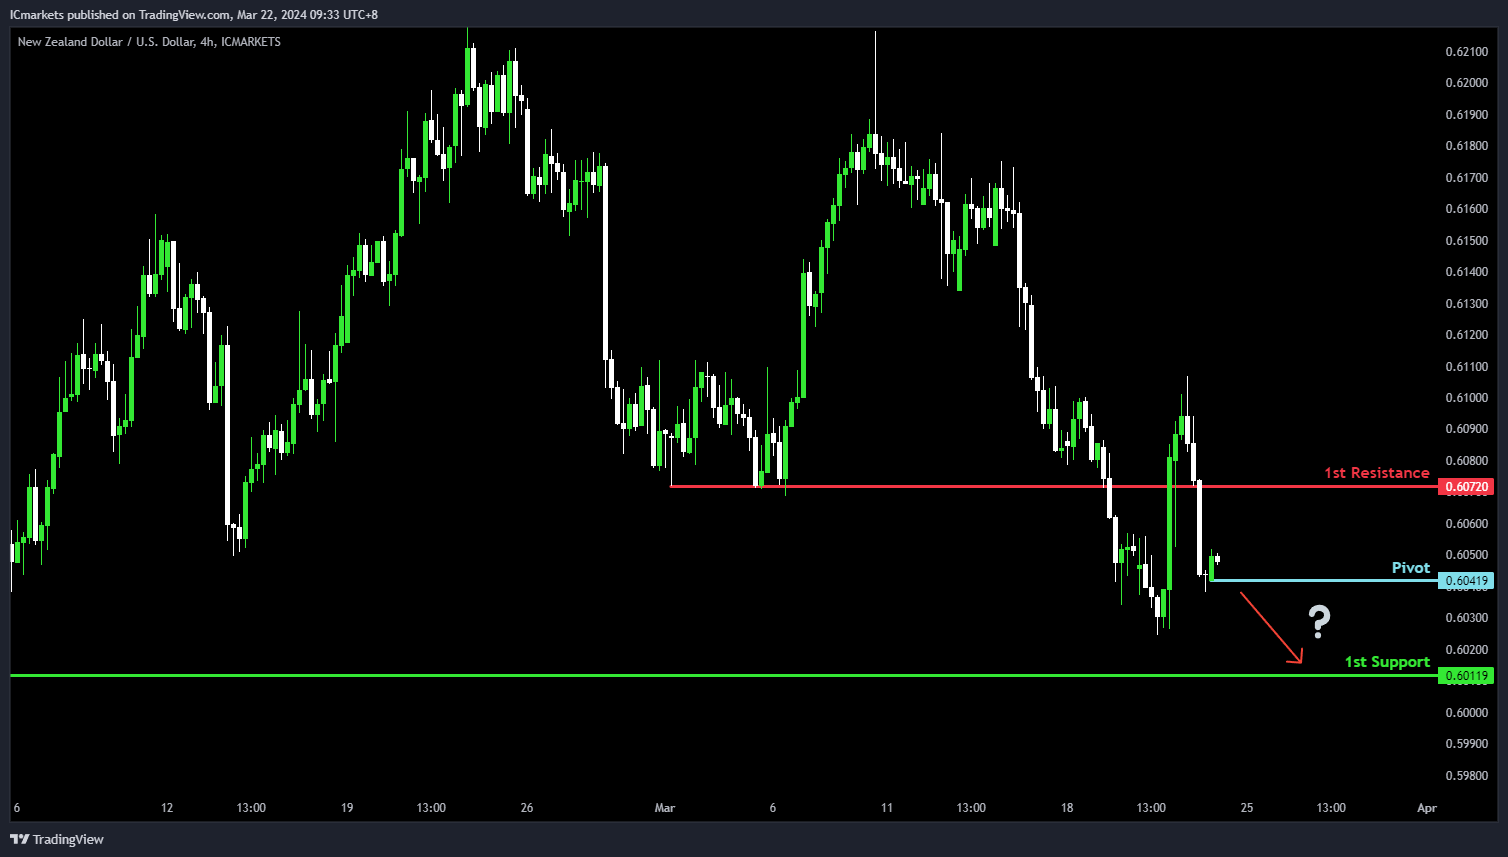
NZD/USD
The NZD/USD chart currently demonstrates an overall bearish momentum. In this context, there is a potential scenario for price to break under the pivot and fall towards the 1st support.
The pivot level at 0.6041 is identified as a pullback support where price could potentially break under to drop lower. The 1st support level at 0.6011 is also marked as a pullback support, reinforcing its significance as a key support level.
On the resistance side, the 1st resistance level at 0.6072 is noted as a pullback resistance, potentially limiting any further upward movement.
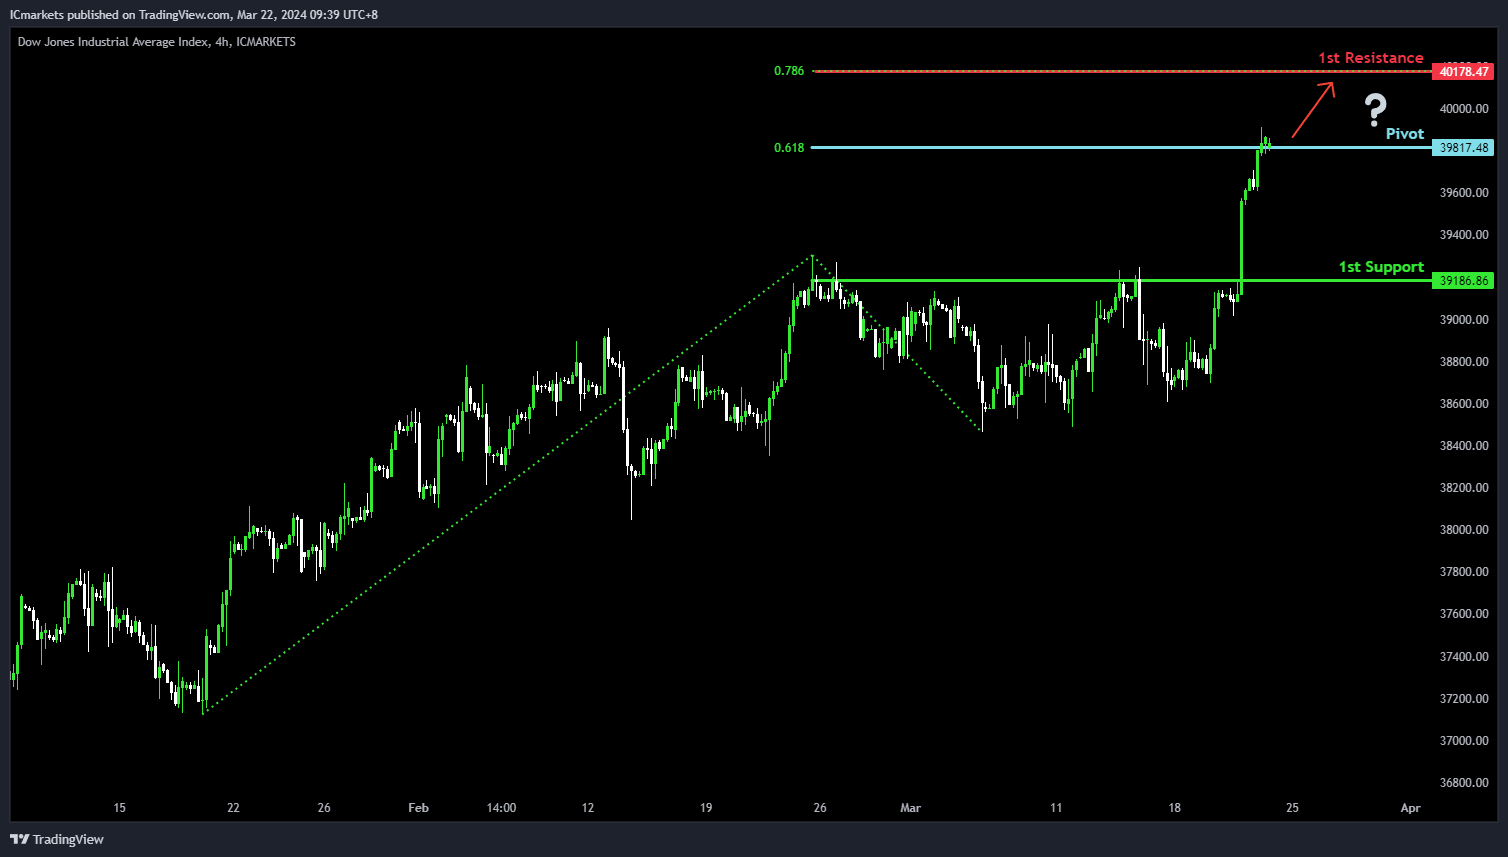
DJ30:
The Dow Jones chart (DJ30) currently demonstrates an overall bullish momentum. In this context, there is a potential scenario for price to break above the pivot and rise towards the 1st resistance.
The pivot level at 39,817.48 is identified as a level where price could potentially break above to rise higher. The 1st resistance level at 40,178.47 is noted as a resistance level that aligns with the 78.60% Fibonacci Projection level, potentially impeding any further bullish movement.
On the support side, the 1st support level at 39,186.86 is marked as a pullback support, reinforcing its significance as a key support level.
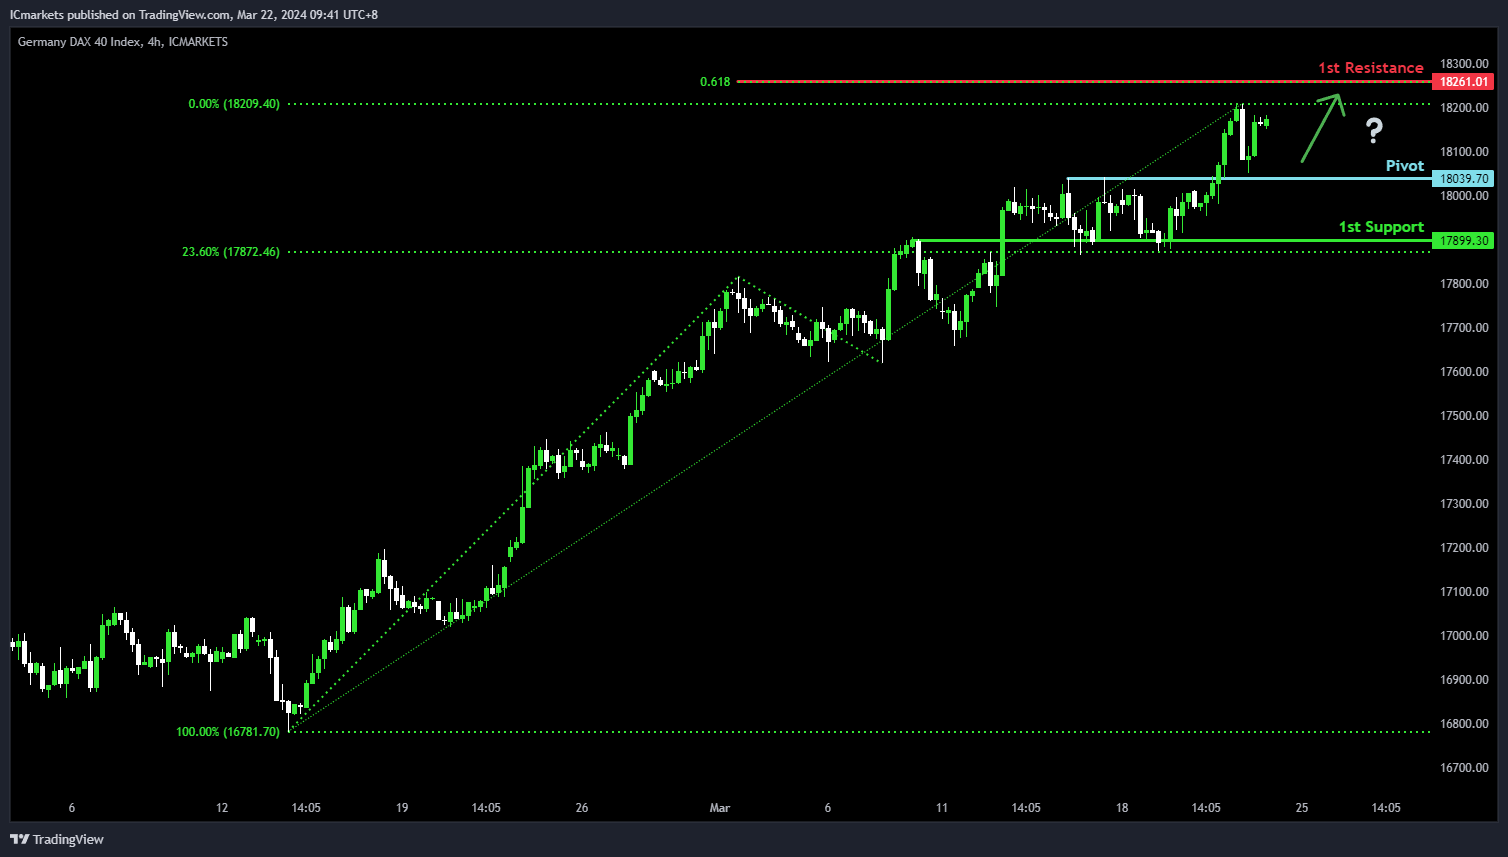
GER40:
The DAX chart (GER40) currently demonstrates an overall bullish momentum. In this context, there is a potential scenario for price to fall towards the pivot before making a bullish bounce towards the 1st resistance.
The pivot level at 18,039.70 is identified as an overlap support where price could potentially reverse from to bounce higher. The 1st resistance level at 18,261.01 is noted as a resistance level that aligns with the 61.80% Fibonacci Projection level, potentially impeding any further bullish movement.
On the support side, the 1st support level at 17,899.30 is marked as an overlap support, reinforcing its significance as a key support level.
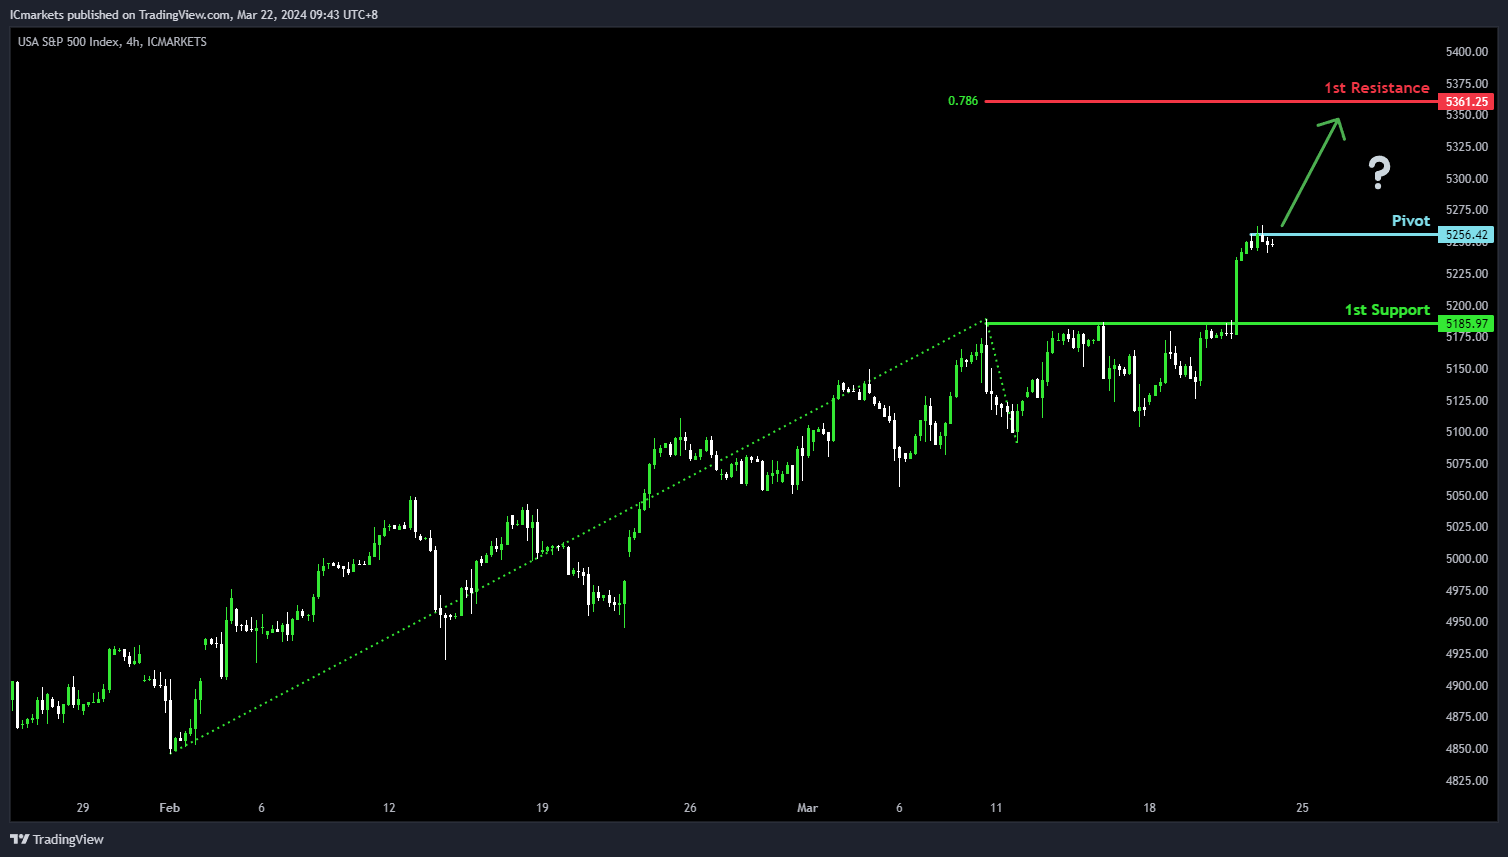
US500:
The S&P 500 chart (US500) currently demonstrates an overall bullish momentum. In this context, there is a potential scenario for price to break above the pivot and rise towards the 1st resistance.
The pivot level at 5,256.42 is identified as a level where price could potentially break above to rise higher. The 1st resistance level at 5,361.25 is noted as a resistance level that aligns with the 78.60% Fibonacci Projection level, potentially impeding any further bullish movement.
On the support side, the 1st support level at 5,185.97 is marked as a pullback support, reinforcing its significance as a key support level.
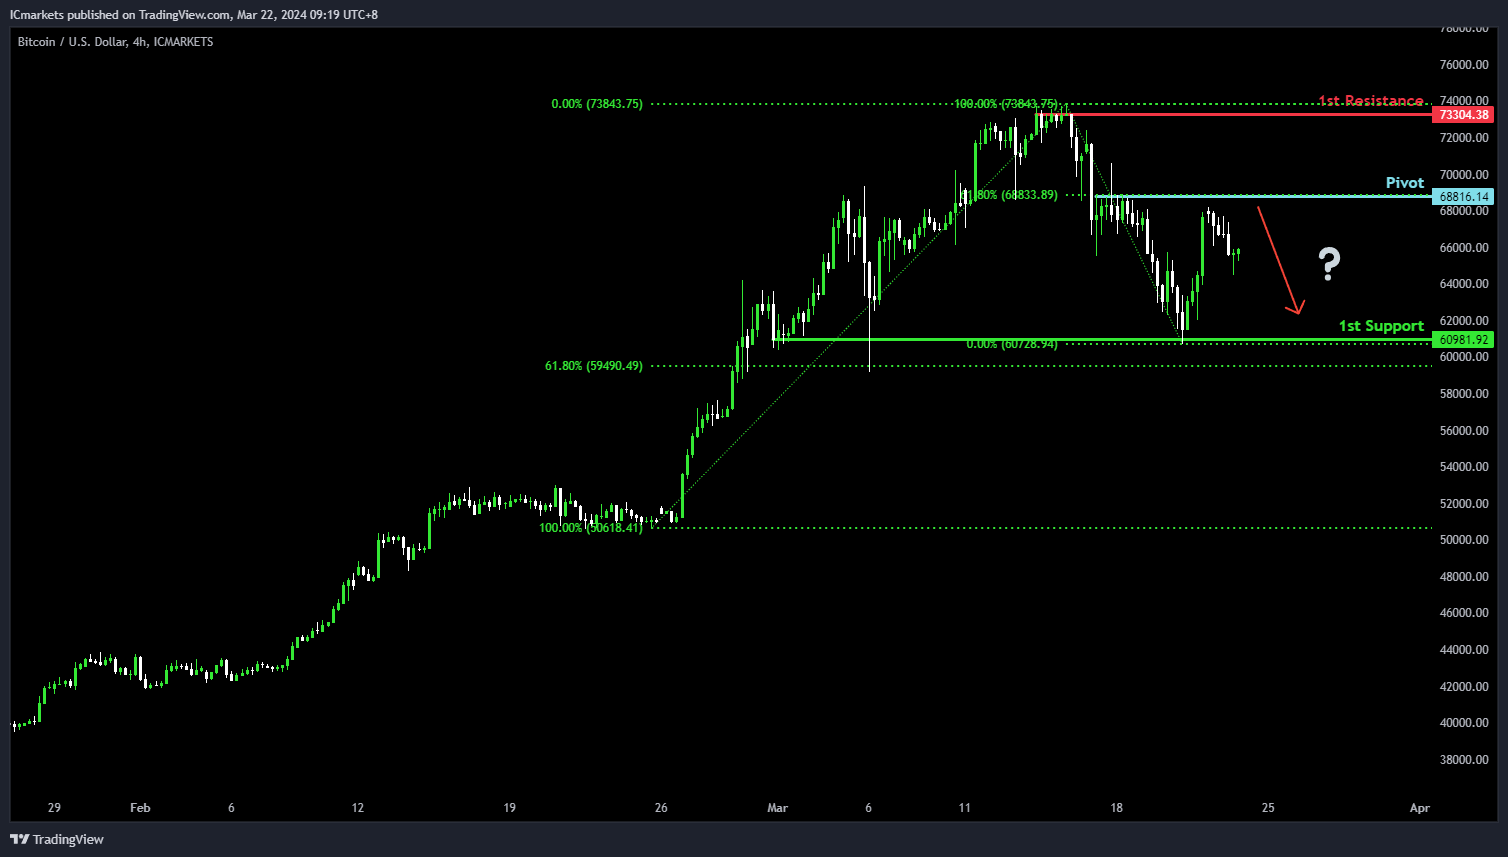
BTC/USD:
The Bitcoin chart (BTC/USD) currently demonstrates an overall bearish momentum. However, there is a potential scenario for price to rise towards the pivot and reverse to drop lower towards the 1st support.
The pivot level at 68,816.14 is identified as a pullback support that aligns with the 61.80% Fibonacci Retracement level where price could potentially make a bearish reversal and drop lower. The 1st support level at 60,981.92 is marked as a pullback support that aligns close to the 61.80% Fibonacci Retracement level, reinforcing its significance as a key support level.
To the upside, the 1st resistance level at 73,304.38 is noted as a swing-high resistance at the all-time high, further reinforcing its significance as a potential barrier to further bullish movement.
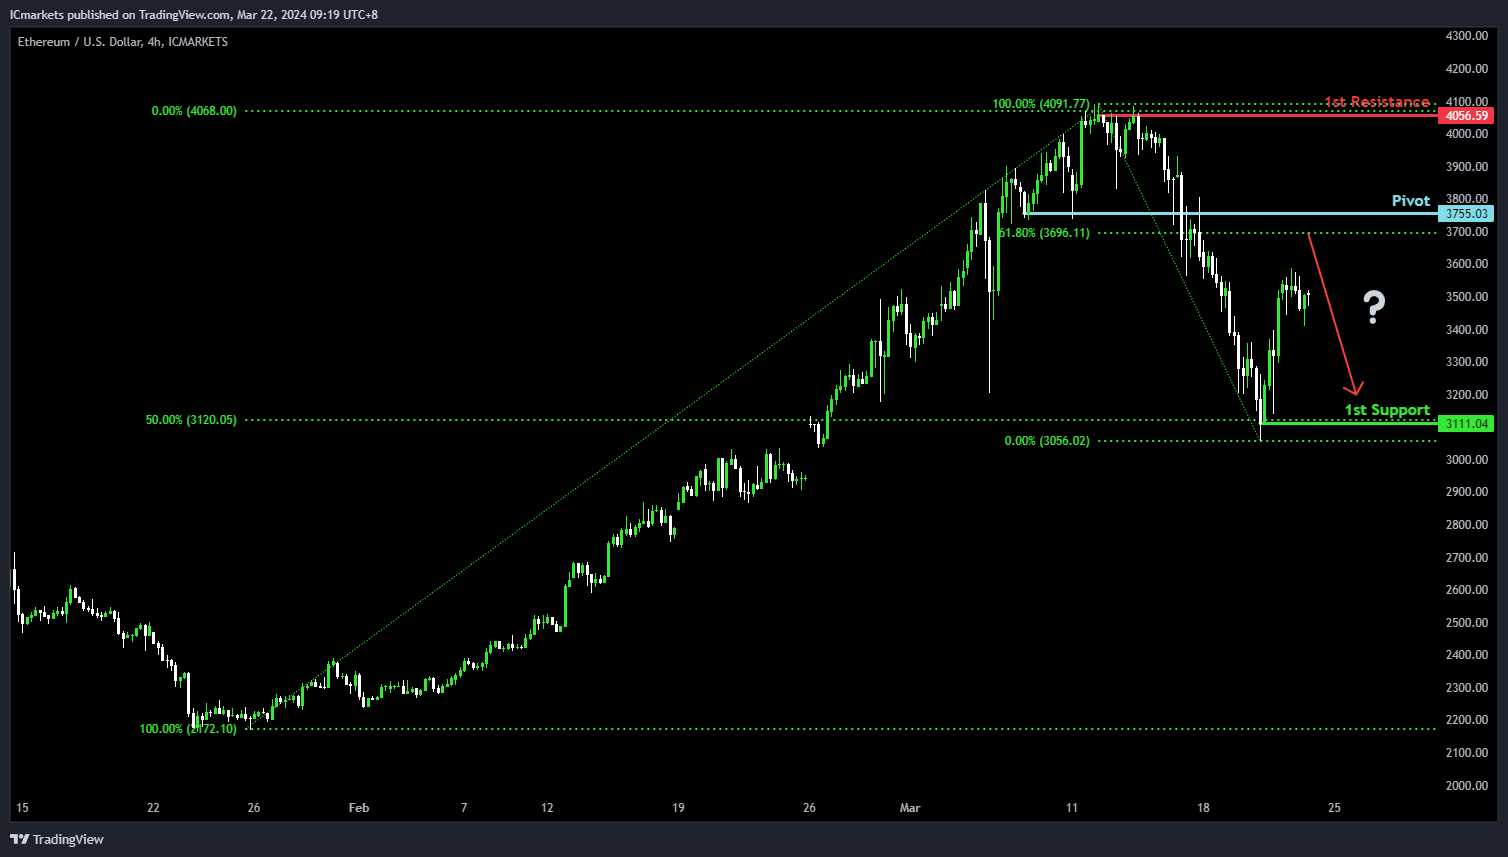
ETH/USD:
The Ethereum chart (ETH/USD) currently demonstrates an overall bearish momentum. However, there is a potential scenario for price to rise towards the pivot and reverse to drop lower towards the 1st support.
The pivot level at 3,755.03 is identified as a pullback support that aligns close to the 61.80% Fibonacci Retracement level where price could potentially make a bearish reversal and drop lower. The 1st support level at 3,111.04 is marked as a pullback support that aligns with the 50.00% Fibonacci Retracement level, reinforcing its significance as a key support level.
To the upside, the 1st resistance level at 4,056.59 is noted as a swing-high resistance, further reinforcing its significance as a potential barrier to further bullish movement.
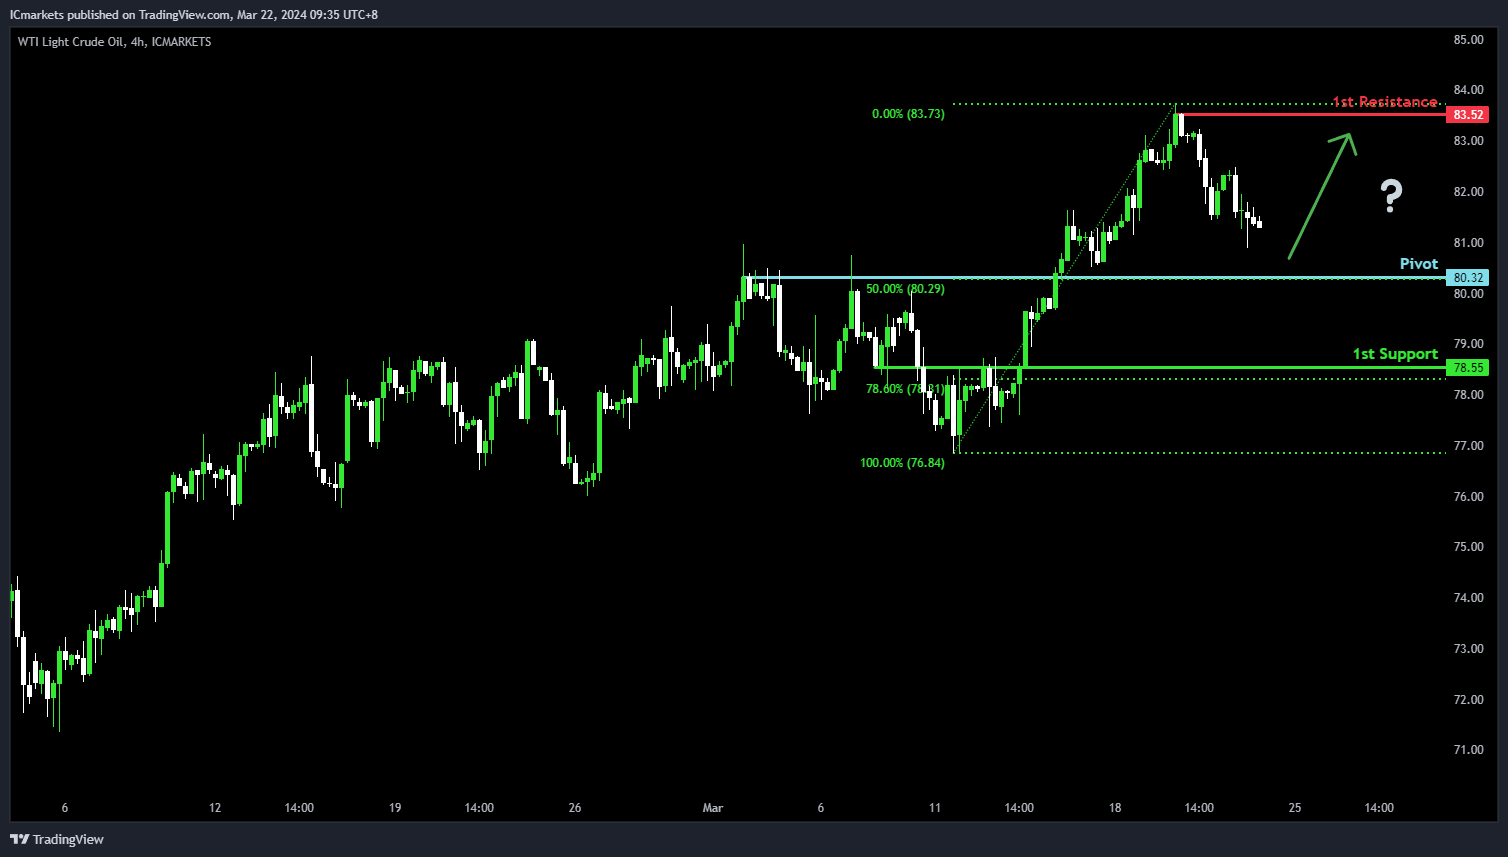
WTI/USD:
The WTI (West Texas Intermediate) oil chart currently demonstrates an overall bullish momentum. However, there is a potential scenario for price to fall towards the pivot before making a bullish bounce to rise towards the 1st resistance.
The pivot level at 80.32 is identified as an overlap support that aligns with the 50.00% Fibonacci Retracement level where price could potentially make a bullish bounce to climb higher. The 1st resistance level at 83.52 is noted as a pullback resistance, further reinforcing its significance as a potential barrier to further bullish movement.
To the downside, the 1st support level at 78.55 is marked as an overlap support that aligns close to the 78.60% Fibonacci Retracement level, reinforcing its significance as a key support level.
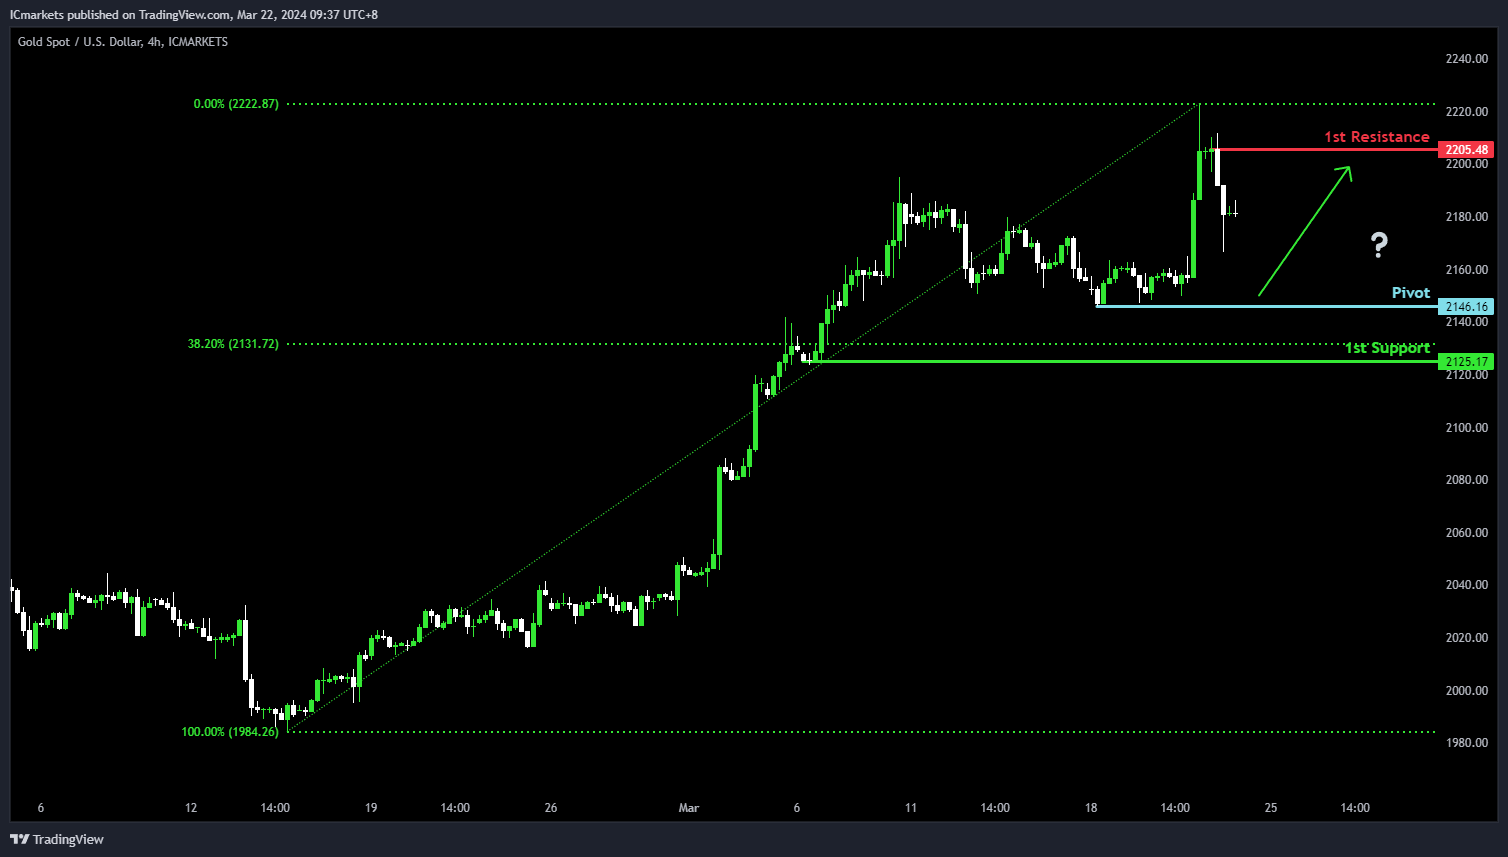
XAU/USD (GOLD):
The Gold (XAU/USD) chart currently demonstrates an overall bullish momentum. However, there is a potential scenario for price to fall towards the pivot before making a bullish bounce to rise towards the 1st resistance.
The pivot level at 2,146.16 is identified as a pullback support where price could potentially make a bullish bounce to climb higher. The 1st resistance level at 2,205.48 is noted as a pullback resistance that is situated close to the all-time high, further reinforcing its significance as a potential barrier to further bullish movement.
To the downside, the 1st support level at 2,125.17 is marked as a pullback support that aligns close to the 38.20% Fibonacci Retracement level, reinforcing its significance as a key support level.
USD/JPY Could Extend Rally As Dips Turn Attractive
Key Highlights
- USD/JPY rallied above the 148.80 and 150.00 resistance levels.
- A connecting bullish trend line is forming with support at 150.50 on the 4-hour chart.
- Crude oil prices corrected gains and traded below $81.50.
- Bitcoin attempted a fresh increase above the $65,000 resistance zone.
USD/JPY Technical Analysis
The US Dollar started a major increase against the Japanese Yen after the historic BoJ’s rate hike. USD/JPY rallied above the 148.80 resistance to move into a positive zone.
Looking at the 4-hour chart, the pair settled above the 150.00 level, the 100 simple moving average (red, 4-hour), and the 200 simple moving average (green, 4-hour). It tested the 151.80 resistance before there was a minor pullback.
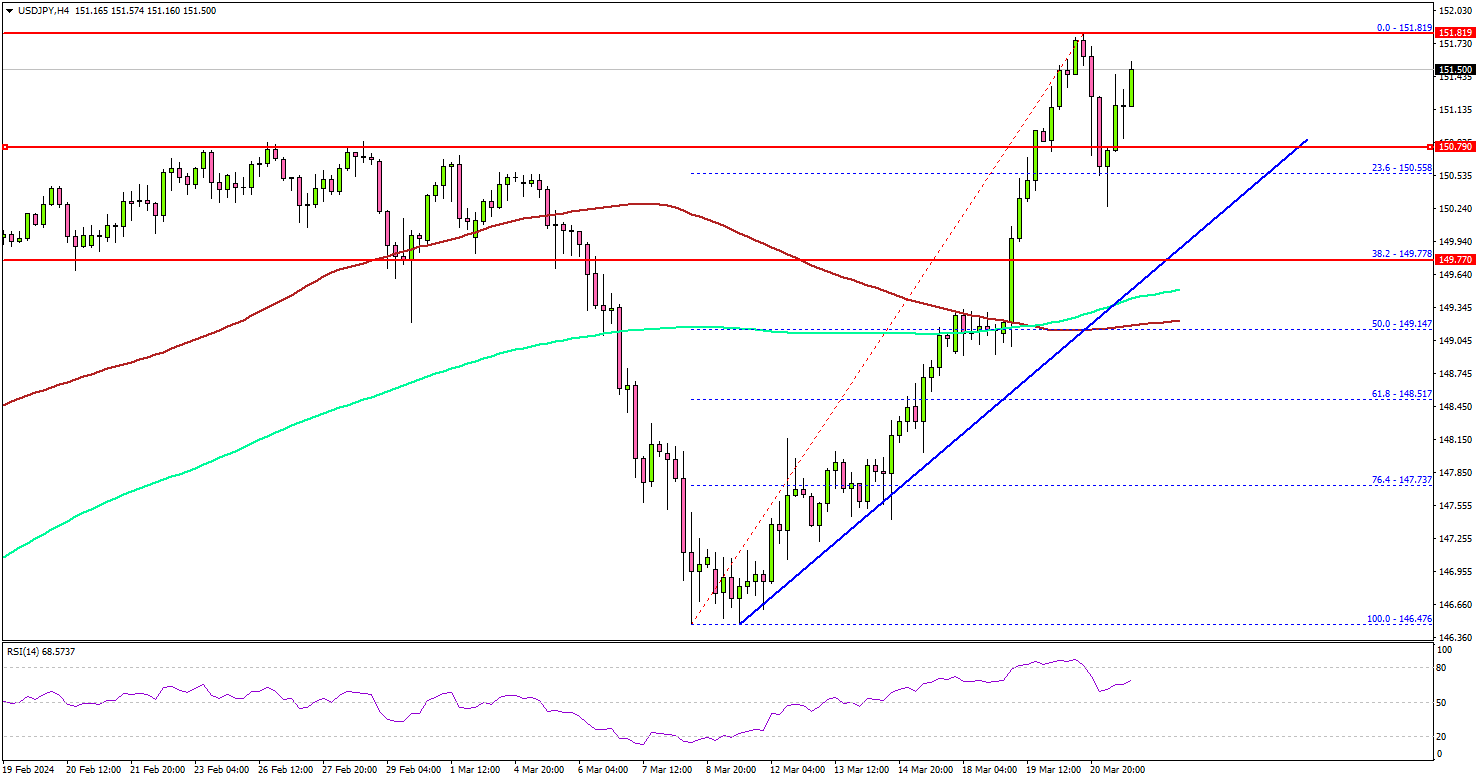
The pair tested the 150.50 support zone and the 23.6% Fib retracement level of the upward move from the 146.47 swing low to the 151.81 high.
There is also a connecting bullish trend line forming with support at 150.50 on the same chart. On the upside, the pair could face resistance near the 151.80 level. The first major resistance is now forming near 152.00.
A close above the 152.00 zone could open the doors for more upsides. The next stop for the bulls might be 155.00. If not, the pair might correct lower. Immediate support is near the 150.50 level and the trend line.
The next major support is at 149.80 or the 100 simple moving average (red, 4-hour). If there is a downside break below the 100 simple moving average (red, 4-hour), the pair could decline toward the 146.50 support.
Looking at Bitcoin, the bulls attempted a fresh increase above the $65,000 resistance but they are facing hurdles near $68,000.
Economic Releases
- UK Retail Sales for Feb 2024 (YoY) - Forecast -0.3%, versus +3.4% previous.
- UK Retail Sales for Feb 2024 (MoM) - Forecast -0.7%, versus +0.7% previous.
- German IFO Business Climate Index for March 2024 – Forecast 86.0, versus 85.5 previous.
- Federal Reserve Chair Jerome Powell’s speech.
Japan CPI core rises to 2.8% in Feb, above BoJ’s target for 23rd month
Japan's CPI core (ex-fresh food) rises from 2.0% yoy to 2.8% yoy in February, matched expectations. This increase marks the first acceleration in four months and maintains the index above BoJ's 2% target for the 23rd consecutive month.
The uptick in the core CPI was primarily due to a less pronounced decline in energy prices, reflecting diminishing impact of government subsidies introduced to mitigate energy costs. Specifically, energy prices saw a decrease of -1.7% yoy, a significant moderation from -12.1% yoy drop recorded in January.
The overall headline CPI also showed an uptick, accelerating from 2.2% yoy to 2.8%yoy. However, when examining CPI core-core, which excludes both food and energy, there was a slight slowdown from 3.5% yoy to 3.2% yoy.
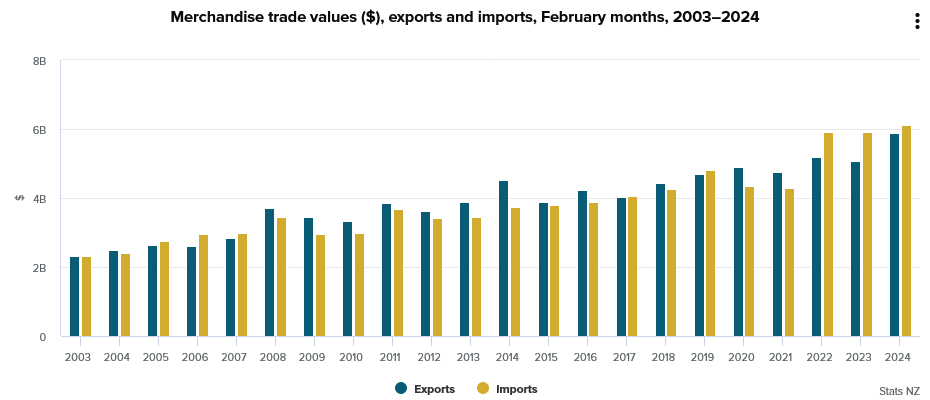
New Zealand’s goods exports rises 16% yoy in Feb, imports up 3.3% yoy
In February, New Zealand's goods exports leaped by 16% yoy to NZD 5.9B. This surge contrasts with a more modest 3.3% yoy increase in goods imports, totaling NZD 6.1B. Consequently, monthly trade deficit narrowed significantly to NZD -218m, far exceeding market expectations of a shortfall of NZD -825m.
Exports to China, New Zealand's largest trading partner, increased by 10% yoy, contributing an additional NZD 154m. US saw a remarkable 52% yoy jump in exports, adding NZD 305m, while EU and Australia also recorded increases in New Zealand exports by 7.9% yoy and 5.9% yoy, respectively. However, trade with Japan contracted, with exports declining by -10% yoy.
On the import front, China and South Korea marked significant increases of 7.1% yoy and 42% yoy, respectively, indicating robust demand for goods from these economies. Conversely, imports from US and EU saw downturns, declining by 20% yoy and 7% yoy.
Cliff Notes: Four Sets of Circumstances, One Intent
Key insights from the week that was.
In Australia, the RBA Board once again decided to leave the cash rate unchanged at 4.35% after reflecting on recent data. The new information included the Q4 National Accounts, which confirmed the economic slowdown broadened into year-end, and the Q4 Wage Price Index, which revealed an underlying slowdown in private sector wages growth associated with a softening labour market (more below) and benign inflation expectations.
Consistent with the Board’s objectives, these results led to language changes in the final paragraph: “a further increase in interest rates cannot be ruled out” replaced with “the Board is not ruling anything in or out”; and the removal of the Board “will do what is necessary to achieve that outcome” – a significant decision given versions of this language have been in the media release since the first rate hike in May 2022. Concern over upside risks to inflation have not fully dissipated however, keeping the Board open to a range of possibilities.
As discussed by Chief Economist Luci Ellis in a video update mid-week, the tone of RBA communications suggest they will remain on hold for some months yet, with more progress towards target necessary to extinguish concern over lingering risks. We continue to expect a gradual easing cycle from September, a 25bp cut per quarter to take the cash rate to 3.10% at Q3 2025.
Before moving offshore, a quick note on the Australian labour market. The February Labour Force Survey was an eventful update, a much stronger-than-expected +116.5k gain in employment reported alongside a material fall in the unemployment rate, from 4.1% to 3.7%, following weak results over December and January. Abstracting from this volatility, the labour market continues to soften at a modest pace, with employers seeking to adjust labour usage predominately doing so by reducing average hours worked (–1.9%yr). Though we expect employment growth to moderate below the pace of population growth, material economy-wide employment declines seem unlikely.
Offshore, the Bank of Japan raised its policy rate to the range of 0% – 0.1% having “assessed the virtuous cycle between wages and prices” and judged “that the price stability target of 2 percent would be achieved in a sustainable and stable manner toward the end of the projection period”. This was the BoJ’s first hike in 17 years and was accompanied by the scrapping of the YCC target and ETF/ J-REITs purchases. However, government bond purchases will continue broadly at the same pace as before, and the BoJ made clear it will guard against a rapid rise in long-term interest rates.
In a subsequent press conference, Governor Kazuo Ueda noted that they made the move now to avoid “large and rapid rate hikes” in the future. This suggests the BoJ believe inflation is not only expected to achieve the medium-term target, but that it could exceed it sustainably. While this is possible, we believe the inflation pulse is more likely to disappoint, keeping the policy rate at or very near its current level. Momentum in services inflation can only persist if household spending grows robustly, which is not currently the case. And, for consumers to feel comfortable spending, Japan’s deeply entrenched saving mindset must be dislodged by sustained real wage growth.
Over in the US, the FOMC kept rates steady as expected. More importantly, their refreshed forecasts pointed to both a soft landing for activity and inflation at target. GDP growth projections were updated to 2.1% in 2024 and 2.0% in 2025 and 2026 from 1.4%, 1.8% and 1.9%, seeing the economy grow above its potential rate through the entire projection period. The members’ inflation projections are little changed however, recent upside surprises seeing 2024’s core inflation forecast upgraded to 2.6%, but still set to give way to a return to target inflation in 2025-26. It is also important to recognise that Chair Powell saw no material change in inflation dynamics in the recent data, the return to target inflation waiting on shelter’s normalisation.
The fed funds rate profile suggests the FOMC see a degree of medium-term inflation risk. Three rate cuts continue to be forecast for 2024, but the median number of rate cuts in 2025 has been reduced by one to three. The longer run rate was also lifted 10bps to 2.6%. We continue to anticipate four rate cuts in both 2024 and 2025, beginning in June 2024 and ending late-2025 at 3.375%. Our higher terminal rate reflects concern over inflation pressures from tight capacity across housing and infrastructure as well as the likelihood of reshoring delivering higher prices for some goods. A modest contractionary stance will be required to manage both inflation risks and expectations. Activity growth and employment are likely to wear the cost, a higher unemployment rate circa 4.5% forecast through at least 2025.
Finally, the Bank of England also kept rates steady at 5.25% this week. Of significance though, it was an 8-1 decision, the two members who had previously dissented in favour of a hike now with the ‘on hold’ majority. The lone dissenter in March argued instead for an immediate cut. Contained in the minutes were diverse views on wages and inflation, particularly for services. Overall though, outcomes were seen as evolving broadly as expected, and there was a degree of comfort that downside risks for activity were contained. The BoE Agents Report, which gathers the views of businesses across the country, was constructive on both inflation (albeit with lingering concerns over services pricing) and activity. The BoE will be hoping these views prove prescient and allow the UK to experience its own version of a soft landing. We continue to expect the BoE to follow the FOMC and ECB through this cutting cycle, though there is a higher chance of sticky inflation causing delays in the UK.
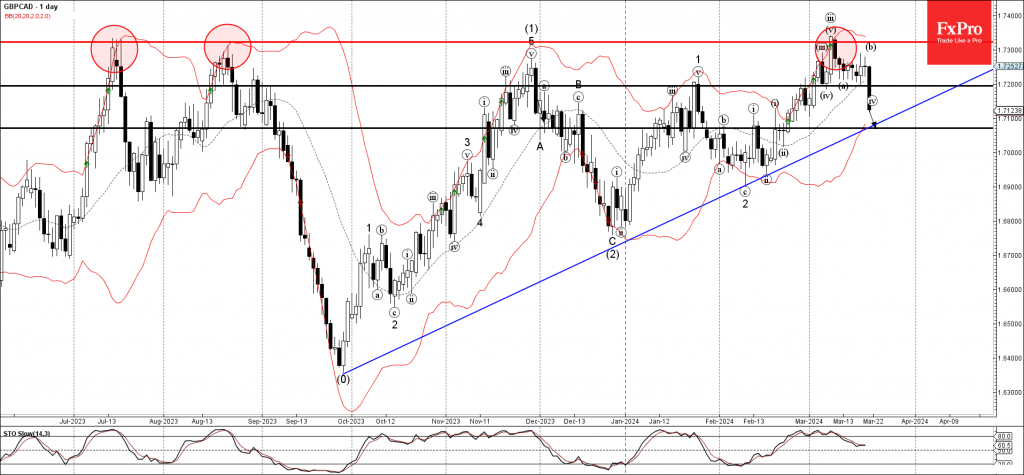
GBPCAD Wave Analysis
- GBPCAD broke support level 1.7200
- Likely to fall to support level 1.7070
GBPCAD currency pair continues to fall after recently breaking the support level 1.7200 (former monthly high from February, which has been reversing the pair from last month).
The breakout of the support level 1.7200 accelerated the active short-term impulse wave c.
Given very strongly bearish sterling sentiment seen today, GBPCAD currency pair can be expected to fall to the next support level 1.7070, coinciding with the support trendline from September.
Bank of England Review – Gearing Up for a June Cut
- At today's monetary policy meeting the BoE left the Bank Rate unchanged at 5.25% as widely expected.
- The BoE delivered a dovish twist to its forward guidance and general communication. This marks an important first step to an eventual cutting cycle.
- EUR/GBP moved slightly higher on the dovish vote split and communication.
As expected, the Bank of England (BoE) decided to keep the Bank Rate unchanged at 5.25%. The vote split indicated a continued split committee but to a much lesser extent than previously. At this meeting, 8 members voted for an unchanged decision and one member for a 25bp cut compared to a former 6-2-1 split vote split with hawks Haskel and Mann changing their vote from a hike to an unchanged decision.
The BoE struck a dovish tone in its statement today noting that "the Committee recognised that the stance of monetary policy could remain restrictive even if Bank Rate were to be reduced, given that it was starting from an already restrictive level". We think this is an important first step in signalling that start to an impending cutting cycle. The BoE retained much of its wording in terms of forward guidance, repeating "Monetary policy will need to remain restrictive for sufficiently long to return inflation to the 2% target" and "the Committee will keep under review for how long Bank Rate should be maintained at its current level".
Before the next meeting on 9 May, which will include updated projections, it is limited what we get of data. Namely one inflation report for March and the labour market report for February/March. While we expect the UK economy to show further signs of weakness and inflation and wage growth to level off, we do not believe that the BoE will feel comfortable enough to opt for a rate cut at the May meeting. We believe that we would have to see significant downside surprises across both inflation and labour market data for this to be the case.
Rates. The reaction in rates markets was muted. 2Y Gilt yields moved slightly lower on the statement but fully retraced the move during the afternoon. Markets stick to expecting the first 25bp cut in August but increased the probability for an earlier move.
FX. Following the release of the statement, EUR/GBP moved higher on both the dovish vote split and guidance from the statement. Overall, we see relative rates as a negative for GBP and see current levels as attractive levels to sell GBP. We forecast EUR/GBP towards 0.88 and stay short GBP/USD.
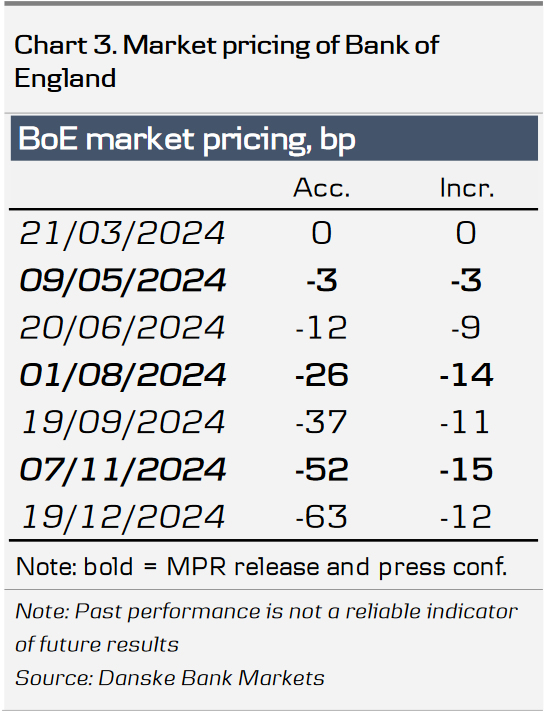
Our call. We continue to expect the BoE to prime markets for a rate cut at the May meeting, which includes updated projections, delivering the first cut of 25bp in June. We think today's meeting supports that notion. We subsequently expect 25bp cuts in the following quarters, totalling 75bp of cuts for 2024. Markets are pricing 77bp for the remainder of the year with the first 25bp cut fully priced by August.
Sunset Market Commentary
Markets
The EMU economy came close to stabilizing in March with price pressures easing. The composite PMI recovered slightly more than hoped, from 49.2 to 49.9 (vs 49.7 consensus), matching the best (least bad) outcome since June of last year. Divergence between a weak export-oriented manufacturing sector (45.7 from 46.5) and a recovering domestic services industry (51.1 from 50.2) increased. Ongoing falls in output in France (composite 47.7) and Germany (composite 47.4; mainly manufacturing weakness) offset a gathering upturn in the rest of the EMU, pointing to an even more uneven economic picture. Encouragingly, order books fell at a reduced rate and business confidence about the year ahead improved to a 13-month high. In manufacturing, destocking is close to no longer being a drag on production. Supplier delivery times at goods producers improved, facilitating a further fall in manufacturing input prices. Service sector input cost and selling price inflation rates meanwhile remained elevated due to higher wage costs, though a cooling in the pace of increase in cost burdens was recorded. Today’s PMI’s keep the ECB on schedule to conduct a first 25 bps rate cut in June. Following the release, EUR/USD fell back from 1.0940 to just below 1.09. Early US eco data (consensus-beating Philly Fed Business Outlook, another low number of weekly jobless claims and decent PMI’s; composite 52.2) help the greenback out as well. German yields currently lose up to 3.5 bps at the front end of the curve, but that’s mainly because of lower opening catching up with yesterday’s post-Fed market reaction. Changes on the US yields curve vary between -0.9 bps (30-yr) and +3 bps (2-yr).
The Bank of England kept its policy rate unchanged at 5.25%, but the voting pattern changed. Hawkish members Mann and Haskel no longer advocate a 25 bps rate hike, joining the majority. BoE Dhingra voted for a second consecutive meeting in favor of a 25 bps rate cut and is now the sole dissenter on the 9-headed MPC. Forward guidance at today’s intermediate meeting was left unchanged as well: the BoE keeps under review how long rates should be kept unchanged. Minutes added that monetary policy could remain restrictive even in case of rate cuts. “Things are moving in the right direction”, BoE chair Bailey later added at the press conference stressing encouraging signs that inflation is coming down. CPI inflation is projected to fall to slightly below the 2% target in 2024 Q2, marginally weaker than previously expected owing to the freeze in fuel duty announced in the Budget. UK Gilts outperform today with yields sliding up to 7 bps for the 2-yr tenor as market thinking shifts from the August to the June meeting for a first BoE rate cut. EUR/GBP rises from 0.8540 to 0.8560.
News & Views
The Swiss National Bank cut its policy rate by 25 bps to 1.50% after recently suggesting that the (real) appreciation of the franc had contributed more than enough to slow inflation. It also further eroded (export) demand. The SNB sharply downwardly revised its 2024-26 inflation forecast. At 1.4%, 1.2% and 1.1% respectively, inflation remains easily within the 0%-2% price stability band. In the short term, goods prices in particular continue to ease while inflation is mainly driven by services prices. Longer term, the risk of second-round effects is significantly reduced. With inflation back on track, the SNB can shift its focus back to stimulating economic growth. The SNB expects (moderate) growth of 1% this year and unemployment may rise a bit further. The Swiss franc takes a logical step back from EUR/CHF 0.9675 to 0.9765. The SNB officially has no exchange rate target, but a further depreciation to EUR/CHF 1.00 would probably be welcomed. If this (real) FX correction doesn’t go according to plan, the SNB may further scale back policy tightening in June given low inflation. We don’t see today’s SNB's action as a harbinger of global "frontloading" of monetary easing. Switzerland is in a unique situation.
The Norges Bank kept its policy rate unchanged at 4.5%. Monetary policy is having a tightening effect and economic growth is low. Inflation is slowing but still markedly above target (4.5% Y/Y in February), mainly because of elevated services inflation. Sharply increased business costs, high wage growth and the Norwegian krone’s depreciation through 2023 will contribute to keeping inflation elevated ahead. Compared to the December policy report, growth was nevertheless higher than expected while inflation cooled more. The MPC remains concerned that prematurely lowering its policy rate could keep inflation high and is ready to raise the policy rate again if necessary. The base scenario assumes unchanged rates until autumn though. EUR/NOK is little changed at 11.55.
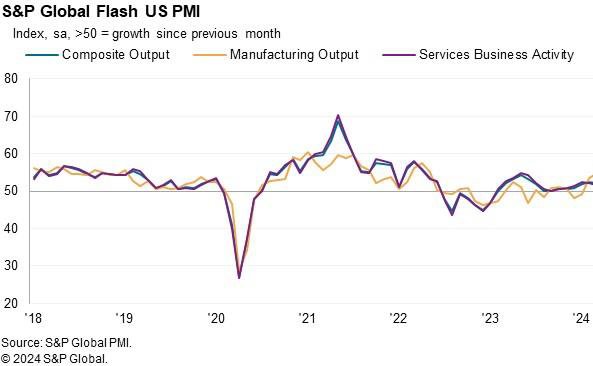
US PMI composite falls to 52.2, unwelcome consumer price pressure in the coming months
US PMI Manufacturing rose from 52.2 to 52.5 in March, a 21-month high. PMI Services fell from 52.3 to 51.7. PMI Composite also fell from 52.5 to 52.2.
Chris Williamson, Chief Business Economist at S&P Global Market Intelligence said:
"Further expansions of both manufacturing and service sector output in March helped close off the US economy's strongest quarter since the second quarter of last year. The survey data point to another quarter of robust GDP growth accompanied by sustained hiring as companies continue to report new order growth.
"The brightest news came from the manufacturing sector, where production is now growing at the fastest rate since May 2022. Production gains are linked to improving demand for goods both at home and abroad, driving a further upturn in business confidence in the outlook.
"Service providers meanwhile reported a slower pace of expansion than factories, with the rate of increase also moderating slightly compared to February, linked in part to ongoing cost of living pressures. However, service providers have also become increasingly optimistic about the outlook, with confidence striking a 22-month high in March to suggest the broad-based economic expansion seen in March will persist into the summer.
"A steepening rise in costs, combined with strengthened pricing power amid the recent upturn in demand, meant inflationary pressures gathered pace again in March. Costs have increased on the back of further wage growth and rising fuel prices, pushing overall selling price inflation for goods and services up to its highest for nearly a year. The steep jump in prices from the recent low seen in January hints at unwelcome upward pressure on consumer prices in the coming months."