Sample Category Title
Technical Outlook and Review
DXY:
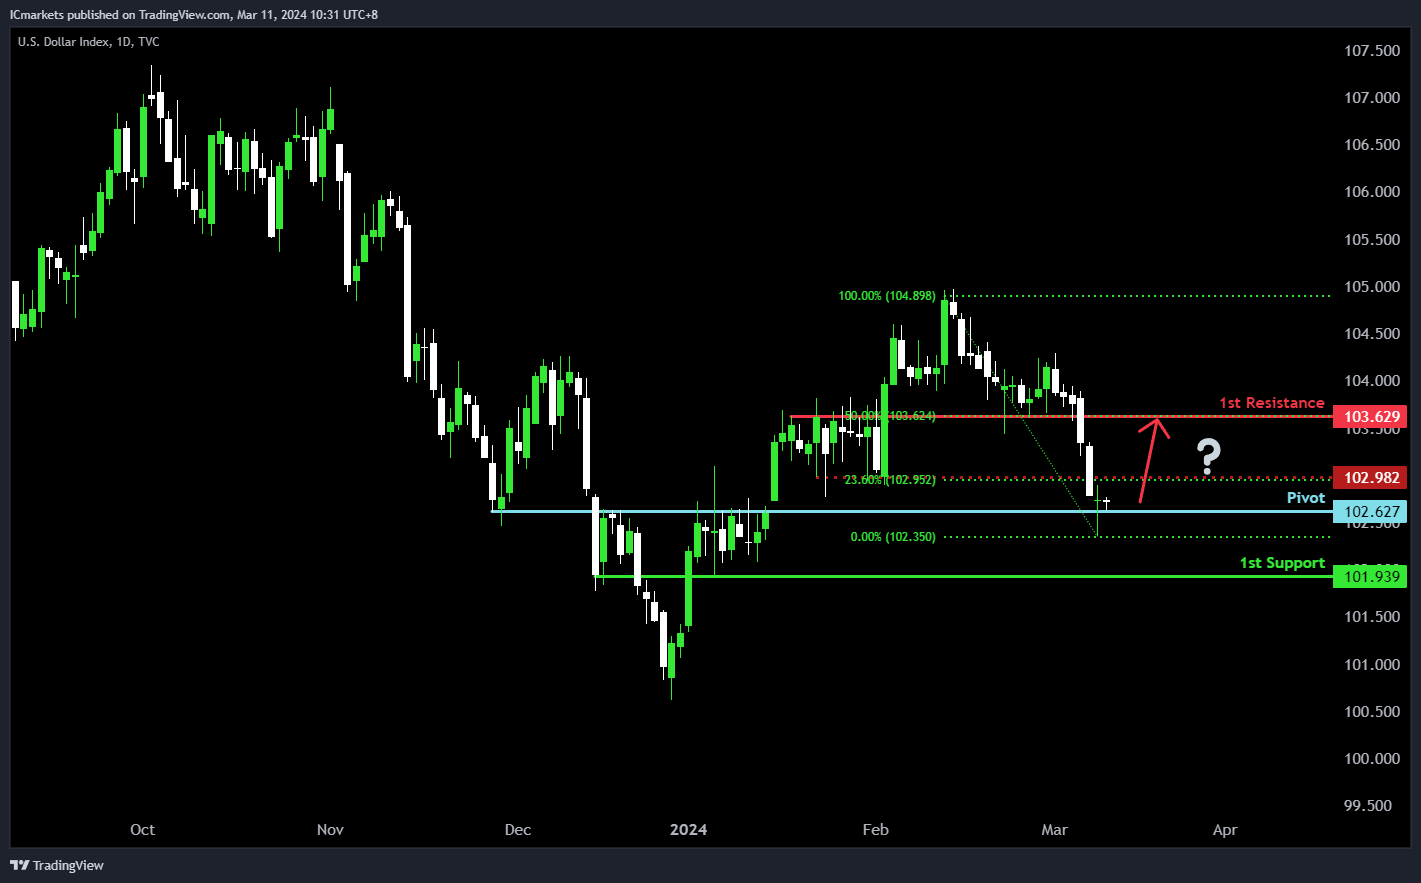
The DXY (Dollar Index) chart reflects bullish momentum, indicating a possible bullish rebound near the pivot level and subsequent movement towards the 1st resistance. The pivot at 102.62 acts as significant overlap support, suggesting potential buyer intervention for a bullish bounce. The 1st support at 101.93 reinforces this pattern.
On the resistance side, the 1st resistance at 103.62, along with the 50% Fibonacci Retracement, could impede upward movement due to increased selling pressure. Further resistance is seen at 102.98, supported by the 23.60% Fibonacci Retracement, potentially intensifying selling pressure in that zone.
EUR/USD:
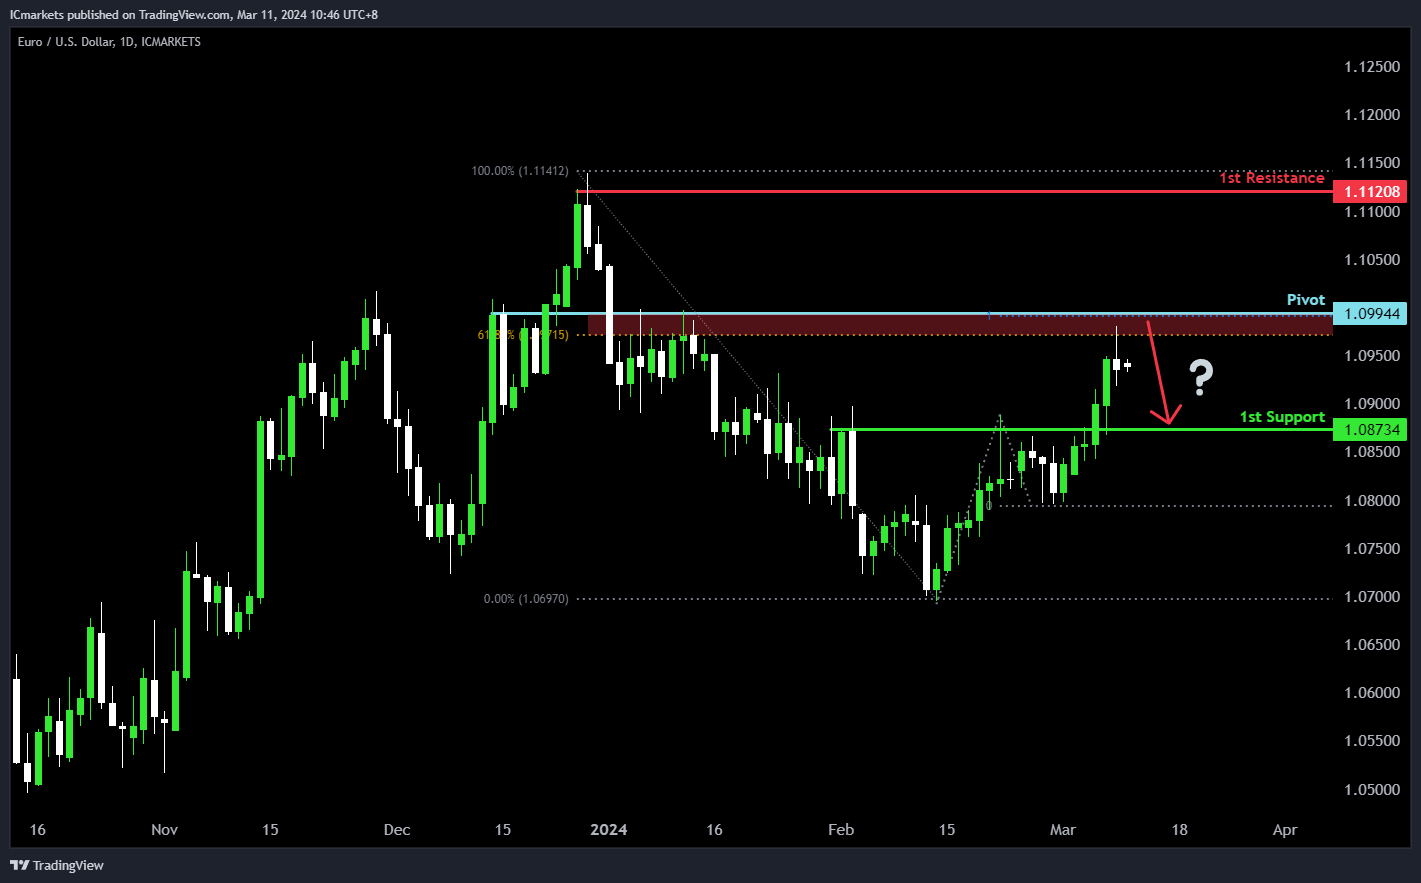
The EUR/USD chart indicates a bearish momentum, suggesting a potential bearish reaction near the pivot level, followed by a decline towards the 1st support.
The pivot at 1.0994 serves as a significant overlap support, coinciding with the 61.80% Fibonacci Retracement level. The 1st support at 1.0873 also provides additional reinforcement as an overlap support level,
On the resistance side, the 1st resistance at 1.1120 is identified as a swing high resistance, suggesting historical significance as a level where selling interest has intensified, potentially impeding further upward movement.
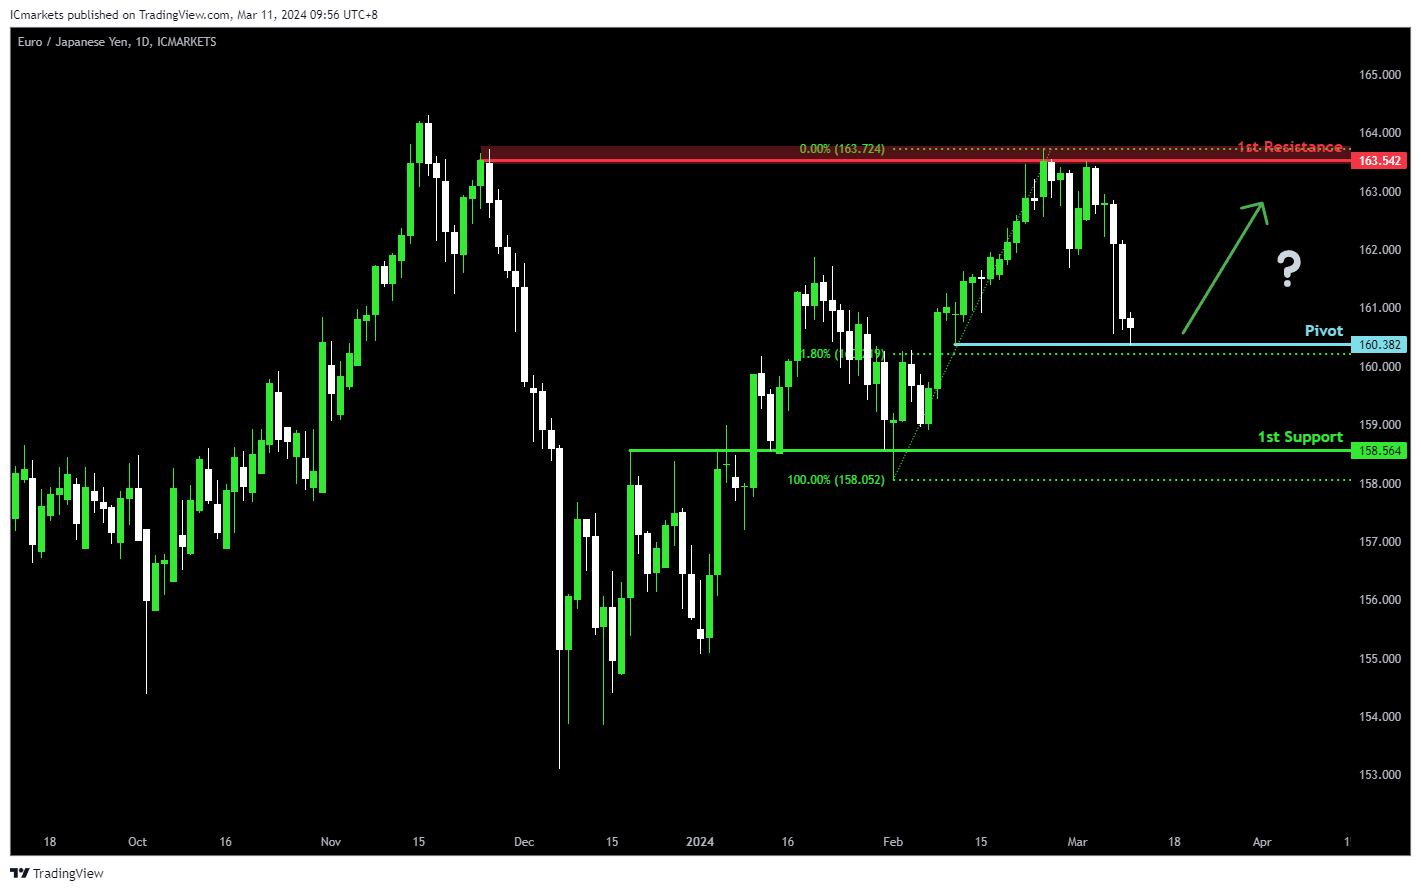
EUR/JPY:
The EUR/JPY chart currently demonstrates bullish momentum, indicating a potential continuation of the upward trend. There are indications that price could potentially make a bullish bounce off the 1st support level and head towards the 1st resistance.
The Pivot level at 160.382 aligns with the 61.80% Fibonacci Retracement, suggesting a significant historical level where buying interest might emerge. Additionally, the 1st support at 158.564 is identified as an overlap support, further reinforcing its importance as a potential area of support.
On the resistance side, the 1st resistance level at 163.542 is characterized as a swing high resistance, indicating a historical barrier to upward movement.
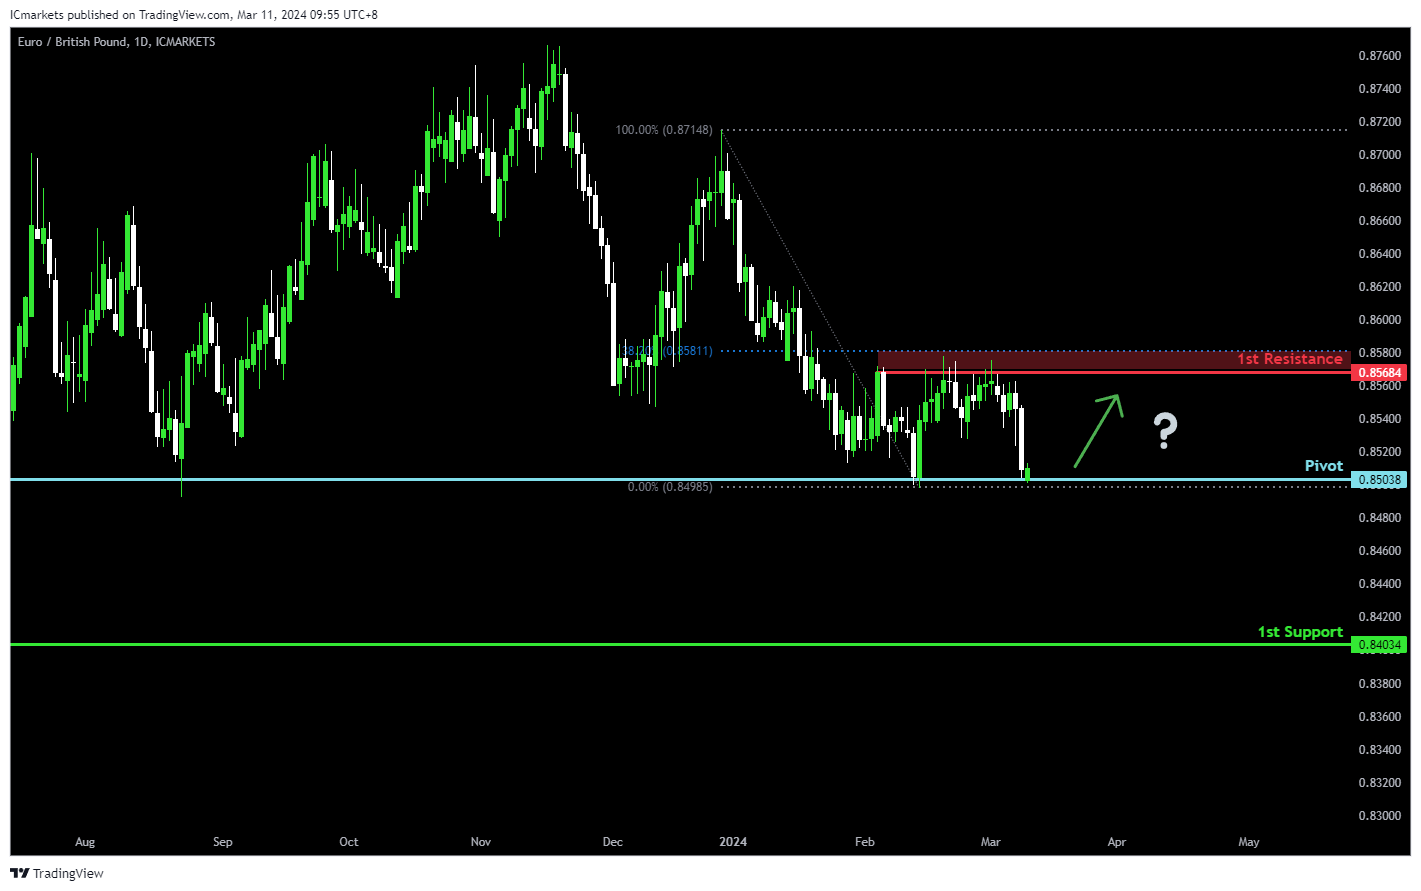
EUR/GBP:
The EUR/GBP chart currently demonstrates bullish momentum, indicating a potential continuation of the upward trend. There are indications that price could potentially make a bullish bounce off the 1st support level and head towards the 1st resistance.
The Pivot level at 0.85038 serves as a swing low support, suggesting a significant historical level where buying interest could emerge. Additionally, the 1st support at 0.84034 is identified as a pullback support, further reinforcing its importance as a potential area of support.
On the resistance side, the 1st resistance level at 0.85684 is characterized as a swing high resistance, indicating a historical barrier to upward movement. Furthermore, the confluence with the 38.20% Fibonacci Retracement adds to its significance as a potential barrier to further bullish movement.
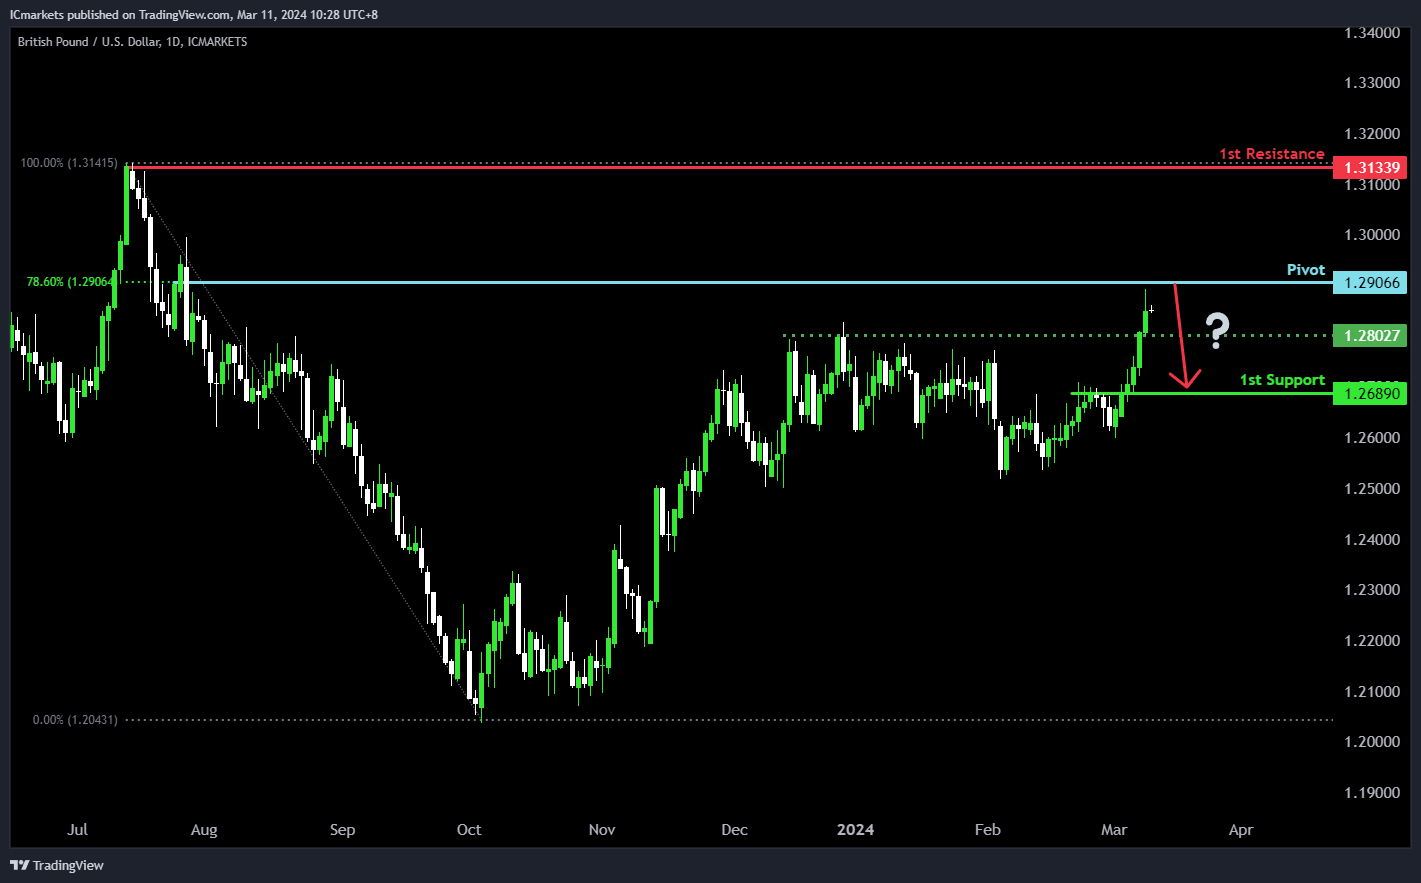
GBP/USD:
The GBP/USD chart reflects a bearish momentum, suggesting a possible bearish response around the pivot level, leading to a decline towards the 1st support.
The pivot at 1.2906 exhibits notable resistance, marked by a swing high and the 78.60% Fibonacci Retracement level, implying a potential area of selling pressure. Additionally, the 1st support at 1.2689 serves as an overlap support, indicating a historical level where buying interest has emerged, potentially offering a foothold for price support.
Conversely, the 1st resistance at 1.3233 presents a significant barrier, characterized by a swing high, likely attracting selling interest and impeding further upward movement.
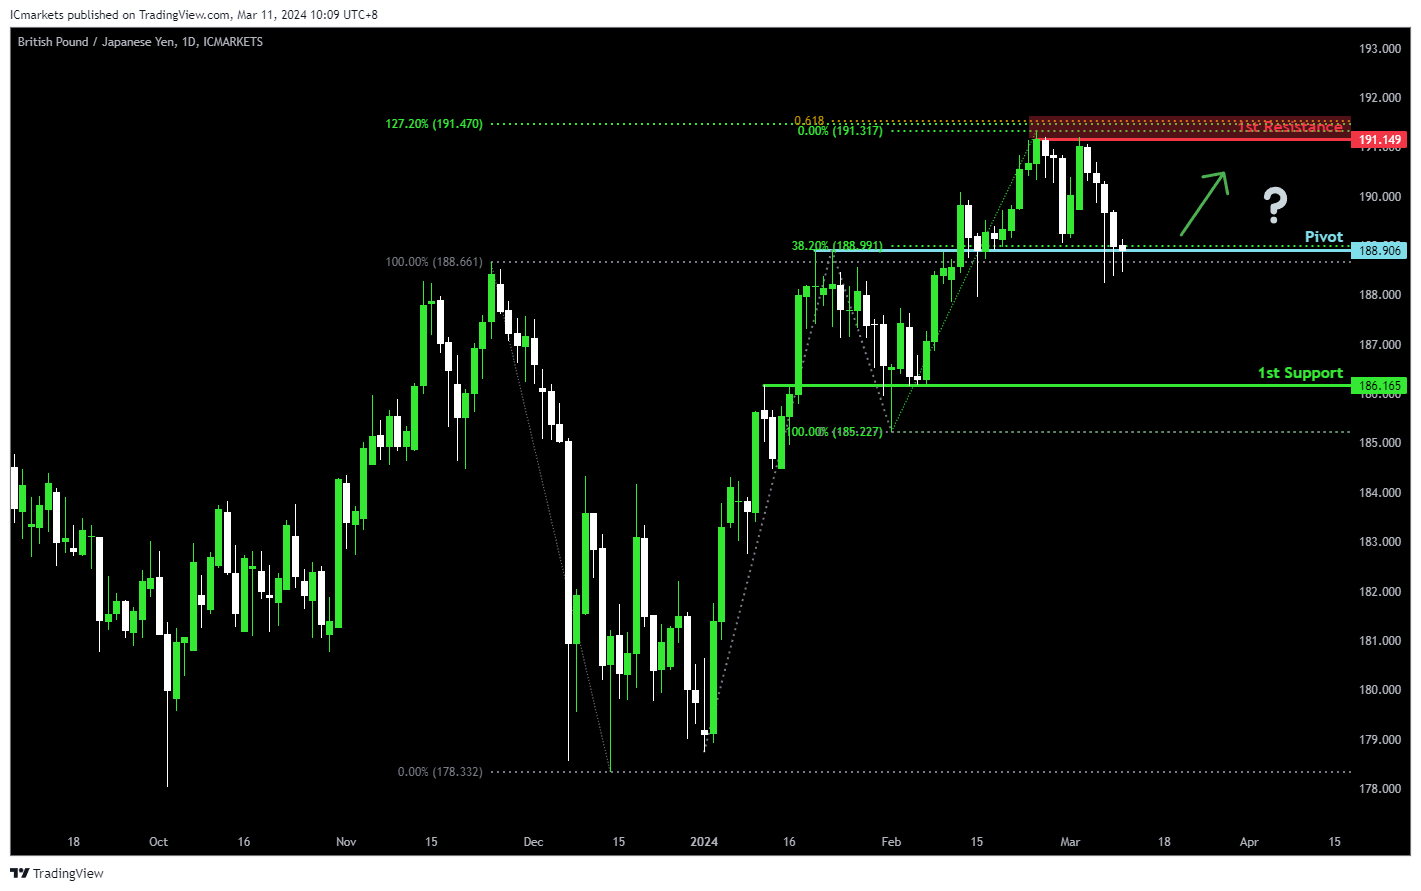
GBP/JPY:
The GBP/JPY chart currently exhibits bullish momentum, suggesting a potential continuation of the upward trend. There are indications that price could potentially make a bullish bounce off the 1st support level and head towards the 1st resistance.
The Pivot level at 188.906 serves as a pullback support and coincides with the 38.20% Fibonacci Retracement level, indicating a significant historical level where buying interest may emerge. Additionally, the 1st support at 186.165 further reinforces the potential area of support.
On the resistance side, the 1st resistance level at 191.149 is identified as a swing high resistance, suggesting a historical barrier to upward movement. Furthermore, the confluence with the 61.80% Fibonacci Projection and the 127.20% Fibonacci Extension strengthens the significance of this resistance level.
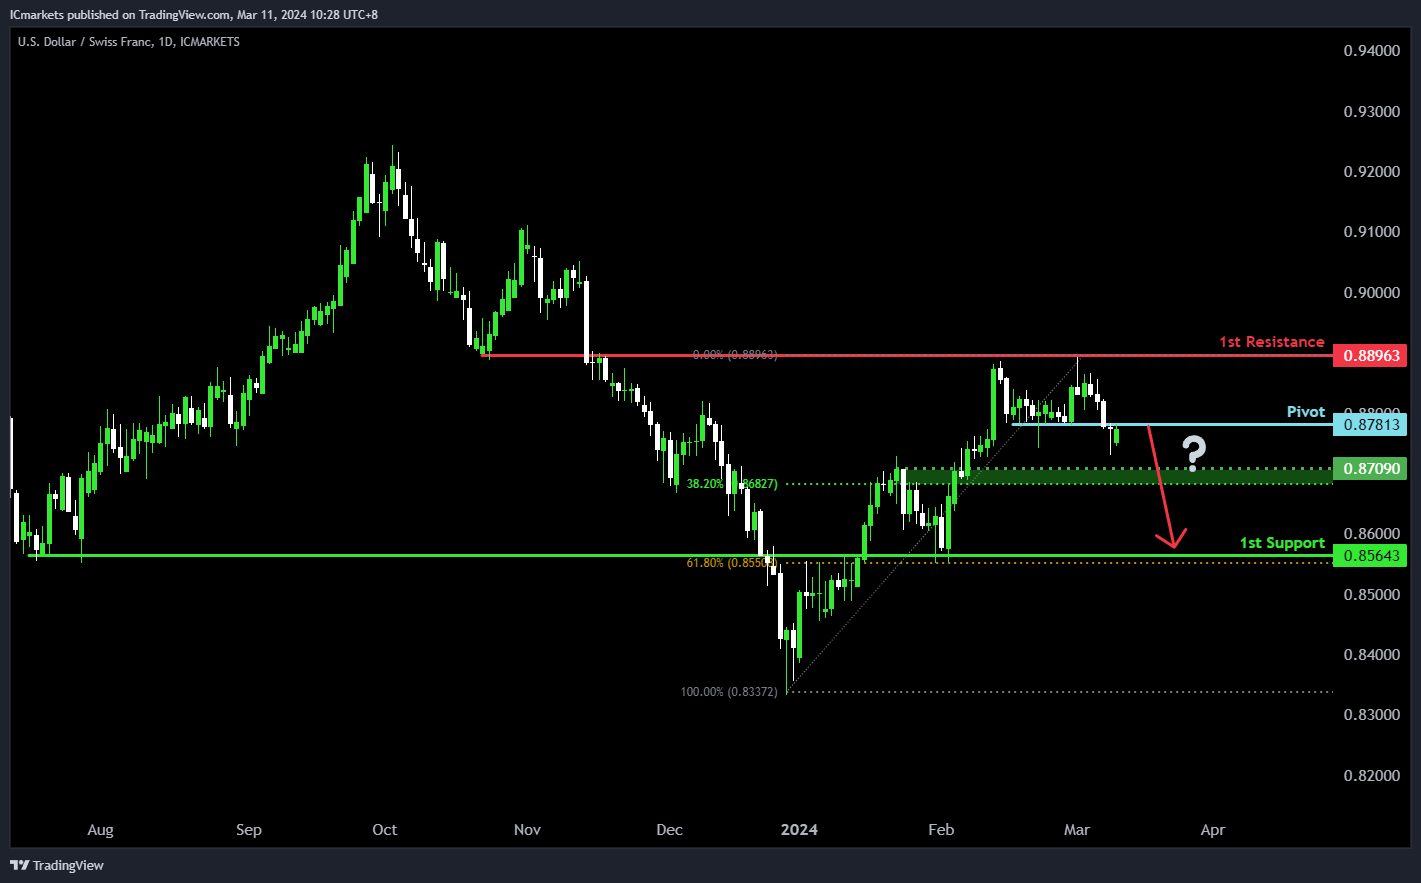
USD/CHF:
The USD/CHF chart indicates a bearish trend, suggesting a possible bearish response around the pivot level, leading to a decline towards the 1st support.
The pivot at 0.8781 acts as a significant level of pullback resistance, indicating potential selling pressure. Furthermore, the 1st support at 0.8564, coupled with the 61.80% Fibonacci Retracement, presents an overlap support, historically attracting buyers’ interest and potentially providing a level of price support.
Conversely, the 1st resistance at 0.8896 serves as an overlap resistance, marking a significant barrier where selling interest may intensify, hindering further upward movement in the price.
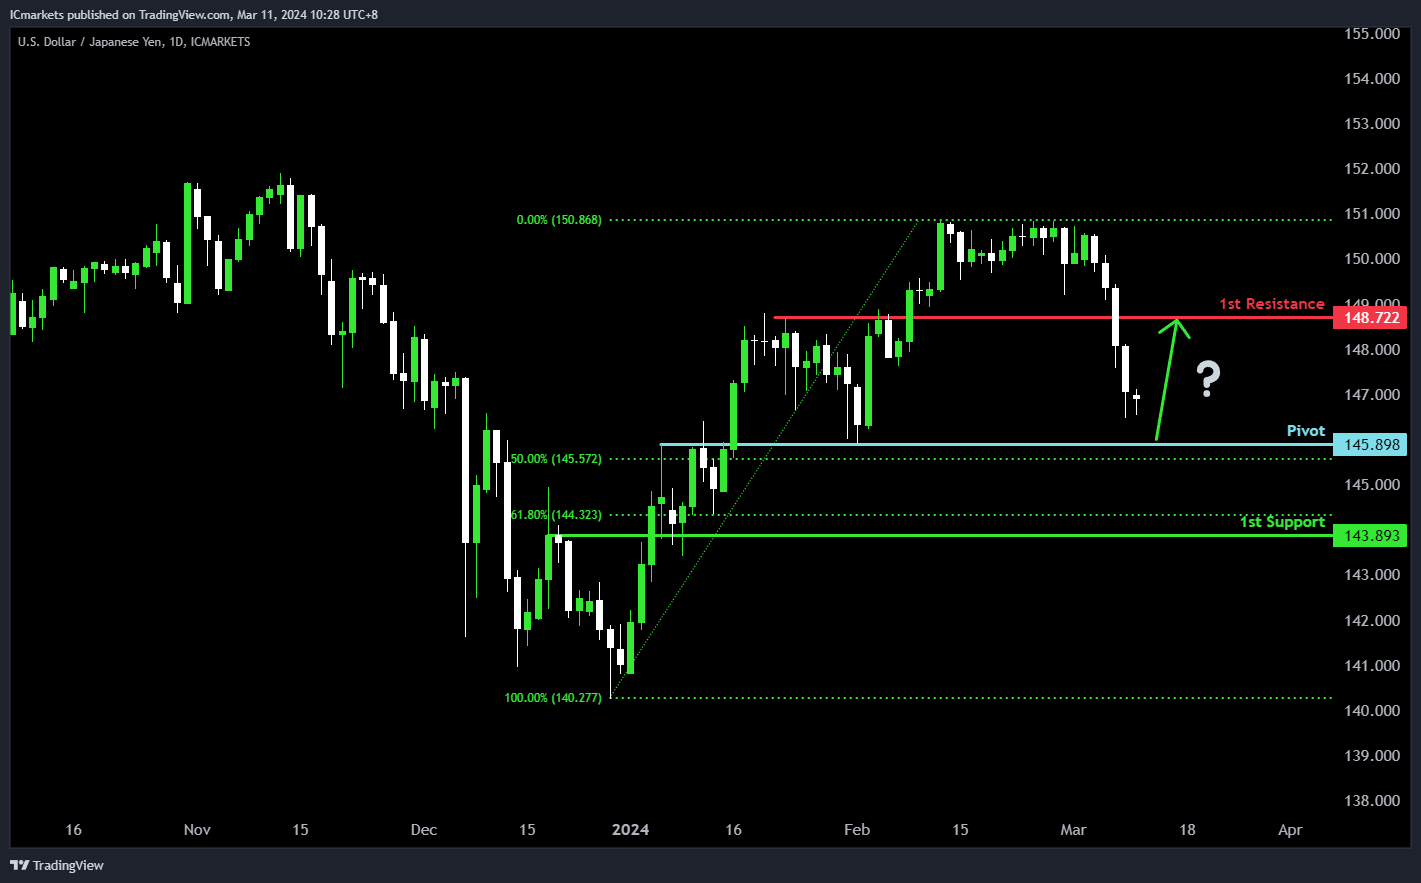
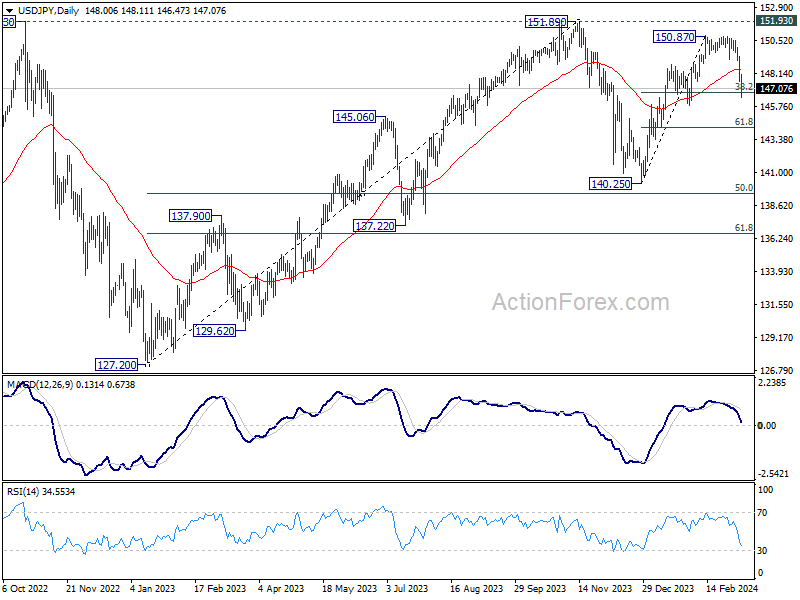
USD/JPY:
The USD/JPY chart indicates bullish momentum, suggesting a potential bullish bounce around the pivot level, leading towards the 1st resistance.
The pivot at 145.89 serves as a significant overlap support, coinciding with the 50% Fibonacci Retracement level, indicating a potential area where intervention may occur, supporting the price. Additionally, the 1st support at 143.89 is identified as another overlap support, reinforced by the 61.80% Fibonacci Retracement, suggesting a level where buying interest might emerge.
On the resistance side, the 1st resistance at 148.72 is recognized as a pullback resistance, indicating a historical barrier where selling pressure may increase, potentially limiting further upward movement in the price.
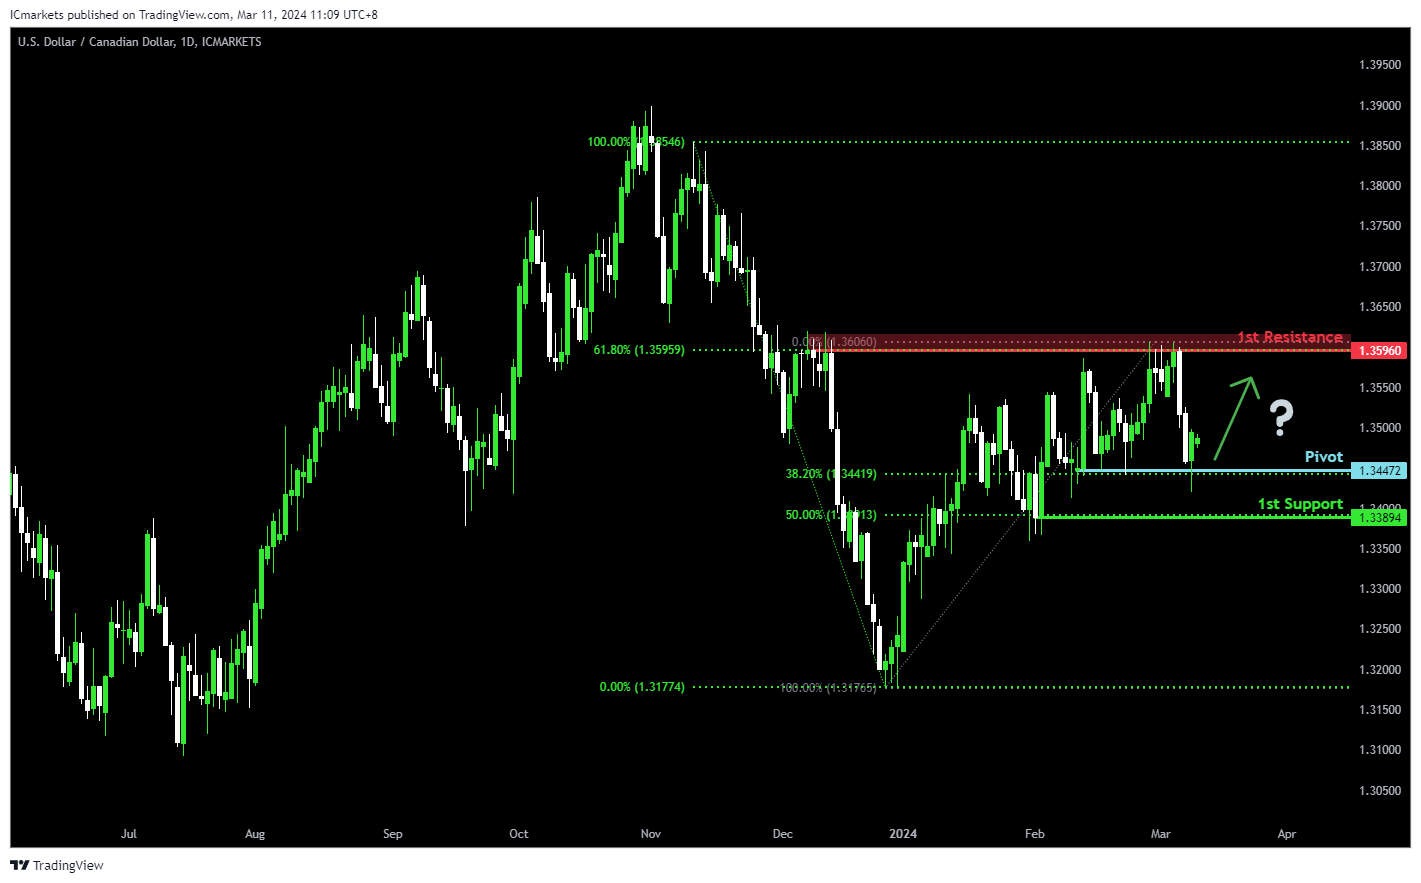
USD/CAD:
The USD/CAD chart currently exhibits an overall bearish momentum. However, there is a potential scenario for price to bounce off the pivot level and rise towards the 1st resistance.
The pivot level at 1.3447 is identified as a pullback support that aligns with the 38.20% Fibonacci Retracement level. Further below, the 1st support level at 1.3389 is also marked as a pullback support that aligns with the 50.00% Fibonacci Retracement level, reinforcing its significance as a key support level.
To the upside, the 1st resistance level at 1.3596 is identified as a pullback resistance that aligns with the 61.80% Fibonacci Retracement level, further highlighting its importance as a potential resistance zone.
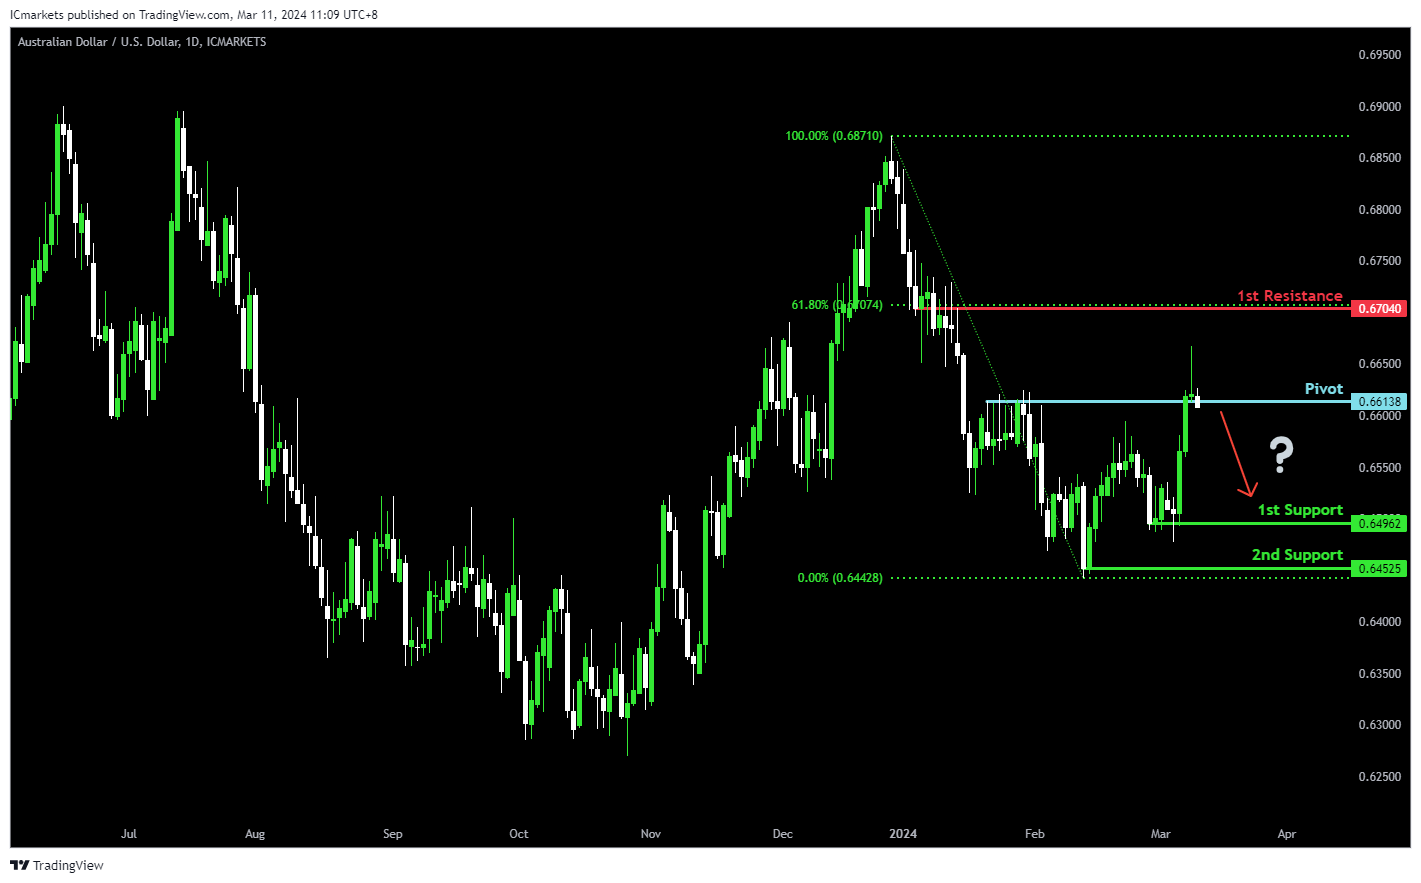
AUD/USD:
The AUD/USD chart currently demonstrates an overall bullish momentum. However, there is a potential scenario for price to reverse around the pivot level and drop towards the 1st support.
The pivot level at 0.6613 is identified as a pullback resistance where price could potentially reverse from to drop lower. The 1st support level at 0.6496 is marked as a pullback support while the 2nd support level at 0.6452 is also noted as a pullback support, reinforcing its significance as a key support level.
On the resistance side, the 1st resistance level at 0.6704 is identified as an overlap resistance that aligns with the 61.80% Fibonacci Retracement level, potentially limiting any further upward movement.
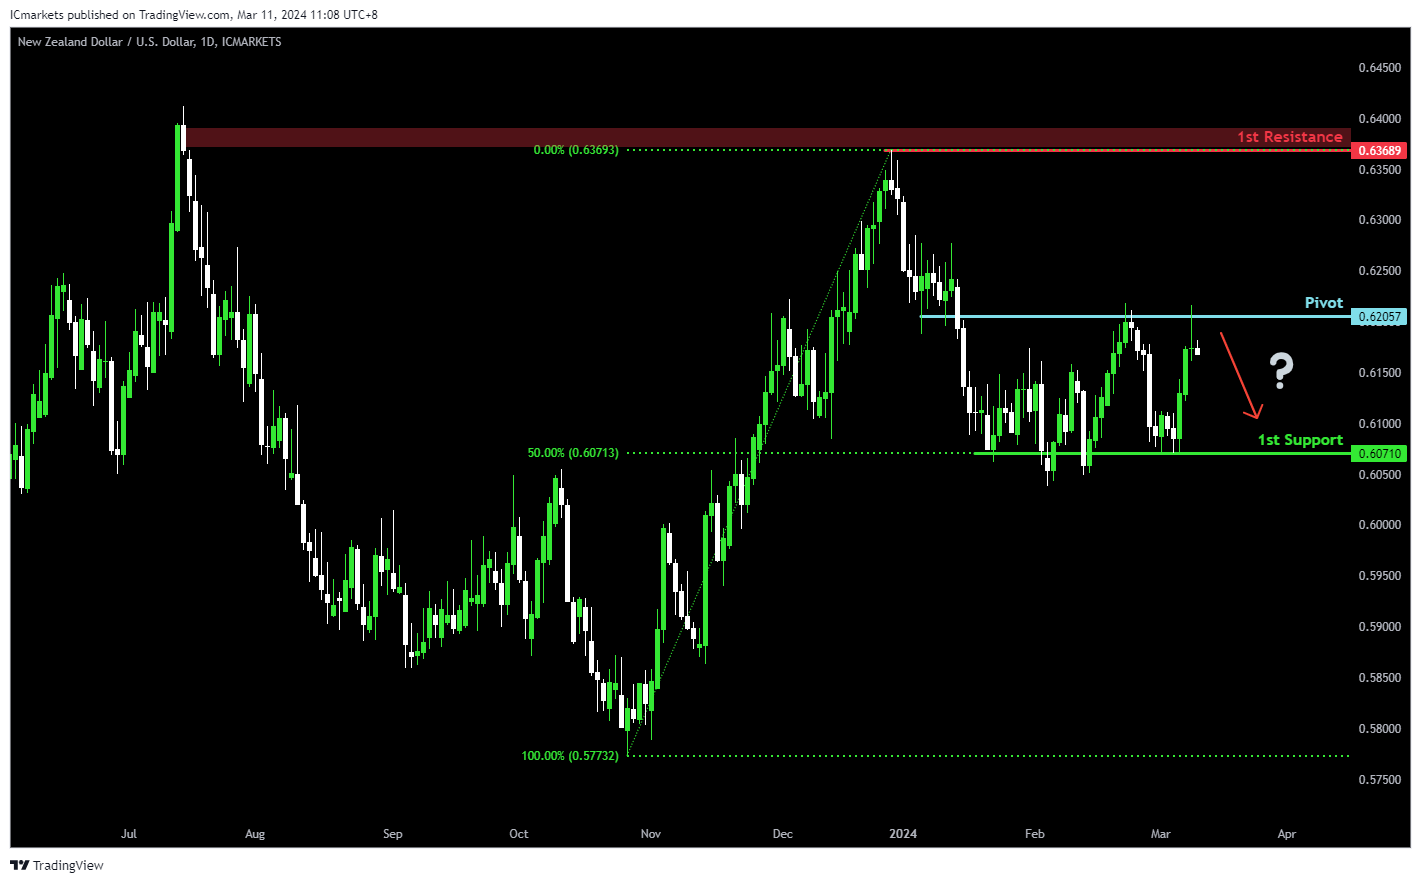
NZD/USD
The NZD/USD chart currently exhibits an overall bullish momentum. However, there is a potential scenario for price to reverse around the pivot level and drop towards the 1st support.
The pivot level at 0.6205 is identified as an overlap resistance where price could potentially reverse from to drop lower. The 1st support level at 0.6071 is marked as a pullback support that aligns with the 50.00% Fibonacci Retracement level, reinforcing its significance as a key support level.
On the resistance side, the 1st resistance level at 0.6368 is identified as a swing-high resistance, potentially limiting any further upward movement.
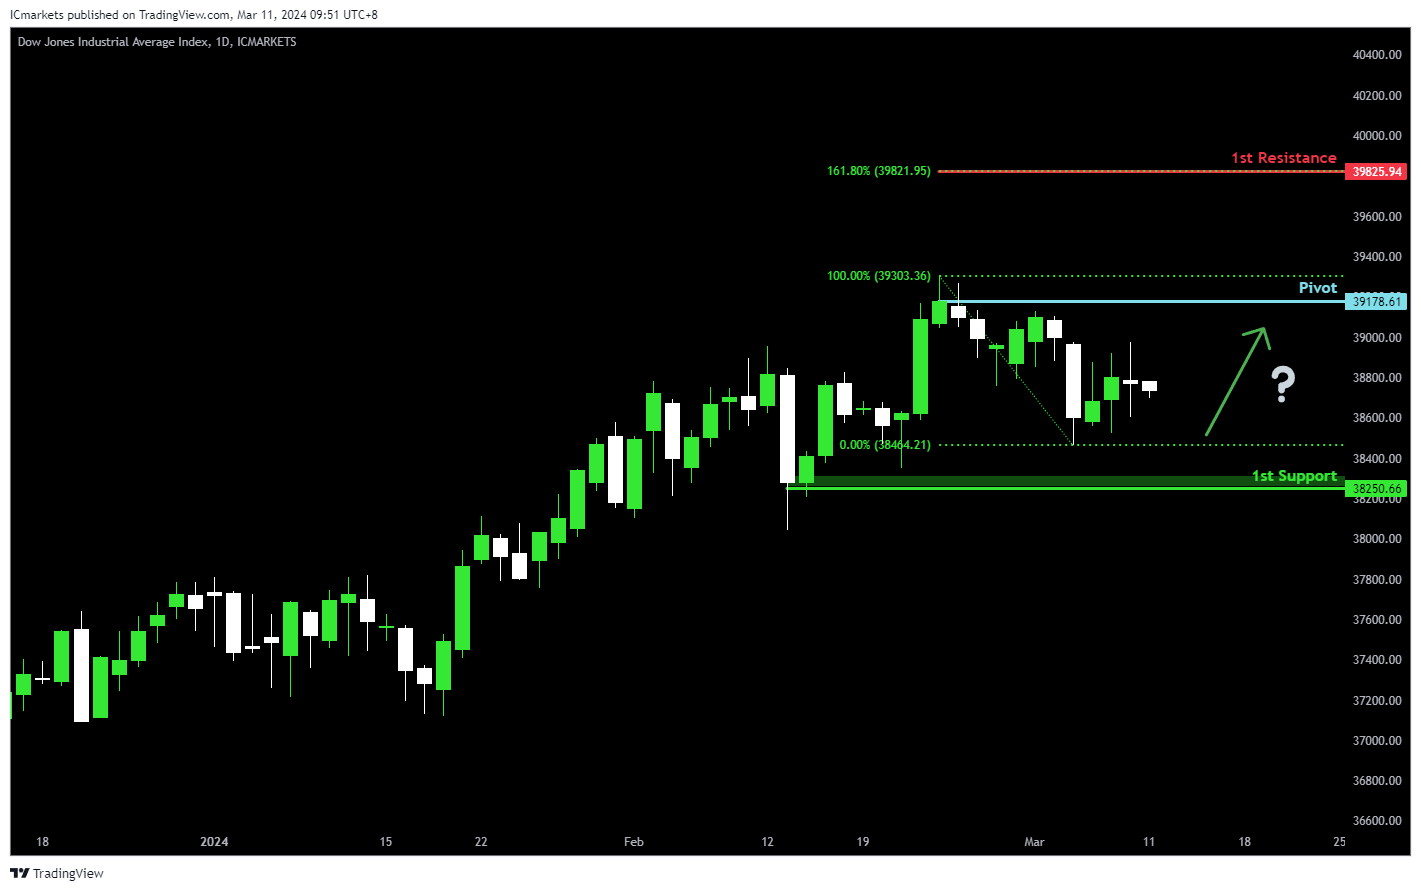
DJ30:
The DJ30 chart currently demonstrates bullish momentum, indicating a potential continuation of the upward trend. There are indications that price could potentially make a bullish continuation towards the 1st resistance level.
The Pivot level at 39178.61 is identified as a swing high resistance, suggesting a significant historical barrier to upward movement. Additionally, the 1st support at 38250.66 corresponds to a swing low support, indicating a potential area where buying interest might emerge.
On the resistance side, the 1st resistance level at 39825.94 aligns with the 161.80% Fibonacci Extension, further reinforcing its significance as a potential barrier to further bullish movement.
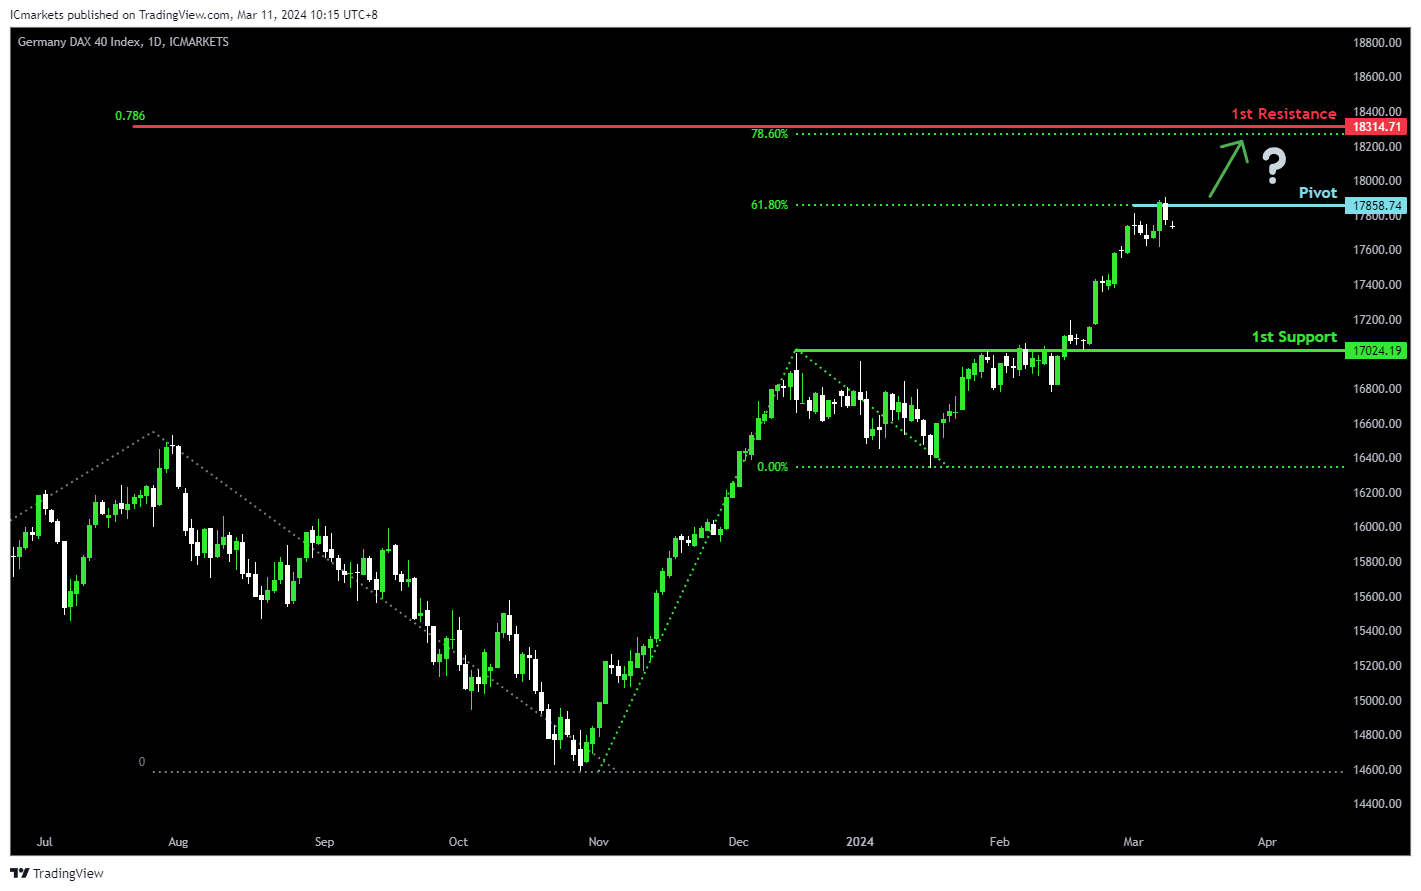
GER40:
The GER40 chart currently demonstrates bullish momentum, indicating a potential continuation of the upward trend. Several factors contribute to this momentum, suggesting a bullish movement towards the 1st resistance level.
The Pivot level at 17858.74 aligns with the 61.80% Fibonacci Retracement, indicating a significant historical level where buying interest could emerge. Additionally, the 1st support at 17024.19 corresponds to a pullback support, reinforcing its significance as a potential area of support.
On the resistance side, the 1st resistance level at 18314.71 is characterized by the confluence of the 78.60% Fibonacci Retracement and the 78.60% Fibonacci Projection, further reinforcing its significance as a potential barrier to further bullish movement.
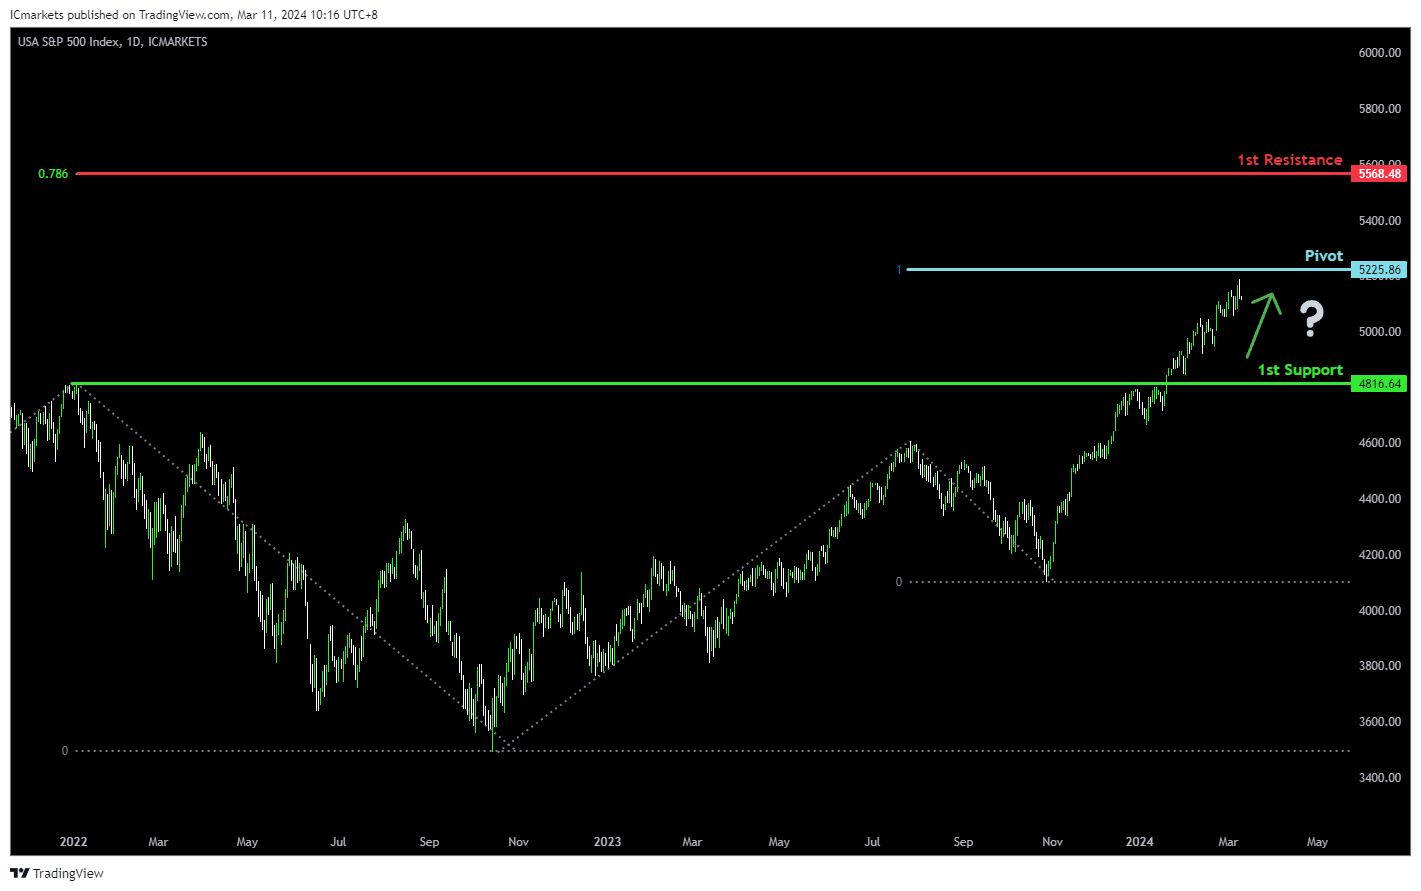
US500:
The US500 chart currently exhibits bullish momentum, indicating a potential continuation of the upward trend. The pivot level at 5225.86 aligns with the 100% Fibonacci Projection, suggesting a significant historical level where buying interest might emerge. Additionally, the 1st support at 4816.64 corresponds to a pullback support, reinforcing its significance as a potential area of demand.
On the resistance side, the 1st resistance level at 5668.48 is characterized by the 78.60% Fibonacci Projection, indicating a historical barrier to upward movement.
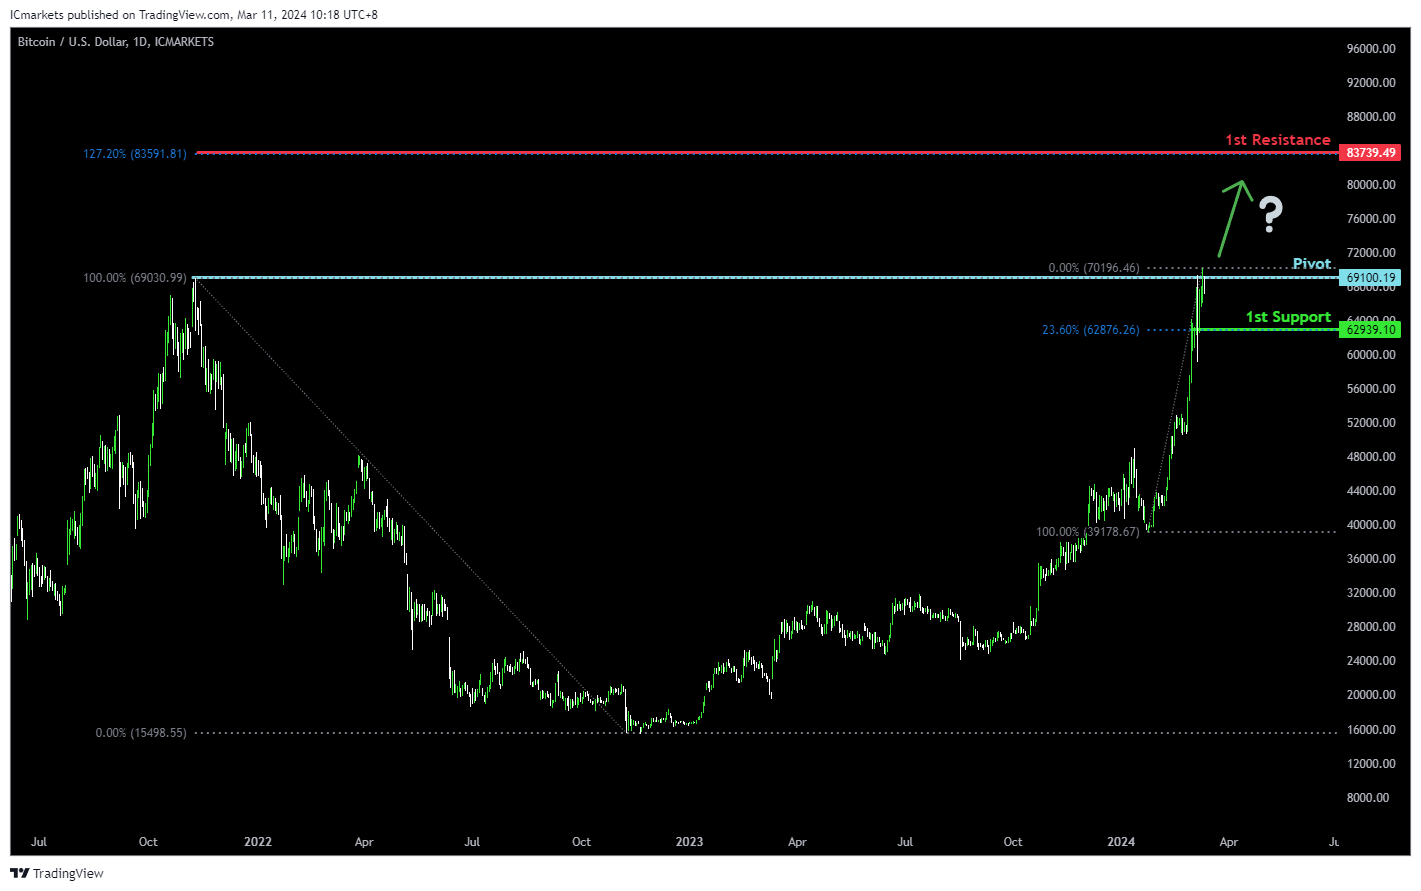
BTC/USD:
The BTC/USD chart currently demonstrates bullish momentum, suggesting a potential continuation of the upward trend. The pivot level at 69100.19 corresponds to a swing high resistance, indicating a significant historical barrier where selling pressure may emerge.
The 1st support level at 62939.10 aligns with an overlap support and coincides with the 23.60% Fibonacci Retracement level, highlighting its significance as a potential area of demand where buyers might enter the market.
On the resistance side, the 1st resistance level at 83739.49 is identified by the 127.20% Fibonacci Extension, suggesting a significant historical barrier to further upward movement.
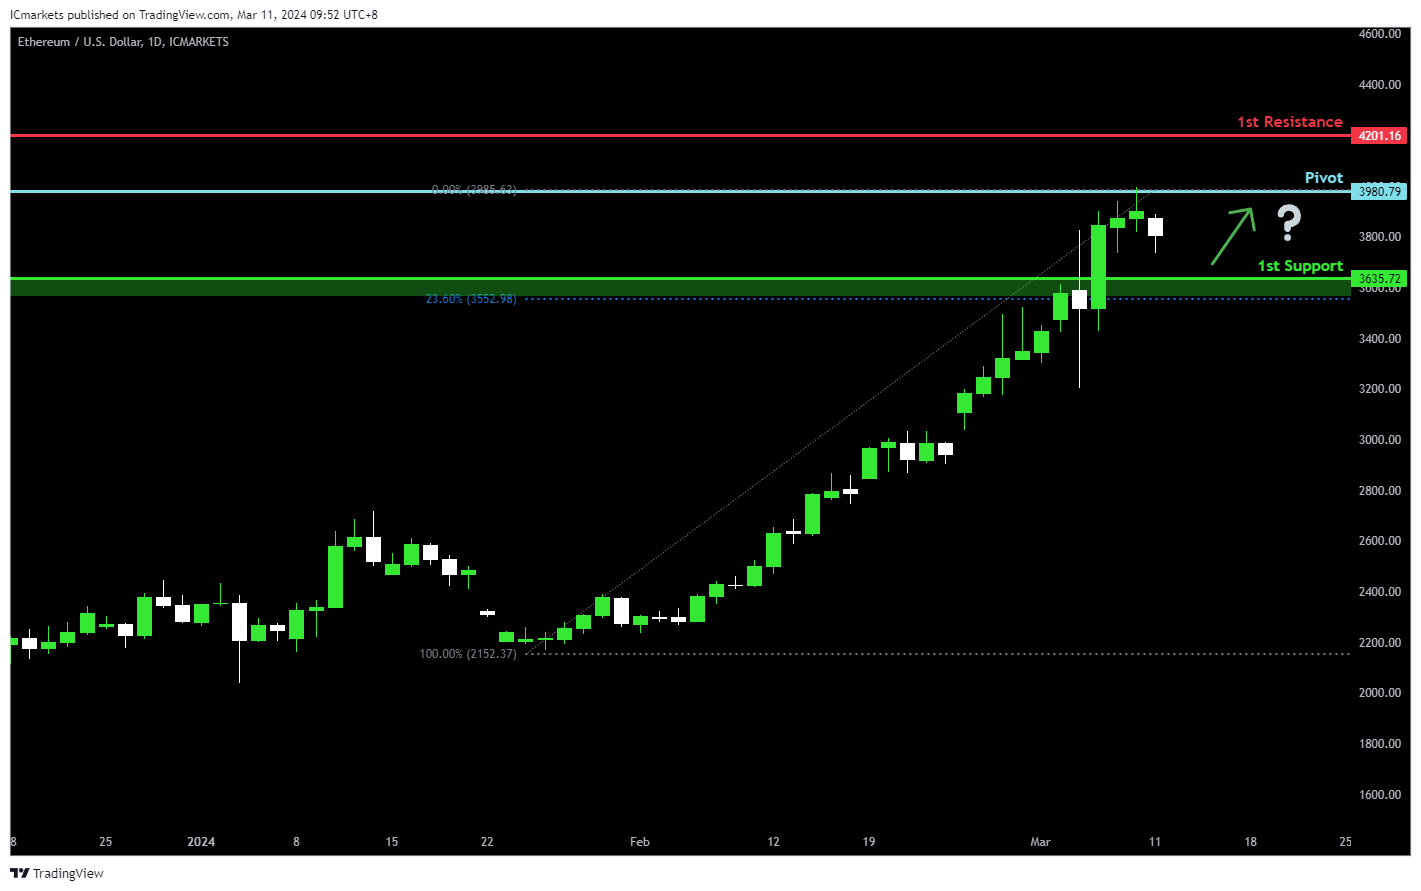
ETH/USD:
The ETH/USD chart currently exhibits bullish momentum, with several factors contributing to the upward movement. The pivot level at 3980.79 acts as an overlap support, indicating a significant historical level where buying interest could emerge.
The 1st support at 3635.72 aligns with a pullback support and coincides with the 23.60% Fibonacci Retracement level, reinforcing its significance as a potential area of demand where buyers might step in.
On the resistance side, the 1st resistance level at 4201.16 serves as a pullback resistance, suggesting a historical barrier to further upward movement.
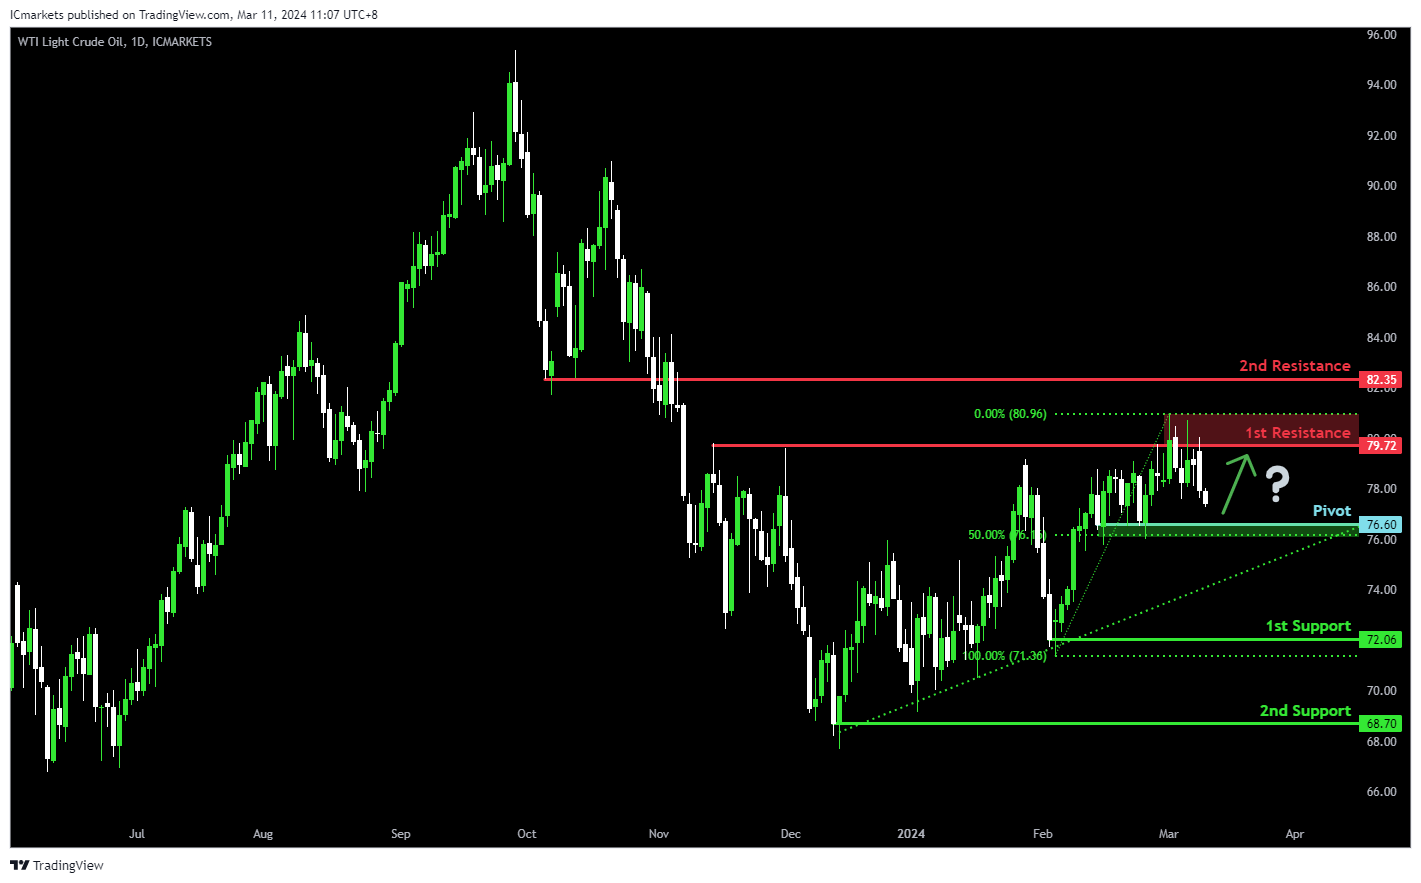
WTI/USD:
The WTI (West Texas Intermediate) chart currently demonstrates an overall bearish momentum. However, there is a potential scenario for price to bounce off the pivot level and rise towards the 1st resistance.
The pivot level at 76.60 is identified as a pullback support that aligns with the 50.00% Fibonacci Retracement level. Further below, the 1st support level at 72.06 is marked as a swing-low support while the 2nd support level at 64.70 is noted as a pullback support, reinforcing its significance as a key support level.
To the upside, the 1st resistance level at 79.72 is identified as a pullback resistance while the 2nd resistance level at 82.35 is noted as an overlap resistance, further reinforcing its significance as a potential barrier to further bullish movement.
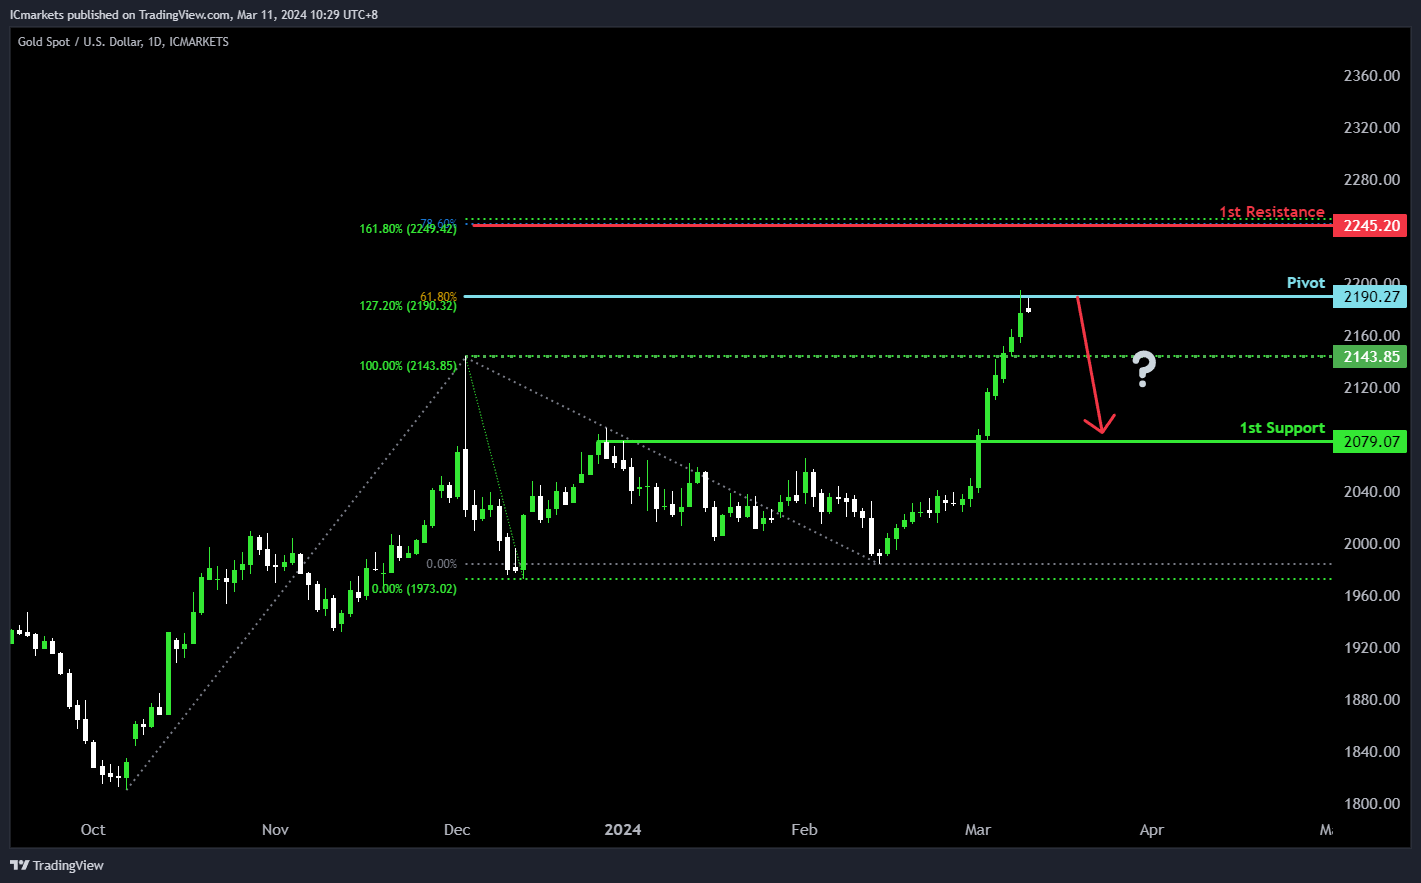
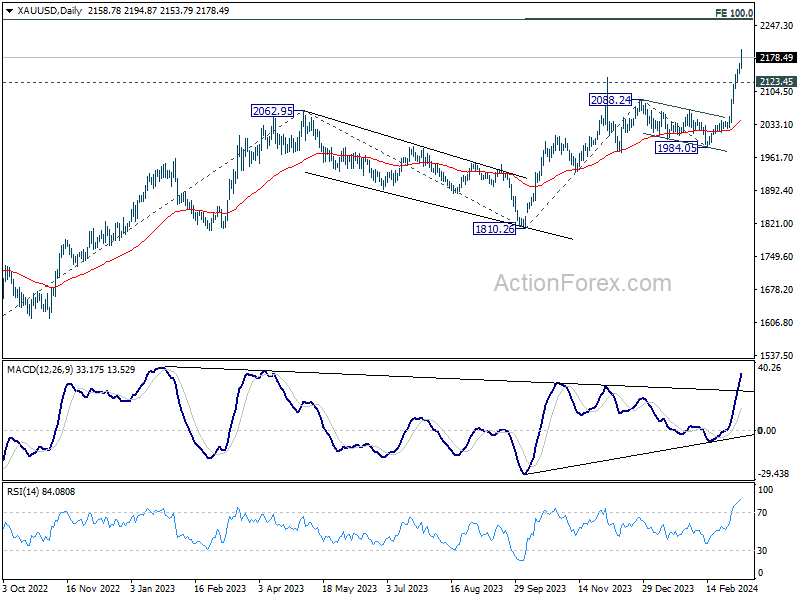
XAU/USD (GOLD):
The XAUUSD chart indicates bearish momentum, potentially leading to a bearish reaction from the pivot towards the 1st support.
The pivot at 2190.27 presents significant swing high resistance, supported by the 127.20% Fibonacci Extension and the 61.80% Fibonacci Projection, suggesting a potential area of resistance where selling pressure could intensify.
The 1st support level at 2079.07 serves as pullback support, offering a potential area where buying interest might emerge, potentially halting the downward movement.
Conversely, the 1st resistance at 2245.20 presents a significant barrier, reinforced by the 161.80% Fibonacci Extension and the 78.60% Fibonacci Projection, indicating a strong resistance zone where selling pressure may increase, potentially limiting further upward movement in the price.
EUR/GBP and GBP/CHF await UK data
Sterling would likely be on the move this week as key UK economic indicators, including GDP, employment, and wages data, are set to be released. These figures are eagerly watched, as any deviation from expectations could influence the market's anticipations for the upcoming inflation report and BoE's subsequent meeting next week.
GBP/CHF's rally from 1.0634 continued last week and hit as high as 1.1287. Immediate focus is now on 100% projection of 100% projection of 1.0634 to 1.1058 from 1.0893 at 1.1317. Decisive break there would prompt upside acceleration towards 161.8% projection at 1.1579. While overbought condition, as seen in D RSI, might limit upside at 1.1317 on initial attempt, near term outlook will stay bullish as long as 1.1182 resistance turned support holds.
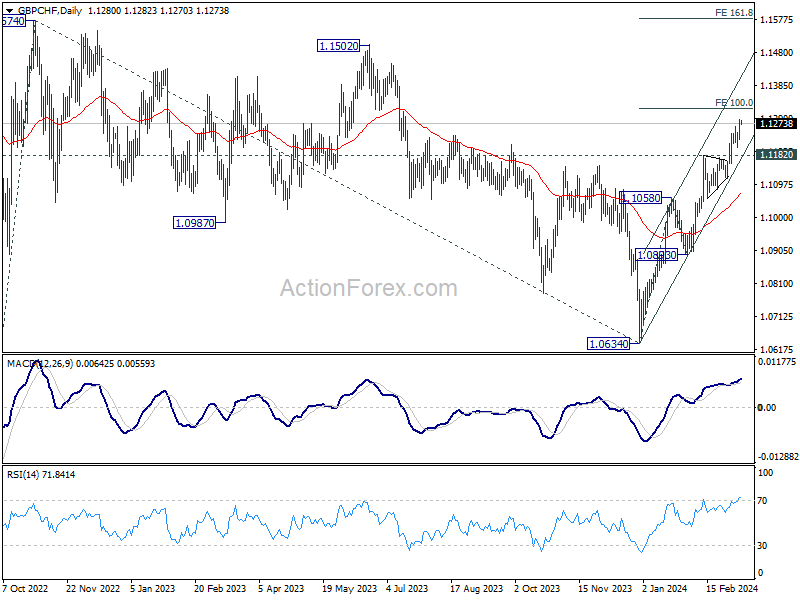
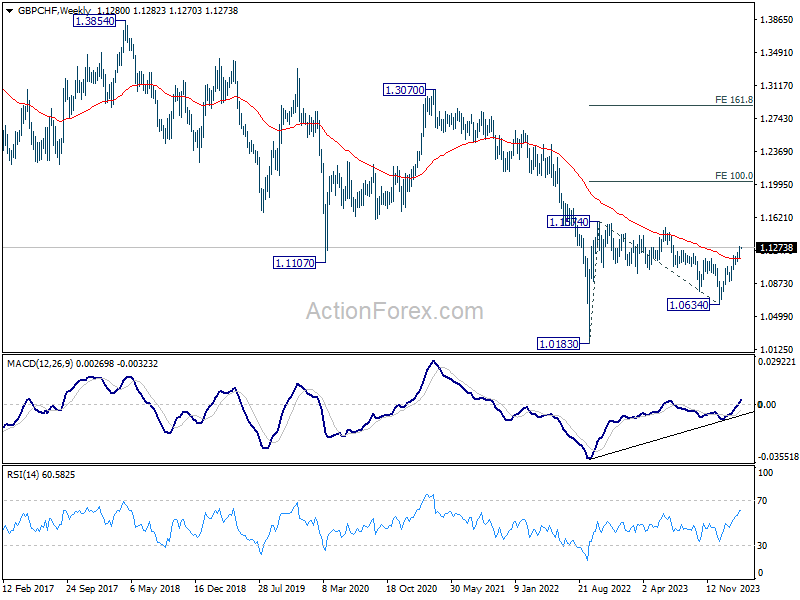
In the larger picture, the break of 55 E EMA is a medium term bullish sign. This also strengthen the case that correction from 1.1574 has completed at 1.0634 already. Rise from 1.0183 (2022 low) could be ready to resume. Retest of 1.1574 should be seen next, and firm break there will pave the way to 100% projection of 1.0183 to 1.1574 from 1.0634 at 1.2025 in the medium term.
EUR/GBP's rejection by 55 D EMA is a near term bearish sign, which suggests that fall from 0.8764 is still in progress. Break of 0.8497 support will resume this decline to 61.8% projection of 0.8977 to 0.8491 from 0.8764 at 0.8464. Firm break there could trigger downside acceleration to 100% projection at 0.8278.
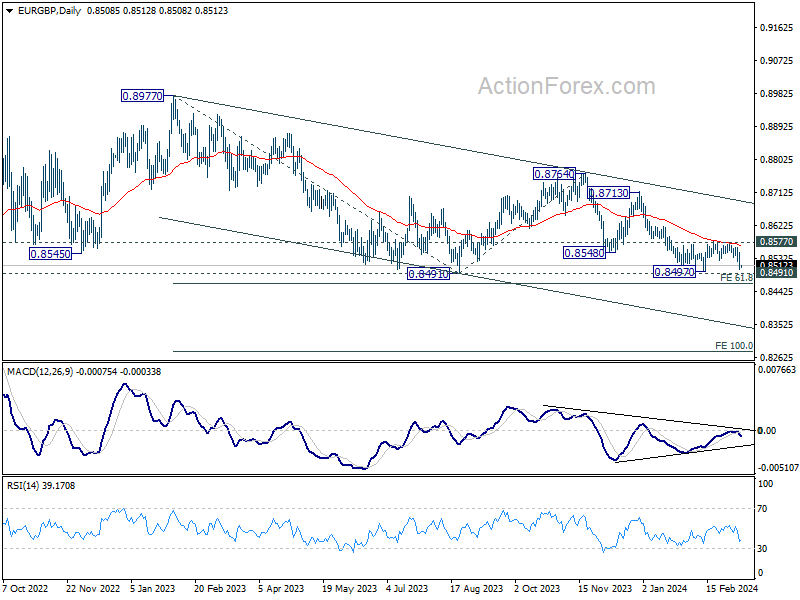
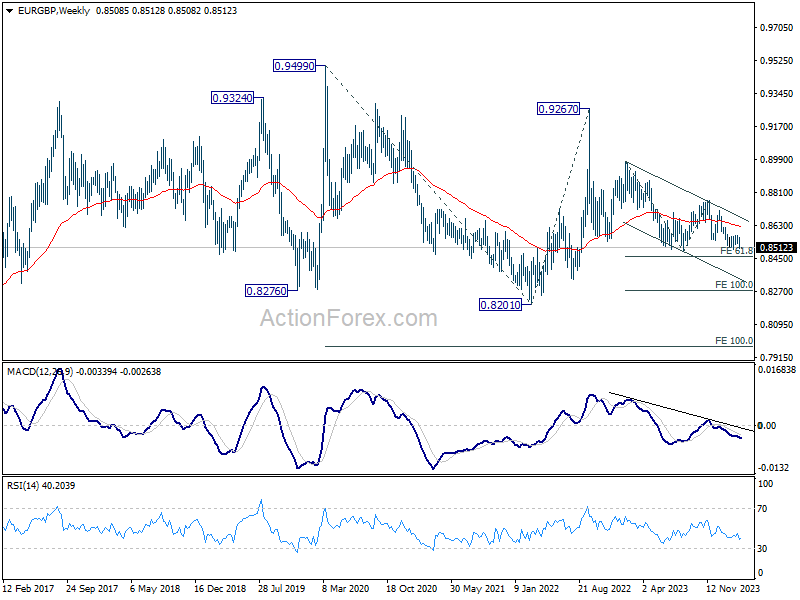
Any downside acceleration ahead would also strengthen the case that fall from 0.9267 is going to extend through 0.8201 (2022 low) in the medium term, as the third leg of the pattern from 0.9499 (2020 high).
Japan’s Q4 GDP finalized at 0.1% qoq, a narrow escape from recession
Japan's economy has narrowly avoided a recession, as shown in the final GDP figures for Q4. The revised data indicates a modest growth of 0.1% qoq, a positive swing from the preliminary estimate of -0.1% qoq contraction. On annualized basis, GDP expanded by 0.4%, contrasting sharply with initial reports of -0.4% decline.
The main driver behind this upward revision was significant increase in capital expenditure, which surged by 2% qpq, deviating markedly from the initially estimated -0.1% qoq drop. However, private consumption, accounting for approximately 60% of Japan's economy, presented a less optimistic picture, declining by -0.3% qoq, a slight deterioration from the provisional figure of -0.2% qoq.
This latest economic data comes at a crucial time, but it does not seem to deter BoJ from considering an interest rate hike for the first time since 2007, scheduled for March 19. The anticipation builds around the annual Spring wage negotiations, which have so far shown strong momentum. Positive outcomes are also expected from the forthcoming results from Rengo, Japan's largest union group, on March 15.
China’s CPI turned positive to 0.8% yoy amid Lunar New Year demands
In February, China's CPI marked its first annual increase after a six-month sequence of declines. CPI rose by 0.7% yoy, surpassing expectation of 0.3% yoy and marking a significant rebound from January's -0.8% yoy, the largest decrease in consumer prices since 2009. On a month-on-month basis, CPI acceleration was evident, jumping from a modest 0.3% mom to 1.0% om, well above the forecasted 0.7% mom.
This inflationary uptick, primarily driven by heightened demand during the Lunar New Year celebrations, underscores the seasonal influence on China's economic activities. Notably, food prices witnessed a considerable increase of 3.3% mom, a reflection of the festive period's impact.
Conversely, PPI had a contrary movement, declining by -2.7% yoy, indicating deeper deflationary pressures than the anticipated -2.5%.
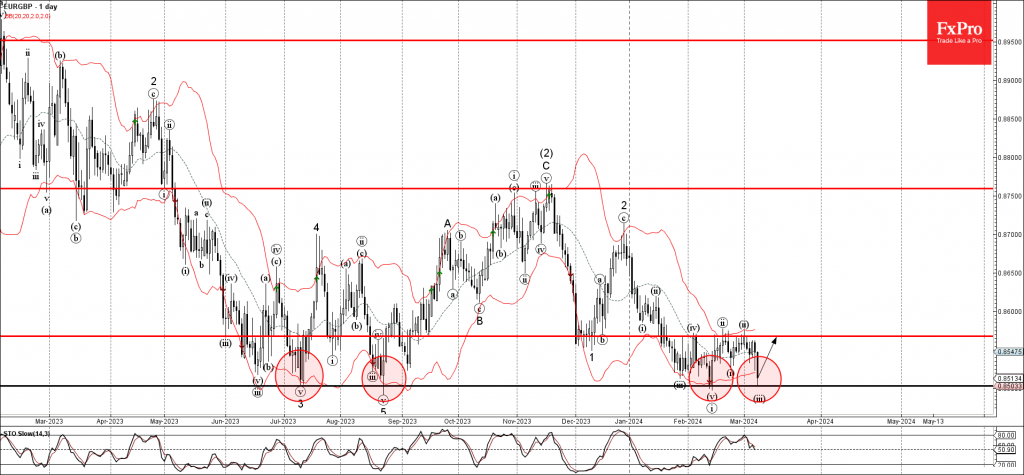
EURGBP Wave Analysis
- EURGBP reversed from multi-month support level 0,8500
- Likely to rise to resistance level 0.8565
EURGBP currency pair today reversed up from the major multi-month support level 0,8500 (which has been repeatedly reversing the pair from last July, as can be seen below).
The support level 0,8500 was further strengthened by the lower daily Bollinger Band.
Given the strength of the support level 0,8500 and the clear bullish divergence on the daily Stochastic indicator, EURGBP currency pair can be expected to rise further toward the next resistance level 0.8565, which stopped the earlier minor corrections iv, ii and ii.
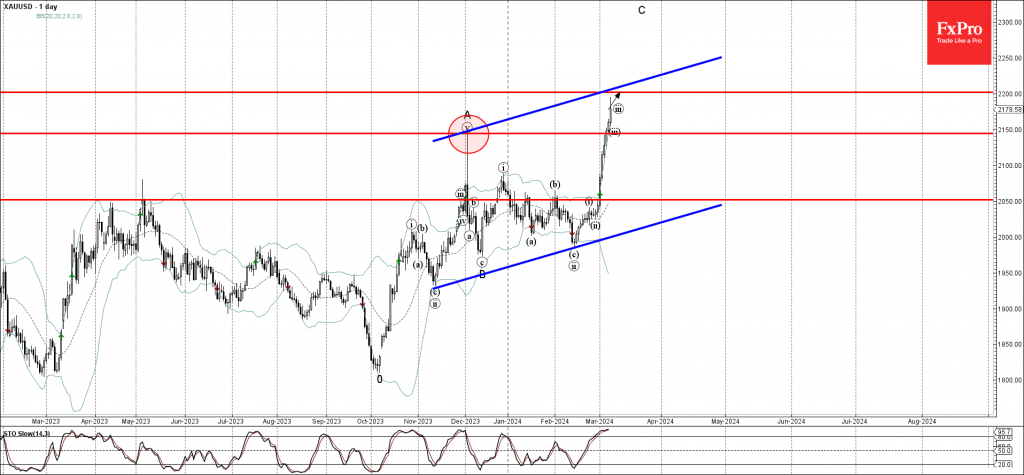
Gold Wave Analysis
- Gold broke key resistance level 2150.00
- Likely to rise to resistance level 2200.00
Gold continues to rise strongly after breaking the key resistance level 2150.00 (which stopped wave A of the active ABC correction at the start of last December, as can be seen below).
The breakout of the resistance level 2150.00 accelerated the active short-term impulse waves iii and C.
Given the clear daily and the weekly uptrend, Gold can be expected to rise further toward the next resistance level 2200.00 (target price for the completion of the active impulse wave iii, coinciding with the daily up channel from last year).
Forex and Cryptocurrencies Forecast
EUR/USD: A Bad Week for the Dollar
The past week was dominated by the European Central Bank (ECB)'s meeting on Thursday, 7 March. As anticipated, the pan-European regulator decided to maintain its current monetary policy, leaving the interest rate unchanged at 4.50%. This move reaffirmed its commitment to steering inflation into the desired range. The ECB aims to be absolutely certain that inflation is consistently moving towards its 2.0% target, which currently stands at 2.6%.
According to analysis from ANZ Bank, a reduction in euro rates is expected in Q2. "Our interpretation of current ECB official guidance is that hawks are on the rise and prefer to wait for more detailed wage growth data before initiating a rate cut. We believe a consensus will be reached in June," ANZ economists wrote.
This expectation was echoed by Gediminas Šimkus, a member of the ECB Governing Council and head of Lithuania's central bank, on Friday, 8 March. He stated that "all conditions are set for a transition to a less stringent monetary policy, with a rate cut in June being very likely. While a cut in April cannot be ruled out, the likelihood is low." He added that there is no reason to reduce the rate by more than 25 basis points in one go.
It's important to note that the Federal Reserve usually acts more aggressively than the ECB, changing its rate more frequently and with greater amplitude. To see this, one only needs to look at the statistics from the last 10 years. According to analysts at Commerzbank, this means that if both central banks start their easing cycles at the same time, the dollar rate could very quickly fall below the euro rate, which would support an increase in the EUR/USD exchange rate.
However, what the cycles will look like this time remains unclear. The CME FedWatch Tool estimates a 56% probability of a Federal Reserve rate cut in June. Yet, speaking to the US Congress on 6-7 March, Fed Chair Jerome Powell only vaguely stated that the regulator would ease monetary policy "at some point this year".
A statement by Loretta Mester, president of the Federal Reserve Bank of Cleveland, proved to be more interesting. Speaking at the European Centre for Economics and Finance, she expressed concerns about the continued steady decrease in inflation throughout the year. Therefore, in Mester's view, it would be appropriate to keep the rate at its current level of 5.50%. The head of the Federal Reserve Bank of Cleveland also suggested that if economic conditions align with forecasts, the likelihood of a rate cut towards the end of the year might increase.
Regarding the macroeconomic statistics released last week, Eurostat's final assessment showed that the Eurozone economy grew by 0% in quarterly terms over the last three months of 2023. Year-on-year, GDP increased by 0.1%. Both figures matched preliminary estimates and market expectations, thus having no impact on the exchange rates.
Throughout the week, the dollar was under pressure, and not just due to Jerome Powell's "dull" Congressional testimony. US macroeconomic reports appeared relatively weak. For instance, the ISM Services Sector Business Activity Index for February fell from 53.4 points to 52.6 points. Manufacturing orders in January also dropped by 3.6%, which was worse than the 2.9% forecast. The number of job openings (JOLTS) in the US last month was 8.863 million, down from 8.889 million the previous month, and initial unemployment claims for the week ending on 2 March rose to 217K, exceeding the 215K forecast. All these factors together led to the EUR/USD pair moving out of the narrow range of 1.0800-1.0865, in which it had been trading since 20 February, and rising to the 1.0900 mark.
Labour market statistics released on Friday, 8 March, could have supported the dollar, but this did not happen, even though the market's reaction was somewhat puzzling. On one hand, the number of new jobs created outside of the agricultural sector (NonFarm Payrolls) was 275K, significantly exceeding both the previous figure of 229K and the forecast of 198K. Typically, such indicators would push the EUR/USD pair down. However, this time, it sharply rose instead. This likely relates to the unemployment rate increasing from 3.7% to 3.9% (with a forecast of 3.7%) and the average hourly earnings showing a sharp drop from 0.5% (month-over-month) to 0.1% (against a forecast of 0.2%). It seems the last two indicators outweighed the positive effect from the NFP. Market participants decided that these would be additional arguments in favour of a more imminent interest rate cut, resulting in EUR/USD soaring to 1.0980.
Subsequently, the excitement settled, and EUR/USD closed at 1.0937. As for the short-term outlook, as of the evening of Friday, 8 March, 35% of experts were in favour of the dollar strengthening and the pair falling, while 65% sided with the euro. Trend indicators and oscillators on the D1 chart are 100% coloured in green, with a quarter of the latter in the overbought zone. The nearest support levels for the pair are situated in the 1.0845-1.0865 zone, followed by 1.0800, then 1.0725, 1.0680-1.0695, 1.0620, 1.0495-1.0515, and 1.0450. Resistance zones are located around 1.0970-1.1015, 1.1050, and 1.1100-1.1140, up to 1.1230-1.1275.
The upcoming week is expected to be quite tumultuous. Significant volatility can be anticipated on Tuesday, 12 March, with the release of consumer inflation (CPI) data in Germany and the USA. On Thursday, 14 March, retail sales statistics and the Producer Price Index (PPI) in the United States will be announced. The week will conclude with the publication of the University of Michigan Consumer Sentiment Index on Friday, 15 March.
GBP/USD: A Good Week for the Pound
Starting the week at 1.2652, GBP/USD recorded a local high of 1.2893 on Friday, gaining 241 points and breaking out of the medium-term sideways channel of 1.2600-1.2800. The first reason for such dynamics is the weakness of the dollar, as mentioned earlier. The second reason is the positive economic statistics from the UK: the Construction PMI increased from 48.8 to 49.7. This indicates that the real estate sector is almost overcoming a period of stagnation, which, in turn, will eventually provide significant support to the country's economy.
There's also a third reason. In our last review, we warned that a key event for the pound sterling last week would be the announcement of the UK Government's budget on Wednesday, 6 March. This pre-election budget could significantly impact the British currency, which in 2024 is the second most successful G10 currency after the US dollar.
Finance Minister Jeremy Hunt, presenting the spring government budget, called it a plan for long-term growth. Hunt announced various benefits and subsidies amounting to £1.8 billion, as well as an allocation of £360 million for funding research and development in the biomedical sector, car manufacturing, and aerospace production. The government will also assist British households by partially reducing taxes. Moreover, it will actively stimulate economic growth to ensure the prosperity of the country's citizens. Specifically, the temporary reduction in duties on fuel and alcohol will continue.
Hunt also stated that inflation could fall to 2.0% by the end of the year, and the UK's GDP this year would grow by 0.8%. Overall, the finance minister's figures and promises, as is customary before elections, were quite impressive, allowing the pound to strongly challenge the dollar.
But will this boost of strength last for the British currency? Economists at HSBC note that the UK still faces a challenging combination of inflation and growth. This limits the Bank of England (BoE)'s ability to maintain a maximally hawkish stance compared to other central banks. As it becomes more dovish, the pound may face significant downward pressure in the coming months.
GBP/USD concluded last week at 1.2858. Analysts' opinions on its near-term behaviour are divided: a majority (60%) predict a decline, 20% anticipate growth, and 20% remain neutral. Among trend indicators and oscillators on the D1 chart, the situation mirrors that of EUR/USD: all point north, although 25% of oscillators signal the pair is overbought. Should the pair move southward, it will encounter support levels and zones at 1.2800-1.2815, 1.2750, 1.2695-1.2710, 1.2575-1.2610, 1.2500-1.2535, 1.2450, 1.2375, and 1.2330. In the event of an upward trend, resistance will be met at levels 1.2880-1.2900, 1.2940, 1.3000, and 1.3140.
On Wednesday, 13 March, the UK's GDP data for January 2024 will be released. The country's economy is expected to show growth of 0.2%, reversing a decline of -0.1% in December, which would confirm Jeremy Hunt's optimism. No other significant macroeconomic statistics regarding the UK economy are scheduled for release next week.
USD/JPY: A Great Week for the Yen
If the past week was very good for the pound, it was simply great for the Japanese yen. USD/JPY reached a local minimum of 146.47 on the evening of Friday, 8 March, meaning the yen reclaimed more than 360 points from the dollar.
In addition to the weakening of the dollar, the yen was bolstered by rumours that the Bank of Japan (BoJ) may soon decide to normalize its monetary policy. Citing informed sources, Reuters reported that "if the results of the spring wage negotiations [on 13 March] are strong, the Bank of Japan may not have to wait until April" to exit its negative interest rate policy, and that the BoJ "is leaning towards ending negative rates as early as March."
Another report by Jiji News mentioned that "the Bank of Japan is considering a new quantitative framework for its monetary policy, which will outline the prospects for future government bond purchases." "The Bank of Japan," Jiji continues, "will review its Yield Curve Control (YCC) as part of considering a new quantitative policy.".
Thus, Wednesday, 13 March, could become a significant day for the Japanese currency, as could 19 March, when the next meeting of the Bank of Japan is scheduled. It's possible the regulator might increase the interest rate on this day for the first time since 2016. However, analysts at the French Natixis Bank believe that if there is an increase, it would be very slight. "In reality, the depreciation of the yen is beneficial for the Japanese economy," the bank's analysts write. "It helps to bring inflation back to the 2% target and stimulates exports. Since Japan has very significant net foreign assets, primarily in dollars and euros, a depreciation of the yen leads to a capital gain in yen value of these external assets." "As a result," Natixis concludes, "one should not expect Japan to move to a tighter monetary policy. At most, a symbolic increase in the base rate can be expected."
Commerzbank holds a similar position, believing that the yen's potential is limited, and a strong appreciation, especially in the medium and long term, should not be expected. According to Commerzbank economists, this is due to the Bank of Japan's lack of capacity for a pronounced normalization of interest rates.
USD/JPY concluded last week at 147.06. As for the near future, it's impossible to come to a consensus: 20% sided with the bears, an equal 20% with the bulls, and 60% remained undecided. Among the oscillators on the D1 chart, only 15% are coloured in green, while the remaining 85% are in red, with 40% indicating an oversold condition. The distribution of strength among trend indicators is exactly the same: 85% to 15% in favour of the reds. The nearest support levels are found at 146.50, 145.90, 144.90-145.30, 143.40-143.75, 142.20, and 140.25-140.60. Resistance levels and zones are located at 147.65, 148.25-148.40, 149.20, 150.00, 150.85, 151.55-152.00, and 153.15.
In the upcoming week's calendar, noteworthy events include the announcement of Japan's Q4 2023 GDP volume on Monday, 11 March. Additionally, as previously mentioned, the wage negotiations on 13 March are of significant interest. No other major events related to the Japanese economy are planned for the near future.
CRYPTOCURRENCIES: Two Historic Records in One Week
In less than 24 hours on 4 March, bitcoin appreciated by approximately 10% and reached the mark of $69,016. This was a new (but not the last) historical record, surpassing the previous one of $68,917 set on 10 November 2021. Most top-10 crypto assets also saw a 10-30% increase in value over the week.
This surge in bitcoin is attributed to purchases by a supposed billionaire from Qatar, who flew in on his private jet to Madeira for the three-day Bitcoin Atlantis conference. Keychainx CEO Robert Rodin wrote that he saw something at Madeira airport that "could forever change bitcoin." BTC maximalist Max Keiser, in turn, shared a video in which the President of El Salvador, Nayib Bukele, greets the Emir of Qatar with the words "It's happening!"
What exactly Rodin and Bukele meant is unknown. However, this was enough to fuel discussions about Qatar adding bitcoins to its balance sheet. The accuracy of such claims is unproven, but social networks are abuzz with speculation on this matter. It's worth noting that rumours about one or two sovereign wealth funds or investment companies from the Middle East secretly buying up bitcoins have been circulating for several months.
Following the update of its historical high, bitcoin then plunged, dropping to $59,107 on 5 March, with forced liquidations on the futures market reaching $1 billion. However, this dip was short-lived as whales bought up much of the supply, not only returning the market to its previous dynamics but also setting a new record: on 8 March, the leading cryptocurrency reached $69,972. This is largely because most market participants anticipate its continued growth, surpassing at least the $100,000 mark.
According to trader Gareth Soloway, the upcoming bitcoin halving in April does not guarantee by itself that the digital gold will reach the mentioned size. Soloway identifies the monetary policy of the US Federal Reserve as the deciding factor. The Fed's reluctance to aggressively cut interest rates could support high inflation, potentially contributing to bitcoin's upward trend. "If we see an increase in liquidity (which will definitely happen), then bitcoin will rise to $100,000 in 2024," writes Soloway. However, on its way to this round figure, the trader does not rule out a short-term bearish correction.
Experts at JPMorgan also discuss the possibility that the halving could trigger a sharp decrease in the price of the first cryptocurrency. The algorithmic reduction of the reward from 6.25 BTC to 3.125 BTC will decrease mining profitability. Based on this, economists at JPMorgan, led by senior analyst Nikolaos Panigirtzoglou, predict that the price will fall to $42,000 after the halving. "The cost of mining bitcoin empirically acts as a floor for its price," their report states. "After the halving, this metric will be $42,000." "This is also the level towards which, in our view, the price will gravitate once the post-halving euphoria subsides in April," note JPMorgan's experts.
According to the well-known Stock-to-Flow (S2F) model, the primary cryptocurrency has transitioned from the accumulation phase to the growth phase. The accumulation phase is characterized by a relatively smooth price increase, low volatility, and moderate corrections, with the maximum drawdown in the concluded cycle not exceeding 22%. The growth phase presents a different picture. Historical data shows that during movements towards new highs, drawdowns ranged from 36% to 71%. JPMorgan has predicted a drop in bitcoin to $42,000. At the current price, this correction would be approximately 36-40%, aligning with the lower end of the specified range. A 70% correction, however, could lead to a significantly deeper fall.
How could this happen? Initially, to stay afloat, miners, whose incomes will be halved, will begin to sell off their stocks. Then, institutional and short-term speculators, looking to lock in profits, will join in. Concurrently, stop orders will start to trigger, leading to an avalanche-like plunge in quotations. And if investors who have put their money into spot BTC-ETFs also join this "crypto-fall", the depth of the drop could be hard to imagine. It's worth noting that in January-February, BTC-ETFs attracted 75% of all investments in the main cryptocurrency, and there are no guarantees that panic sentiment won't affect the depositors of these funds.
However deep the correction might be, bitcoin, in the opinion of many experts, will still remain within the long-term upward trend. "We have entered the era of the bitcoin gold rush. It started in January 2024 and will last approximately until November 2034," believes MicroStrategy's founder Michael Saylor. According to his calculations, by that time, miners will have extracted 99% of all coins, marking the beginning of the "growth phase." (According to BitcoinTreasuries, 93.5% has already been mined as of now).
Saylor believes that currently, only 10-20% of asset managers are interested in spot BTC-ETFs. In the future, as existing barriers are removed, this figure will approach 100%. "When they [managers] can buy BTC through a bank, platform, or prime broker, they'll spend $50 million in an hour," he stated. The founder of MicroStrategy also expressed confidence that "there will come a day when bitcoin will surpass gold and will be traded more than the S&P 500 ETFs."
In the next 15 years, bitcoin could appreciate 64 times to reach $10.63 million. This forecast was made by Professor Giovanni Santostasi based on a power-law model. According to the scientist, this model provides a clear and predictable scenario for the price change of the first cryptocurrency over long periods. However, over shorter spans, which the media primarily focus on, the quotations behave chaotically. Unlike the S2F model by the analyst known as PlanB, the power law is logarithmic, not exponential. In other words, the price of bitcoin is not expected to constantly increase over time. According to Santostasi's calculations, digital gold will peak at $210,000 in January 2026, then drop to $60,000, and after that, it will continue its wave-like growth to $10.63 million.
(For reference: A power-law relationship is a mathematical relationship between two quantities where a relative change in one quantity leads to a proportional relative change in the other, regardless of the initial values of those quantities. The manifestation of this law can be found across a wide range of natural phenomena, from the frequency of earthquakes to the dynamics of stock market changes.).
As of the evening of Friday, 8 March, BTC/USD is trading at around $68,100. The Crypto Fear & Greed Index has slightly risen from 80 to 81 points, entering the Extreme Greed zone. The total market capitalization of cryptocurrencies stands at $2.60 trillion (up from $2.34 trillion a week ago), with the main cryptocurrency's dominance index at nearly 52%, and its capitalization exceeding $1.35 trillion. This surpasses the fiat currency market capitalizations of Malaysia, Indonesia, Vietnam, Thailand, the UAE, Mexico, and many other countries. A few days ago, BTC surpassed the Russian ruble in capitalization, taking the 14th spot in the overall ranking of the largest currencies, with the Swiss franc as its nearest competitor. Amid news that bitcoin exceeded the rouble, jokes flooded the internet suggesting Vladimir Putin is Satoshi Nakamoto. Ethereum ranked 28th, performing better than the Chilean peso but not as well as the Turkish lira.
In the overall ranking of the most capitalized assets, which includes precious metals and companies, bitcoin secured the 10th place. It surpassed Berkshire Hathaway, the company of well-known cryptocurrency critic billionaire Warren Buffett, but did not reach Meta. The top 3 are currently occupied by gold, Microsoft, and Apple.
Dollar Dives, Yen Soars, A Week of Divergent Fortunes
Dollar and Yen had contrasting fortune last week, responding to divergent central bank expectations. Dollar found itself as the week's worst performer, a reflection of solidified expectations for Fed's first rate cut in June, reinforced by Fed Chair Jerome Powell's semiannual testimony. The cooling job US market is seen as unlikely to stand in the way. On the flip side, Yen staged a powerful rally, driven by a growing consensus around BoJ's rate increase this month, making Yen the best performer.
Currency markets offered a mixed tableau elsewhere. British pound secured its position as the week's second-strongest currency, benefiting from overarching risk-on sentiment and specific gains against Euro. Australian and New Zealand dollars also saw an uptick, with Aussie additionally buoyed by improved trade relations with China.
On the other hand, Canadian Dollar was the second worst next to the greenback despite BoC dropping no hint on rate cut yet. Swiss Franc was the third worst as a safe haven currency. Euro ended mixed only despite having strong rally against the greenback. ECB was clear that rate cuts are coming, with more officials pointing to June as the timeline.
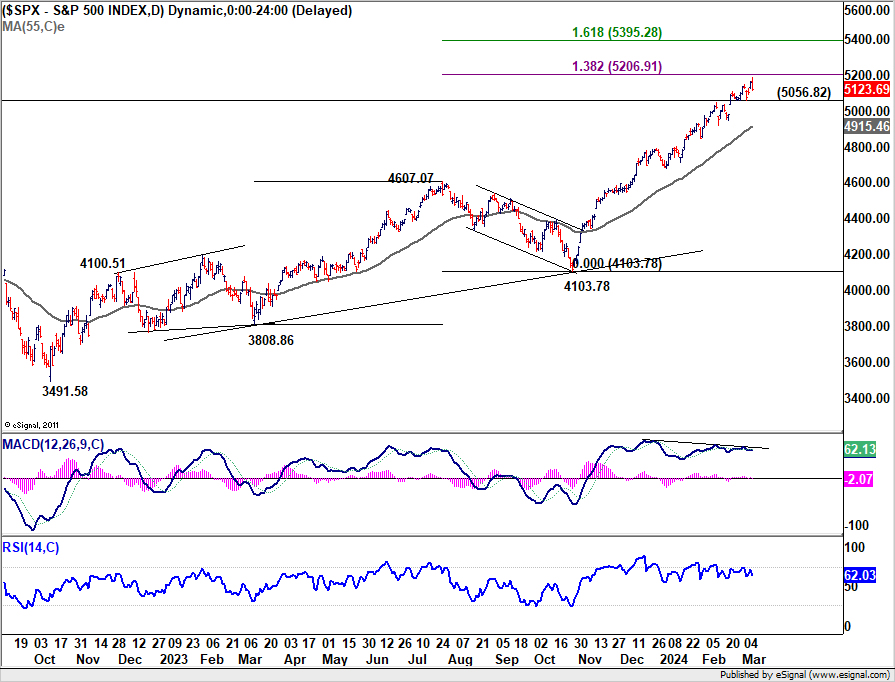
On a broader scale, global financial markets reflected continuation of risk-on sentiment, with key indices like S&P 500, NASDAQ, CAC, DAX, and Nikkei achieving new records. However, some signs of market exhaustion hint at possible adjustments on the horizon. Elsewhere, Gold and Bitcoin reached new peaks too, with Gold's rise partly attributed to China's strategic gold acquisitions amid geopolitical tensions and domestic economic pressures.
Dollar and Yields Slide as June Rate Cut by Fed Becomes More Probable
Developments in the US last week were starting to cement market's anticipation for Fed to embark on interest rate cuts at June meeting. A critical moment came during Fed Chair Jerome Powell's semiannual congressional testimony, where he subtly hinted at Fed is "not far from" the point of comfort needed to ease monetary policy. Powell's call for "a little bit more data" before initiating rate cuts has notably shifted market sentiments, framing a cut within Q2 as increasingly plausible.
The release of a 'goldilocks' non-farm payroll report further solidified this stance, portraying a cooling labor market that still manages to avoid a deep chill. The data, revealing slower wage growth and a slight uptick in unemployment, suggests that the job market wouldn't hinder Fed from beginning its rate reduction journey.
Market pricing, mirrored in fed funds futures, resonates with these developments. The likelihood of Fed holding steady through its next meeting has dwindled to around 20%, while the probability of initiating rate cuts hovers around 80%. This alignment isn't radically different from a week prior, yet the conviction among market participants has deepened.
In the stock markets, while S&P 500 reached new records, it appears to be grappling for further momentum. Considering bearish divergence condition in D MACD, strong resistance could be seen from 138.2% projection of 3808.86 to 4607.07 from 4103.78 at 5206.91 to limit upside. Break of 5056.82 will start a near term correction back to 55 D EMA (now at 4915.46).
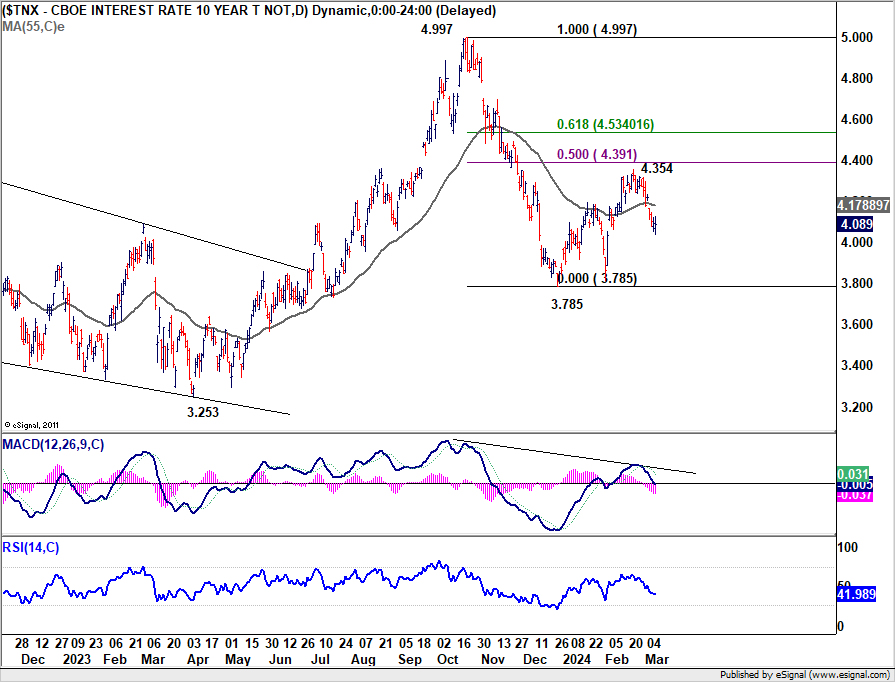
10-year yield's steep decline last week suggests that corrective rebound from 3.785 has completed at 4.354 already. Deeper fall will remain in favor as long as 55 D EMA (now at 4.178) holds. Nevertheless, strong support is likely between 3.785 low and 4.000 psychological level to contain downside. Breakout from range of 3.785/4.354 is not envisaged for now.
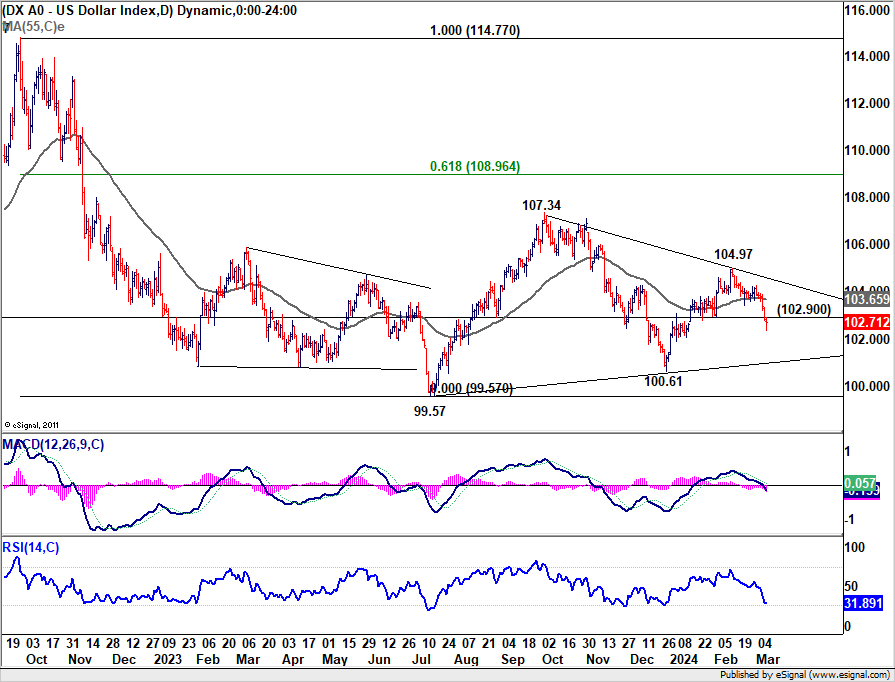
Amidst this backdrop, Dollar Index had a pronounced decline, catalyzed by the buoyant risk-on market sentiment, weakness in US treasury yields, and the solidifying expectations of a Fed June rate. The break of 102.90 support indicates that rebound from 100.61 has completed much earlier than expected at 104.97. Near term risk will stay on the downside as long as 55 D EMA (now at 103.65) holds. Deeper decline would be seen back towards 100.61 support. But strong support should emerge above 99.57 low to bring rebound, to continue medium term sideway pattern.
For Dollar Index to break through 99.57, risk-on sentiment would need to intensify further, as manifested by S&P 500 rising through 161.8% projection of 3808.86 to 4607.07 from 4103.78 at 5395.28. At the same time, 10-year yield would need to break through 3.785 support decisively. This scenario, however, remains unlikely in the immediate term.
Anticipation Builds for BoJ Hike This Month, Yen Skyrockets
This week has also been particularly groundbreaking for Japan as the financial markets adjust to the growing anticipation of imminent BoJ rate hike, as early as on March 19. The probability of this move, as inferred from overnight indexed swaps, has surged dramatically from a mere 30% last week to an overwhelming 80% at one point.
A key driver behind this shift is the latest reports from the annual Spring wages negotiations, showing unions securing the highest wage hikes in more than three decades. These developments suggest a solid continuation of wage growth, spurred by increasing living costs and deepening labor shortage. This scenario aligns closely with BoJ's long-awaited wage-price spiral dynamics.
Reuters also reported an increasing consensus among BoJ policymakers toward ending the era of negative interest rates this month. Besides, this monumental shift is anticipated to prompt a comprehensive overhaul of Japan's quantitative easing program.
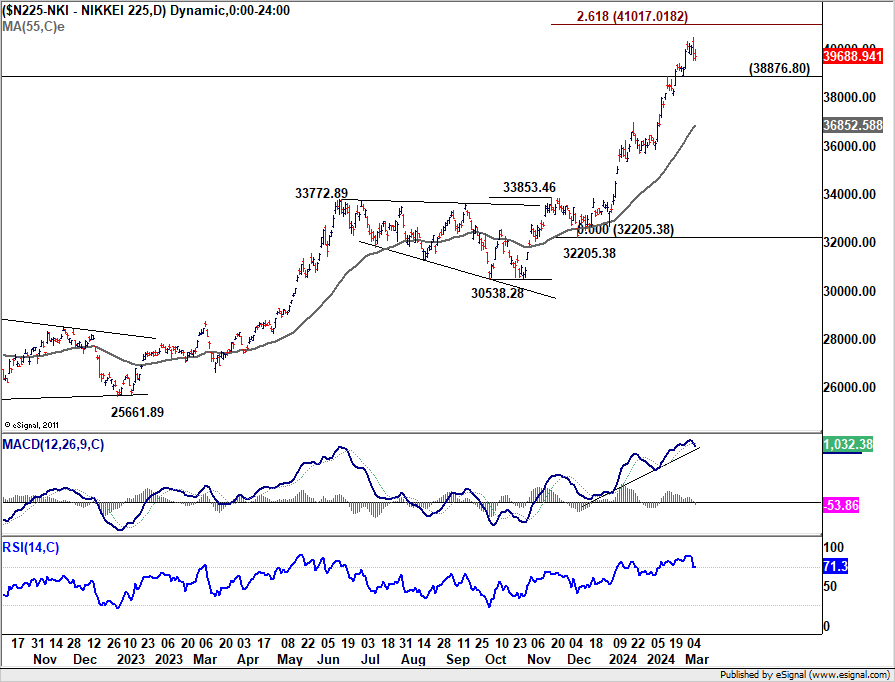
Nikkei as been resilient to the news so far and hit new record high above 40k psychological level. Nevertheless, upside momentum is starting to diminish as see in D MACD. Strong resistance might come from 261.8% projection of 30538.28 to 33853.46 from 32205.38 at 41017.01 to limit upside and bring pull back. Meanwhile, break of 38876.80 would start a corrective back towards 55 D EMA (now at 36852.58). That might come as a reaction to BoJ's rate hike.
Yen ended as the week's strongest performer, benefiting not only from the recalibrated BoJ rate hike expectations but also from the decline in global benchmark yields. Specifically, Germany's 10-year yield receded from prior week's close of 2.421 to 2.266, and UK's from 4.214 to 4.060, whereas Japan's 10-year yield edged higher from 0.720 to 0.735.
USD/JPY was the biggest mover of the week, down -303 points or -2.06%. Technically, the pressing question is whether fall from 150.87 is a correction to rise from 140.25, or the third leg of the medium term consolidation from 151.89. Sustained break of 38.2% retracement of 140.25 to 150.87 at 146.81 will favor the latter case. In this bearish development, USD/JPY would decline further through 61.8% retracement at 144.30, and probably below towards 140.25 support.
China's Strategic Gold Accumulation Fuels Record Price Rally
Gold's rally to new record high last week is multifaceted. It can be attributed not just to the weakening Dollar and the anticipation surrounding major global central banks' impending rate cuts, but also to China as a pivotal player.
PBoC's continued expansion of its gold reserves for the sixteenth consecutive month in February underscores a broader strategy of reserve diversification and geopolitical hedging. With an additional 390k troy ounces added last month, China's central bank now boasts approximately 2257 tonnes of Gold, marking a significant stance in the face of persistent US and Western tensions.
Furthermore, China's domestic market has shown a marked increase in Gold demand, propelled by economic uncertainties. This surge is evidenced by Swiss exports to China, a reliable barometer of Chinese interest in gold, which saw a more than twofold increase in January from the previous month to 77.8 tonnes. Shipments to Hong Kong also saw a nearly sevenfold rise to 44.6 tonnes.
Technically, Gold's outlook will stay bullish as long as 2123.45 support holds. Next target is cluster projection level around 2260, 100% projection of 1810.26 to 2088.24 from 1984.05 at 2262.03 and 100% projection of 1614.60 to 2062.95 from 1810.26 at 2259.15.
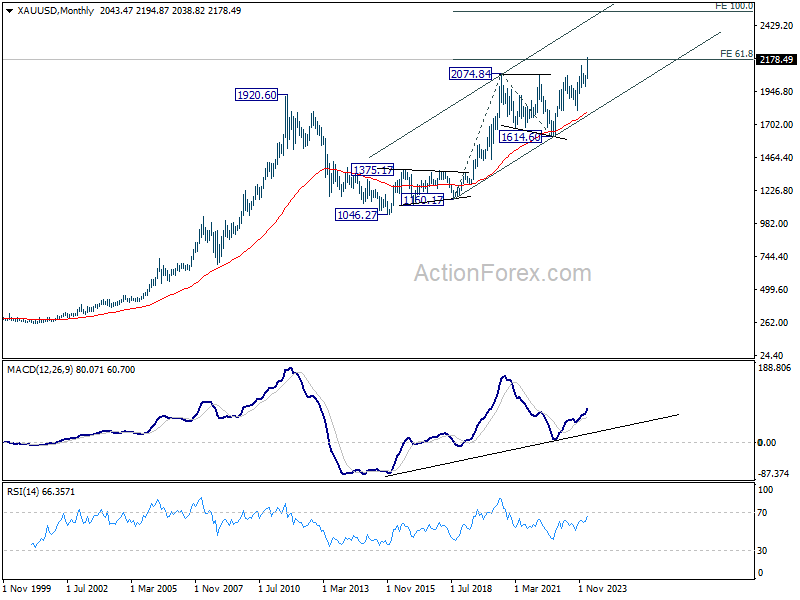
In the long term picture, rise from 1614.60 is currently seen as the fifth leg of the five wave uptrend from 1046.27 (2015 low). Sustained trading above 61.8% projection of 1160.17 to 2074.84 from 1614.60 at 2179.86 will pave the way to 100% projection at 2529.27 in the medium term.
GBP/USD Weekly Outlook
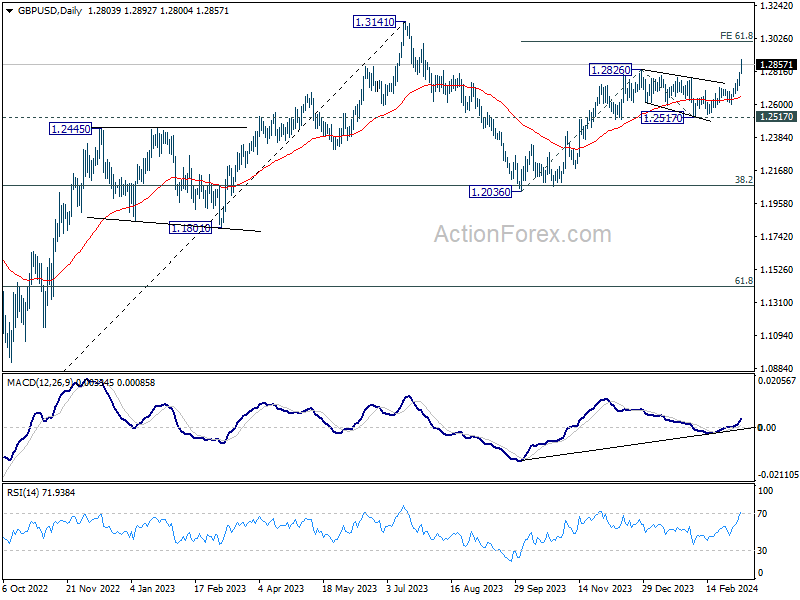
GBP/USD broke through 1.2826 resistance to resume the whole rally from 1.2063. Initial bias stays on the upside this week for 61.8% projection of 1.2036 to 1.2826 from 1.2517 at 1.3005. On the downside, below 1.2800 minor support will turn intraday bias neutral first. But further rise will remain in favor as long as 55 4H EMA (now at 1.2718) holds.
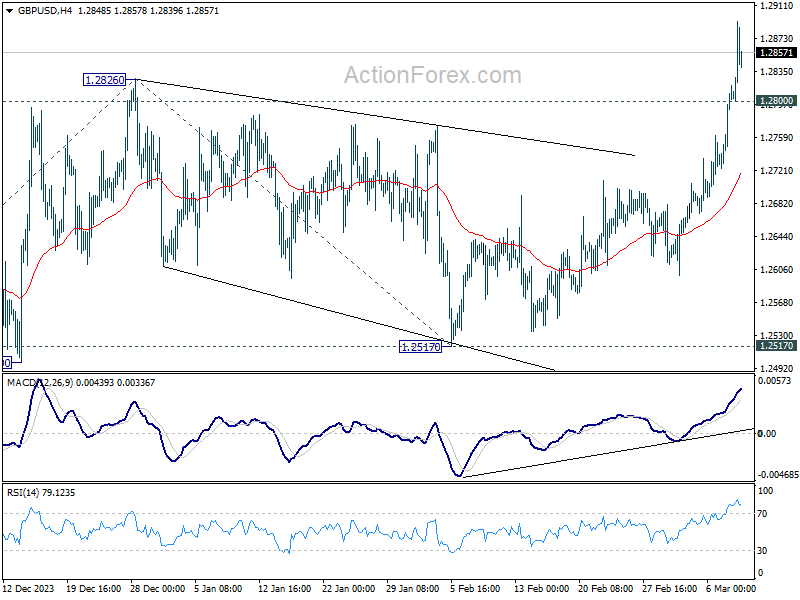
In the bigger picture, price actions from 1.3141 medium term top are seen as a corrective pattern to up trend from 1.0351 (2022 low). Rise from 1.2036 is seen as the second leg, which is still in progress. But upside should be limited by 1.3141 to bring the third leg of the pattern. Meanwhile, break of 1.2517 support will argue that the third leg has already started for 38.2% retracement of 1.0351 (2022 low) to 1.3141 at 1.2075 again.
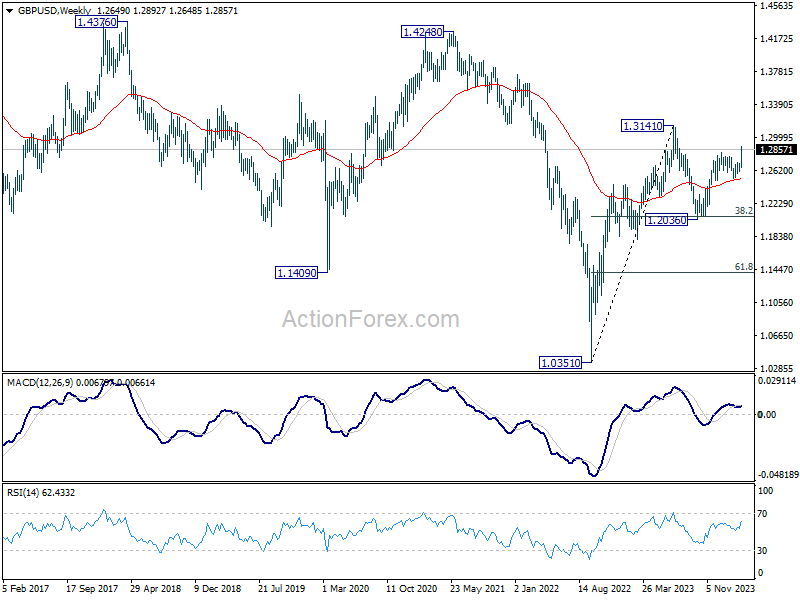
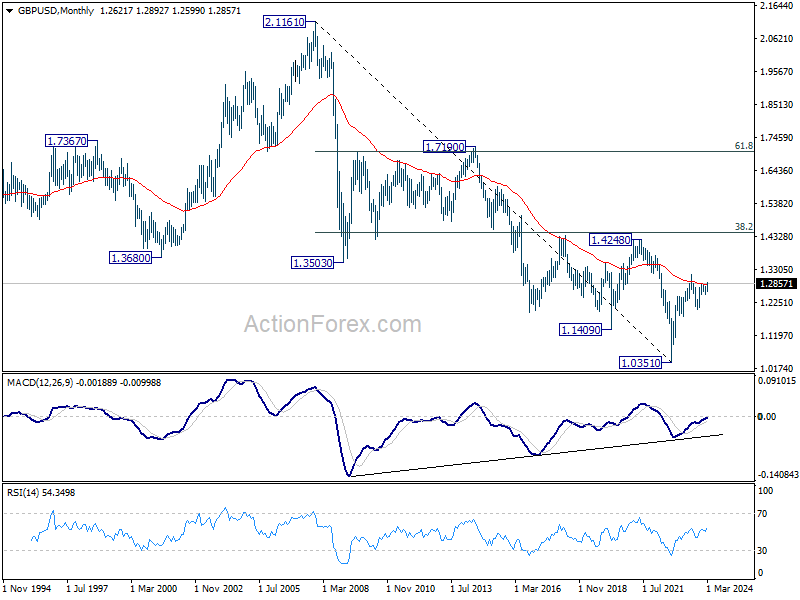
In the long term picture, a long term bottom should be in place at 1.0351 on bullish convergence condition in M MACD. But momentum of the rebound from 1.3051 argues GBP/USD is merely in consolidation, rather than trend reversal. Range trading is likely between 1.0351/4248 for some more time.
EUR/USD Weekly Outlook
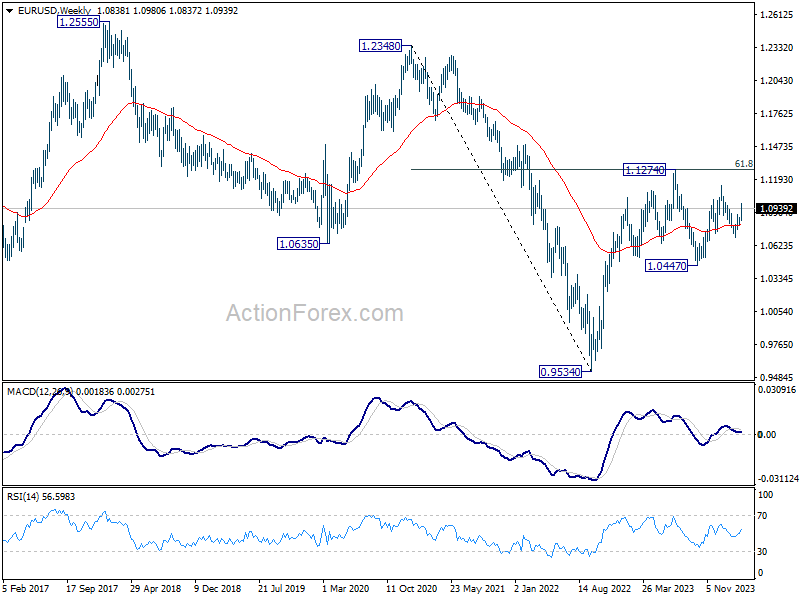
EUR/USD's rebound from 1.0694 extended to as high as 1.0980 last week. The development suggests that fall from 1.1138 has completed as a correction to rise from 1.0447. Initial bias stays on the upside this week for retesting 1.1138 first. On the downside, below 1.0867 minor support will turn intraday bias neutral and bring consolidations.
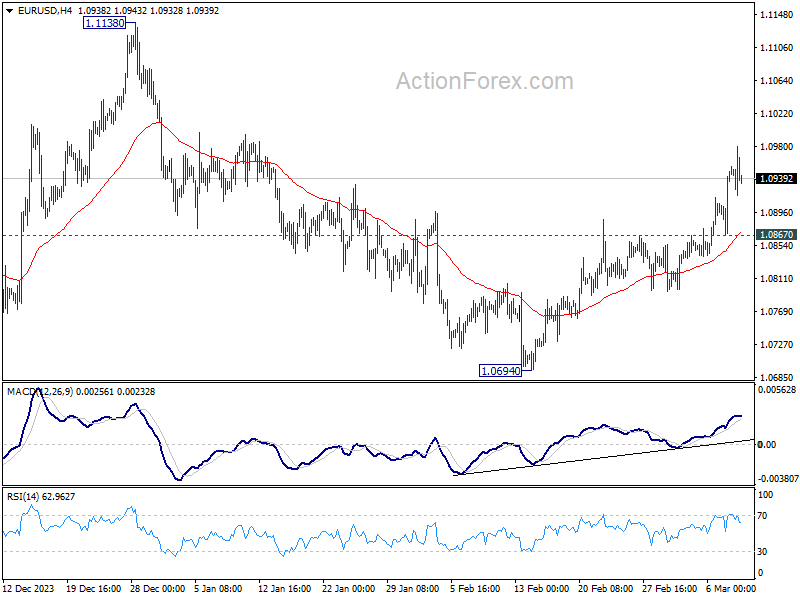
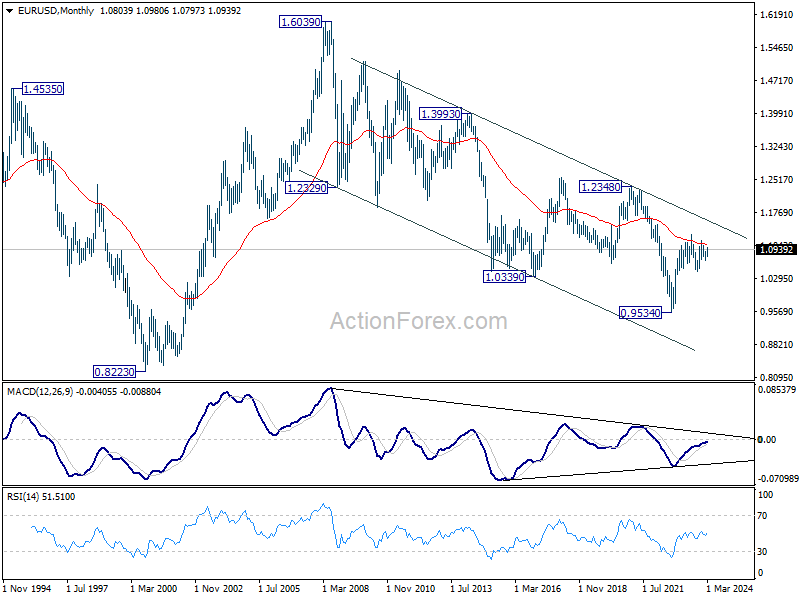
In the bigger picture, price actions from 1.1274 are viewed as a corrective pattern to rise from 0.9534 (2022 low). Rise from 1.0447 is seen as the second leg. While further rally could cannot be ruled out, upside should be limited by 1.1274 to bring the third leg of the pattern. Meanwhile, sustained break of 1.0694 support will argue that the third leg has already started for 1.0447 and possibly below.
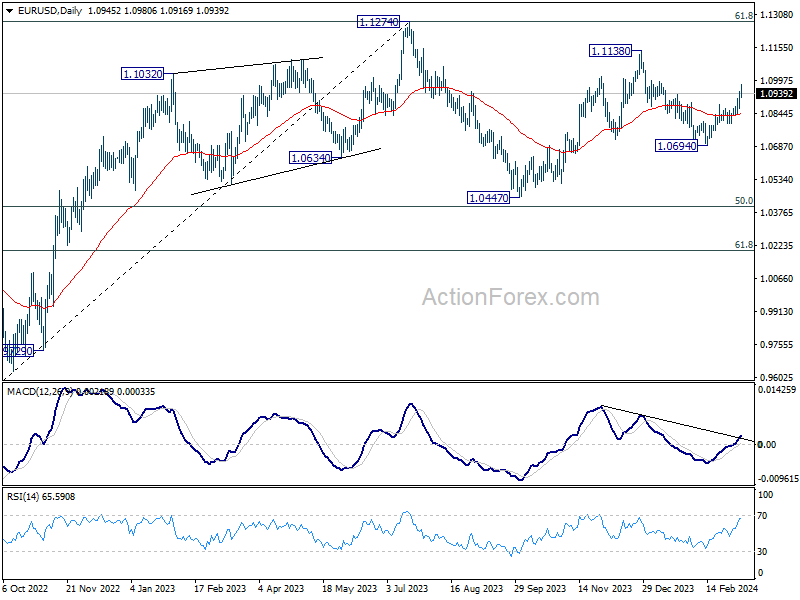
In the long term picture, a long term bottom is in place at 0.9534 on bullish convergence condition in M MACD. It's still early to call for bullish trend reversal with the pair staying inside falling channel in the monthly chart. Nevertheless, sustained trading above 55 M EMA (now at 1.1055) and break of 1.1274 resistance will raise the chance of reversal and target 1.2348 resistance for confirmation.