Sample Category Title
Crypto: Extreme greed is not a sell signal
Market picture
The cryptocurrency market is developing gains, rising 2.2% on the day to $2.17 trillion. These levels replicate the April 2022 peak.
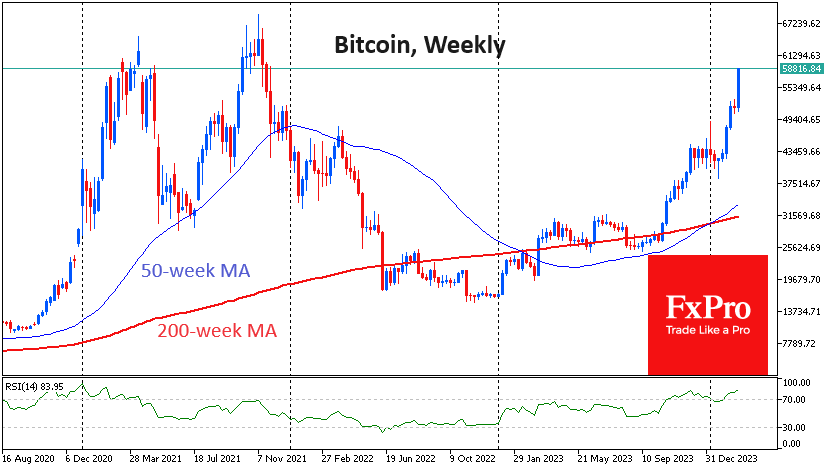
Bitcoin is now only 15% below its all-time high, while total capitalisation is 38% below its peak.
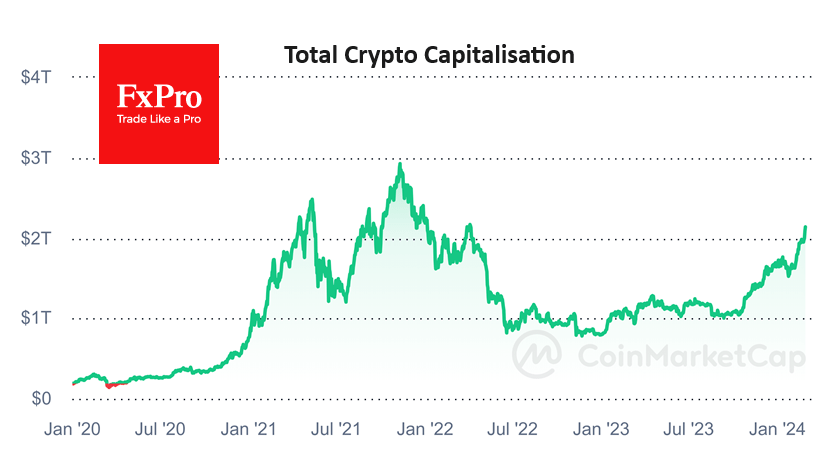
A further move higher would be a repeat of the early 2022 highs. The Cryptocurrency Fear and Greed Index rose to 82 by Wednesday – the highest since November 2021 – extreme greed. This time, the active rally came at the start of the European session, as Bitcoin moved to update the November 2021 highs, so it would not be surprising to see the index rise further.
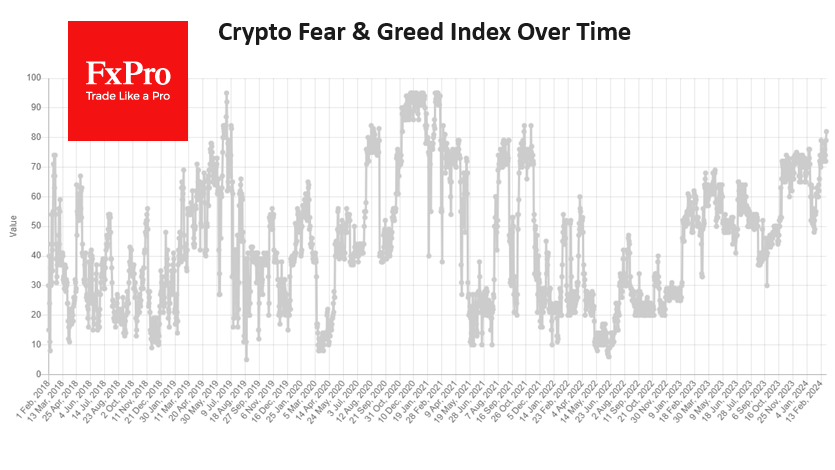
According to the indicator’s design, this state makes it look for a turning point for a correction. However, we believe that short-term corrections only fuel the greed of buyers. Looking at Bitcoin’s chart alone, the dynamics are like what we saw in the second half of 2020. The index was above 90 then, and getting out now, just since greed levels are at 82, could be a painful mistake.
Fundamentally, it is more logical to expect weak performance before a halving, but that is not the case, and investors must accept this reality with a false start to the market due to the influx of institutionalisation via comfortable spot ETFs. Demand is also being helped by strong risk appetite thanks to all-time highs in the major indices.
News background
The main reason for BTC’s growth is the trading volume of spot bitcoin ETFs (excluding GBTC), according to Metalpha. The index reached a record $2.4 billion at the beginning of the week, almost doubling the previous daily average.
Bloomberg does not rule out that bitcoin ETFs will overtake gold ETFs in terms of accumulated capital within the next two years.
BitMEX Research notes that outflows from GBTC slowed to $44 million, the lowest since 11 January. The structure has lost $7.5 billion in AUM since becoming an ETF.
Ethereum has taken the most significant share among cryptocurrencies in financial institutions’ investment portfolios due to the upcoming Dencun upgrade, Bybit noted. According to The Block, open interest in Ethereum options on the top 5 exchanges (excluding CME) reached an all-time high.
Despite the growing competition between blockchains, Grayscale Research believes the launch of the Dencun update will help Ethereum “mature” by reducing transaction fees and increasing the network’s scalability.
The value of assets locked in the Lido liquid-stacking protocol has reached $30.56 billion, according to The Block. Lido dominates the segment, controlling 32% of Ethereum’s total stakes.
Australian Dollar Weakens Amid Inflation News
According to data published today by the Australian Bureau of Statistics, the Consumer Price Index (CPI) value was: actual 3.4%, expected = 3.6%, a month ago = 3.4%, 2 months ago = 4.3%.
Data shows Australia's consumer price growth rate is slowing, approaching targets of around 2%. This means less pressure on the Reserve Bank of Australia, which is pursuing tight monetary policy to combat inflation. Thus, the prospect of lower interest rates makes the Australian dollar weaker relative to other currencies.
For example, the reaction to news about inflation in Australia, which was below expectations, was the fall in the price of AUD/USD.
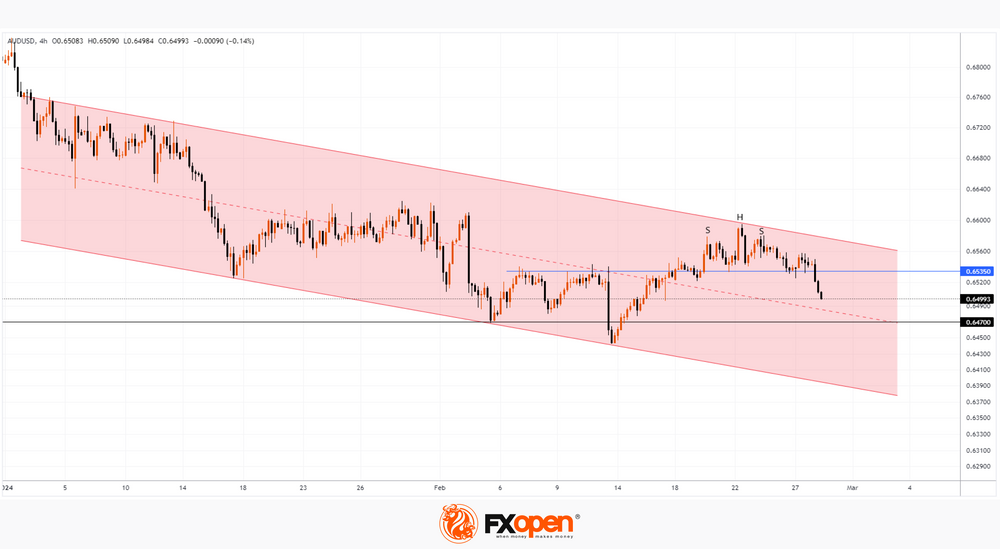
Technical analysis of the AUD/USD chart shows that:
→ the price of AUD/USD continues to develop in a downward channel (shown in red);
→ the price has broken through the important level 0.6535, which served as support since last week, but now, perhaps, will again begin to provide resistance, as it did in the first half of February;
→ in February, a bearish SHS pattern formed.
Bulls can be given hope by:
→ psychological level 0.6500;
→ median line of the red channel;
→ important support 0.647.
Please also note:
→ today at 16:30 GMT+3, US GDP data will be published;
→ tomorrow at 16:30 GMT+3, data on the US PCE inflation index will be published.
Both news have the potential to have a strong impact on the US dollar exchange rate and related markets. Be prepared for spikes in volatility.
Trade over 50 forex markets 24 hours a day with FXOpen. Take advantage of low commissions, deep liquidity, and spreads from 0.0 pips. Open your FXOpen account now or learn more about trading forex with FXOpen.
This article represents the opinion of the Companies operating under the FXOpen brand only. It is not to be construed as an offer, solicitation, or recommendation with respect to products and services provided by the Companies operating under the FXOpen brand, nor is it to be considered financial advice.
GBP/USD: Drops After Repeated Rejections at Daily Cloud Top
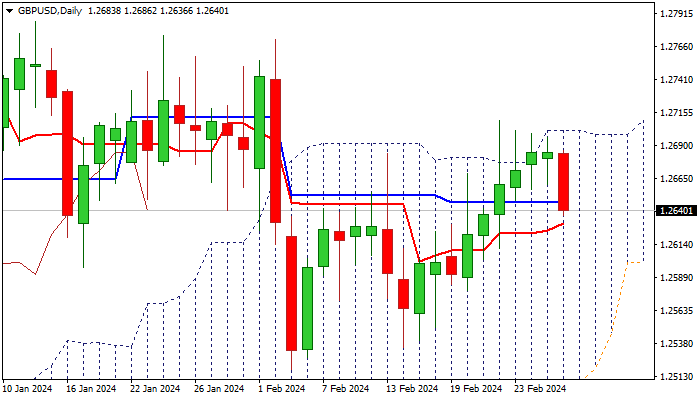
Cable dips 0.3% in Asian/early European trading on Wednesday after a multiple failures to clear the top of daily Ichimoku cloud.
Long upper shadows on daily candles and narrowing ranges in past few sessions, confirmed significance of cloud top barrier, while diverging RSI added to early signals that bulls were running out of steam and warned of pullback.
Fresh bears cracked Fibo support at 1.2643 (38.2% of 1.2535/1.2709 upleg, reinforced by 10DMA), loss of which to signal further weakness and expose targets at 1.2600 (Fibo 61.8%) and 1.2570 (200DMA).
Daily indicators are heading south, and 14-d momentum is approaching the centreline, with break into negative territory to further weaken near-term structure.
Res: 1.2668; 1.2686; 1.2709; 1.2772.
Sup: 1.2622; 1.2600; 1.2570; 1.2535.
USDJPY Consolidates Near 3-Month High
- USDJPY stuck in a tight range in the past few sessions
- The pair is within breathing distance from 2023 peak
- Momentum indicators soften but remain positive
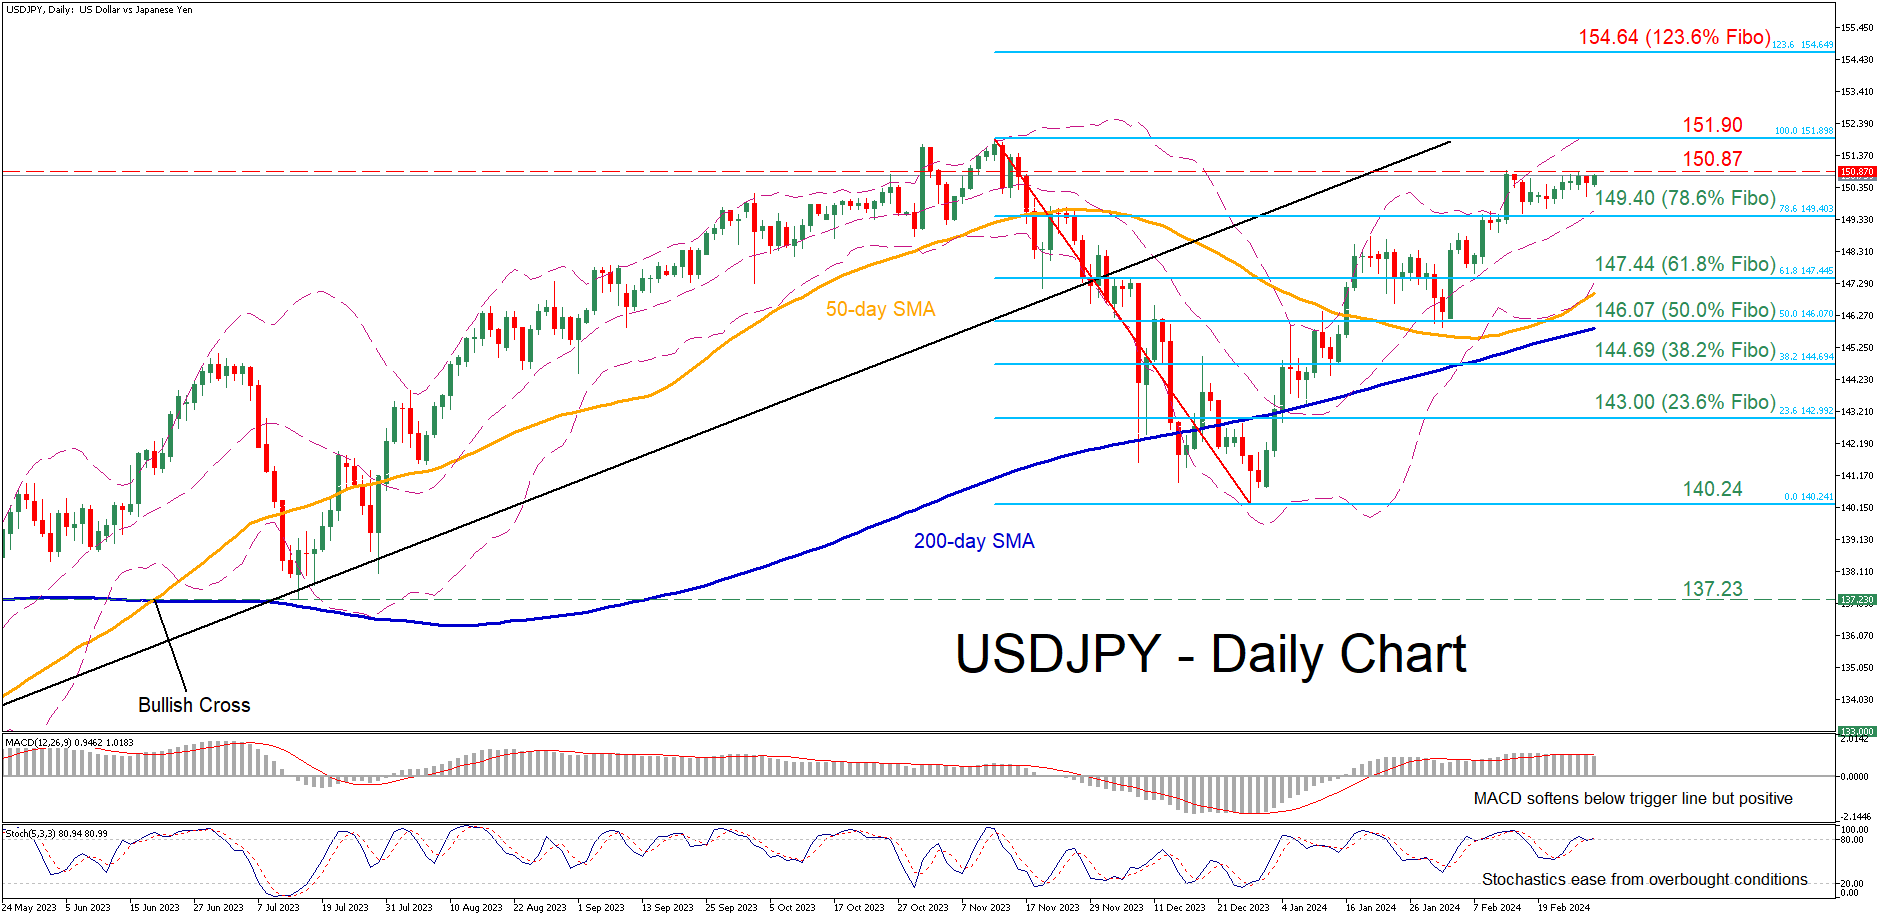
USDJPY has been in a steady uptrend since late 2023, forming a V-shaped recovery from its November-December rout. Moreover, in the past few sessions, the pair has been trading sideways near its 2024 peak of 150.87, a tad below its 33-year high of 151.94 registered in October 2022.
Should bullish pressures persist, the price might revisit its recent three-month peak of 150.87. Conquering this barricade, the bulls could attack the 2023 high of 151.90, which lies marginally below the 33-year peak of 151.94. Further advances could then cease at 154.64, which is the 123.6% Fibonacci extension of the 151.90-140.24 downleg.
On the flipside, bearish actions may send the price lower to test the 78.6% Fibo of 148.40. A violation of that territory could pave the way for the 61.8% Fibo of 147.44. Failing to halt there, the pair could descend towards the 50.0% Fibo of 146.06, which provided support in early February.
Overall, USDJPY has been trading sideways near its 2024 peak amid weakening positive momentum. Should the pair claim this barrier, there is no prominent resistance before the 33-year peak of 151.94.
NZDUSD Drops Aggressively, Prepares to Test a Key Area
- NZDUSD is lower today after the RBNZ's decision to keep rates unchanged
- It trades a tad above a very busy support area
- Momentum indicators are possibly preparing to send bearish signals
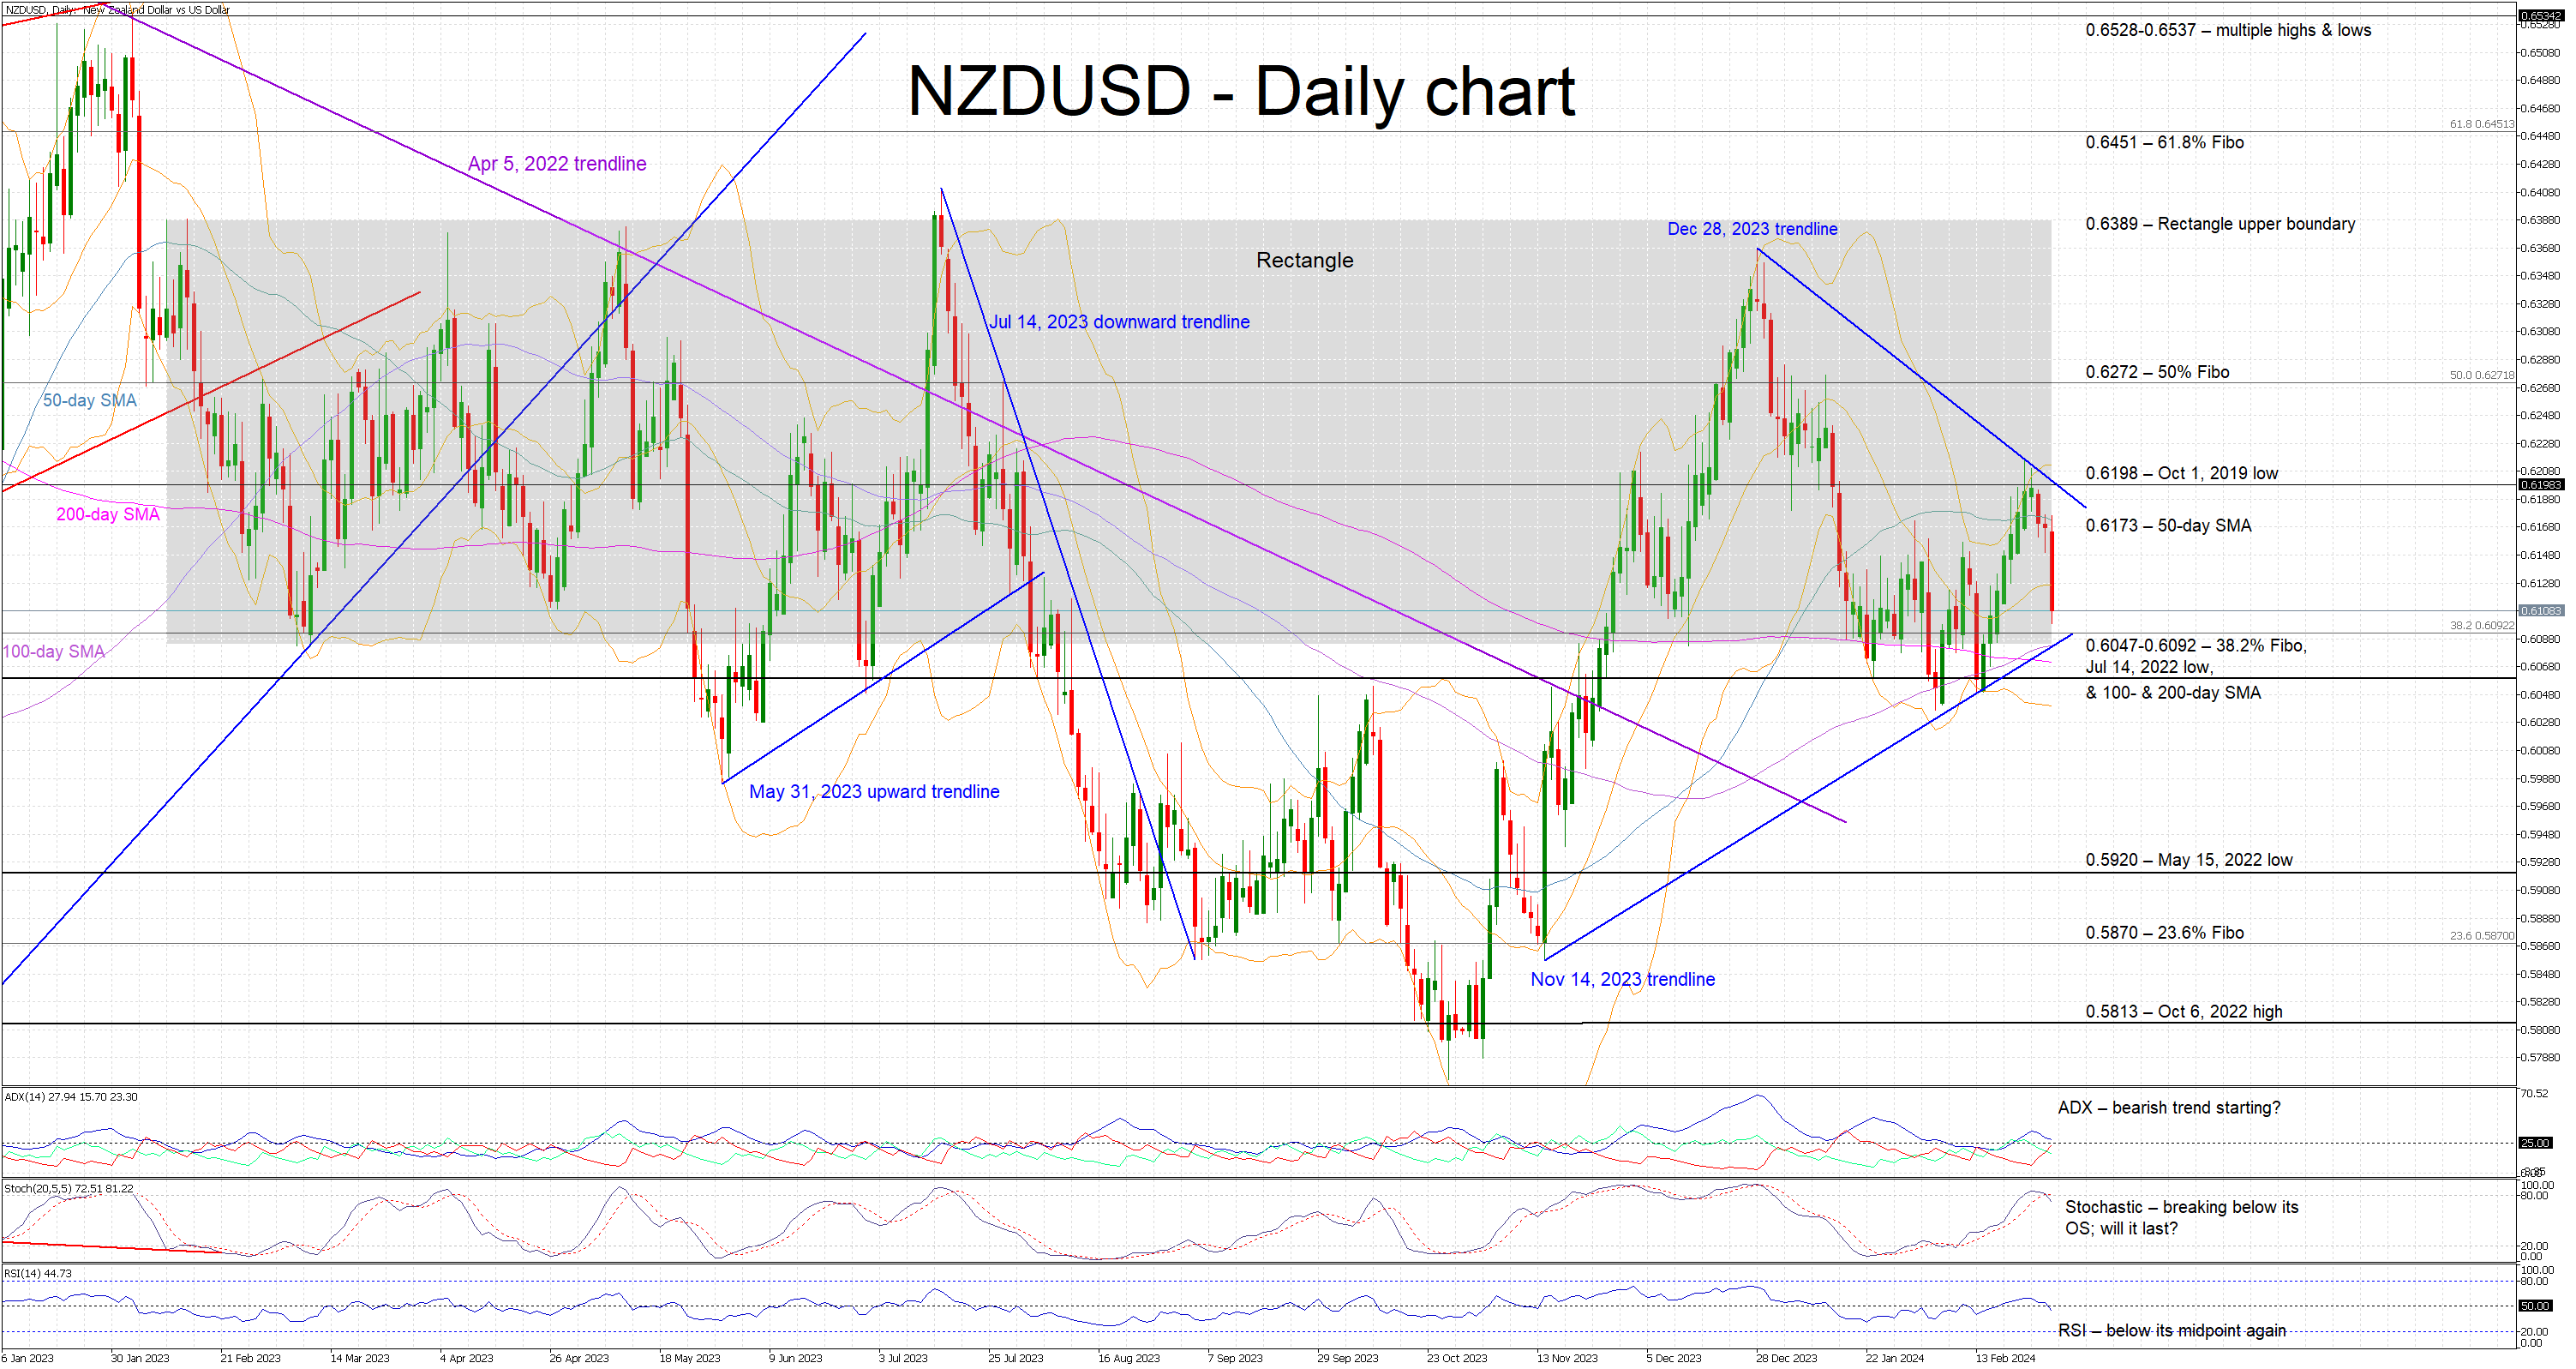
NZDUSD is recording its third consecutive red candle, crashing lower after the RBNZ’s decision disappointed certain market analysts expecting a rate hike earlier today. NZDUSD is currently trading a tad above the busy 0.6047-0.6092 area and the lower boundary of the 1-year-old rectangle, but still far from the 2024 low of 0.6037.
In the meantime, the momentum indicators are gradually turning bearish. More specifically, the RSI has dropped below its 50-midpoint and it is thus pointing to increasing bearish pressure. Similarly, the Average Directional Movement Index (ADX) is hovering above its 25-threshold with its DI- subcomponent edging aggressively higher. More importantly, the stochastic oscillator has broken below both its overbought territory and simple moving average. Should this move pick up pace, it would be regarded as a strong bearish signal.
If the bulls decide to retake the market reins, they could try to lead NZDUSD higher towards the 50-day simple moving average (SMA) at 0.6173. The October 1, 2019 low at 0.6198 is a tad higher with the next target possibly expected at the 50% Fibonacci retracement of the April 5, 2022 – October 13, 2022 downtrend at 0.6272.
On the flip side, the bears appear willing to take advantage of the current momentum and finally break below the 0.6047-0.6092 area, which is populated by the 38.2% Fibonacci retracement, the July 14, 2022 low, the 100- and 200-day SMAs and the November 14, 2023 ascending trendline. If successful, the path then appears to be clear until the May 15, 2022 low at 0.5920.
To sum up, the bears are enjoying the RBNZ-induced correction in NZDUSD, but their focus is now mostly on the momentum indicators signaling a more protracted downleg.
Gold Price and Crude Oil Price Eye More Upsides
Gold price started a decent increase above the $2,028 resistance level. Crude oil prices are gaining bullish momentum and might rise toward $80.00.
Important Takeaways for Gold and Oil Prices Analysis Today
- Gold price started a decent increase from the $2,015 zone against the US Dollar.
- A key contracting triangle is forming with support near $2,028 on the hourly chart of gold at FXOpen.
- Crude oil prices rallied above the $76.55 and $77.00 resistance levels.
- There is a key bullish trend line forming with support at $77.80 on the hourly chart of XTI/USD at FXOpen.
Gold Price Technical Analysis
On the hourly chart of Gold at FXOpen, the price found support near the $2,015 zone. The price formed a base and started a fresh increase above the $2,020 level.
There was a decent move above the 50-hour simple moving average and $2,028. The bulls pushed the price above the $2,035 resistance zone. Finally, the bears appeared near $2,040, A high was formed near $2,039.44 and the price is now consolidating gains.
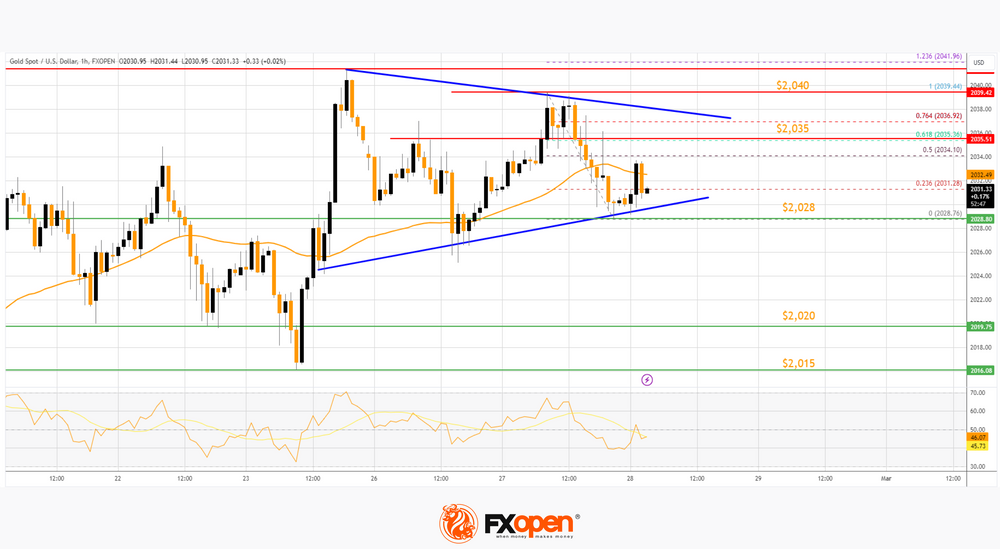
The recent low was formed at $2,028 and the price is now consolidating near the 23.6% Fib retracement level of the downward move from the $2,039 swing high to the $2,028 low.
The RSI is still stable near 40 and the price could aim for more gains. Immediate resistance is near the $2,035 level. It is close to the 61.8% Fib retracement level of the downward move from the $2,039 swing high to the $2,028 low.
The next major resistance is near the $2,040 level. An upside break above the $2,040 resistance could send Gold price toward $2,050. Any more gains may perhaps set the pace for an increase toward the $2,065 level.
Initial support on the downside is near the $2,028 zone. There is also a key contracting triangle forming with support near $2,028. If there is a downside break below the $2,028 support, the price might decline further. In the stated case, the price might drop toward the $2,015 support.
Oil Price Technical Analysis
On the hourly chart of WTI Crude Oil at FXOpen, the price started a major rally against the US Dollar. The price gained bullish momentum after it broke the $77.00 resistance.
There was a sustained upward move above the $77.80 and $78.00 resistance levels. The bulls pushed the price toward $79.00. The current price action is positive above the 50-hour simple moving average and RSI is stable above 50.
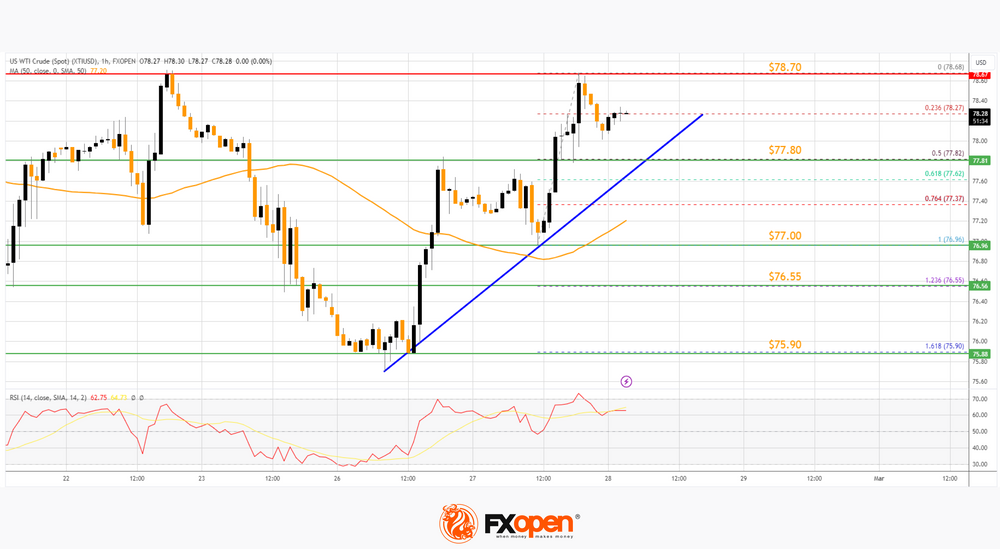
Recently, there was a minor decline from the $78.38 high. The price tested the $76.00 support. There was a move below the 23.6% Fib retracement level of the upward move from the $76.96 swing low to the $78.68 high.
If the price climbs higher again, it could face resistance near $78.70. The next major resistance is near the $79.00 level. Any more gains might send the price toward the $80.00 level.
Conversely, the price might correct gains below the $78.20 zone. The next major support on the WTI crude oil chart is near the $77.80 zone and the 50% Fib retracement level of the upward move from the $76.96 swing low to the $78.68 high. There is also a key bullish trend line forming with support at $77.80.
If there is a downside break, the price might decline toward $77.00. Any more losses may perhaps open the doors for a move toward the $75.90 support zone.
Start trading commodity CFDs with tight spreads. Open your trading account now or learn more about trading commodity CFDs with FXOpen.
This article represents the opinion of the Companies operating under the FXOpen brand only. It is not to be construed as an offer, solicitation, or recommendation with respect to products and services provided by the Companies operating under the FXOpen brand, nor is it to be considered financial advice.
USD Takes Lead During Mild Risk-off
Markets
A batch of US data turned out mixed yesterday. Strong core capital good shipments (investment proxy) compensated for negatively distorted durable goods orders (Boeing). House prices rose in line with forecasts but consumer confidence unexpectedly retreated on a deteriorating current and six month ahead assessment on the economy and jobs. Second tier business sentiment indicators were unable to settle the debate either, especially with a more important one (manufacturing ISM) scheduled later for release on Friday. US yields whipsawed with net daily changes of -2.6 bps (2-y) to +3.2 bps (30-y) eventually. The $42bn 7-y auction went smoother than Monday’s 5-y but didn’t leave a stamp. German Bunds underperformed. They erased intraday gains to push yields 0.4 to 3.3 bps higher to make the curve slightly less inverse. Equities along with major FX didn’t choose a strong direction. The EuroStoxx50 hit new multiyear highs but Wall Street finished mixed. EUR/USD ended the day slightly weaker at 1.0844, DXY an inch higher. Above-consensus Japanese CPI helped JPY close to nothing. USD/JPY (150.51) closed well above the daily lows.
Drowned Under. The central bank of New Zealand softened its previous threat to lift rates even further (see below), turning the kiwi dollar into this morning’s biggest underperformer. The Aussie dollar trades on the backfoot as well following (incomplete) monthly CPI figures (January 3.4% vs 3.6% expected). USD takes a lead during mild risk-off. US cash yields ease less than 2 bps and German yields are ready for a lower open as well. Belgium kicks off the CPI bonanza today, be it with a national calculation (instead of the harmonized one). Most of the EU member states (harmonized) CPI readings are due tomorrow (ahead of the euro area figure on Friday), however. In absence of other market-impacting data, it means we may be looking at a quiet trading session with moves being mainly technically inspired. Fed’s Williams (New York), Collins (Boston) and Bostic (Atlanta) hit the wires today. We expect them to repeat Waller’s “what’s the rush” (for cutting rates) in some form or another. The power of repetition brought US money markets more or less in line with the December dot plot (three cuts this year) meanwhile. Core bond yields in any case enjoy a solid floor beneath them. The dollar’s recent correction looks ready for a reversal. Spillovers from Asian equity markets to Europe could help the greenback in the process.
News & Views
The Reserve Bank of New Zealand (RBNZ) kept its policy rate unchanged at 5.5% this morning. Interest rates need to remain at a restrictive level for a sustained period of time. Annual headline CPI is expected to return to the 1%-3% target band by Q4 this year and to the 2%-midpoint later in 2025. Risks to the inflation outlook are more balanced than at the time of the November meeting/update. Restrictive monetary policy and lower global growth have contributed to aggregate demand slowing to better match the supply capacity of the NZ economy. High population growth (immigration) still supports aggregate spending and also helps easing capacity constraints in the labour market. Updated forecasts show policy rates (at least) level until Q1 2025 with the probability of an additional hike being slightly lower (5.6% policy rate peak compared to 5.7% in November). OCR projections otherwise barely changed (unaltered 4.9% in Q4 2025; 3.5% from 3.6% in Q4 2026). Annual inflation is expected at 3.8% for the March FY (from 4.3%), 2.6% for FY 2025 (from 2.4%) and 2% for FY 2026 (unchanged). The new growth path is 0.3%-1.2%-2.8% from 1.2%-1.4%-2.8%. NZD swap rates plunge 16 bps (30-yr) to 23 bps (2-yr) this morning as markets now rule out an additional rate hike. The kiwi dollar drops from NZD/USD 0.6170 to 0.6110.
Bank of England deputy governor Ramsden, who oversees financial markets, said that the UK central bank may continue running down its QE portfolio even after hitting the “preferred minimum range of reserves” which it estimates in the range of £335bn to £495bn. The BoE’s asset portfolio declined from a £895bn peak to currently £735bn with Ramsden suggesting that the BoE can wind it down completely should it be necessary. This view contrasts with for example the Fed which wants to maintain a structural bond portfolio to back an ample level of reserves.
RBNZ Holds Rates Steady
In focus today
In Sweden we get PPI and trade balance data for January at 08:00 CET. We see no indications now that development will stop or that the export sector would cease to be the driving force for the Swedish economy. At 09:00 CET we get the NIER's Economic Tendency Survey for February. The focus is on price plans, where especially the service price plans are still too high.
Economic and market news
What happened over night
In New Zealand, the Reserve Bank of New Zealand (RBNZ) held monetary policy unchanged overnight, as expected. In contrast to other G10 central banks eyeing the start of their respective rate cutting cycles, markets have speculated in an additional rate hike from the RBNZ, but the tone of today's announcement was clearly to the dovish side, suggesting that the current level of policy rate is seen as sufficiently restrictive. We expect NZD/USD to decline further over the coming year, with 12M target at 0.57.
In Australia, inflation was held at a two-year low in January despite markets expecting inflation to increase. This will probably increase the probability that we have seen the last interest rate hike from the Reserve Bank of Australia. Markets reacted by sending AUD/USD lower upon the release.
In the US, Donald Trump took another victory in the primary election of Michigan. At the deadline for this publication Donald Trump won 68% of the counted votes against 26% for his only remaining competitor Nikki Haley. Next Tuesday, 5 March, is the so-called Super Tuesday when primary elections will be held in fourteen states and one caucus in one day. This can be decisive for Haley if she wants to stay in the race.
What happened yesterday
French president Emmanuel Macron said Monday that he is ready to do everything so that Russia does not win the war in Ukraine and that he would not rule out sending western troops to Ukraine if that is what it takes. Yesterday representatives from Russia warned that war with NATO would be the consequence if the alliance sends troops to Ukraine. Later leading politicians from Germany, the UK and eastern Europe denied that western troops would set feet in Ukraine.
The euro area monetary aggregates and lending data did not change the ECB outlook or give rise to immediate correction for ECB narrative. M3 grew 0.1% y/y in January. M1 continues to decline by 8.6% y/y. Loans to households grew 0.3% y/y in January. Loans to non-financial corporations grew 0.2% in January. All are broadly in line with data from December. The credit to the private sector is still relatively weak and the risk in net external assets (i.e. foreigners) is compensating for the significant negative continuation from the LTROs and QT.
In Sweden, Riksbank governor Erik Thedéen said that inflation continues to move in the right direction, and he did not rule out the possibility of a cut in the policy rate in the first half of this year. However, he also expressed that the outlook for inflation should remain favourable for this to happen. He also expressed that Riksbank can cut before ECB amid benign wage hikes. This was very much in line with his previous comments, but still very relevant, as it keeps all doors open ahead.
The Financial market statistics for January showed that household lending decreased for the third month in a row, which means it happened for the first time this since the 90s. Also, fixed interest rates on new agreements for mortgages continues to decrease for the second month in a row since the rates peaked in December.
In Hungary, the central bank lowered interest rates by 100bps from 10.0% to 9.0% in line with market expectations. Therefore the central bank accelerates the pace of the rate cuts from last meeting where they lowered interest rates by 75bps. The rate cut came after Hungary's annual inflation has fallen to 3.8% in January, which is within the central bank's tolerance band. The policy rate peaked last year at 13.0%.
Oil prices trade close to the highs this year - Brent climbed back above USD83/bbl this week. In our view, the positive sentiment owes to the combination of OPEC+ mulling an extension of output cuts, rising global economic growth expectations and slightly weaker USD. We do not foresee a prolonged rally in oil prices. Rather, we stick to our view that Brent will average around USD80/bbl.
Equities: Global equities were higher yesterday with firmer investor sentiment. A mixed bag of macro data still led to cyclical outperformance, lower vol and most noteworthy, sizable outperformance from small caps. The equities markets are still in a cyclical tech led rally, but we are looking for the leadership to broaden and not least lifting the small caps further. In US yesterday, Dow -0.3%, S&P 500 +0.2%, Nasdaq +0.4% and Russell 2000 +1.3%. Asian markets are mostly lower this morning with South Korea going against the trend. Both US and European futures are in red this morning.
FI: European rates sold off from the long end, amid significant long-end supply. Subdued lending growth data from the euro area and weakish French consumer confidence sent yields lower from the morning, yet rates traded higher through the day as long-end supply was digested from Netherlands (2044 bond), Germany (2050 bond) and not least the EUR7.5bn 30y supply from France.
FX: Yesterday was another quiet session in the FX space without any major moves. The JPY continued to benefit from the higher-than-expected Japan January CPI print, which increased market pricing of a spring BoJ rate hike. Meanwhile, Scandies traded on the back foot, and EUR/USD remains stable in the mid 1.08-1.09 range. EUR/GBP has been in for a whirlwind during the past of couple of weeks, currently trading back above the 0.85 mark. Oil prices trade close to the highs this year - brent climbed back above USD83/bbl this week.
Apple Scraps EV, Joins AI Race
Apple abandoned its ambition to build an electric car. Yes, Apple car, which is in the making since the past decade, will never see the daylight. The company abandoned one of its biggest projects of the past decade in a surprise decision yesterday and said that the 2000 people working on it concentrate on the generative AI division instead. That’s exactly what Meta did last year; it decided to become more discrete on its metaverse development and go full blast into AI to increase its business value. This is what Apple is doing today. Having understood that missing the AI turn would be a severe hit to the company, they are getting – a bit later than the others – into the AI race. Better late than never.
Apple has been struggling to extend gains since last December. The latest earnings season hasn’t been a walk in the park given the difficult business in China. And while Apple’s tech peers saw their stock prices rise from the record to record, Apple’s only achievement – I am talking about stock price huh? – has been to keep its head above $180 per share. So yes, doubling down on AI is certainly a good decision, Apple rose 0.81% yesterday.
Elsewhere, Microsoft cut a deal with the European Mistral AI, and Alibaba led the largest single day financing round for a Chinese AI startup called Moonshot AI, hoping that it could help them smooth out supply chains and lead to more efficient automation. All this to say that the AI topic is here to stay. The more companies move toward AI developments, the more Nvidia investors see dollars in their eyes. Nvidia didn’t gain yesterday – not a usual day for the chip giant, but the developments confirm that investments pour in.
On the macro front
The S&P 500 had a slow session yesterday, as the US yields were little changed on the back of mixed economic data, the rising suspense regarding whether the US will default on March 1 and a 7-year US government bond auction that settled above 4.30%. The durable goods orders tanked more than 6% in January, the most in nearly 4 years. Richmond manufacturing index came in better-than-expected, except for shipments, while Atlanta Fed’s GDPNow index was revised up to 3.2% for this quarter from 2.9% printed earlier.
Today, the US will reveal its latest GDP numbers. The US economy is expected to have grown 3.3% in Q4. That’s lower than the 5% printed in the Q3, but it’s still a very strong growth for an economy that underwent the most aggressive tightening cycle of its modern history. And if Atlanta’s GDP prediction is an indication, the slowdown will slow in the first quarter of this year.
Robust growth is good, if it’s not accompanied by stronger inflation. Is it possible? Yes, it is possible, if supply grows faster than demand, but I think that’s not necessarily the case for the US right now. Demand remains strong despite the latest weakness in consumer spending and durable goods orders. And core PCE – which will be released tomorrow – is expected to print the biggest jump in a year on a monthly basis. Therefore, good news (on GPD data) has the potential to be bad news for market sentiment, provided that strong growth and higher inflation would push the Federal Reserve (Fed) rate cut expectations further down the road. Pricing today suggests that the market expects a 75bp cut from the Fed this year – matching what the Fed members plotted on their latest dot plot in December. The probability of a June rate cut slipped just below 60% yesterday. A U-turn in inflation won’t only delay the first rate cut but likely slow the pace of the future cuts as well. That’s not good news for risk appetite.
But hey, don’t ring the alarm bell yet. G20 chiefs said that soft landing is possible, as the post-pandemic inflation is gently fading. If there is no major surprise on the inflation front, the central banks should go ahead with their rate cut plans and avoid a recession. If not, high inflation would call for an extended period of high interest rates which could eventually push the world economy into recession. It’s all on inflation’s shoulder.
Good news: inflation in Japan fell to a 22-month low and inflation in British stores slowed to the lowest level since March 2022 thanks to easing supply-chain pressures, falling input costs for energy and fertilizers and a forceful competition between the British retailers.
In the FX, the US dollar index is stuck between its 100 and 200-DMA and should find a clear direction after tomorrow’s inflation print. US crude continues to test the $79pb offers to the upside. Inflation in Australia came in lower than expected, keeping the Reserve Bank of Australia (RBA) hawks away from the marketplace, and the Reserve Bank of New Zealand (RBNZ) kept its rate unchanged for the 5th straight meeting and said that risks to inflation became more balanced. The Kiwi-dollar fell to 0.61 as the latest RBNZ decision came as a disappointment to hawks who were betting that the RBNZ would hike rates at today’s meeting.
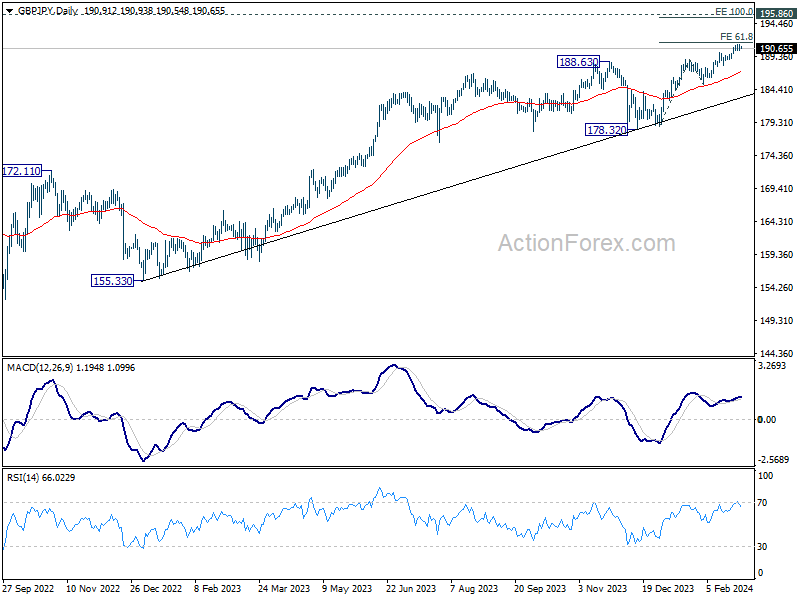
GBP/JPY Daily Outlook
Daily Pivots: (S1) 190.50; (P) 190.84; (R1) 191.31; More....
Intraday bias in GBP/JPY is turned neutral again with current retreat. On the upside, decisive break of 61.8% projection of 178.71 to 188.90 from 185.21 at 191.50 will extend larger up trend to 100% projection at 195.40. On the downside, however, break of 190.32 minor support will turn bias back to the downside for deeper pullback.
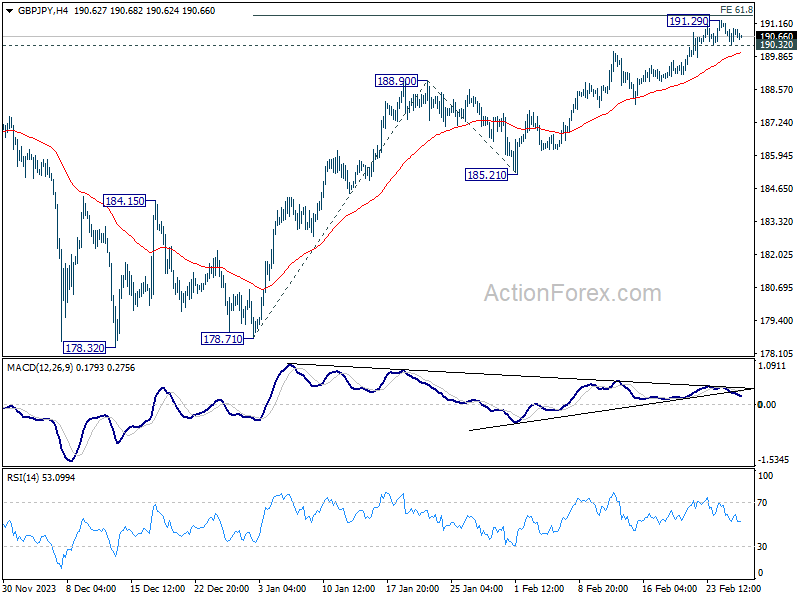
In the bigger picture, up trend from 123.94 (2020 low) is in progress. Medium term outlook will stay bullish as long as 178.32 support holds. Next target is 195.86 long term resistance (2015 high).