
Sample Category Title
Kiwi Dives after RBNZ Hold, Dollar Staging a Comeback
New Zealand Dollar fell significantly in today's Asian session, establishing itself as the day's most underperforming currency at this point. The decline was sparked by RBNZ's decision to maintain interest rate at 5.50%, a move that dashed the hopes of a small segment of the market that had anticipated a rate hike.
Momentum of the selloff gained further strength following comments from RBNZ Governor Adrian Orr during the post-meeting press conference. Orr pointed out that a rate hike was discussed, the committee reached a "strong consensus" on the current level of interest rates being sufficiently restrictive. This stance was bolstered by more optimistic economic data observed since November, which gave the committee additional confidence in the economic and inflation outlook.
Amidst these developments, Australian Dollar also found itself on a pressured, emerging as the session's second weakest, following lower than expected monthly CPI readings. Conversely, Dollar is having a notable rebound, leading the pack in terms of performance, tailed by Japanese Yen and Canadian Dollar. European majors are mixed, with Swiss Franc trading on the weaker side.
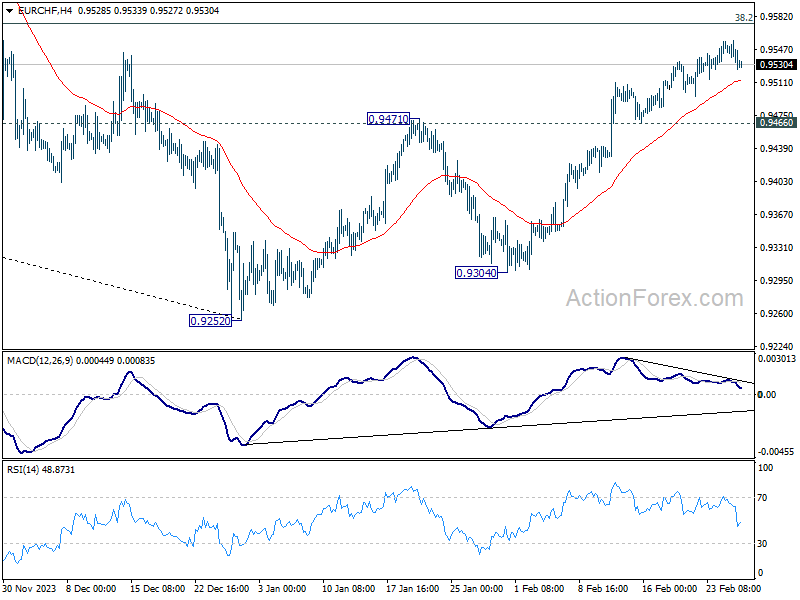
Technically, EUR/CHF continued to lose upside momentum as seen in bearish divergence condition in 4H MACD. Considering that it's reasonably close to 38.2% retracement of 1.0095 to 0.9252 at 0.9574, strong break of 55 4H EMA (now at 0.9513) will raise the chance of short term topping. Further break of 0.9466 will argue that rise from 0.9252 has completed as a three-wave corrective move, and turn outlook bearish for this support.
In Asia, at the time of writing, Nikkei is down -0.02%. Hong Kong HSI is down -0.62%. China Shanghai SSE is down -0.38%. Singapore Strait Times is down -0.28%. Japan 10-year JGB yield is up 0.003 at 0.698. Overnight, DOW fell -0.25%. S&P 500 rose 0.17%. NASDAQ rose 0.37%. 10-year yield rose 0.016 to 4.315.
RBNZ keeps OCR at 5.50%, door still open for another hike
RBNZ decided to hold Official Cash Rate unchanged at 5.50%. The central bank expressed its confidence that the current OCR level is effectively restraining demand. However, it underscored the need for a "sustained decline in capacity pressures" to ensure that inflation re-aligns with 1 to 3% target range. This necessitates maintaining OCR "at a restrictive level for a sustained period of time".
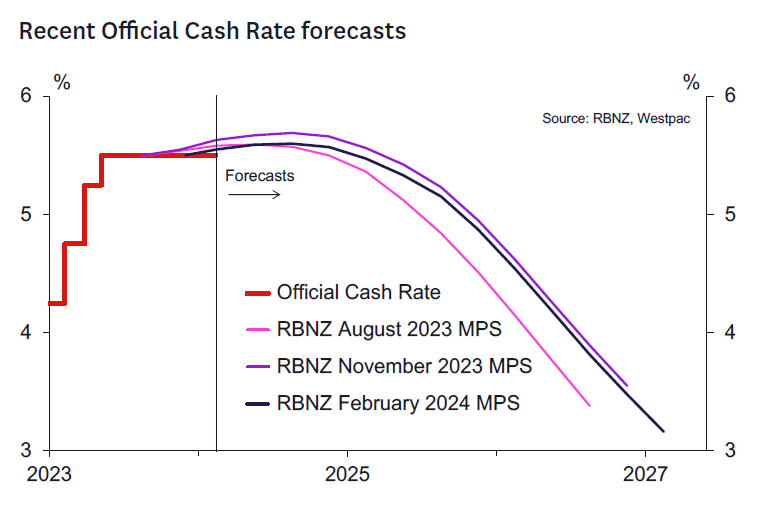
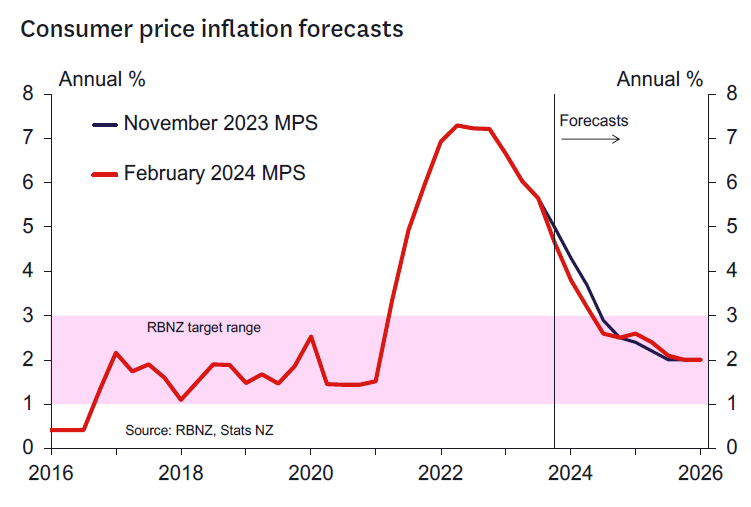
The updated economic forecasts in the MPS projects that CPI inflation will return to the target band by Q3 this year, then falls further to 2% midpoint by Q4 2025. These projections indicate a "slightly lower" inflation rate over the forecast period compared to previous estimates made in November.
Regarding future movements, the central bank anticipates OCR path to echo the trajectory outlined in the November MPS. It suggests OCR could peak at 5.6% in Q2 this year, leaving room for a marginal possibility of another rate hike.
Absent further increases, interest rate reductions are expected to commence in the Q2 2025, with OCR gradually decreasing to 3.2% by Q1 of 2027.
NZD/USD dives after RBNZ, heading back to 0.6
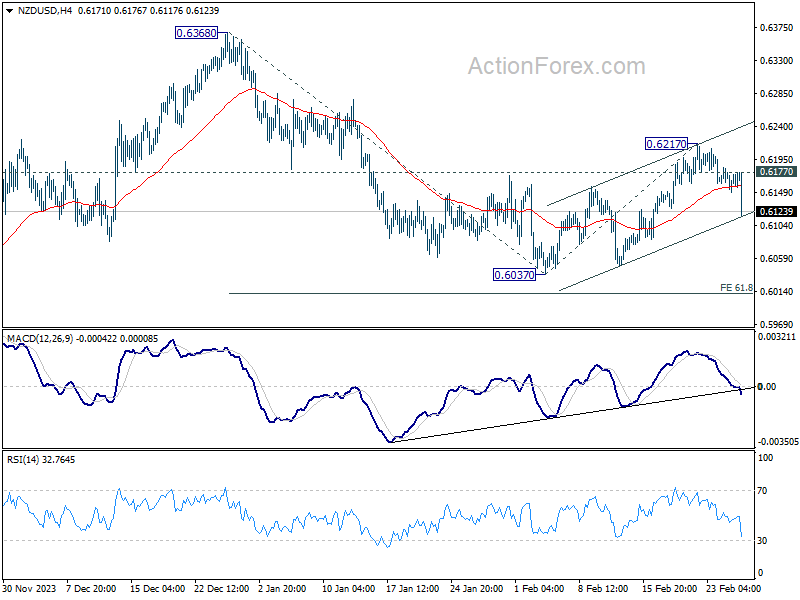
NZD/USD's fall from 0.6217 accelerates after RBNZ left OCR unchanged. Current development affirms the case that corrective recovery from 0.6037 has completed at 0.6217 already. Further decline is in favor as long as 0.6177 minor resistance holds. Firm break of near term channel support will bring retest of 0.6037 will argue that decline from 0.6368 is ready to resume through 0.6037 to 61.8% projection of 0.6368 to 0.6037 from 0.6217 at 0.6012.
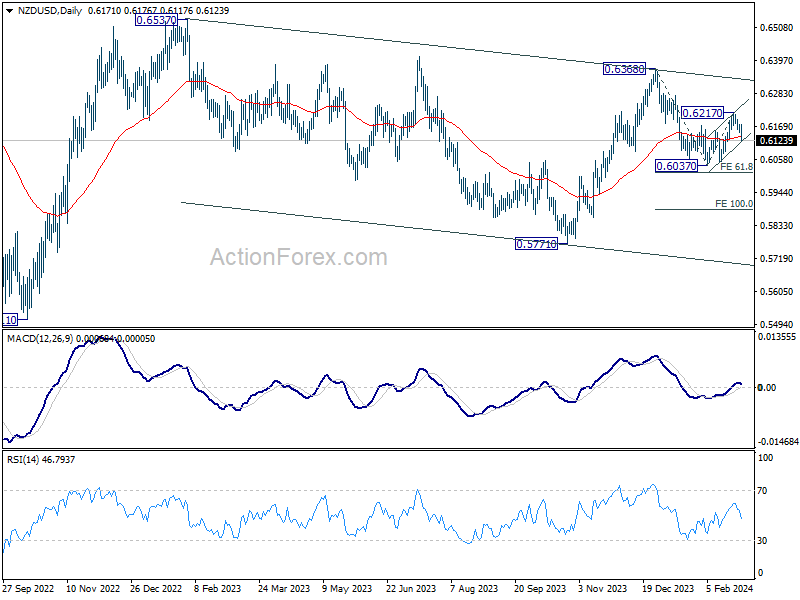
In the bigger picture, fall from 0.6368 is seen as the third leg of the corrective pattern from 0.6537 (2023 high). Deeper decline would be seen to 0.5771 (2023 low) in the medium term, and possibly below. But break of 0.5511 long term bottom (2021 low) is not envisaged.
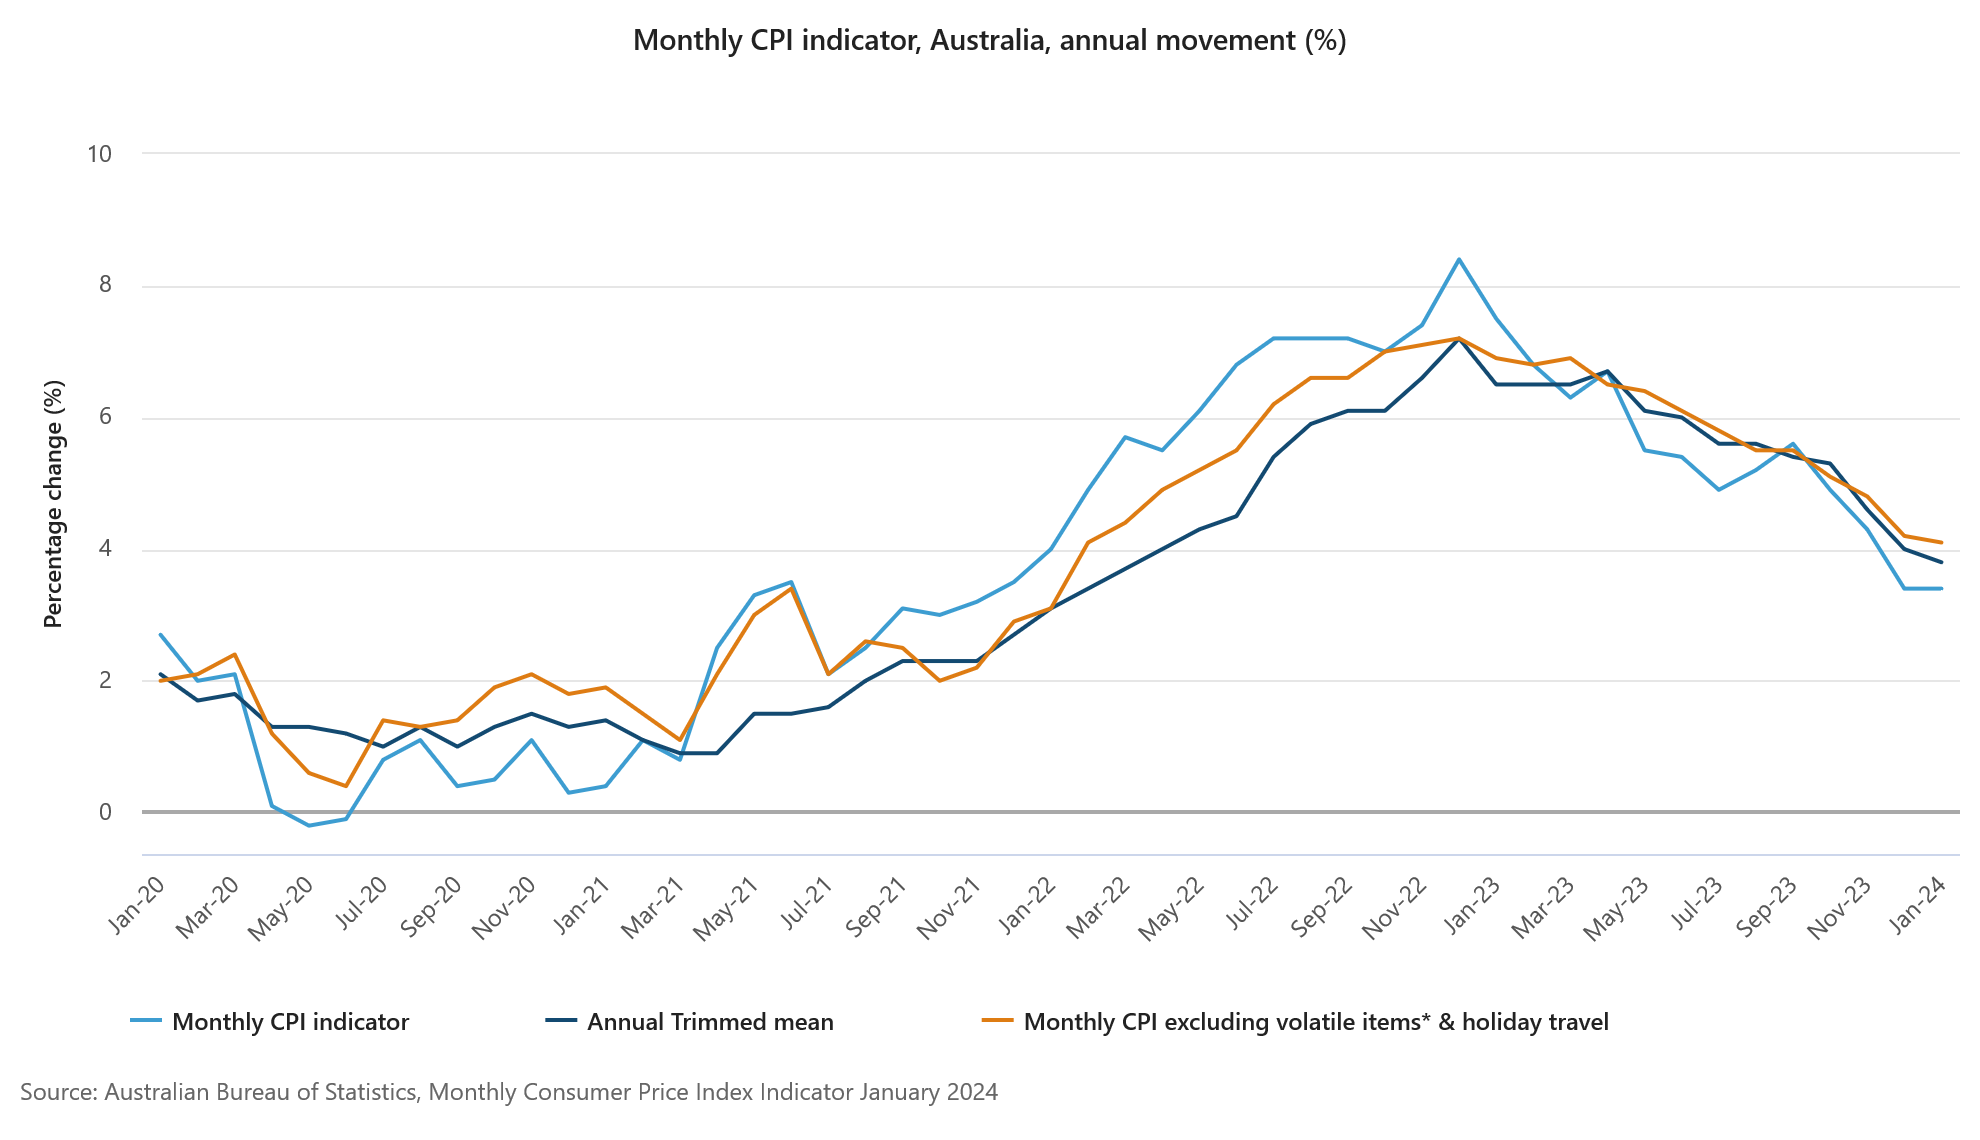
Australia monthly CPI unchanged at 3.4% in Jan, trimmed mean CPI down to 3.8%
Australia monthly CPI was unchanged at 3.4% yoy in January, below expectation of a rise to 3.6% yoy. CPI excluding volatile items and holiday travel slowed from 4.2% yoy to 4.1% yoy. Trimmed mean CPI also slowed from 4.0% yoy to 3.8% yoy.
The detailed breakdown reveals that the main inflationary pressures came from specific sectors: Housing costs rose by 4.6%, food and non-alcoholic beverages by 4.4%, alcohol and tobacco by a significant 6.7%, and insurance and financial services saw the highest increase at 8.2%.
These increases were somewhat mitigated by a decrease in the recreation and culture sector, notably a -1.7% drop, primarily driven by a -7.1% fall in Holiday travel and accommodation, which provided a counterbalance to the overall annual inflation rate.
Fed's Bowman: Not time for rate cuts yet
Fed Governor Michelle Bowman articulated that Fed is "not at that point" to initiate rate cuts. Additionally, she expressed readiness to increase rates further if progress on inflation "has stalled or reversed".
"Should the incoming data continue to indicate that inflation is moving sustainably toward our 2% goal, it will eventually become appropriate to gradually lower our policy rate to prevent monetary policy from becoming overly restrictive," Bowman said in a speech overnight.
However, "in my view, we are not yet at that point," she emphasized. "Reducing our policy rate too soon could result in requiring further future policy rate increases to return inflation to 2 percent in the longer run."
"While the current stance of monetary policy appears to be at a restrictive level that will bring inflation down to 2 percent over time, I remain willing to raise the federal funds rate at a future meeting should the incoming data indicate that progress on inflation has stalled or reversed," Bowman added.
Looking ahead
Swiss Credit Suisse economic expectations and Eurozone economic sentiment indicator will be released. Later in the day, Canada will release current account. US will release Q4 GDP revision and goods trade balance.
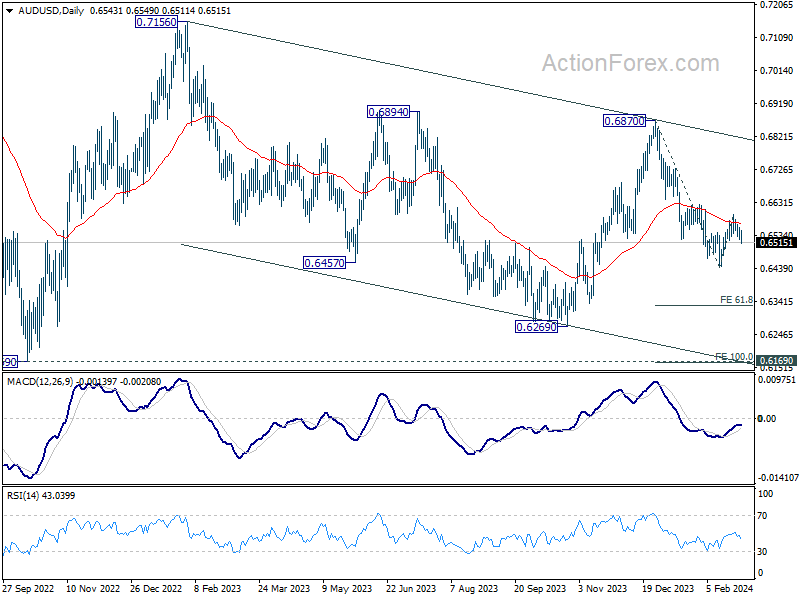
AUD/USD Daily Report
Daily Pivots: (S1) 0.6527; (P) 0.6542; (R1) 0.6560; More...
AUD/USD's break of 0.6520 minor support suggests that corrective rebound from 0.6442 haws completed at 0.6594 already, after rejection by 55 D EMA. Intraday bias is back on the downside for retesting 0.6442 low first. Firm break there will resume whole decline from 0.6870, and target 61.8% projection of 0.6870 to 0.6442 from 0.6594 at 0.6329 next. For now, risk will stay on the downside as long as 0.6594 resistance holds, in case of recovery.
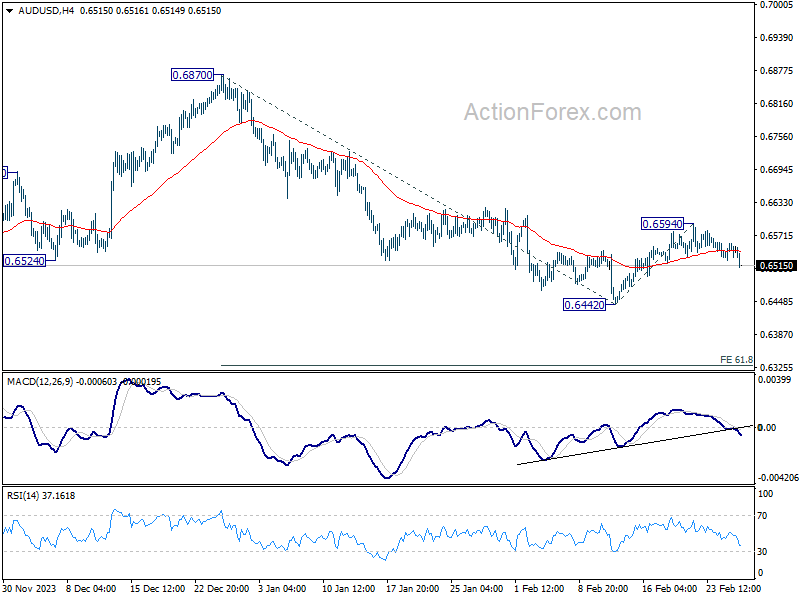
In the bigger picture, price actions from 0.6169 (2022 low) are seen as a medium term corrective pattern to the down trend from 0.8006 (2021 high). Fall from 0.7156 (2023 high) is seen as the second leg, which might still be in progress. Overall, sideway trading could continue in range of 0.6169/7156 for some more time. But as long as 0.7156 holds, an eventual downside breakout would be mildly in favor.
Economic Indicators Update
| GMT | Ccy | Events | Actual | Forecast | Previous | Revised |
|---|---|---|---|---|---|---|
| 00:30 | AUD | Monthly CPI Y/Y Jan | 3.40% | 3.60% | 3.40% | |
| 00:30 | AUD | Construction Work Done Q4 | 0.70% | 0.80% | 1.30% | |
| 01:00 | NZD | RBNZ Interest Rate Decision | 5.50% | 5.50% | 5.50% | |
| 09:00 | CHF | Credit Suisse Economic Expectations Feb | -19.5 | |||
| 10:00 | EUR | Eurozone Economic Sentiment Indicator Feb | 96.6 | 96.2 | ||
| 10:00 | EUR | Eurozone Industrial Confidence Feb | -9.2 | -9.4 | ||
| 10:00 | EUR | Eurozone Services Sentiment Feb | 9 | 8.8 | ||
| 10:00 | EUR | Eurozone Consumer Confidence Feb F | -15.5 | -15.5 | ||
| 13:30 | CAD | Current Account Q4 | -1.9B | -3.22B | ||
| 13:30 | USD | GDP Annualized Q4 P | 3.30% | 3.30% | ||
| 13:30 | USD | GDP Price Index Q4 P | 1.50% | 1.50% | ||
| 13:30 | USD | Goods Trade Balance (USD) Jan P | -88.1B | -87.9B | ||
| 13:30 | USD | Wholesale Inventories Jan P | 0.20% | 0.40% | ||
| 15:30 | USD | Crude Oil Inventories | 3.1M | 3.5M |
Review of RBNZ February 2024 Monetary Policy Statement
Staying the course
- The RBNZ left the OCR at 5.5%. The forward profile was lowered, and now implies around a 40% chance of a further OCR increase (down from 75% previously) and is in line with our own assessment.
- The record of the meeting noted that the risks to the outlook were viewed as "more balanced" than at the time of the November MPS.
- The RBNZ's inflation forecasts were revised lower over 2024, reflecting recent data.
- But the RBNZ's 2025 forecasts were slightly revised up, reflecting persistent domestic inflation pressures.
- The RBNZ reaffirmed their commitment to seeing inflation at 2% in the second half of 2025.
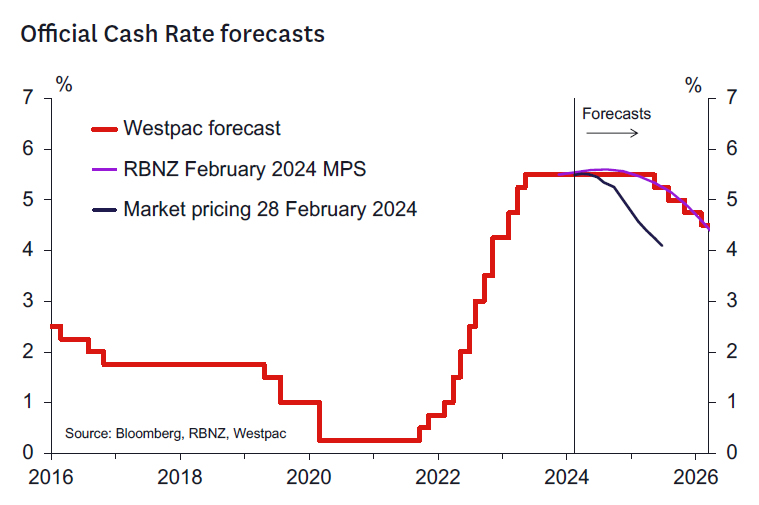
- The RBNZ's monetary policy strategy remains unchanged, implying the OCR will remain at 5.5% until 2025 – in line with Westpac's forecasts. The RBNZ is staying the course.
The RBNZ left the OCR at 5.5% as we expected. The overall tone of the Statement remains somewhat hawkish – but much less hawkish than markets feared. The RBNZ still sees a risk of a need for a higher OCR to 5.75% in Q3 this year. However, these risks are lower than seen in November as the RBNZ's updated OCR track was lowered and now implies around a 40% chance of a further OCR increase (down from around 75% previously). Indeed, the RBNZ's forecast for the OCR over 2024 now looks much like that published in the August 2023 MPS.
A key excerpt from the MPS summarises the RBNZ's view:
"Conditional on our central economic outlook, the Official Cash Rate (OCR) is expected to remain around current levels for an extended period in order for the MPC to meet its inflation target. The outlook for the OCR is slightly lower than in the November 2023 Statement. This reflects that the slightly lower outlooks for capacity pressures, import prices and house price inflation more than offset the higher outlook for export prices."
The record of the meeting noted that members viewed that "overall, risks to the outlook for inflation were more balanced than at the time of the November 2023 Statement. However, from a monetary policy perspective, there remains less capacity to absorb upside inflation surprises, relative to downside surprises." In the press conference, Governor Orr emphasised that while the risks to inflation are now more balanced, the policy reaction function to any realisation of these risks is asymmetric given the current level of inflation.
For now, the RBNZ seems comfortable that their monetary policy strategy of holding the OCR at 5.5% for as long as it takes will be sufficient to bring inflation back to 2%. Still sticky non-tradables inflation and a slowly adjusting labour market is keeping the RBNZ on their toes.
Governor Orr indicated that the MPC continues to maintain a "comfortable" consensus regarding the level of the OCR. While the possibility of a hike was discussed at the meeting, no vote was required.
As noted in our MPS preview and subsequent note, we didn't expect an increase in the OCR, with a straight interpretation of the data suggesting that the track could even be lowered. But we saw material risks of either an OCR increase or upgraded risks of one in the future, if the RBNZ were to focus on some of the more worrying aspects of the data (e.g., the stickiness of non-tradable inflation). These risks were not realised.
We remain comfortable with our view that the OCR remains on hold at 5.5% over 2024, before a gradual easing cycle begins in early 2025. We see a more gradual than expected easing in domestic inflation pressures than the RBNZ. Given today's Statement noting "there was limited tolerance to increase the time to the target midpoint" this underpins our expectation that the RBNZ won't be easing this year.
Key points to note from the Monetary Policy Statement.
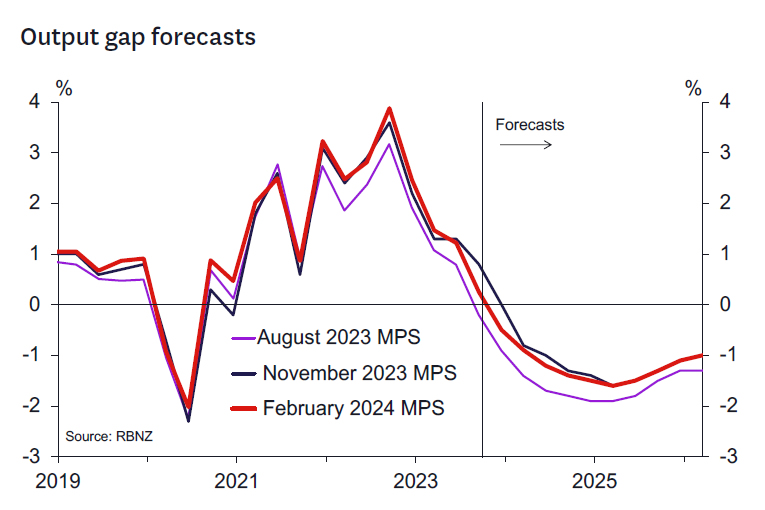
The RBNZ has responded to the weak Q3 GDP report and associated GDP revisions by lowering its estimate of trend growth but also lowering its estimate of the positive output gap in Q3 2023 to 0.3% from 0.8%.
In common with other central banks, notably the RBA, the RBNZ remains focused on downside risks to the Chinese economy, with potential impacts on both New Zealand's export and import prices. The RBNZ also notes a general risk to global growth is that central banks may need to keep policy interest rates at restrictive levels for longer than currently reflected in financial market pricing.
Regarding fiscal policy, the RBNZ notes that the central projection in today's MPS is based on the forecast for government spending in the HYEFU 2023. The RBNZ will take any new fiscal initiatives into account when Budget 2024 is released on 30 May. The Budget will be released after the May MPS meeting, but the RBNZ will have seen the underlying data before the MPS.
No change in the neutral OCR was made and the Chief Economist indicated that the RBNZ was comfortable with their 2.5% estimate "for this forecast".
There is no adjustment in the horizon over which the RBNZ needs to see inflation return to 2%. This is still expected to be reached in H2 2025.
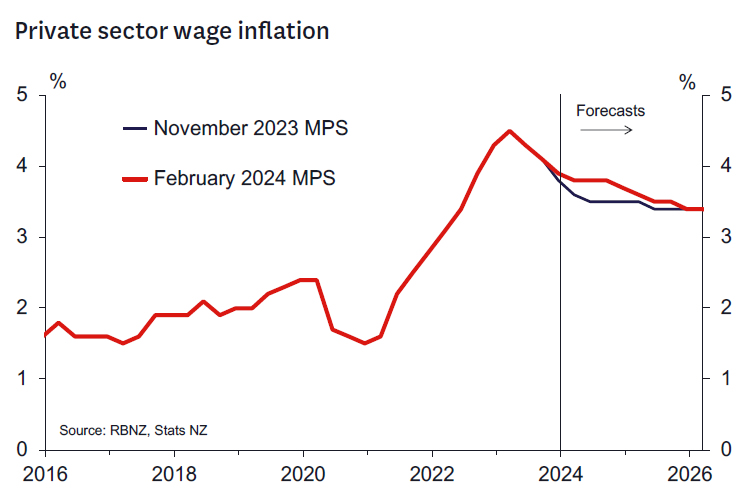
The RBNZ "marked to market" their unemployment rate forecasts and now see the unemployment rate rising more slowly to a similar level of 5.1% in mid- 2025. Their private sector wage forecasts were revised up, again reflecting the latest higher than expected outcome. The RBNZ seemed comfortable that this pace of adjustment was consistent with meeting their inflation objectives. Indeed, Governor Orr indicated that New Zealand seemed to be on track for a "soft landing" despite a material rise in unemployment.
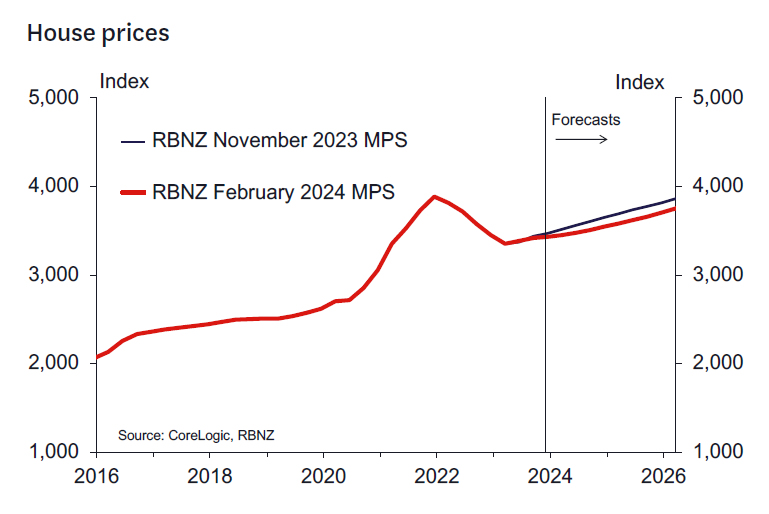
The RBNZ's housing market forecasts were revised down reflecting recent flat data. This is in line with the RBNZ's generally more relaxed tone regarding the impact of net migration pressures on inflation (although concern was raised on the level of rent inflation).
On inflation, we generally agree with the direction of changes to the RBNZ's forecasts. They've accounted for recent weaker import prices and reduced their forecasts for tradables inflation. The RBNZ expects further sharp declines in tradables inflation consistent with the swings seen in the prices of volatile items like international airfares.
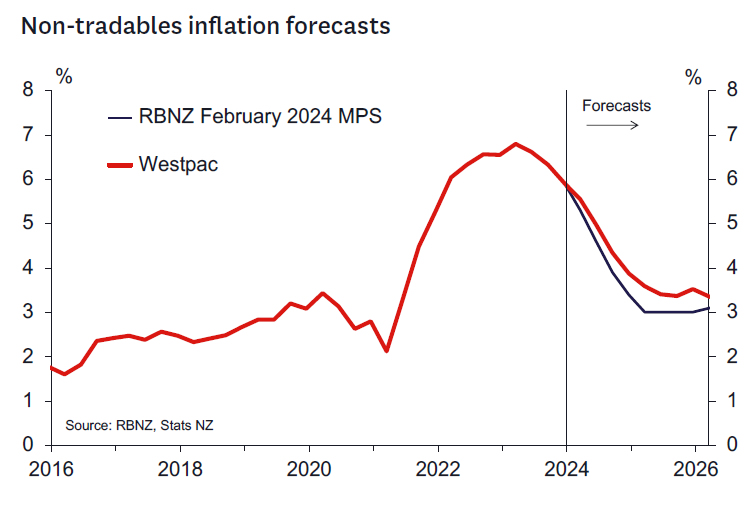
The outlook for non-tradables inflation remains elevated, reflecting ongoing strong wage growth and strong increases in the prices for services such as utilities and local council rates.
We think domestic inflation pressures will ease more gradually than the RBNZ is expecting, and we think that the challenge to their forecast could come in the March quarter inflation report (out 17 April). While the RBNZ expects domestic inflation pressures will be up 1.1% in the March quarter, we expect they will rise by 1.4%. That reflects factors such as the ongoing pressure on rents, and strong increases in costs such as insurance premiums and tobacco taxes.
Key things to watch over the weeks ahead.
Looking out over the next month or so, key economic data points to watch ahead of the next OCR review on 10 April will be:
- The Q4 GDP report (21 March). We presently estimate that the economy grew just 0.1% - not materially different to the flat outcome estimated by the RBNZ in today's MPS.
- The selected price indexes released on 13 March, which will provide some further information about the outlook for the Q1 CPI report released on 17 April.
- Incoming migration and housing-related data, as well as indicators of consumer spending.
- Inflation indicators from the ANZ Business Outlook Survey (tomorrow and again on 27 March) and the NZIER's QSBO survey (9 April) will also be scrutinised.
AUD/NZD Technical: Squeezed Up Towards Key 1.0700 Resistance Ex-post RBNZ
- New Zealand central bank, RBNZ maintained its OCR at 5.50% but surprised markets with lower OCR forecasts for 2024 and 2025.
- A less hawkish RBNZ has triggered a sell-off in the Kiwi (-1% intraday against the USD), the worst-performing currency among the majors.
- The current weak outlier movement of the NZD has triggered a potential short-term bearish mean reversion scenario for the AUD/NZD cross pair.
- Watch the 1.0700 key short-term resistance on AUD/NZD.
The Kiwi has been walloped hard to the downside on an intraday basis during today, Asian session as it plummeted by -1% against the US dollar at this time of the writing.
It seems that the “buy the rumour, sell the news” mantra has been inflicted on the Kiwi; in the past month, RBNZ officials have maintained hawkish vibes in their public speeches that pushed the NZD to be the top performer against the US dollar among the major currencies with a current peak gain of +2% seen on 22 February 2024 based on a one-month rolling basis.
Today’s abrupt weakness in the NZD has been attributed to the softer hawkish signal telegraphed to the market participants as the possibility of one interest rate hike in 2024 by RBNZ has been greatly reduced.
RBNZ has turned less hawkish
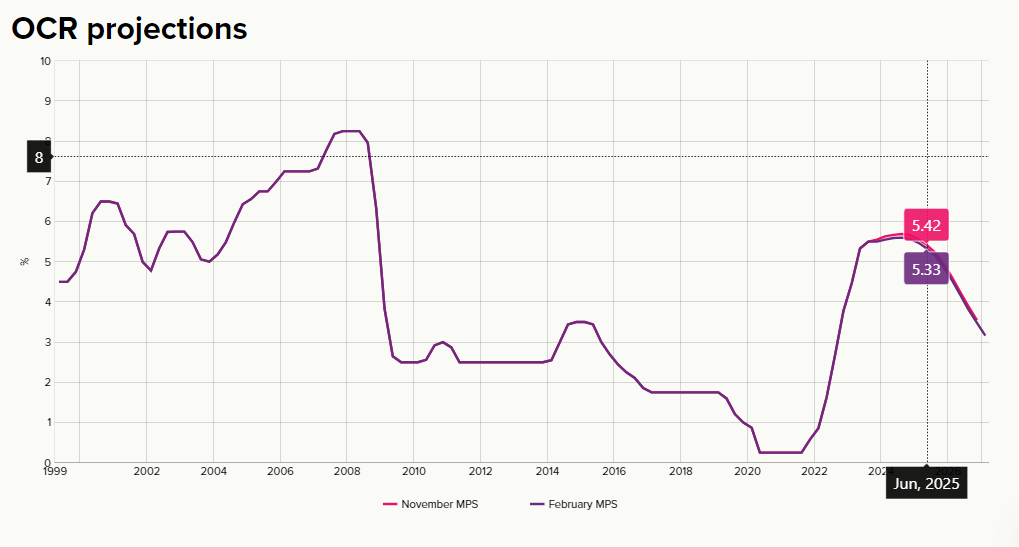
Fig 1: Latest RBNZ Official Cash Rate projection as of 28 Feb 2024 (Source: RBNZ website, click to enlarge chart)
The RBNZ maintained its official cash rate (OCR) at 5.50% as expected but what goes against the consensus view is the latest trajectory forecasts of its OCR. The RBNZ now expects the OCR rate to be at 5.59% in June 2024, a reduction of 8 basis points (bps) from the prior 5.67% forecasted in the November 2023 monetary policy meeting.
Also, the latest forecast for its OCR in March 2025 has been reduced to 5.47% from the prior projection of 5.56%, a further reduction to 5.33% is expected in June 2025 (prior forecast at 5.42%). All in all, this latest set of forecasts has reduced the probability significantly of a rate hike in 2024 while increasing the chances of a rate cut in early 2025 (see Fig 1).
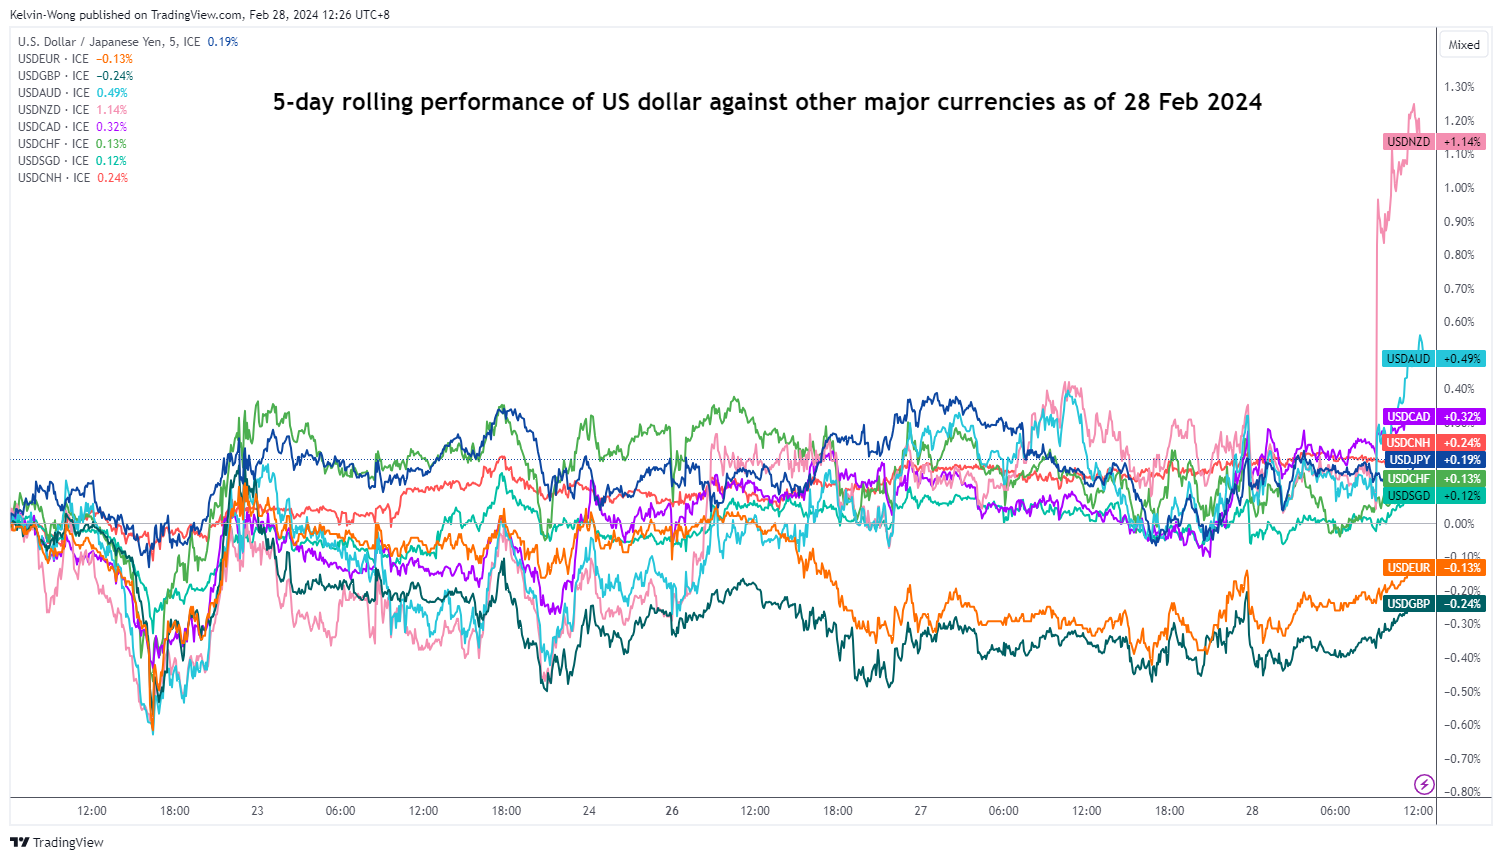
Fig 2: Rolling 1-month performance of US dollar against other major currencies as of 28 Feb 2024 (Source: TradingView, click to enlarge chart)
Today’s underperformance of the NZD against the US dollar has seen the USD/NZD cross rate spiked up with a gain of +1.14% on a 5-day rolling performance basis at this time of the writing; also an outlier among other major currencies performances (see Fig 2)
AUD/NZD spiked up towards 1.0700 key short-term resistance
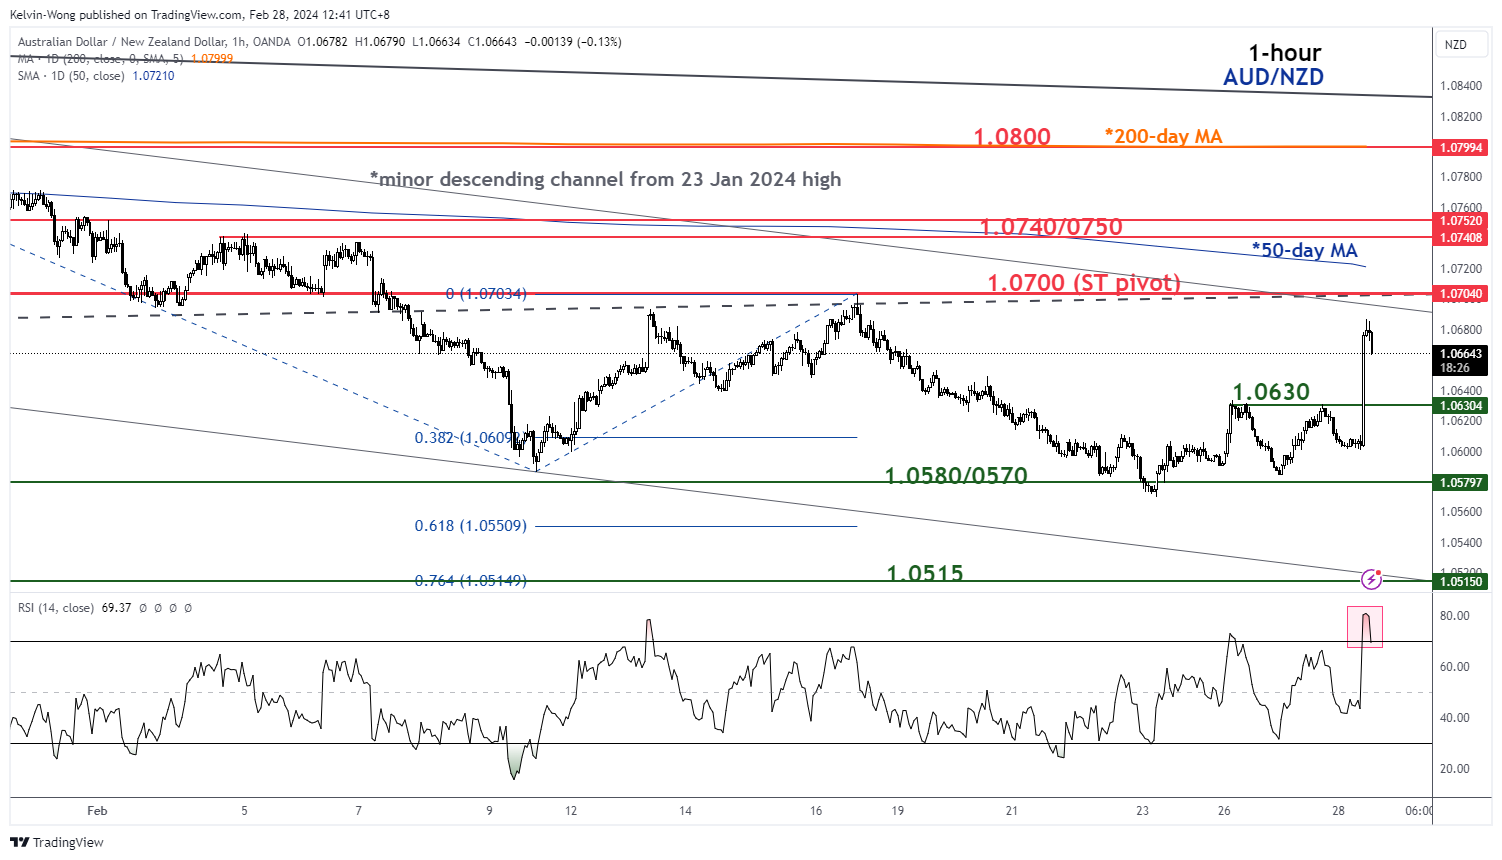
Fig 3: AUD/NZD short-term trend as of 28 Feb 2024 (Source: TradingView, click to enlarge chart)
Given the current sharp movement of the NZD on the weak side, there may be a potential short-term mean reversion scenario that can play out on the AUD/NZD cross-pair at this juncture.
The AUD/NZD has spiked up by +86 pips from today, Asian session intraday low of 1.0600, and almost hit a key short-term pivotal resistance of 1.0700 (current intraday high of 1.0686 at this time of the writing).
The 1.0700 pivotal resistance is likely a potential inflection level as it is defined by several elements such as the upper boundary of the minor descending channel in play since 23 January 2024 high, minor swing high area of 16 February 2024, close to 2 times Fibonacci extension of the recent up move from 23 February 2024 low, and downward sloping 50-day moving average hovering right above 1.0700.
In addition, the hourly RSI momentum indicator has started to inch down from an extreme overbought level of 80.8 which increases the odds of a short-term mean reversion decline scenario.
If the 1.0700 short-term pivotal resistance does not surpass the upside, the AUD/NZD may see a minor slide to expose the near-term supports at 1.0630 and1.0580/0570. A break below 1.0570 sees the next intermediate support coming in at 1.0515 (also the lower boundary of the minor descending channel).
However, a clearance above 1.0700 invalidates the bearish scenario for a squeeze-up to expose the next intermediate resistances at 1.0740/0750 and 1.0800 (also the 200-day moving average).
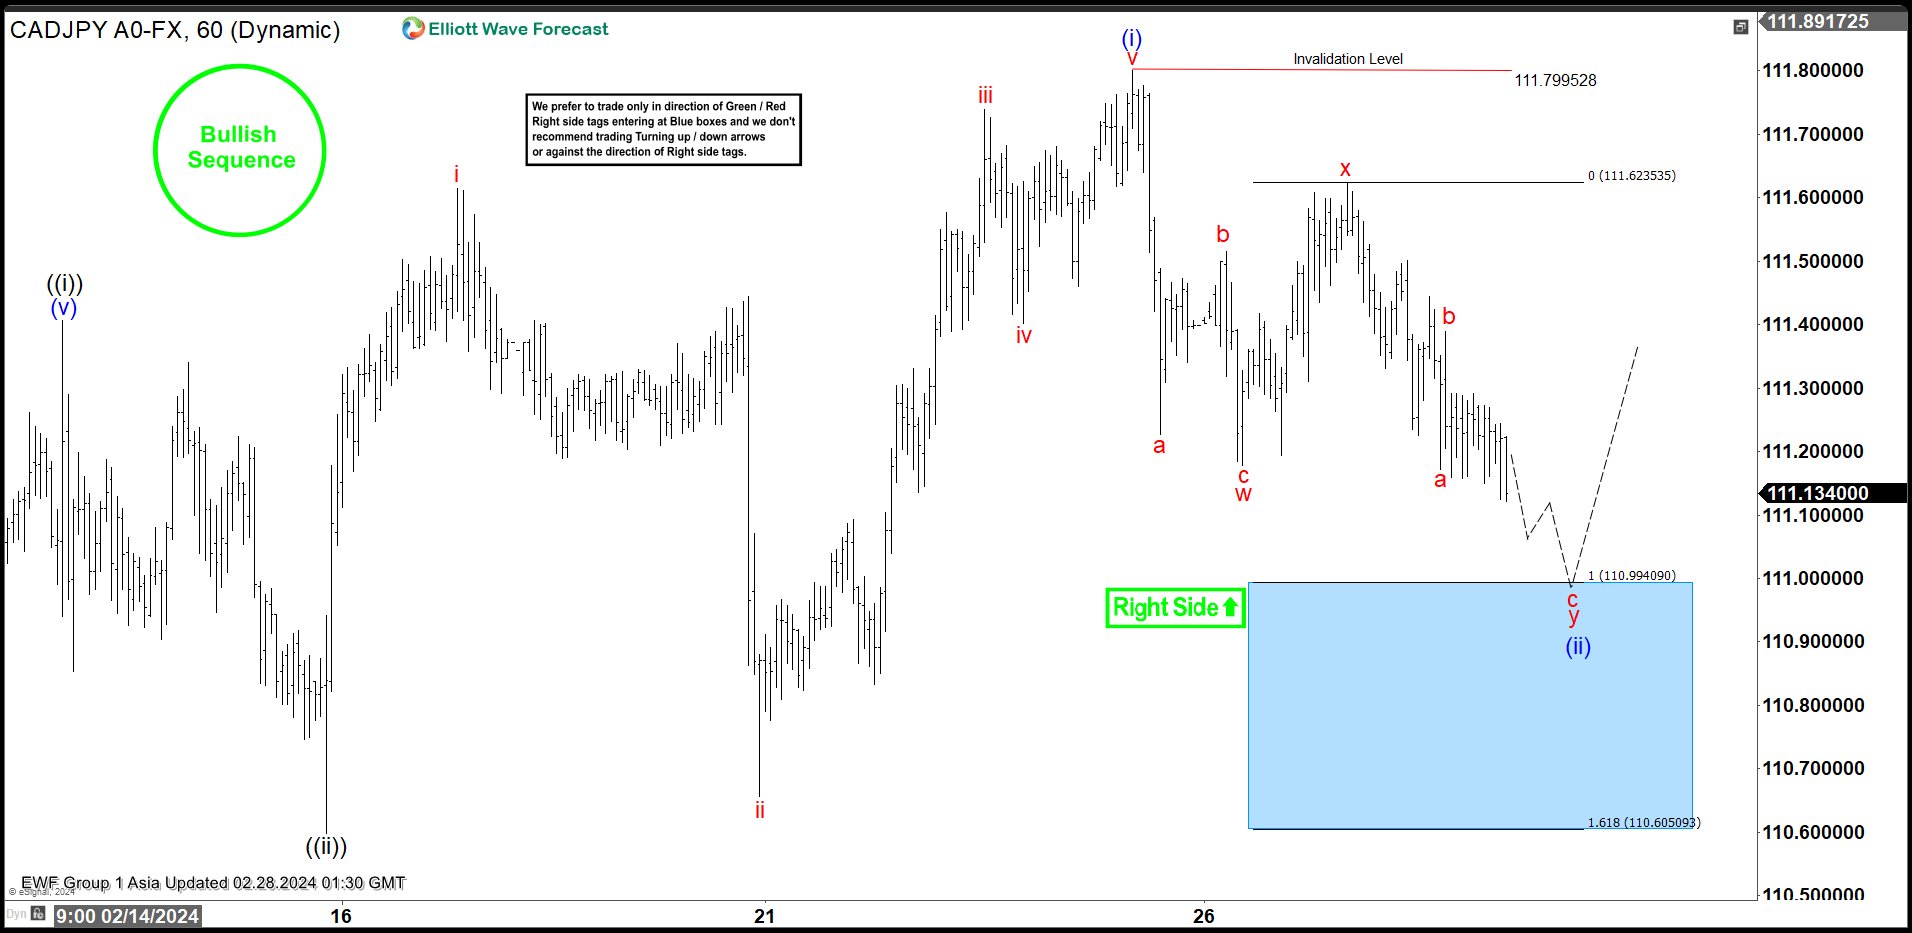
CADJPY Looking for Buyers in Double Zigzag Correction
CADJPY cycle from 2.1.2024 low is in progress as a nesting 5 waves. Up from 2.1.2024 low, wave ((i)) ended at 111.407 and pullback in wave ((ii)) ended at 110.6. Pair resumes higher in wave ((iii)) with internal subdivision as another 5 waves. Up from wave ((ii)), wave i ended at 111.614 and wave ii pullback ended at 110.657. Pair resumes higher in wave iii towards 111.739 and dips in wave iv ended at 111.402. Final leg wave v ended at 111.8 which completed wave (i) in higher degree. Pullback in wave (ii) is now in progress with internal subdivision as a double zigzag Elliott Wave structure.
Down from wave (i), wave a ended at 111.22 and wave b ended at 111.515. Wave c lower ended at 111.17 which completed wave w. Rally in wave x ended at 111.623. Pair resumes lower in wave y with internal subdivision as a zigzag structure. Down from wave x, wave a ended at 111.172 and wave b ended at 111.389. Wave c lower is expected to end at 110.6 – 111 area where it should complete wave y of (ii) in higher degree. Near term, expect buyers to appear at the blue box area for further upside or 3 waves rally at least.
CADJPY 60 Minutes Elliott Wave Chart
CADJPY Elliott Wave Video
https://www.youtube.com/watch?v=VZGJuVad_j8
Technical Outlook and Review
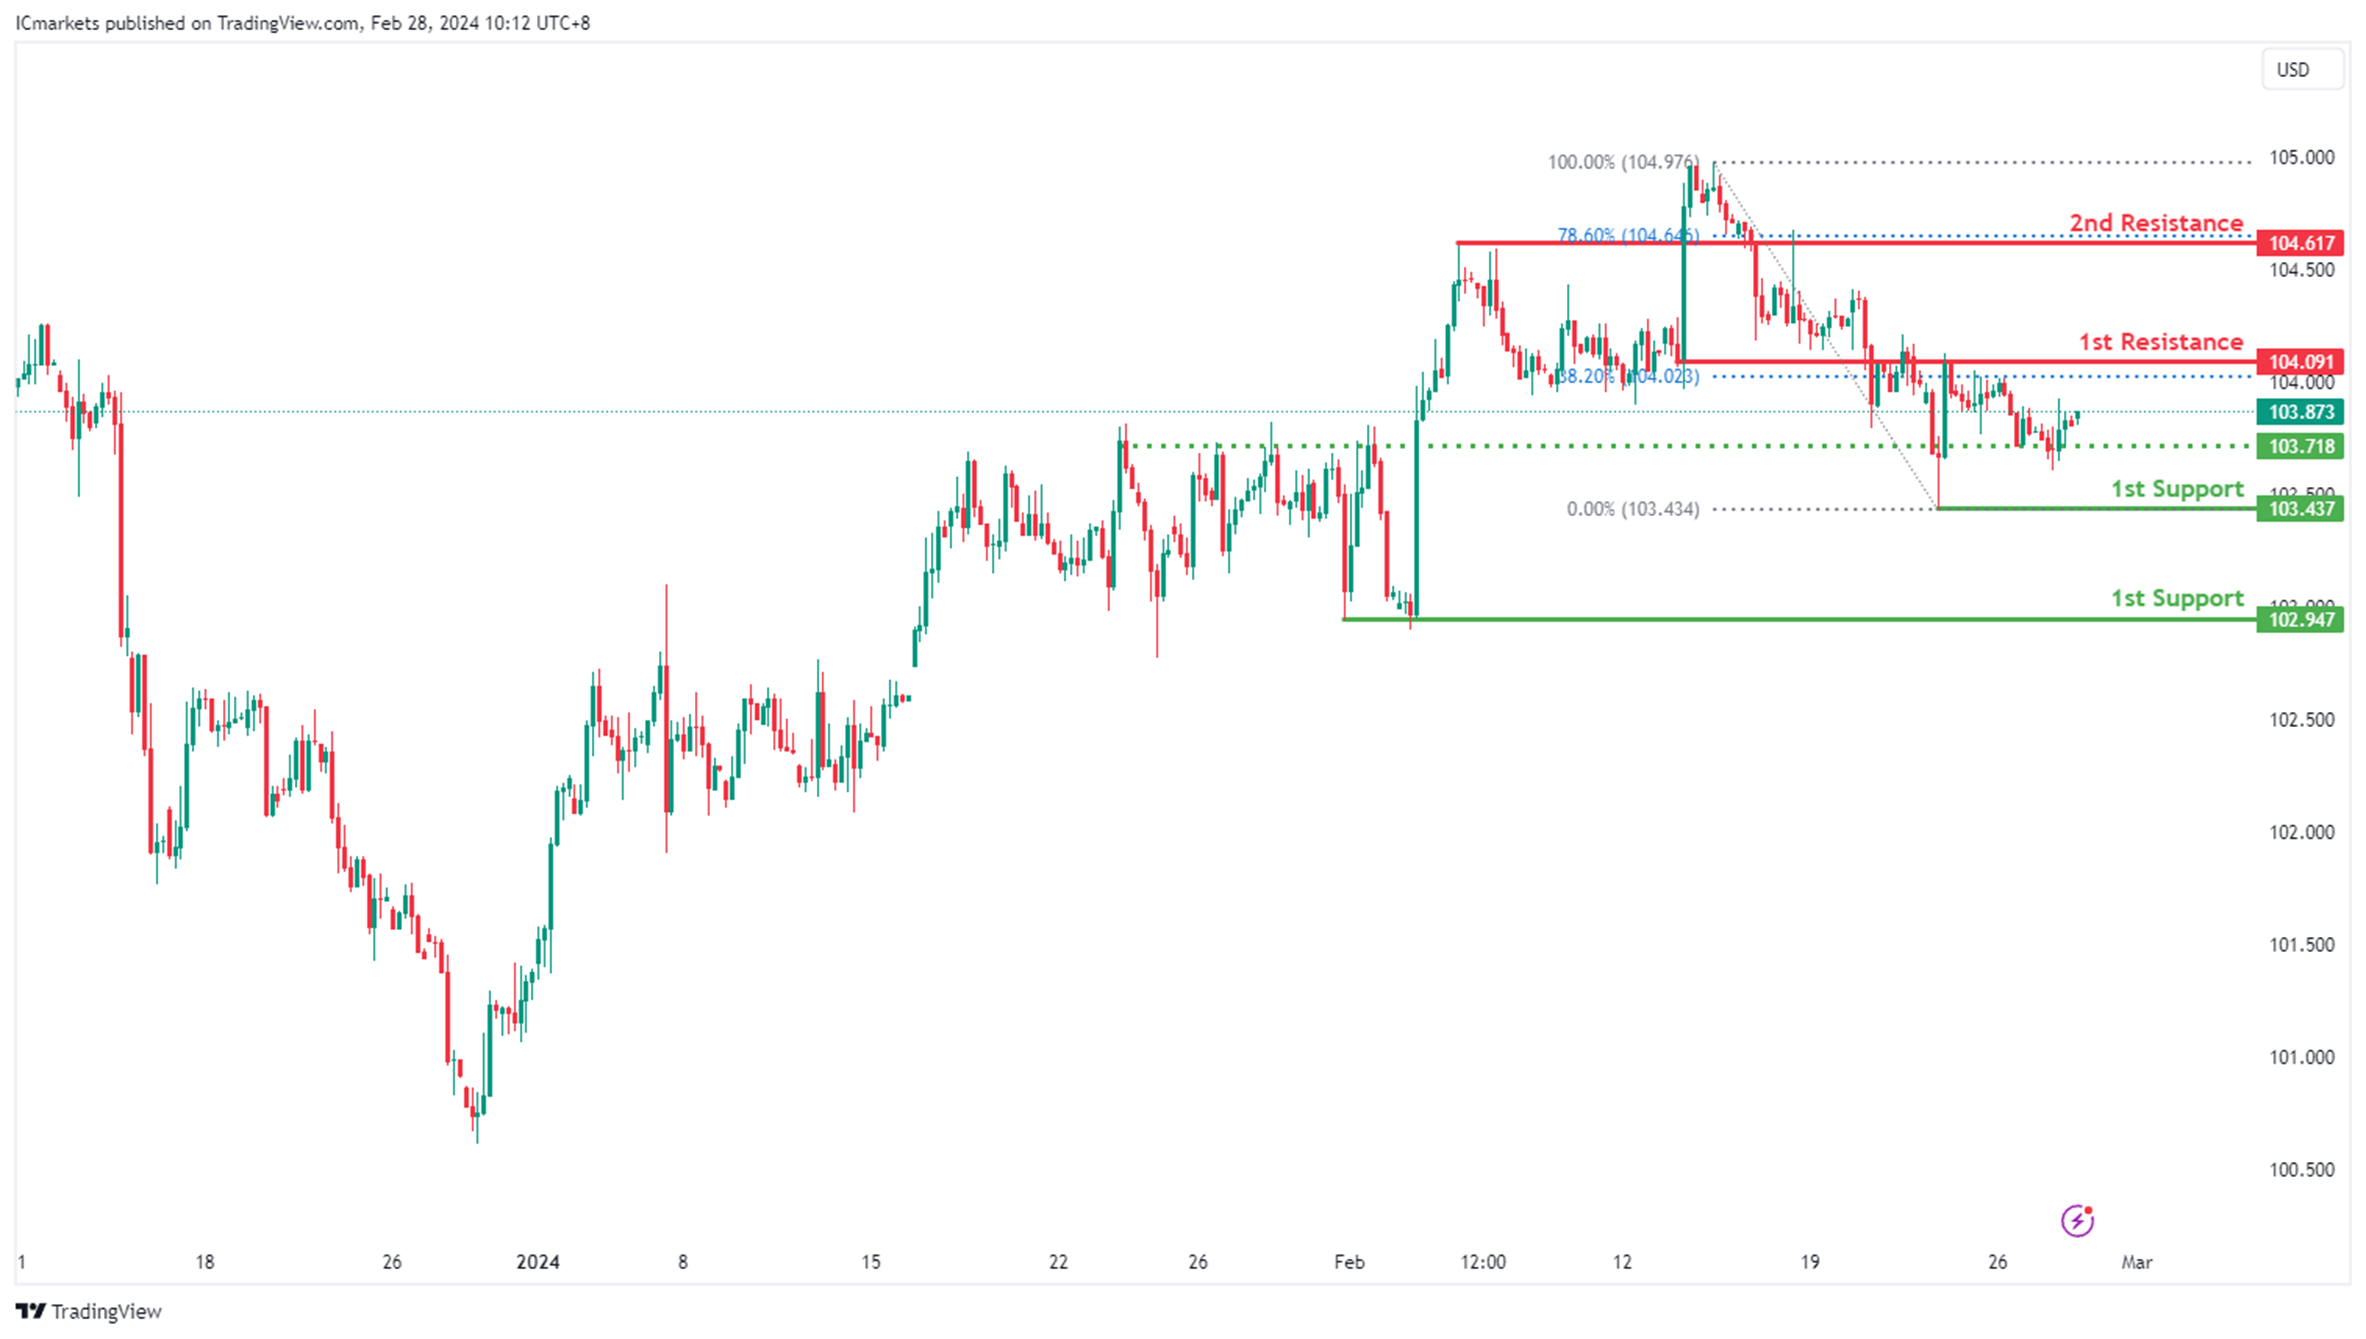
DXY:
The DXY chart currently exhibits a bearish momentum. However, price could rise towards the 1st resistance before resuming a potential bearish continuation towards the 1st support.
The 1st resistance level at 104.09 is identified as an overlap resistance that aligns close to the 38.20% Fibonacci Retracement level. Higher up, the 2nd resistance level at 104.61 is marked as a pullback resistance that aligns with the 78.60% Fibonacci Retracement level, further highlighting its importance as a potential resistance zone.
To the downside, the intermediate support level at 103.71 is identified as an overlap support while the 1st support level at 103.43 is noted as a pullback. Further below, the 2nd support level at 102.94 is also marked as a pullback support, reinforcing its significance as a key support level.
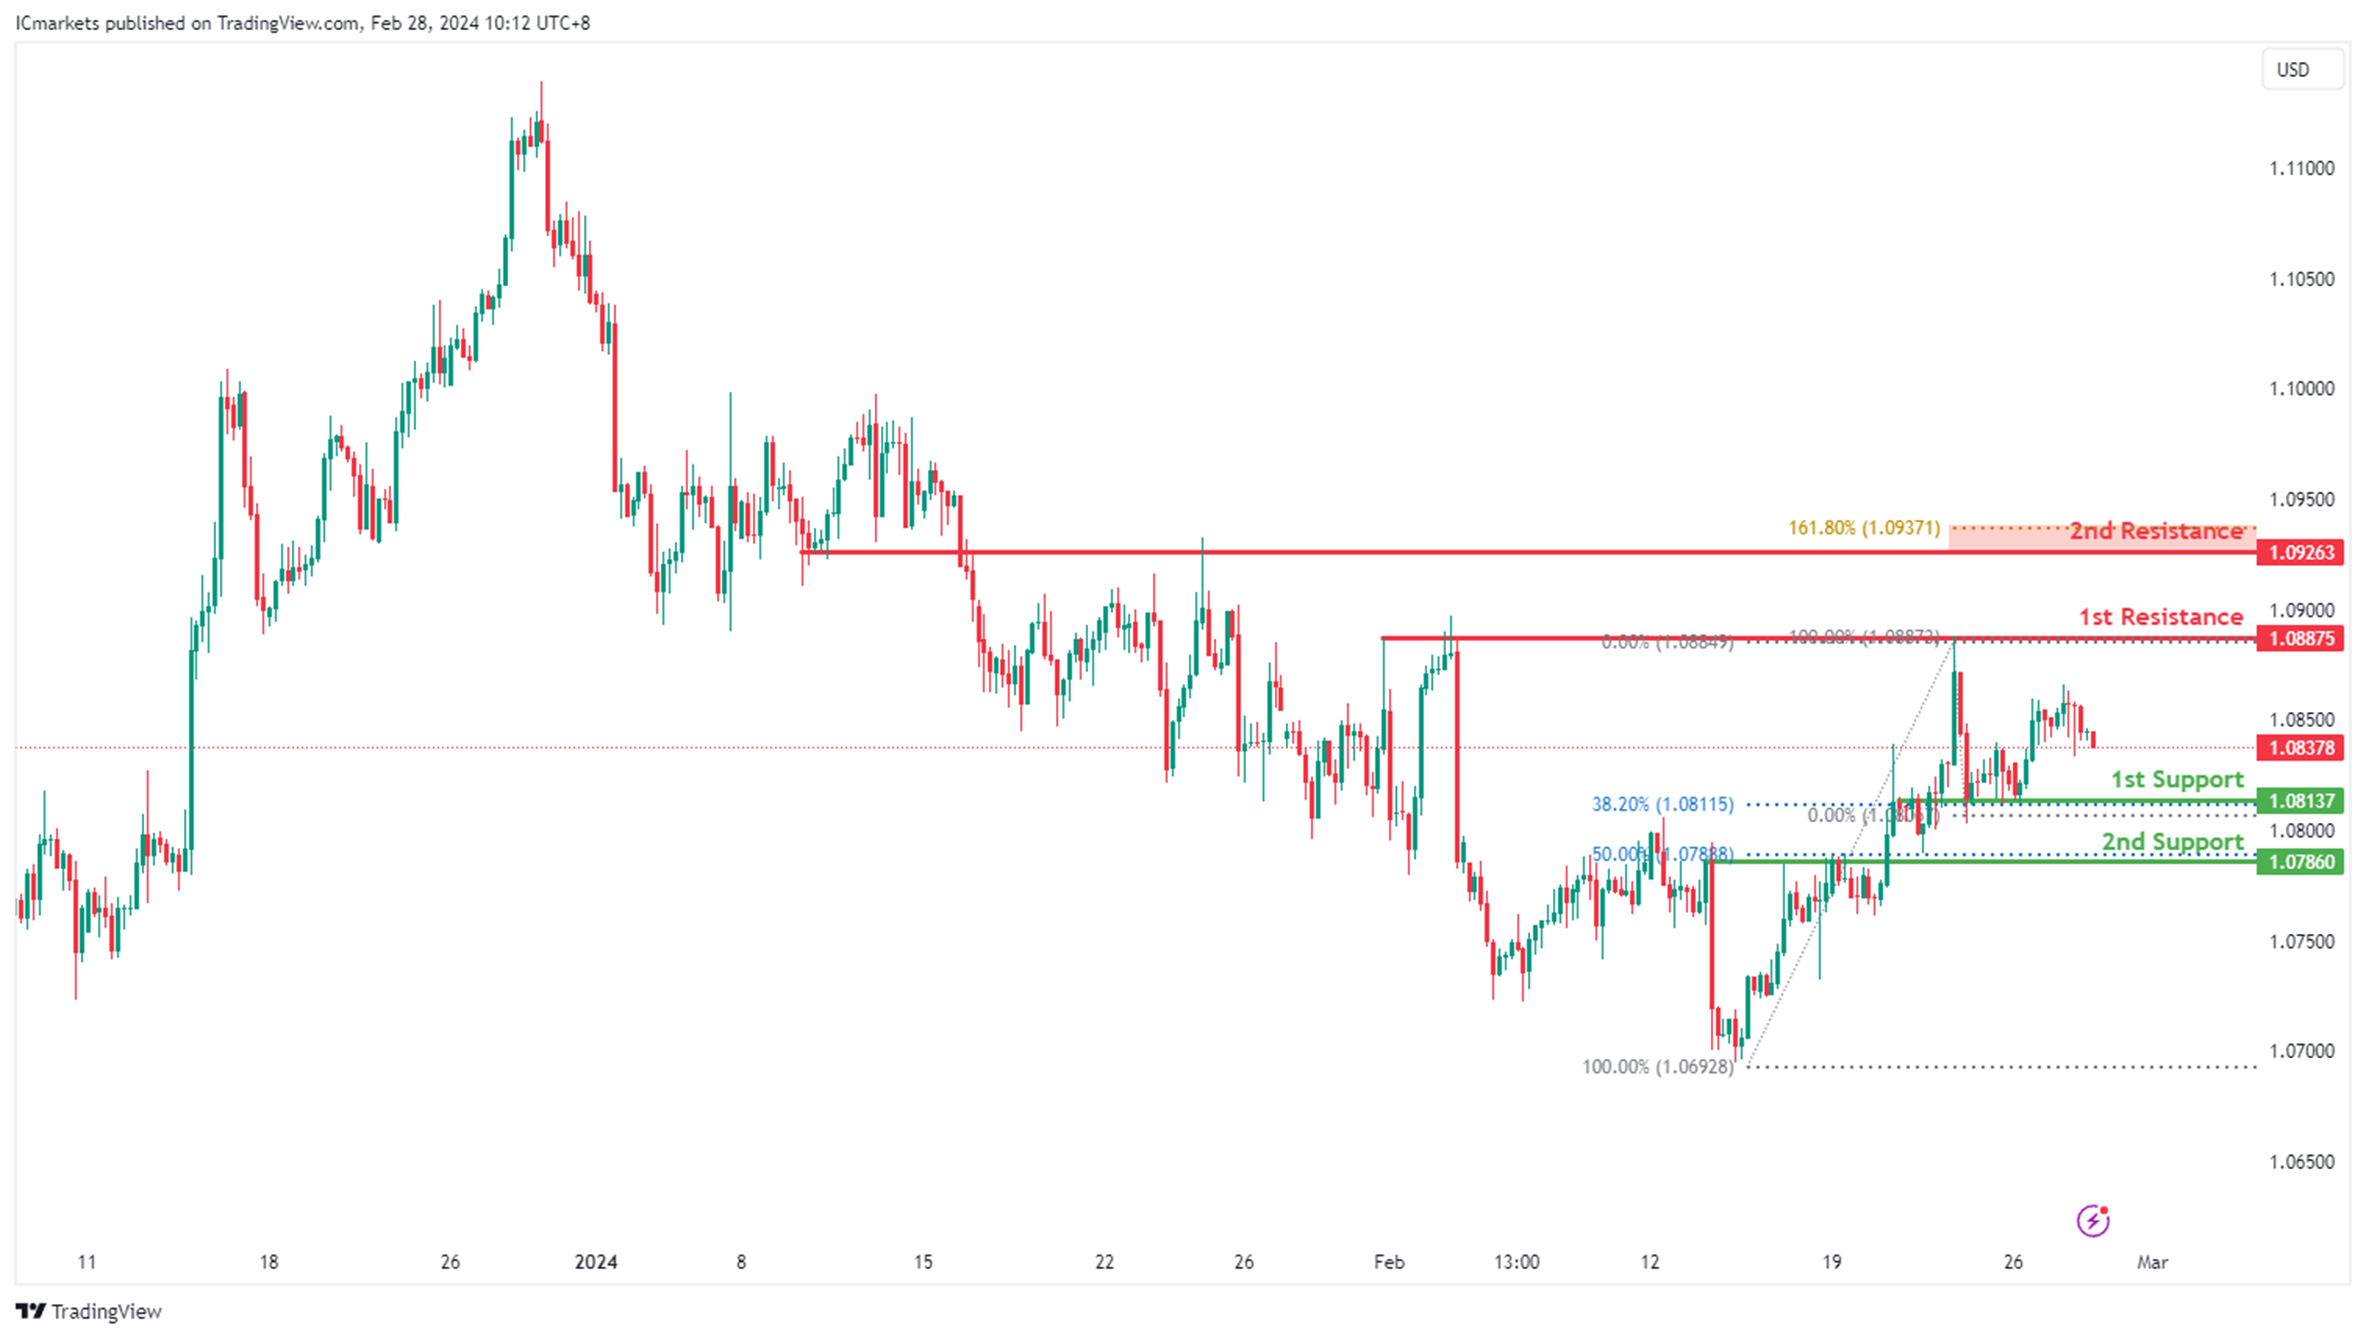
EUR/USD:
The EUR/USD chart currently exhibits an overall bullish momentum. However, there is a potential scenario for price to fall towards the 1st support before resuming the uptrend.
The 1st support level at 1.0813 is identified as an overlap support that aligns with the 38.20% Fibonacci Retracement level. Further below, the 2nd support level at 1.0786 is marked as a pullback support that aligns with the 50.00% Fibonacci Retracement level, further emphasizing its importance as a potential support zone.
To the upside, the 1st resistance level at 1.0887 is identified as a pullback resistance. Higher up, the 2nd resistance level at 1.0926 is noted as an overlap resistance that aligns close to the 161.80% Fibonacci Extension level, further highlighting its importance as a potential resistance point.
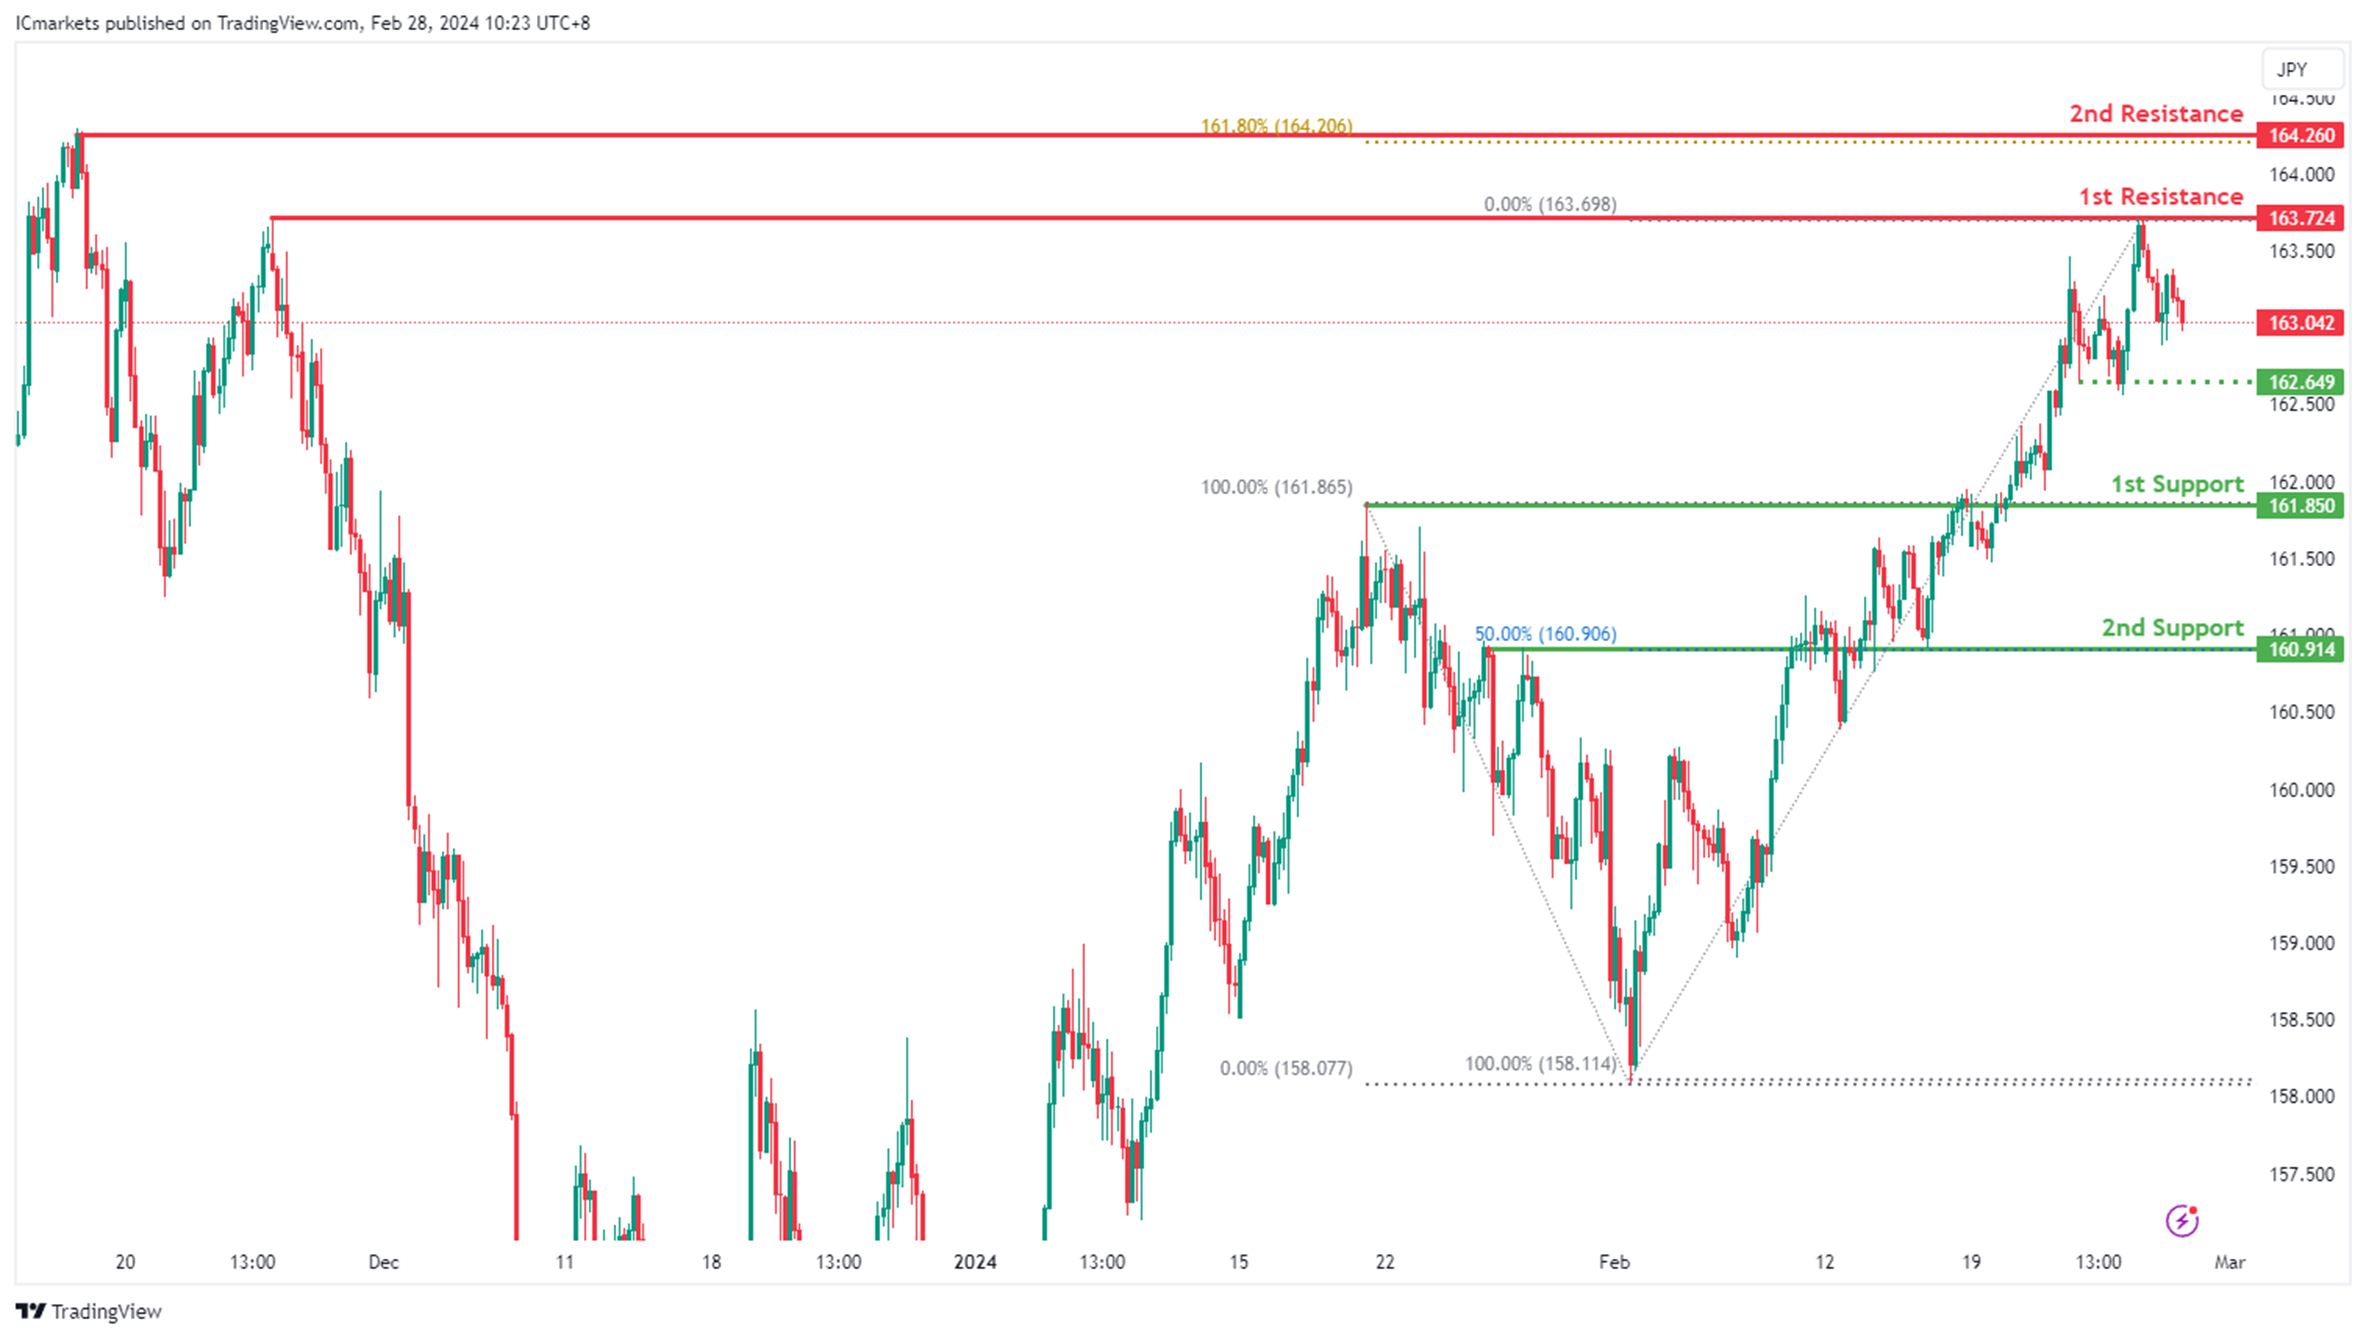
EUR/JPY:
The EUR/JPY chart currently exhibits an overall bullish momentum. However, there is a potential scenario for price to fall towards the intermediate support before resuming the uptrend.
The intermediate support level at 162.64 is identified as a pullback support while the 1st support level at 161.85 is also noted as a pullback support. Further below, the 2nd support level at 160.91 is marked as an overlap support that aligns with the 50.00% Fibonacci Retracement level, further emphasizing its importance as a potential support zone.
To the upside, the 1st resistance level at 163.72 is identified as a swing-high resistance. Higher up, the 2nd resistance level at 164.26 is also noted as a swing-high resistance that aligns with the 161.80% Fibonacci Extension level, further highlighting its importance as a potential resistance point.
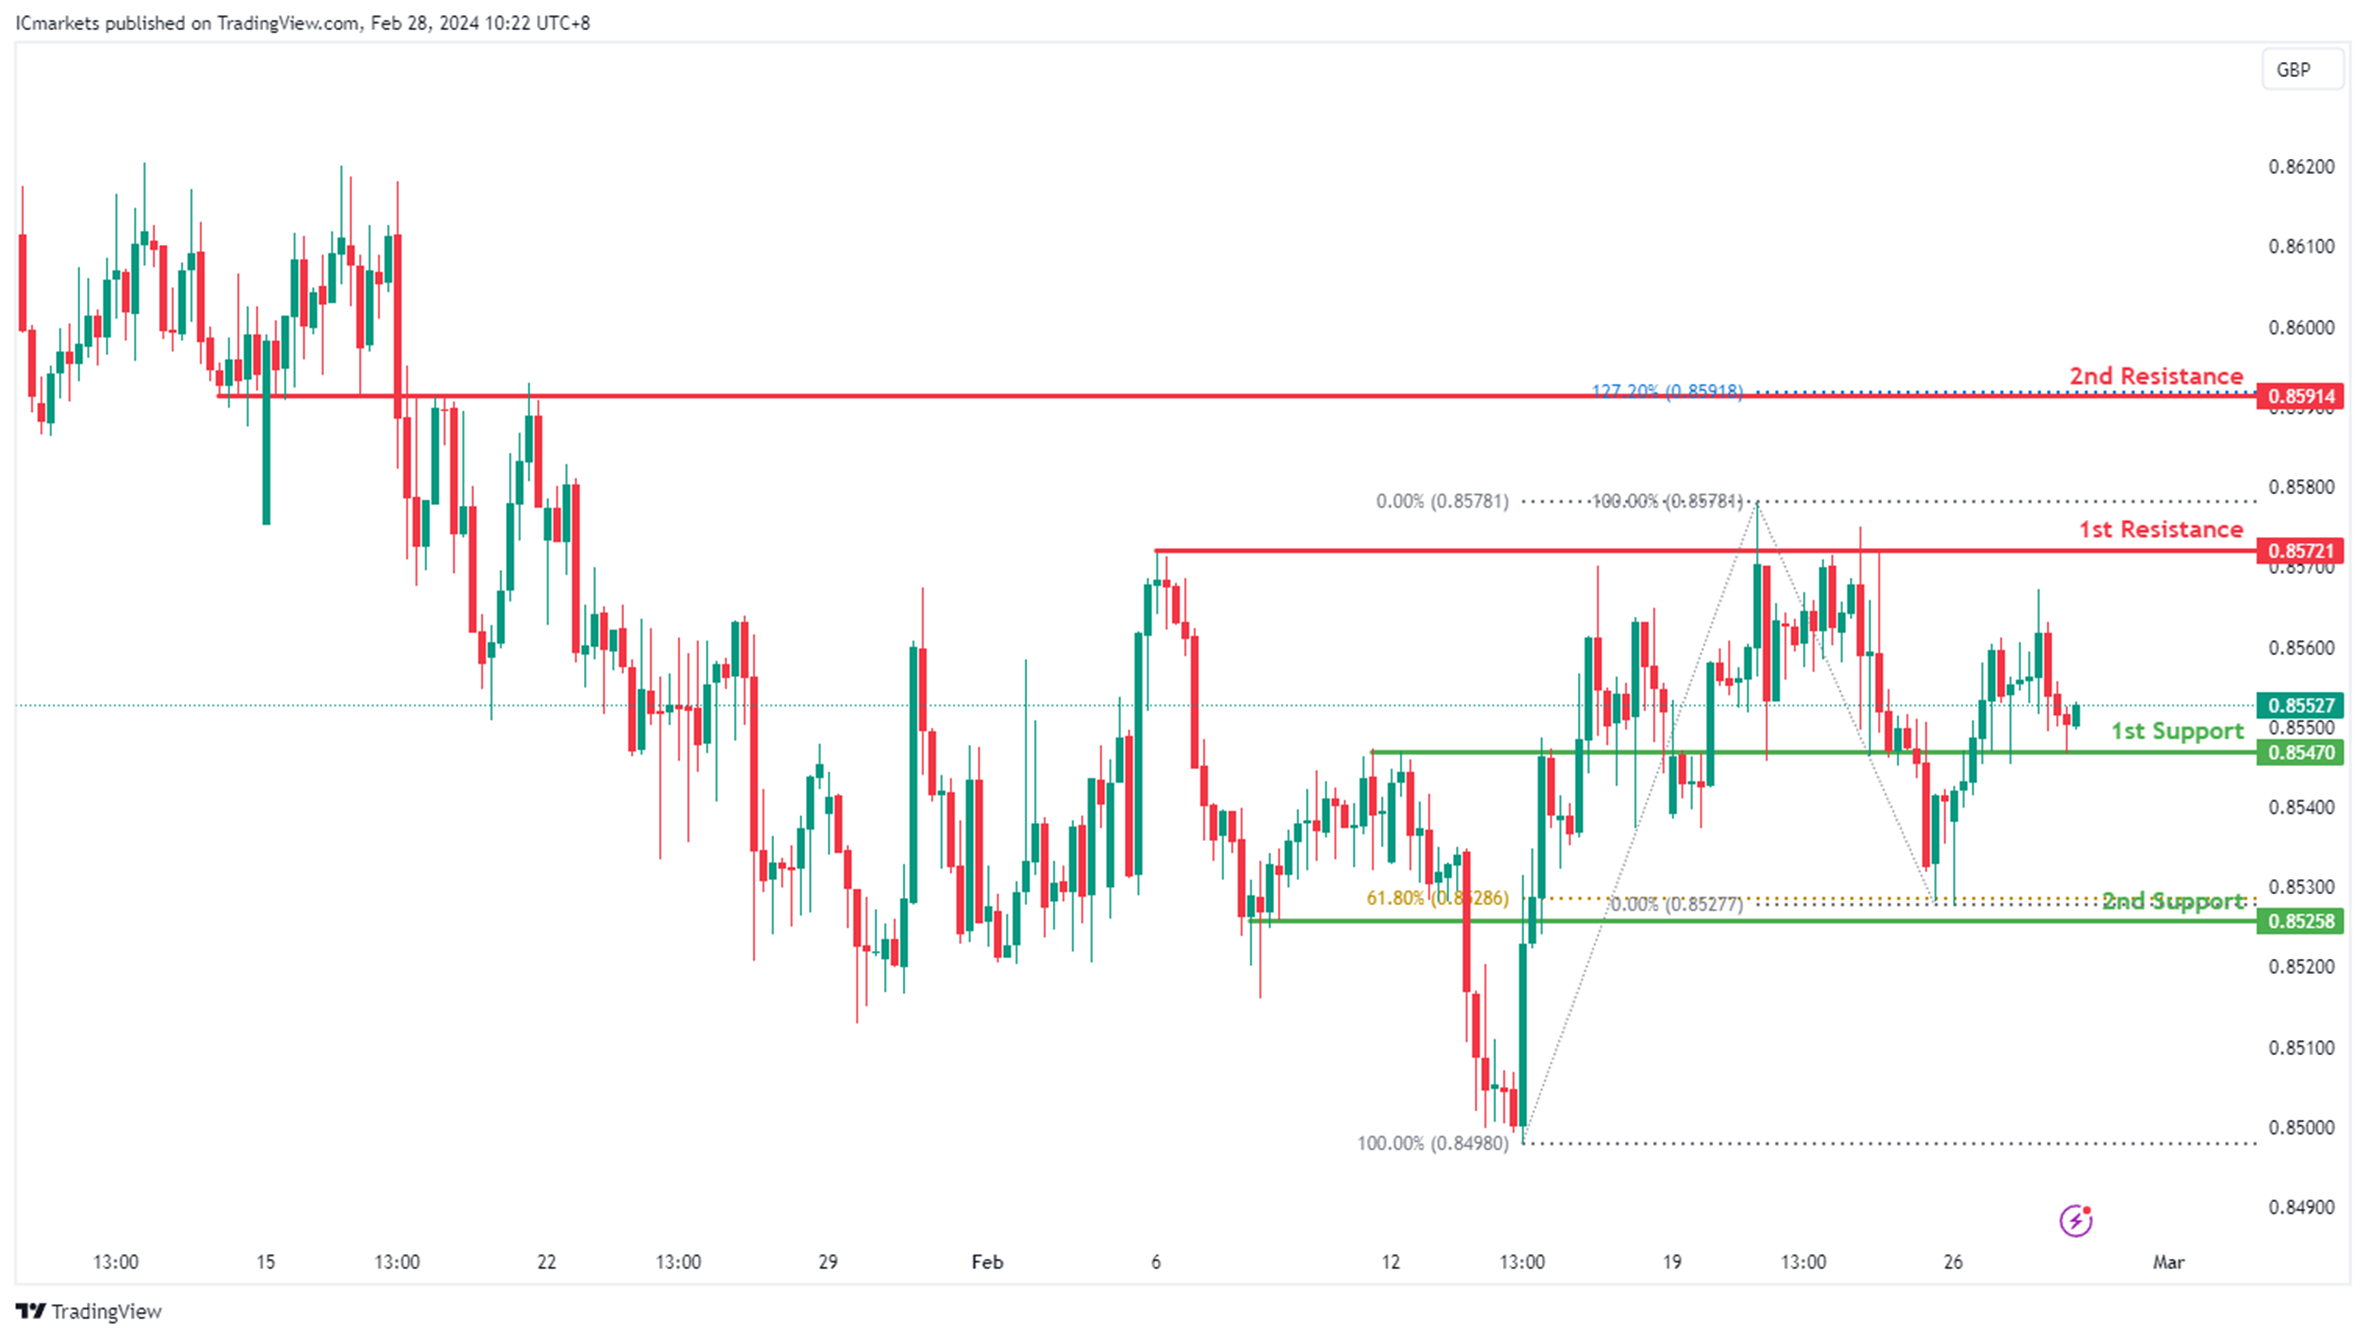
EUR/GBP:
The EUR/GBP chart currently exhibits a neutral bias. In this context, there is a potential scenario for price to fluctuate between the 1st support and the 1st resistance.
The 1st support level at 0.8547 is identified as an overlap support. Further below, the 2nd support level at 0.8525 is marked as a pullback support that aligns with the 61.80% Fibonacci Retracement level, further emphasizing its importance as a potential support zone.
To the upside, the 1st resistance level at 0.8572 is identified as a pullback resistance. Higher up, the 2nd resistance level at 0.8591 is noted as an overlap resistance that aligns with the 127.20% Fibonacci Extension level, further highlighting its importance as a potential resistance point.
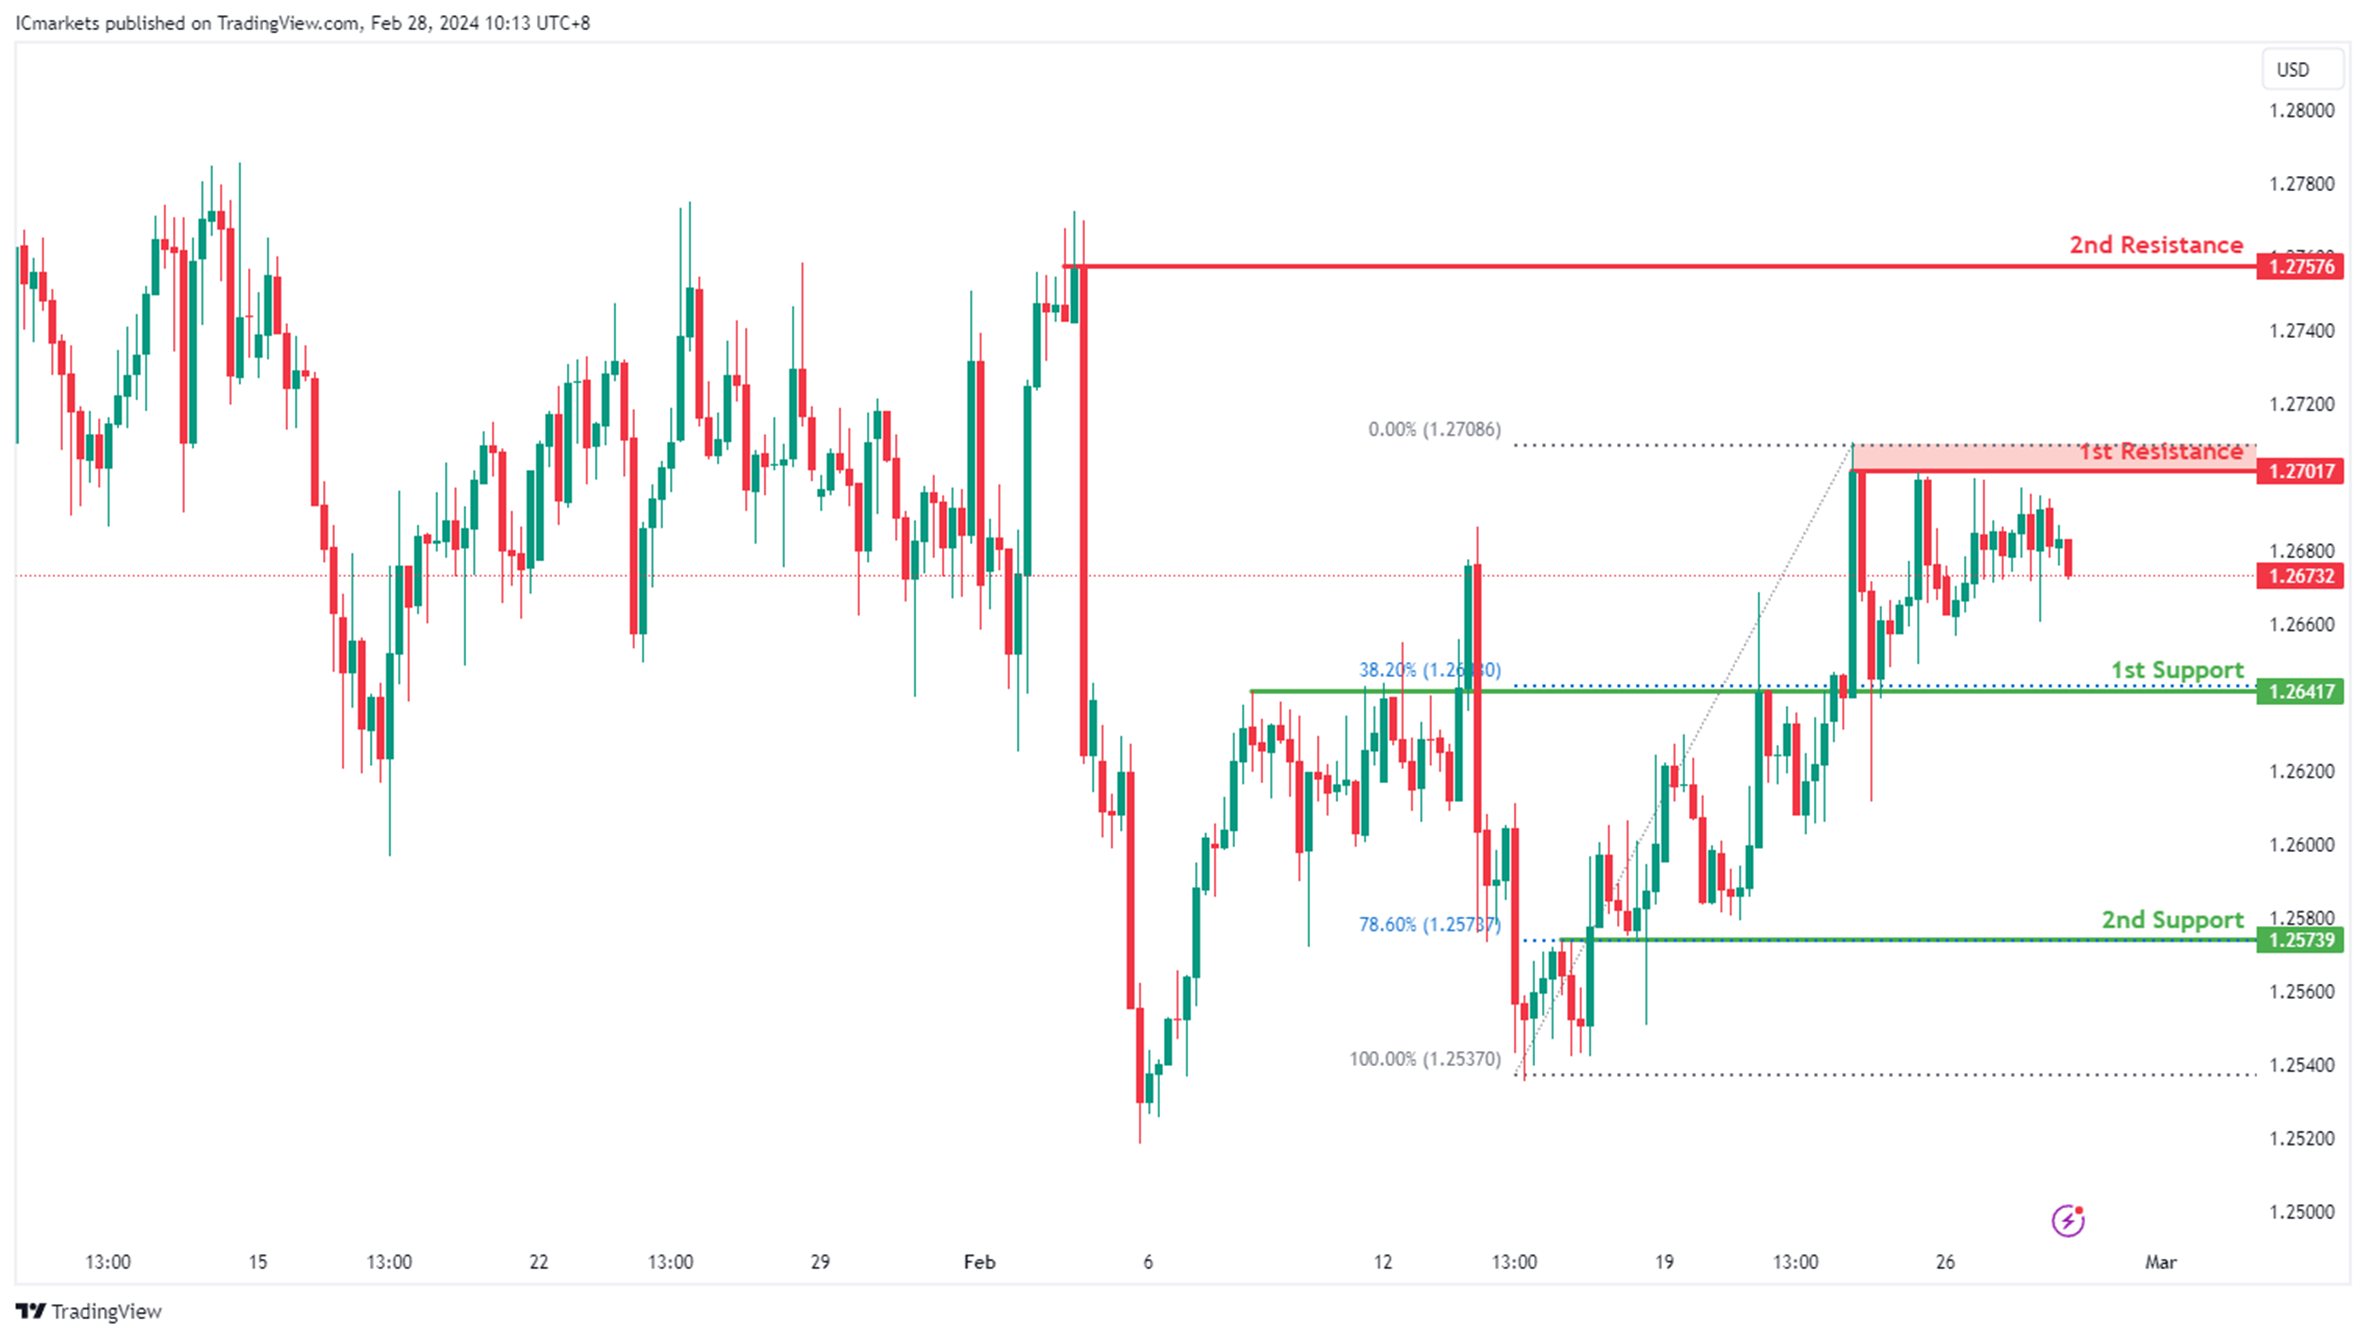
GBP/USD:
The GBP/USD chart currently exhibits an overall bullish momentum. However, there is a potential scenario for price to fall towards the 1st support before resuming the uptrend.
The 1st support level at 1.2641 is identified as an overlap support that aligns with the 38.20% Fibonacci Retracement level. Further below, the 2nd support level at 1.2573 is also marked as an overlap support that aligns with the 78.60% Fibonacci Retracement level, further emphasizing its importance as a potential support zone.
To the upside, the 1st resistance level at 1.2701 is identified as a pullback resistance. Higher up, the 2nd resistance level at 1.2757 is also noted as a pullback resistance, further highlighting its importance as a potential resistance point.
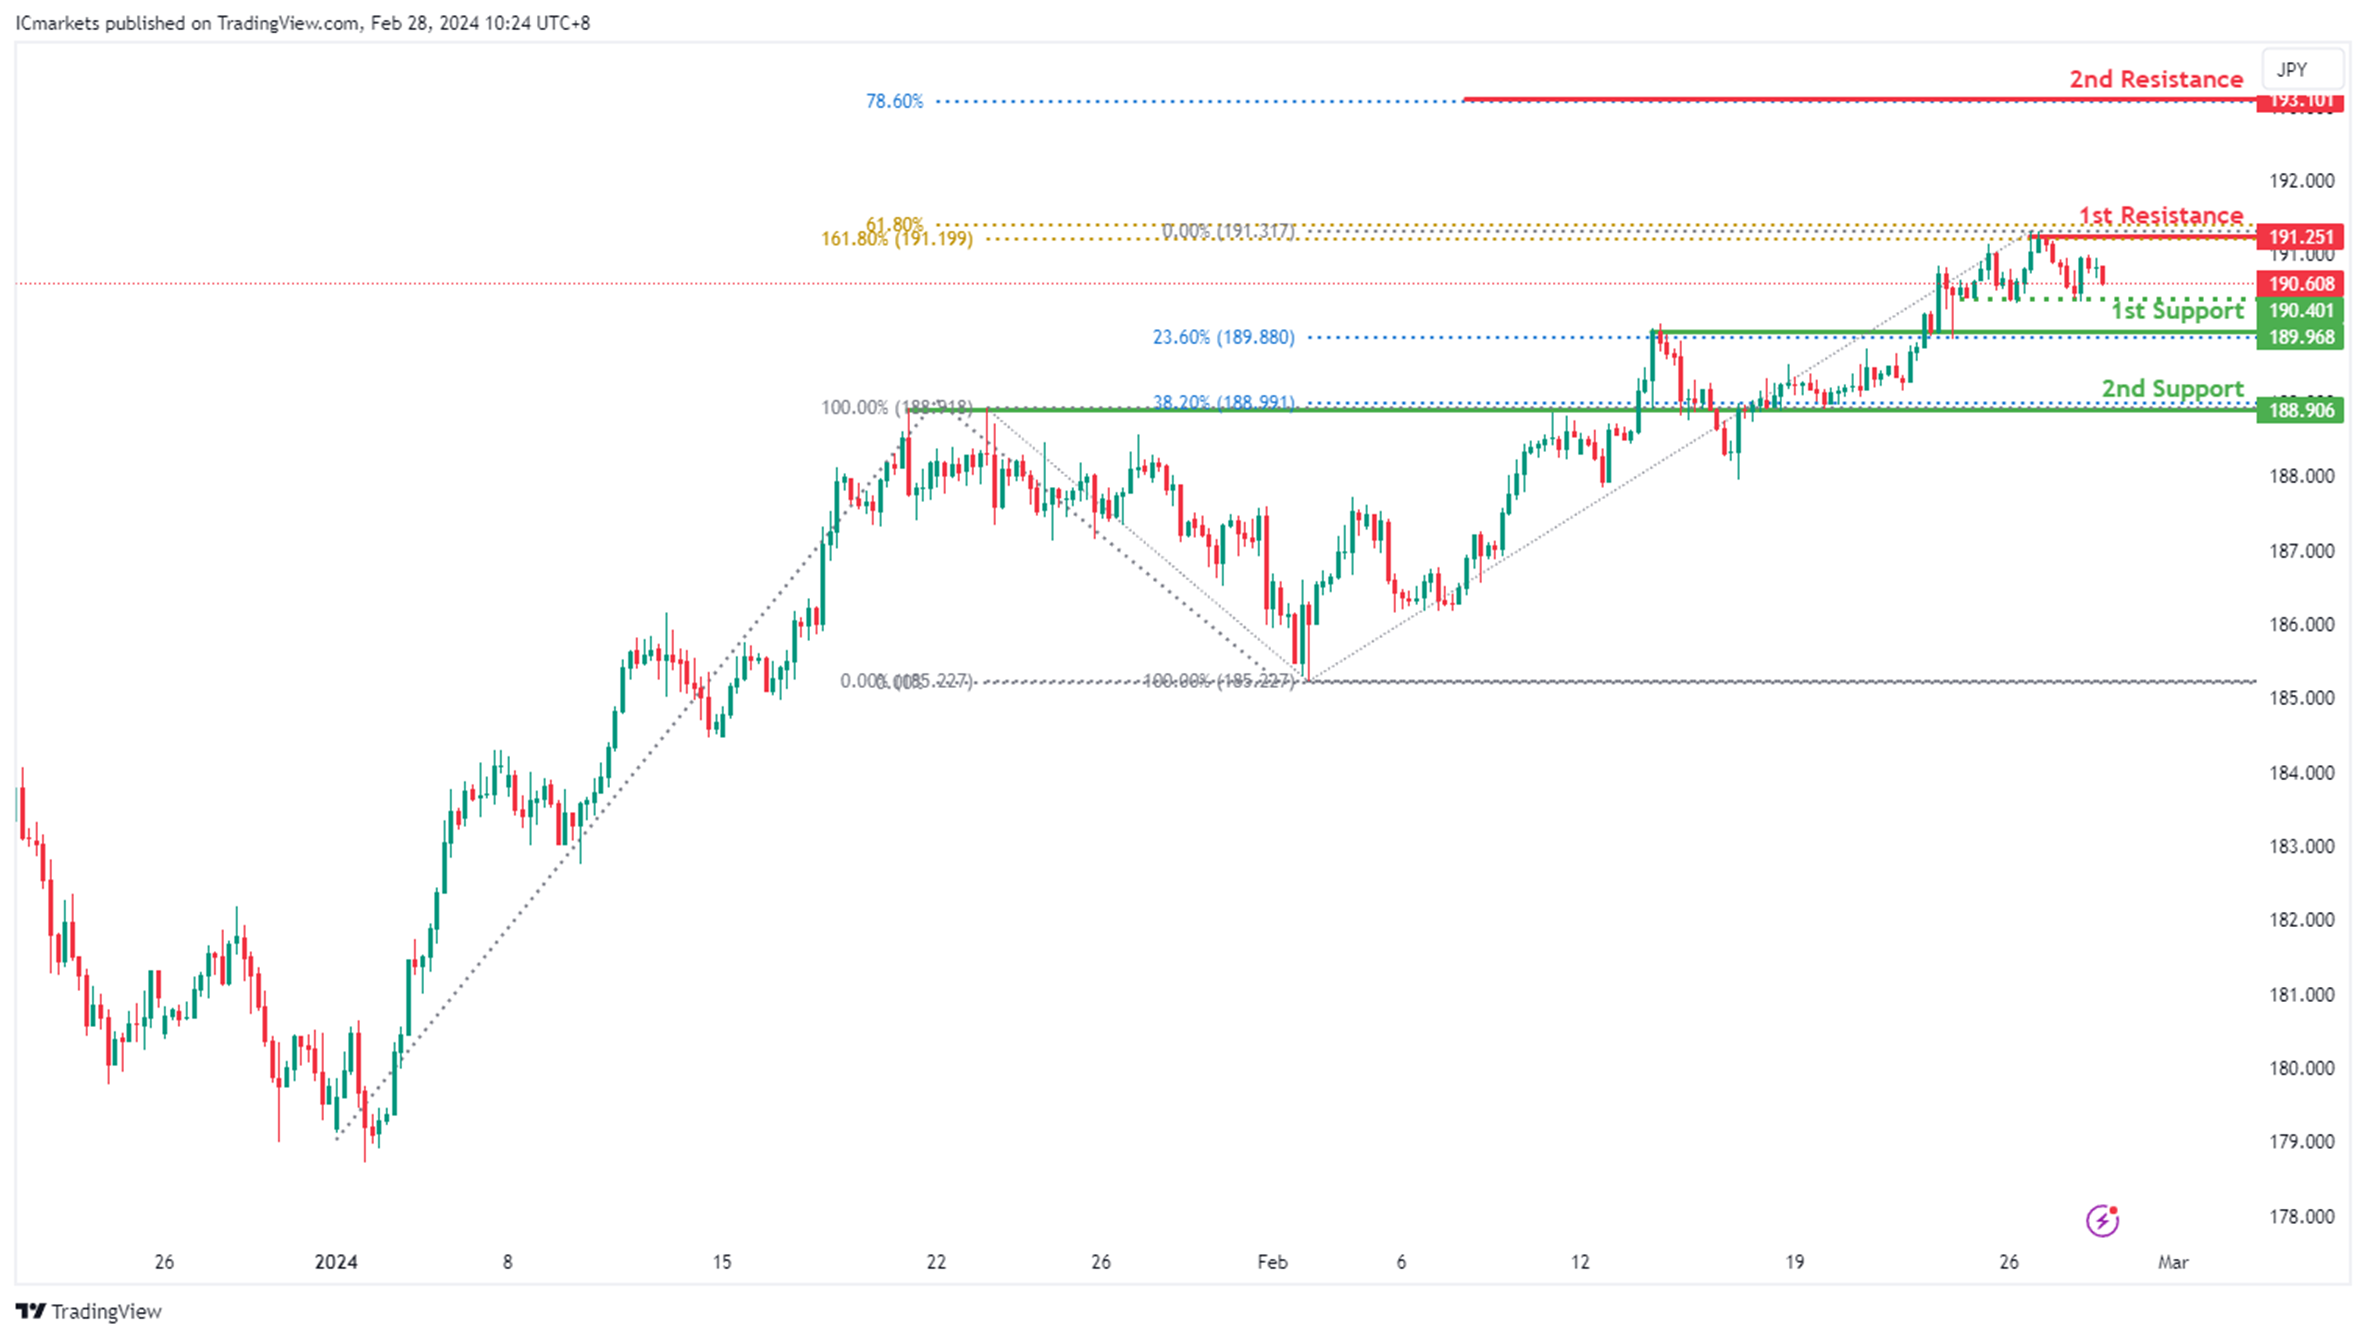
GBP/JPY:
The GBP/JPY chart currently exhibits an overall bullish momentum. However, there is a potential scenario for price to fall towards the intermediate support before resuming the uptrend.
The intermediate support level at 190.40 is identified as a pullback support while the 1st support level at 189.96 is noted as an overlap support that aligns with the 23.60% Fibonacci Retracement level. Further below, the 2nd support level at 188.90 is also marked as an overlap support that aligns with the 38.20% Fibonacci Retracement level, further emphasizing its importance as a potential support zone.
To the upside, the 1st resistance level at 191.25 is identified as a pullback resistance that aligns with a confluence of Fibonacci levels i.e. the 61.80% Projection and the 161.80% Extension. Higher up, the 2nd resistance level at 193.10 is noted as a resistance that aligns with the 78.60% Fibonacci Projection, further highlighting its importance as a potential resistance point.
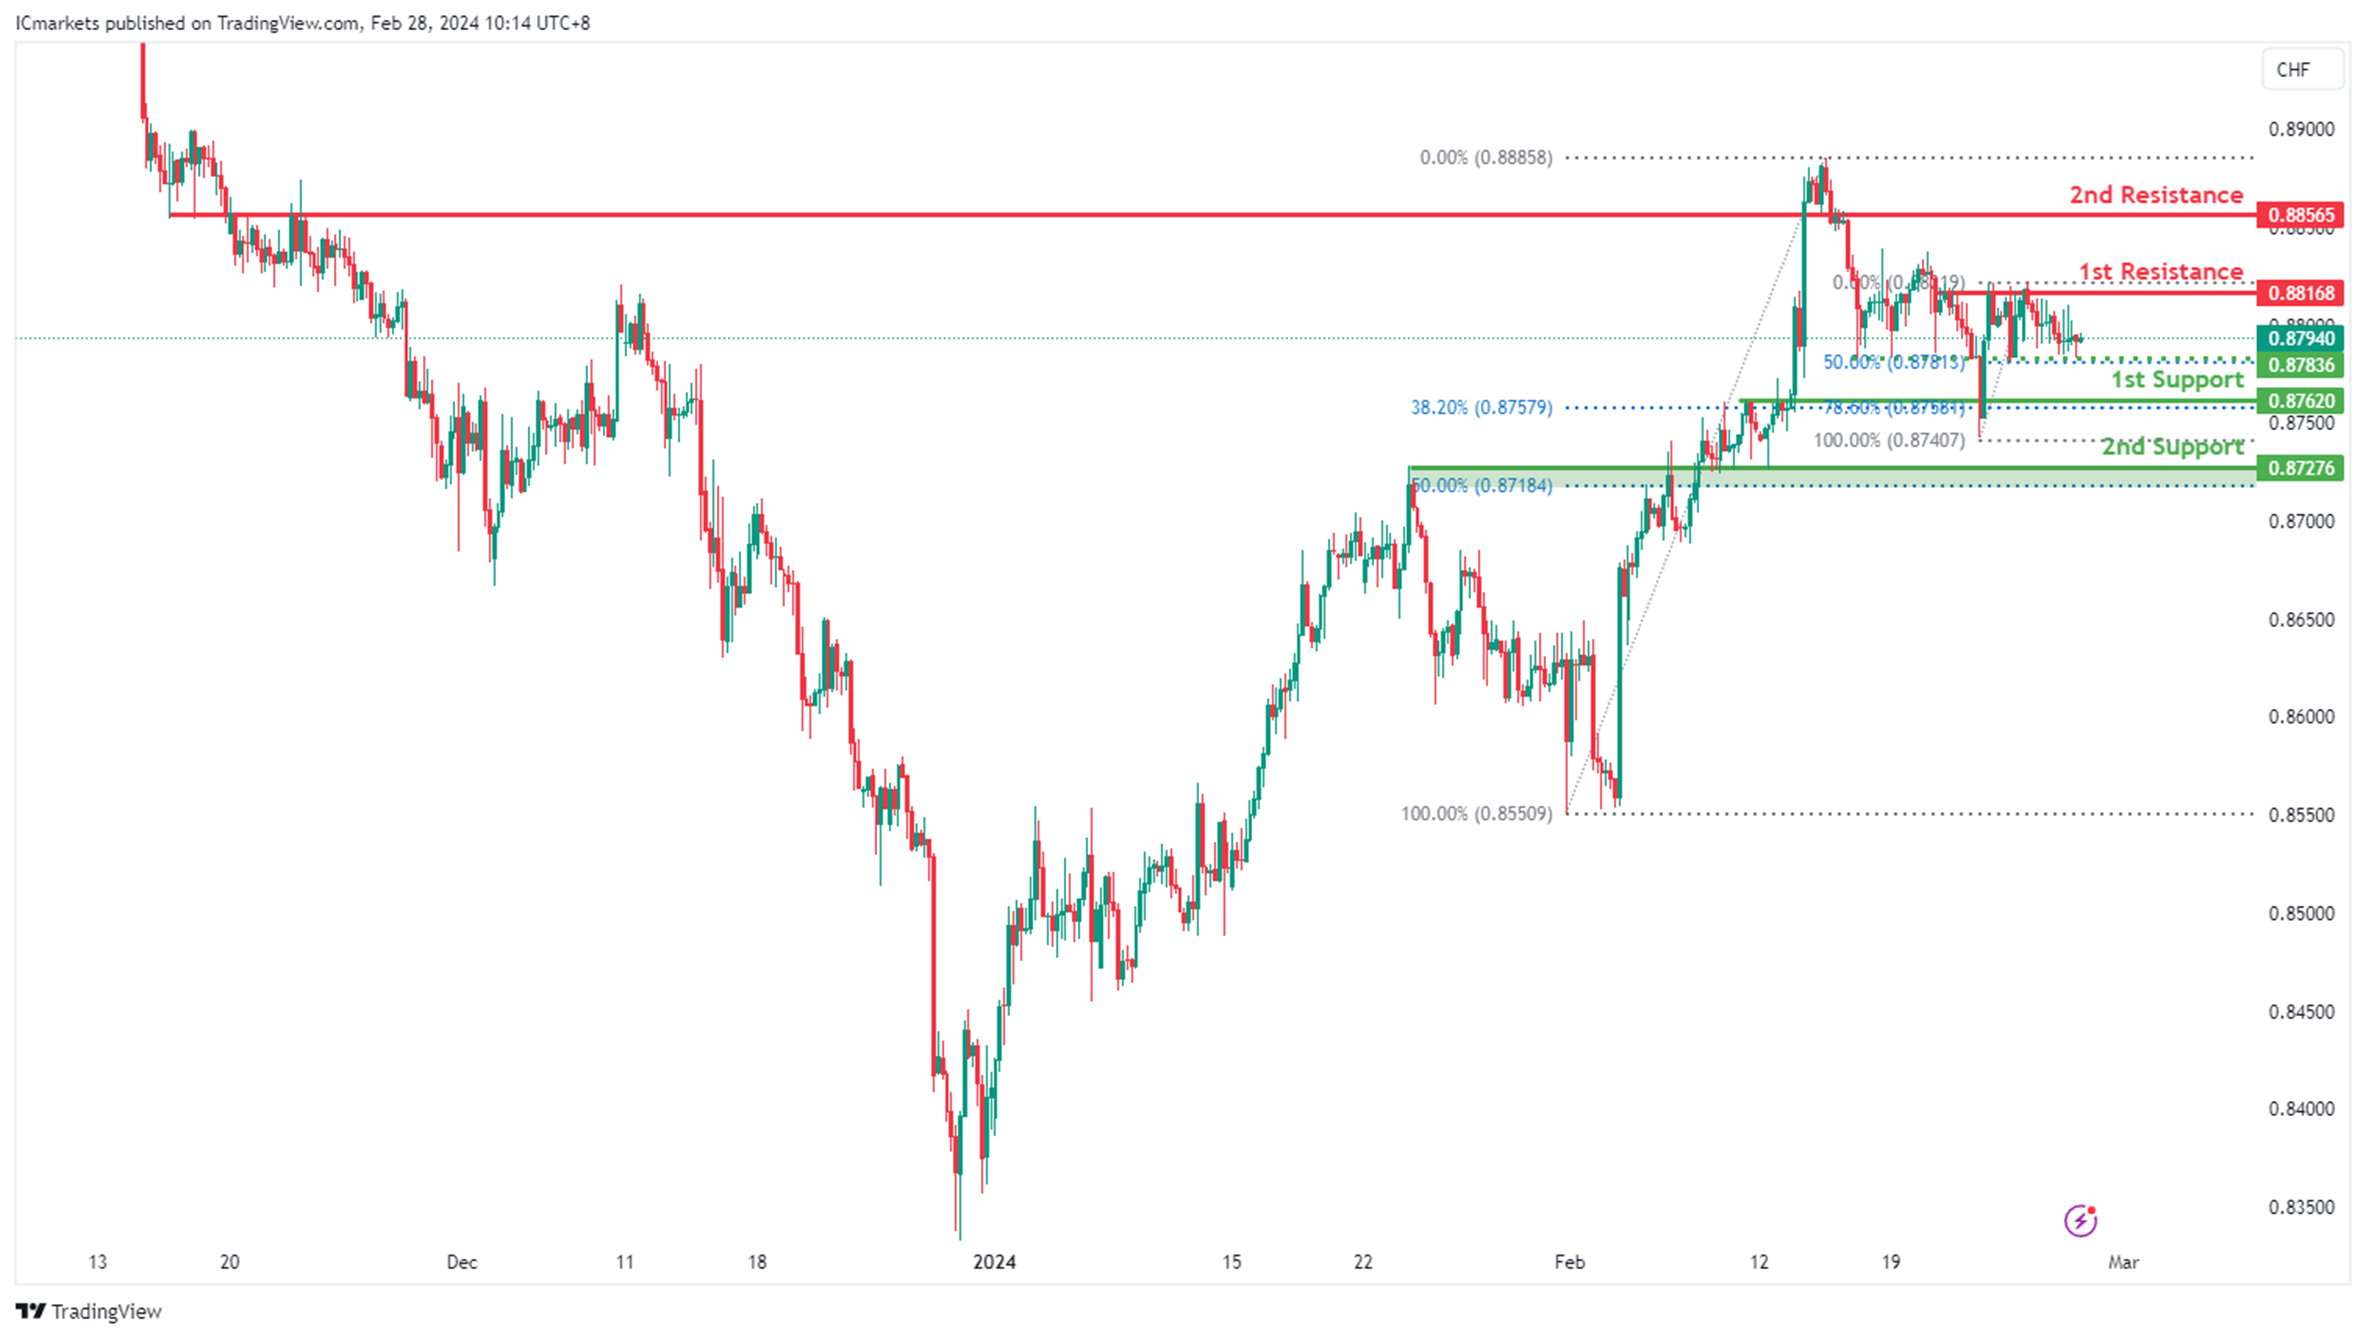
USD/CHF:
The USD/CHF chart currently exhibits a neutral bias. In this context, there is a potential scenario for price to fluctuate between the 1st support and the 1st resistance.
The 1st support level at 0.8762 is identified as an overlap support that aligns with the 38.20% Fibonacci Retracement level. Further below, the 2nd support level at 0.8727 is also marked as an overlap support that aligns close to the 50.00% Fibonacci Retracement level, further emphasizing its importance as a potential support zone.
To the upside, the 1st resistance level at 0.8816 is identified as a pullback resistance. Higher up, the 2nd resistance level at 0.8856 is noted as an overlap resistance, further highlighting its importance as a potential resistance point.
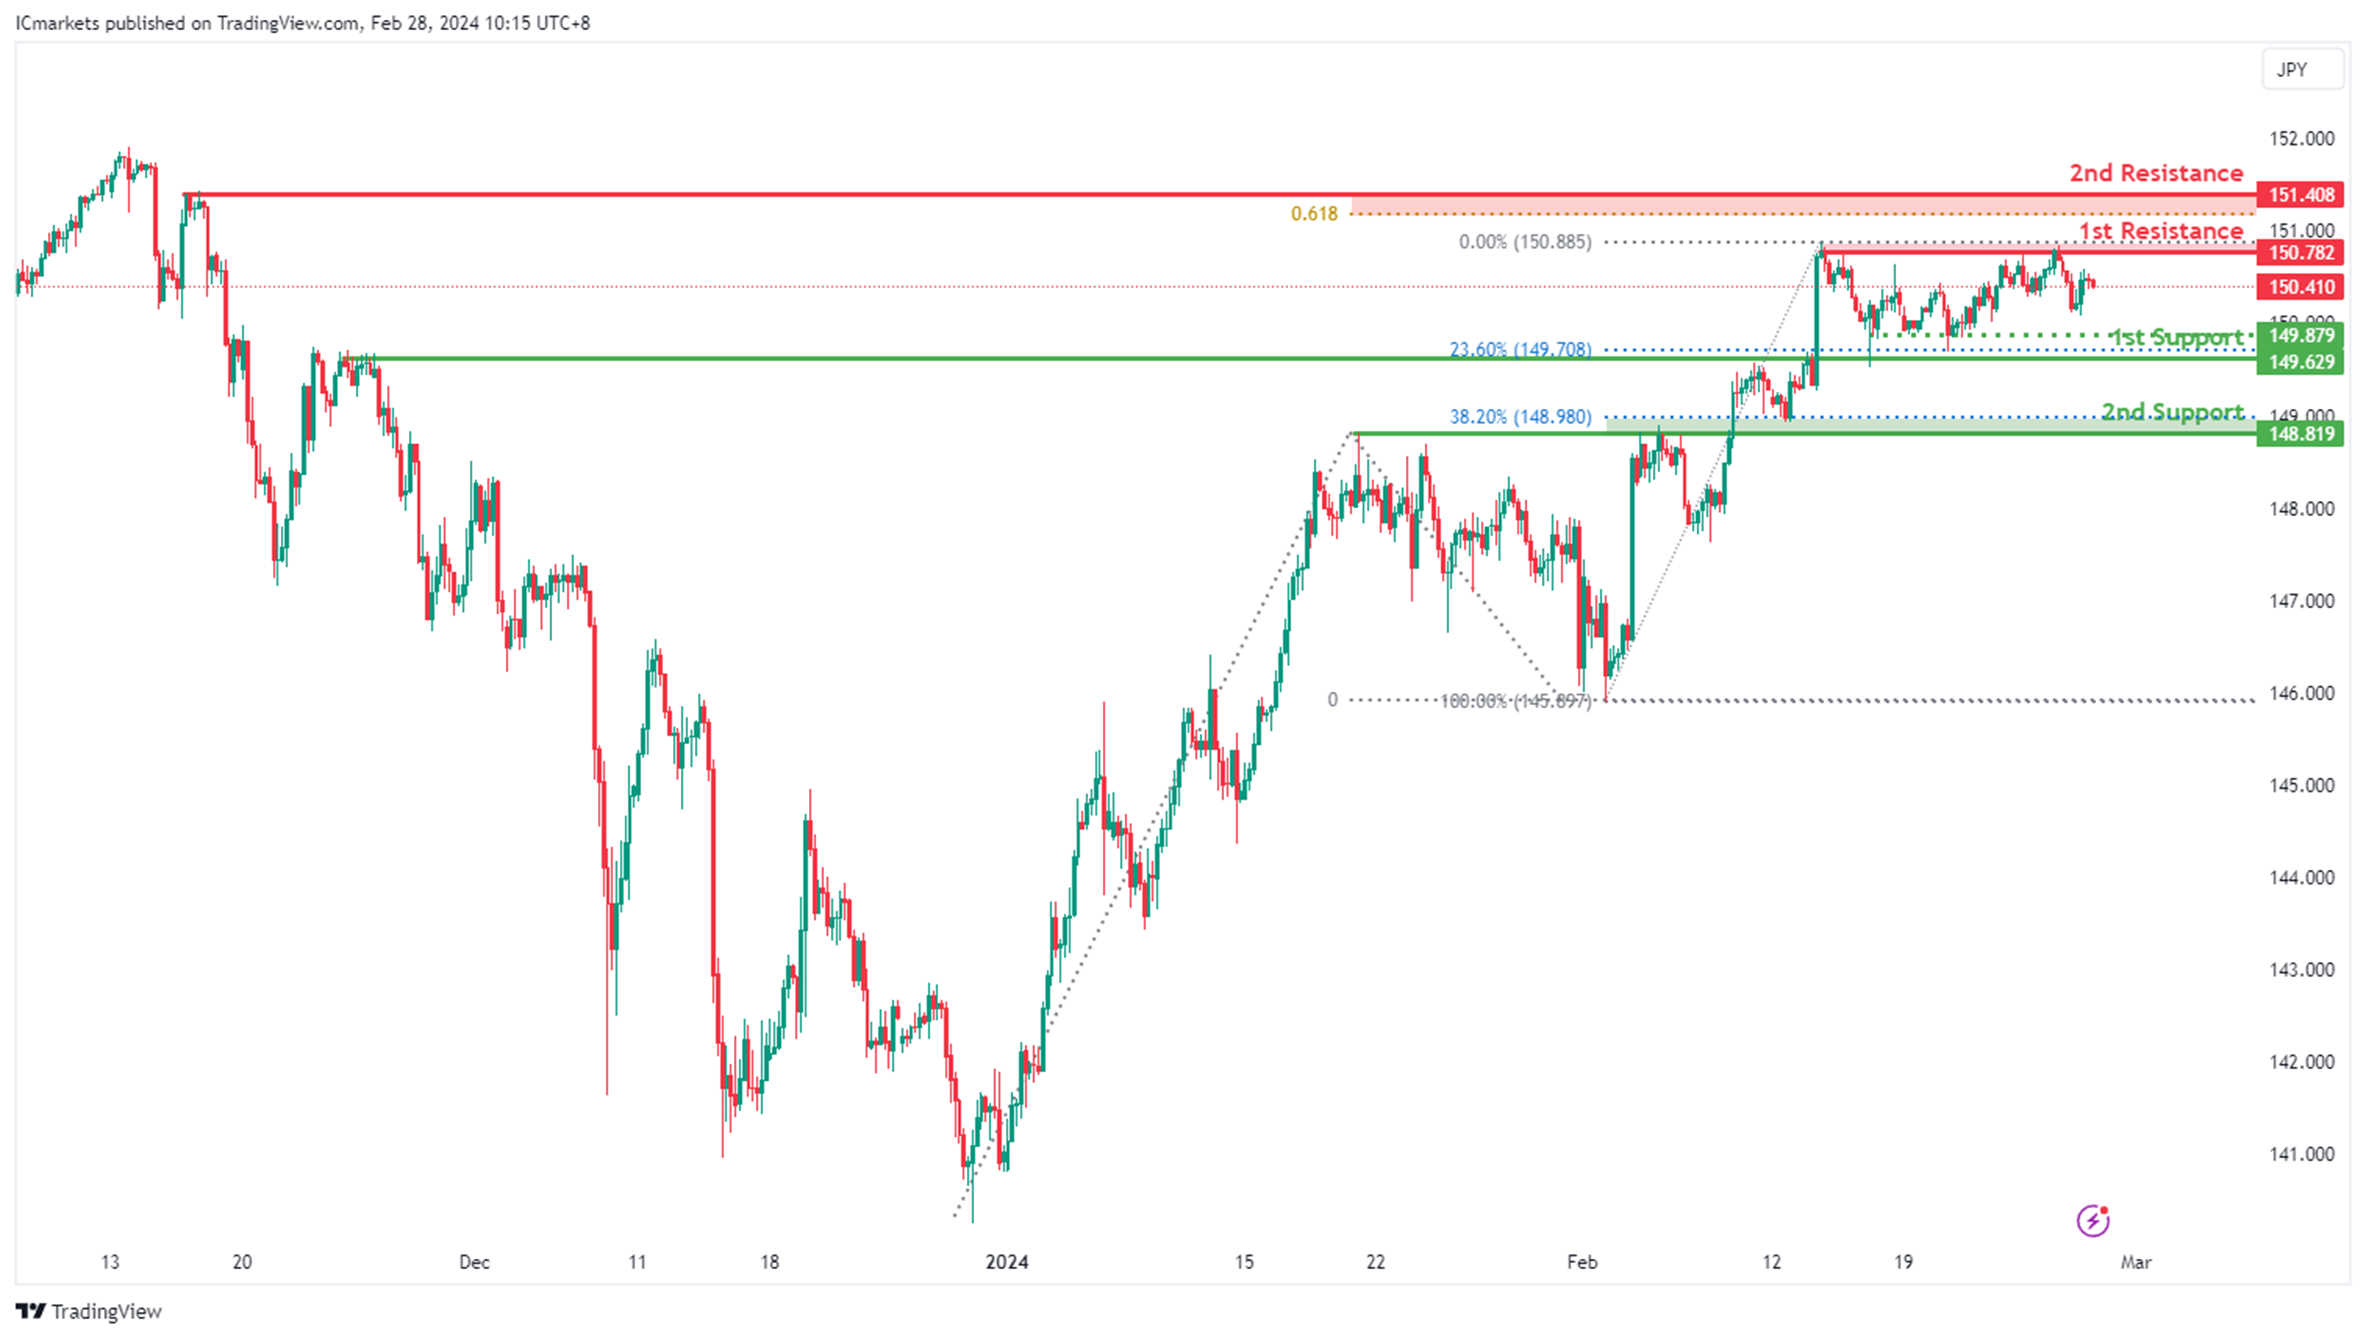
USD/JPY:
The USD/JPY chart currently exhibits a neutral bias. In this context, there is a potential scenario for price to fluctuate between the 1st support and the 1st resistance.
The 1st support level at 149.62 is identified as an overlap support that aligns with the 23.60% Fibonacci Retracement level. Further below, the 2nd support level at 148.81 is also marked as an overlap support that aligns close to the 38.20% Fibonacci Retracement level, further emphasizing its importance as a potential support zone.
To the upside, the 1st resistance level at 150.78 is identified as a pullback resistance. Higher up, the 2nd resistance level at 151.40 is also noted as a pullback resistance that aligns close to the 61.80% Fibonacci Projection level, further highlighting its importance as a potential resistance point.
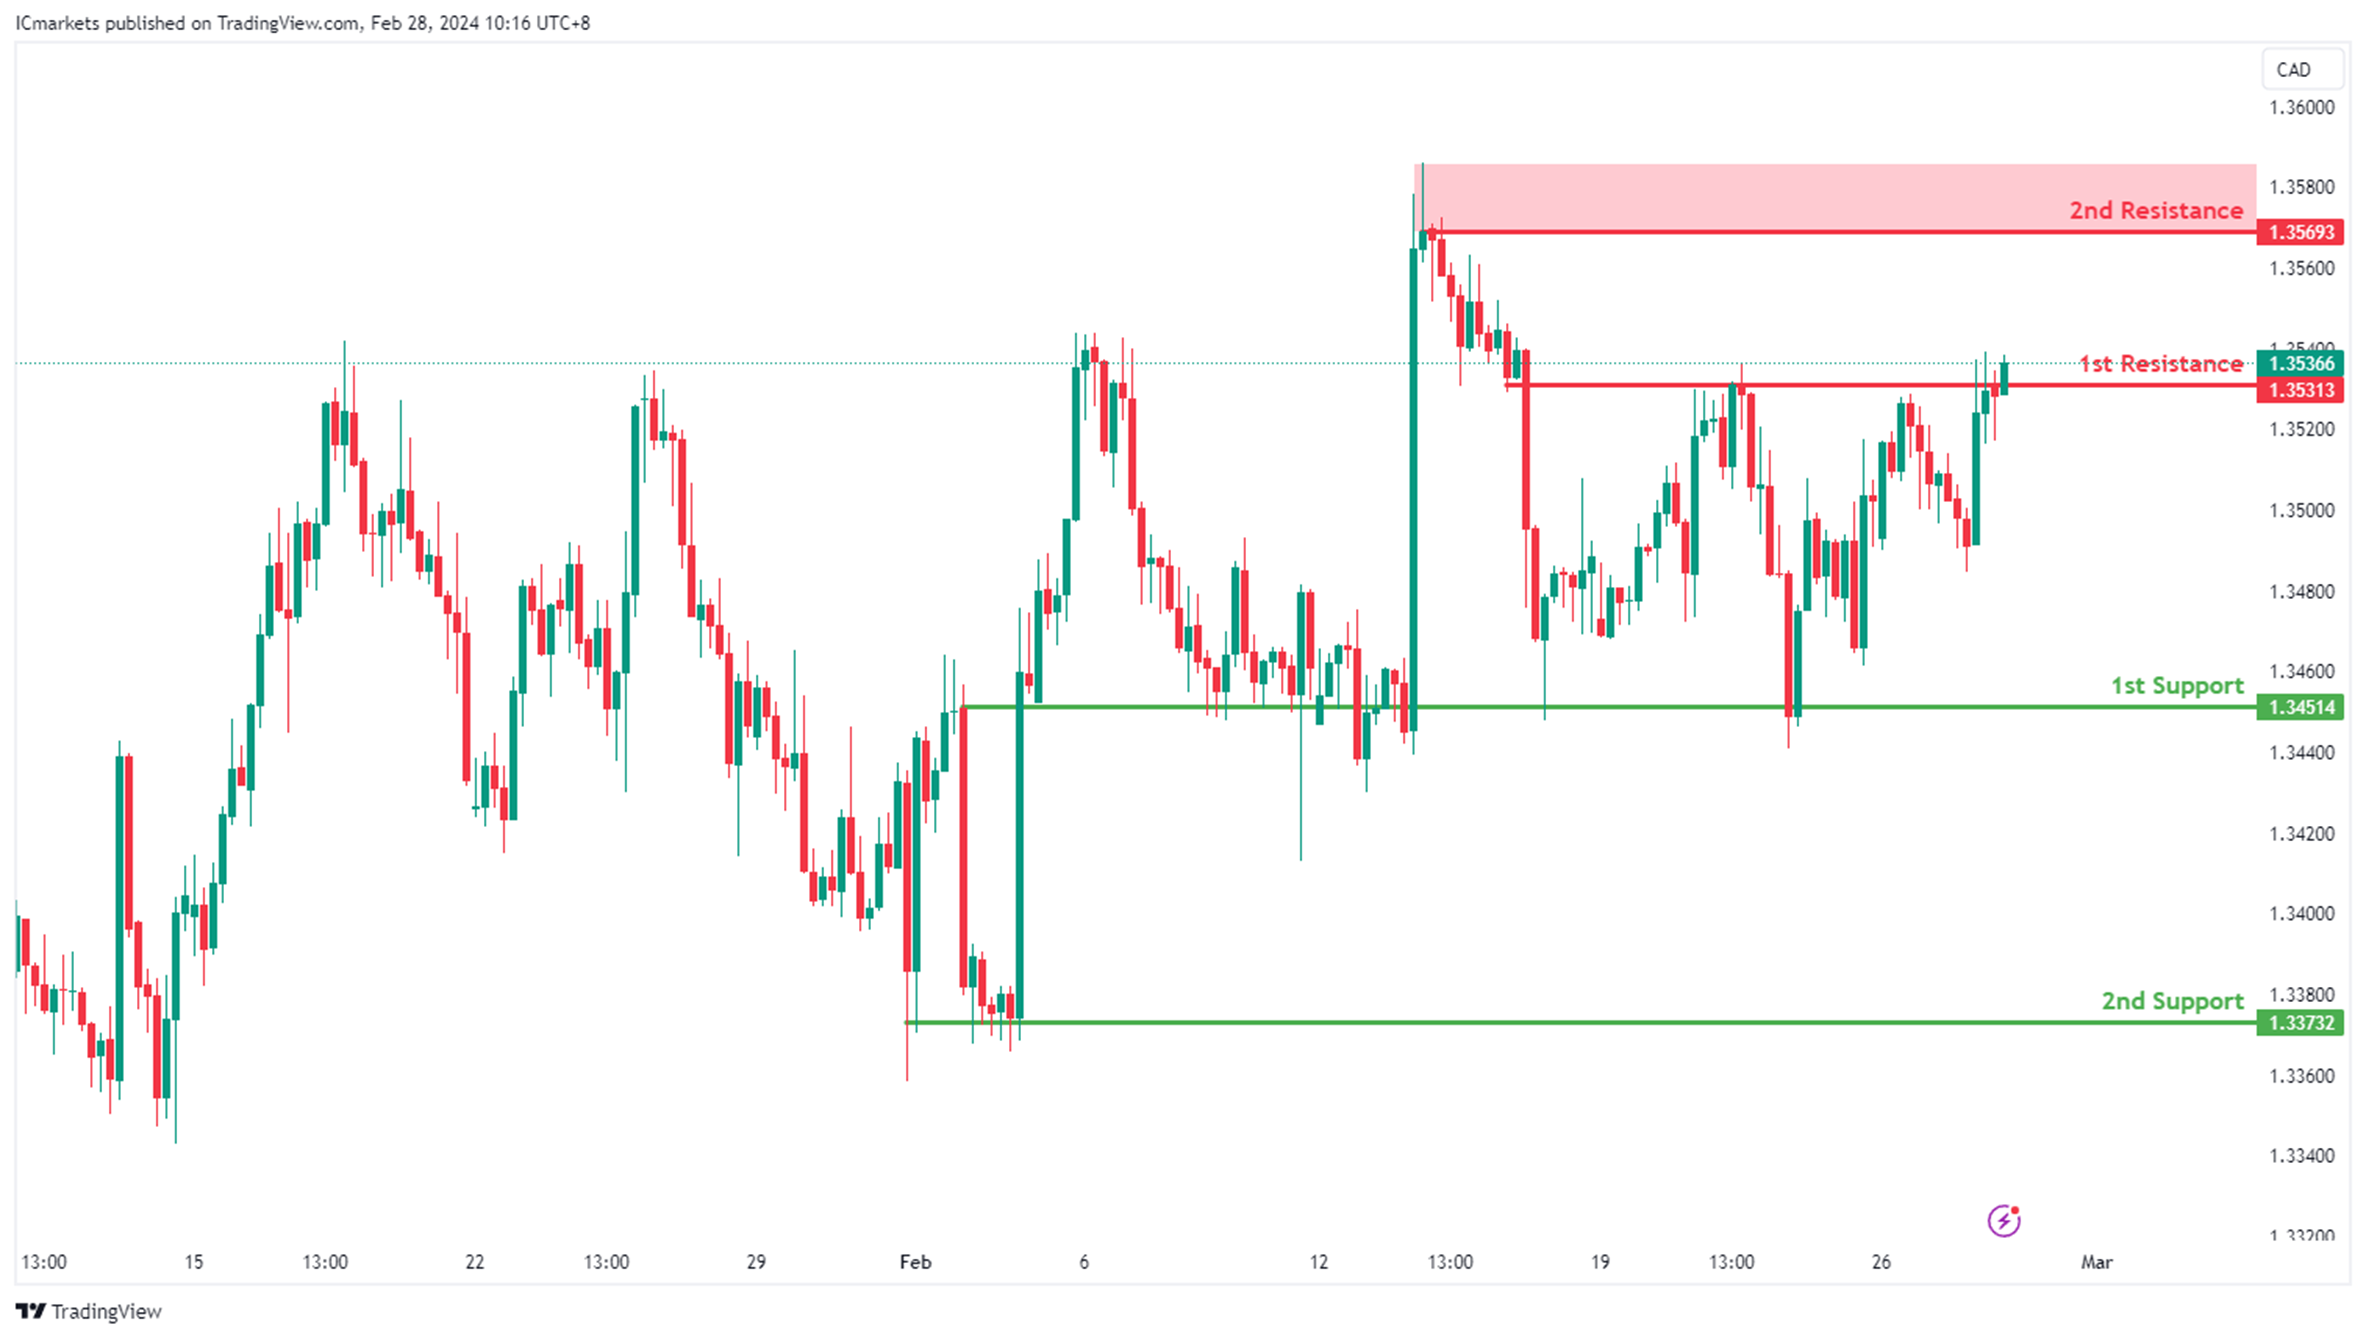
USD/CAD:
The USD/CAD chart currently exhibits an overall bullish momentum. In this context, there is a potential scenario for price to break above the 1st resistance and rise towards the 2nd resistance.
The 1st resistance level at 1.3531 is identified as an overlap resistance. Higher up, the 2nd resistance level at 1.3569 is marked as a pullback resistance, further highlighting its importance as a potential resistance zone.
To the downside, the 1st support level at 1.3451 is identified as an overlap support. Further below, the 2nd support level at 1.3373 is marked as a pullback support, reinforcing its significance as a key support level.
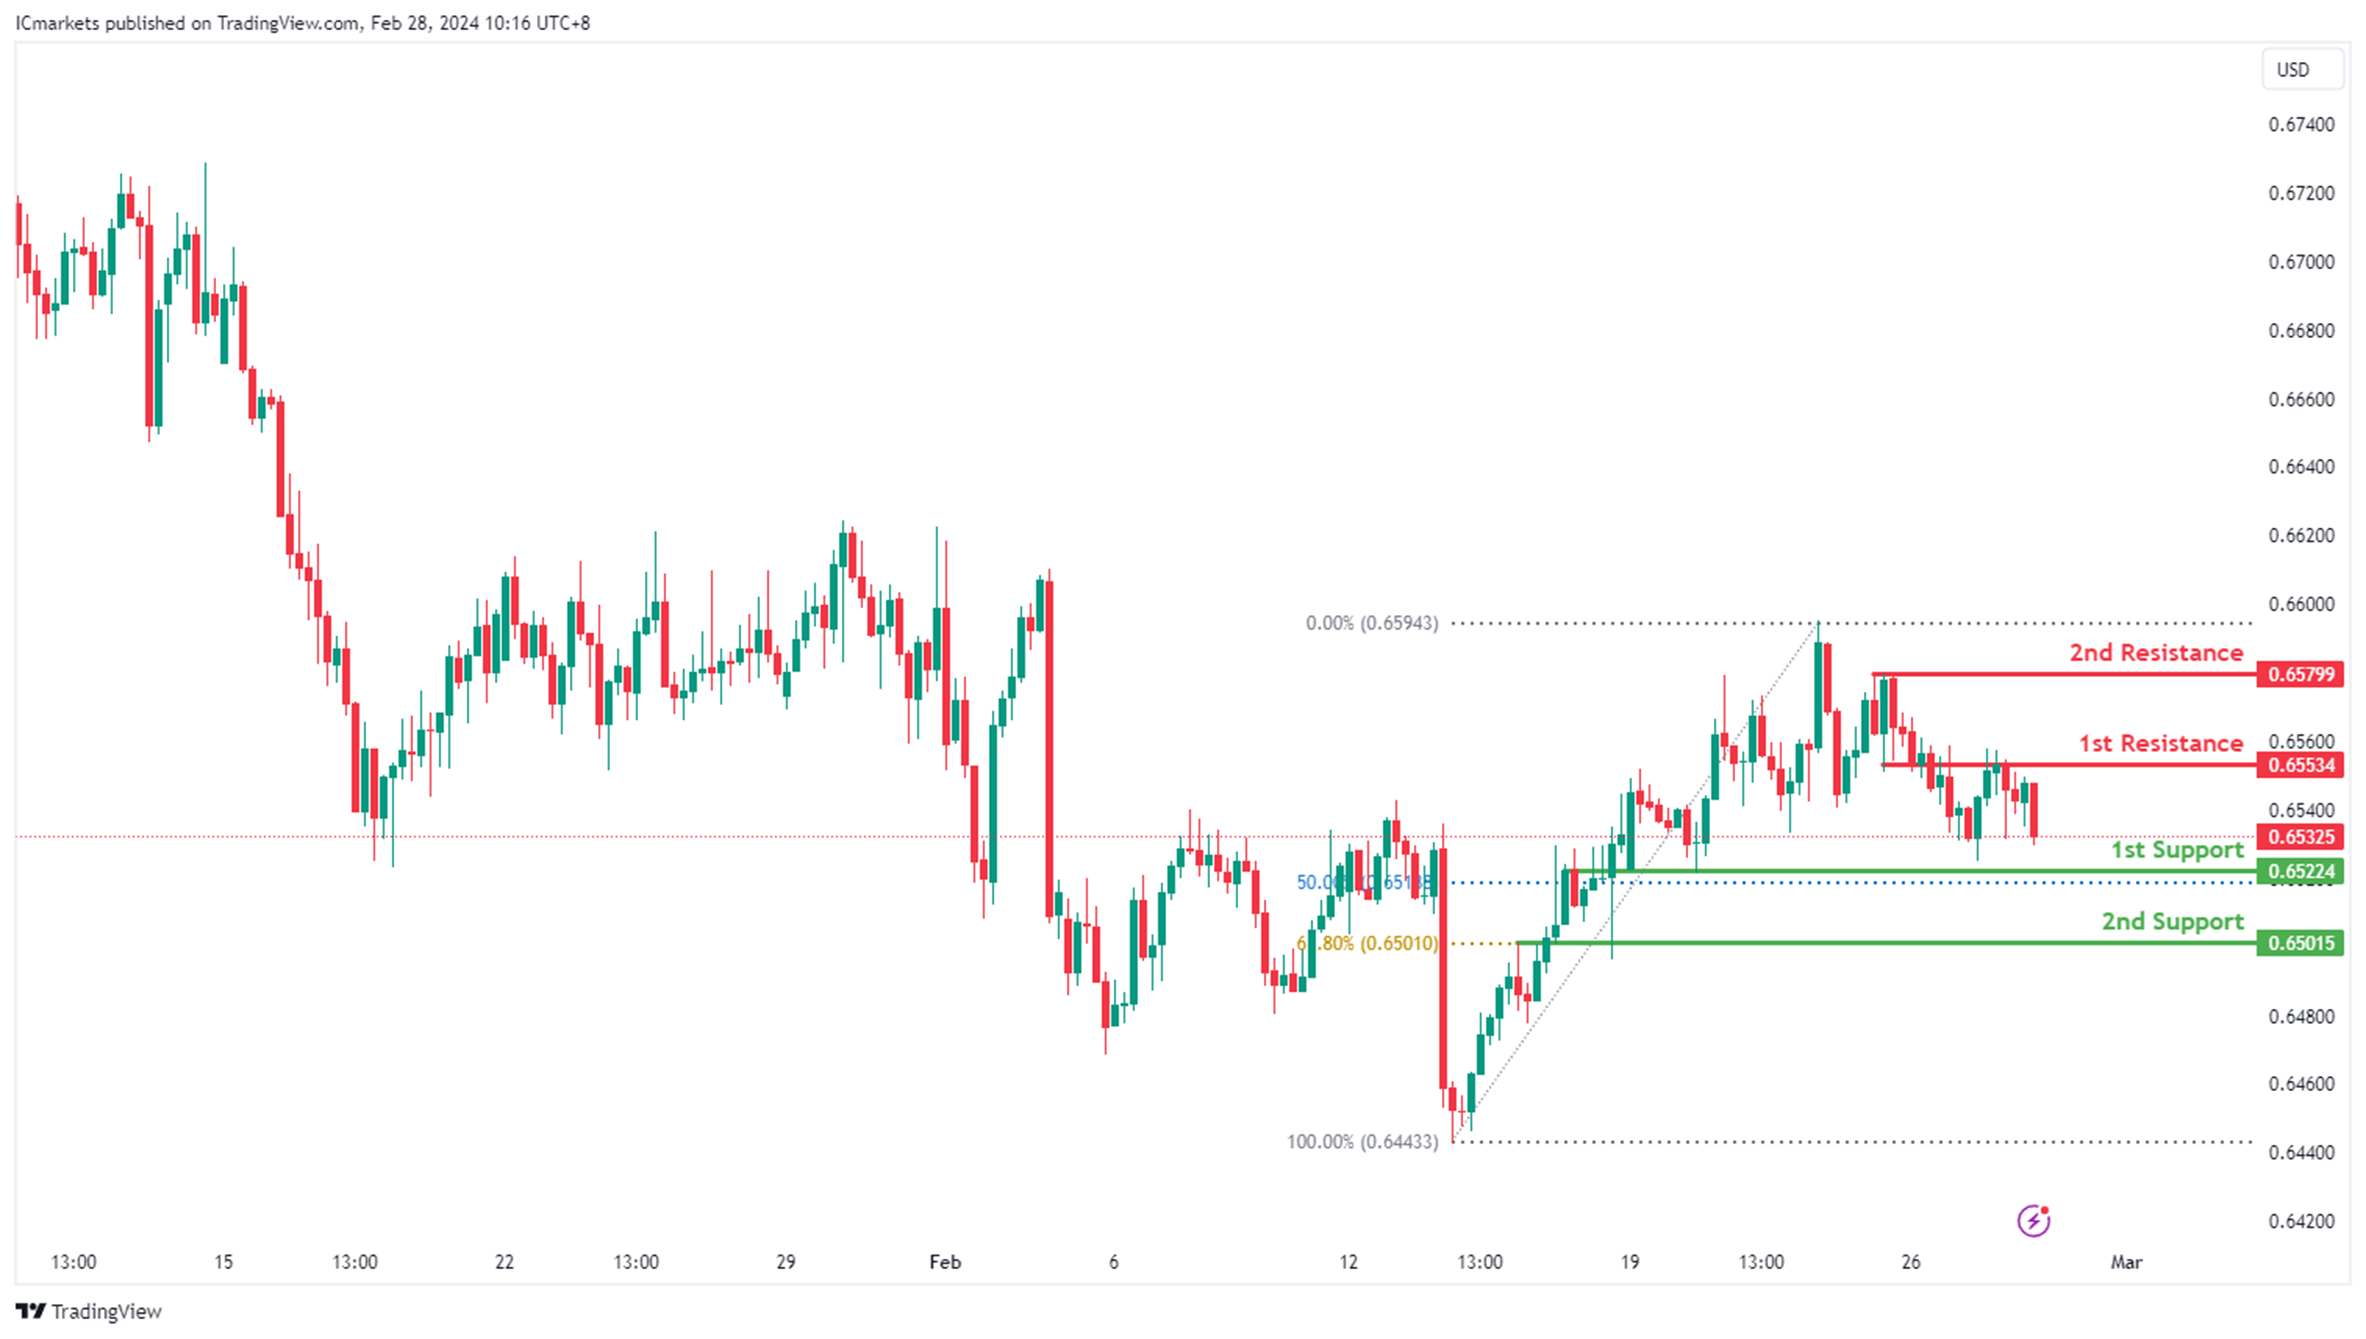
AUD/USD:
The AUD/USD chart currently exhibits an overall bearish momentum. In this context, there is a potential scenario for price to break below the 1st support and drop towards the 2nd support.
The 1st support level at 0.6522 is identified as an overlap support that aligns with the 50.00% Fibonacci Retracement level. Further below, the 2nd support level at 0.6501 is also marked as an overlap support that aligns with the 61.80% Fibonacci Retracement levels, further emphasizing its importance as a potential support zone.
To the upside, the 1st resistance level at 0.6553 is identified as an overlap resistance. Higher up, the 2nd resistance level at 0.6579 is noted as a pullback resistance, further highlighting its importance as a potential resistance point.
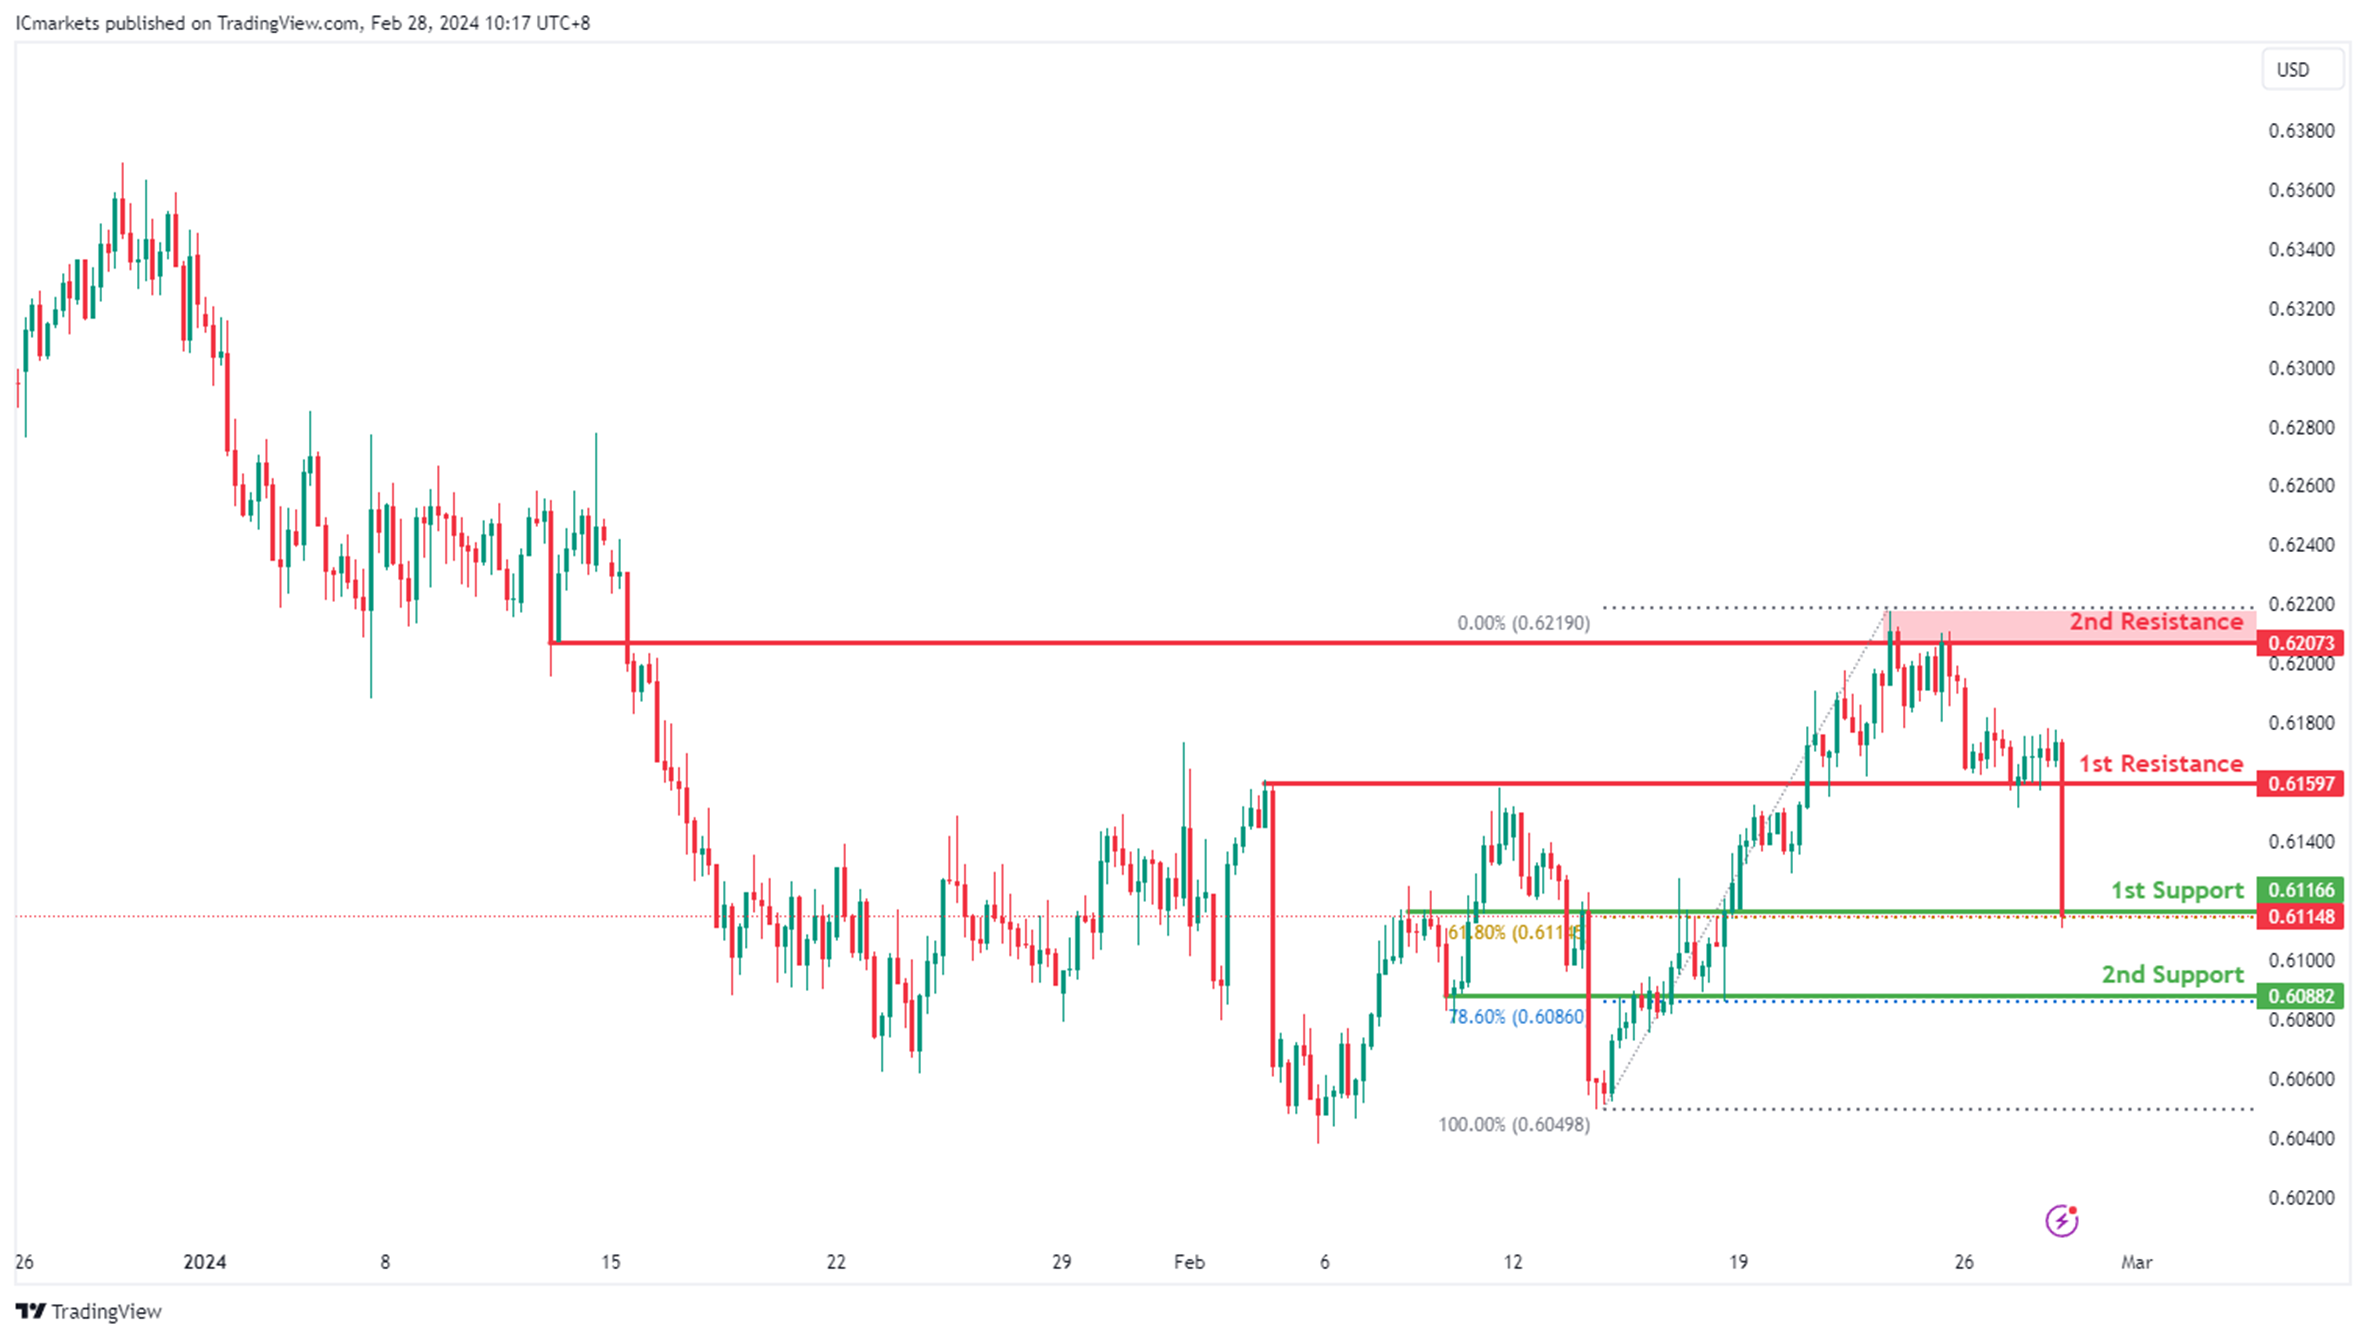
NZD/USD
The NZD/USD chart currently exhibits an overall bearish momentum. In this context, there is a potential scenario for price to break below the 1st support and drop towards the 2nd support.
The 1st support level at 0.6116 is identified as an overlap support that aligns with the 61.80% Fibonacci Retracement level. Further below, the 2nd support level at 0.6088 is also marked as an overlap support that aligns with the 78.60% Fibonacci Retracement level, further emphasizing its importance as a potential support zone.
To the upside, the 1st resistance level at 0.6159 is identified as an overlap resistance. Higher up, the 2nd resistance level at 0.6270 is also noted as an overlap resistance, further highlighting its importance as a potential resistance point.
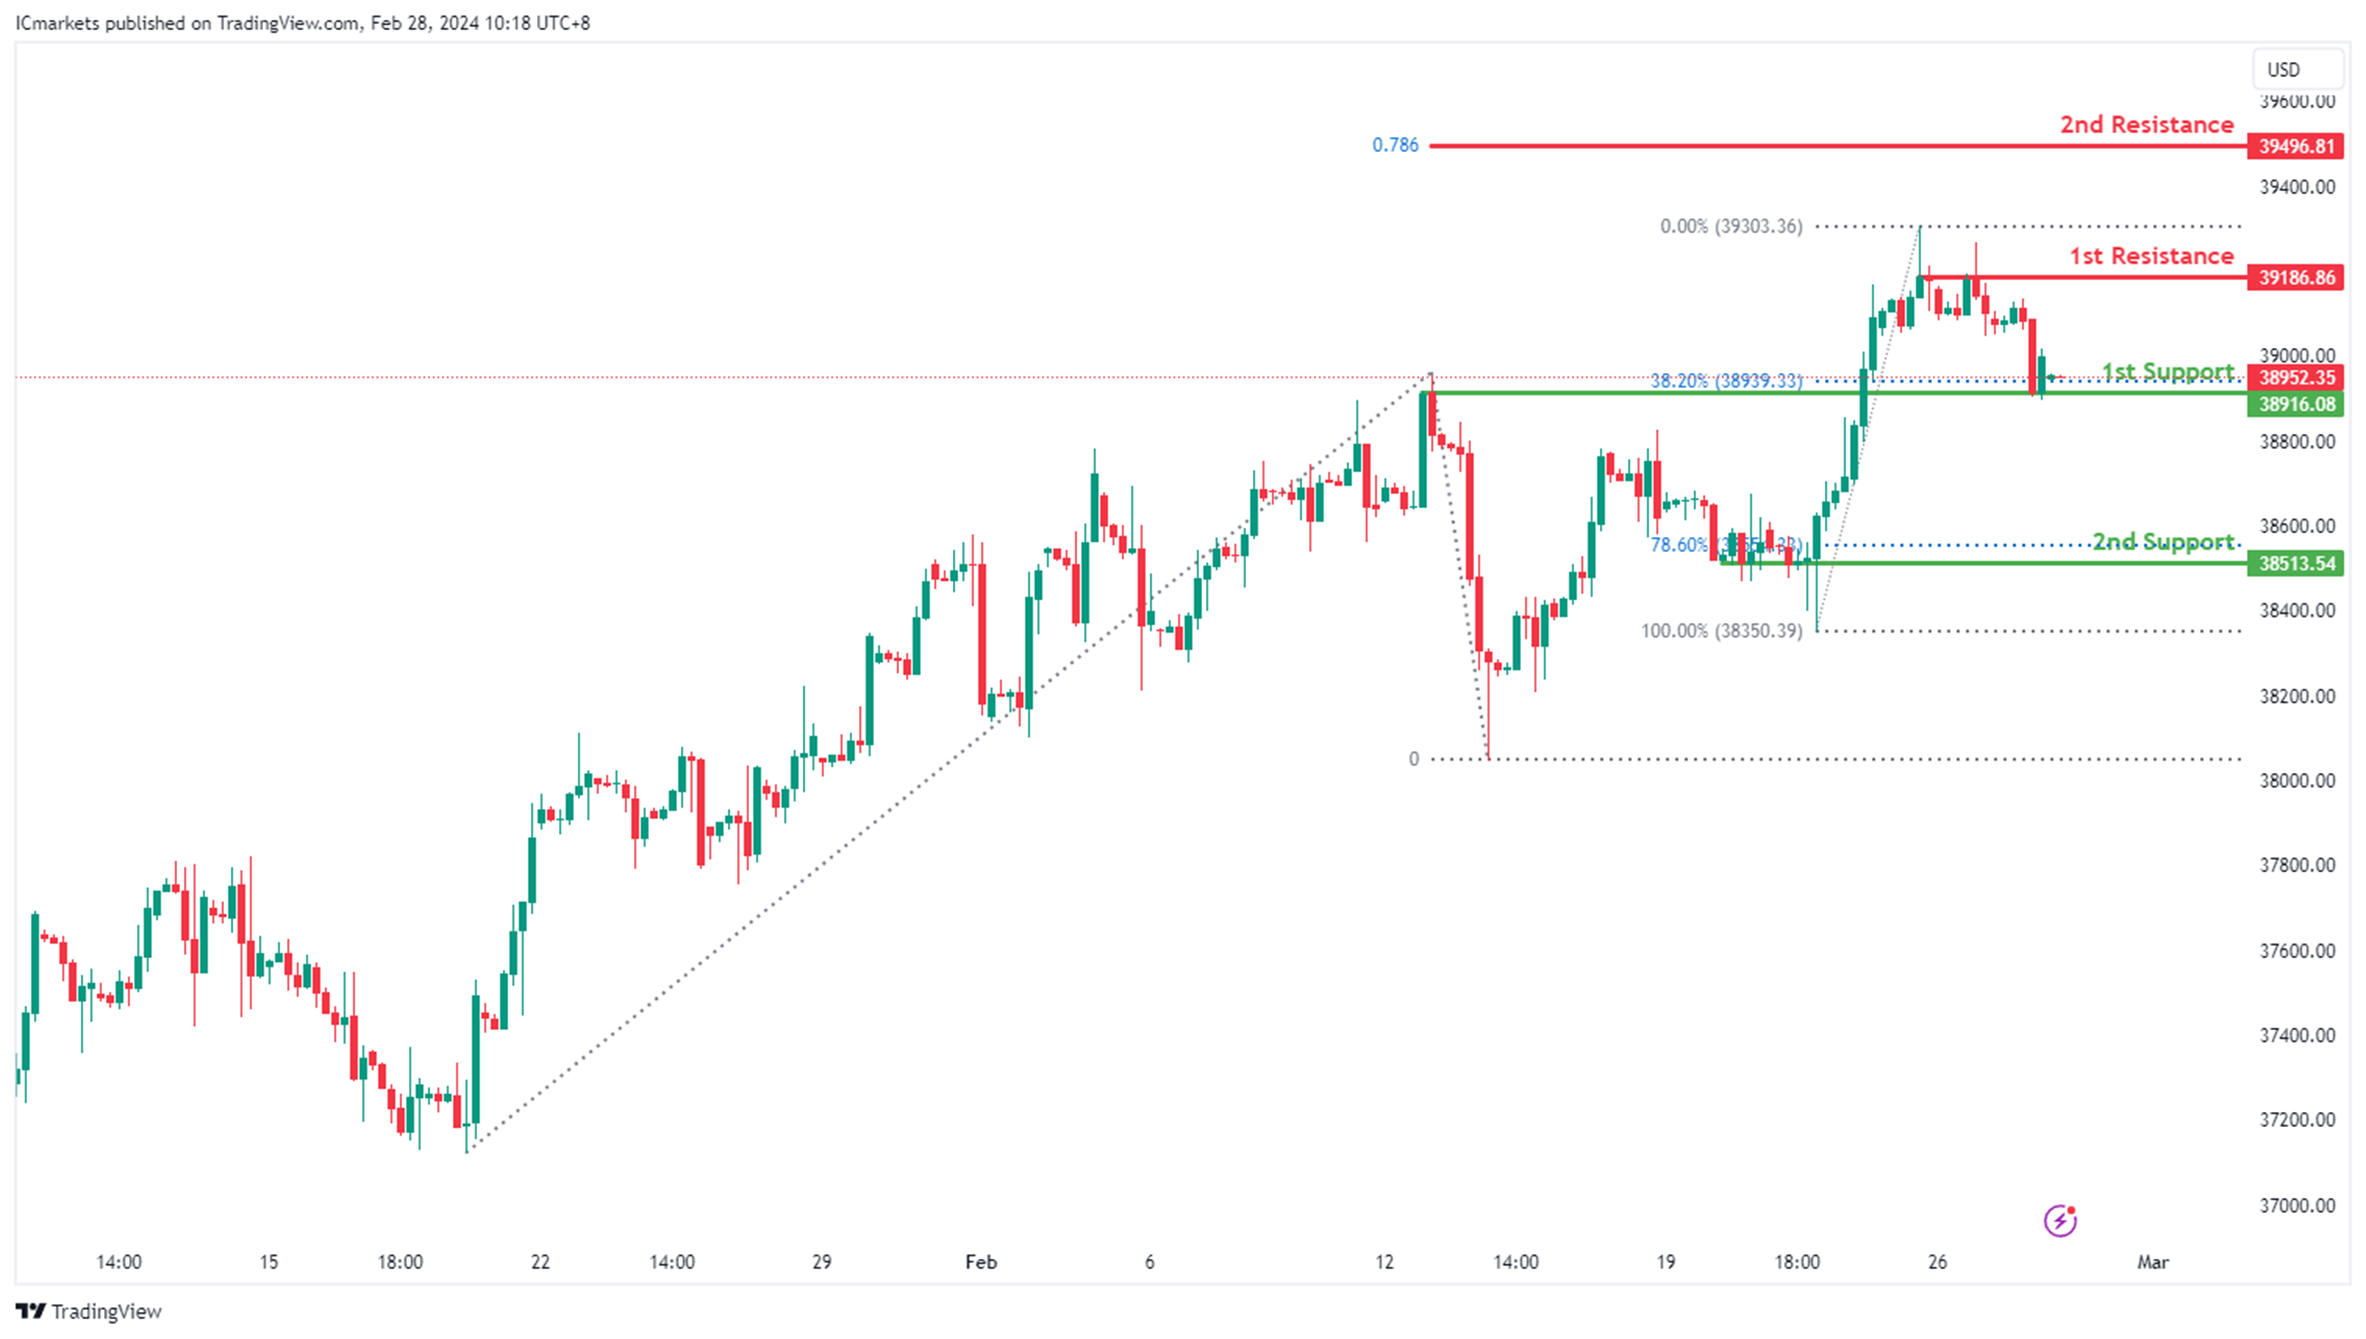
DJ30:
The DJ30 chart currently exhibits an overall bullish momentum. In this context, there is a potential scenario for price to make a bullish continuation towards the 1st resistance.
The 1st resistance level at 39,186.86 is identified as a pullback resistance. Higher up, the 2nd resistance level at 39,496.81 is noted as a resistance that aligns with the 78.60% Fibonacci Projection level, adding to its significance as a potential barrier to further bullish movement.
On the support side, the 1st support level at 38,916.08 is identified as an overlap support that aligns close to the 38.20% Fibonacci Retracement level. Further below, the 2nd support at 38,513.54 is marked as a pullback support that aligns close to the 78.60% Fibonacci Retracement level, further reinforcing its significance as a potential level of support.
GER40:
The GER40 chart currently demonstrates an overall bullish momentum, suggesting a potential continuation of the upward trend towards the 1st resistance.
The 1st resistance level at 17,834.20 is identified as a resistance that aligns with the 61.80% Fibonacci Projection level. Higher up, the 2nd resistance level at 18,244.54 is marked as a resistance that aligns with the 78.60% Fibonacci Projection level, adding to its significance as a potential barrier to further bullish movement.
On the support side, the intermediate support level at 17,372.90 is identified as a pullback support that aligns with the 23.60% Fibonacci Retracement level while the 1st support level at 17,179.53 is also marked as a pullback support that aligns with the 50.00% Fibonacci Retracement level. Additionally, the 2nd support level at 17,048.24 is noted as an overlap support, further reinforcing its importance as a potential area of support.

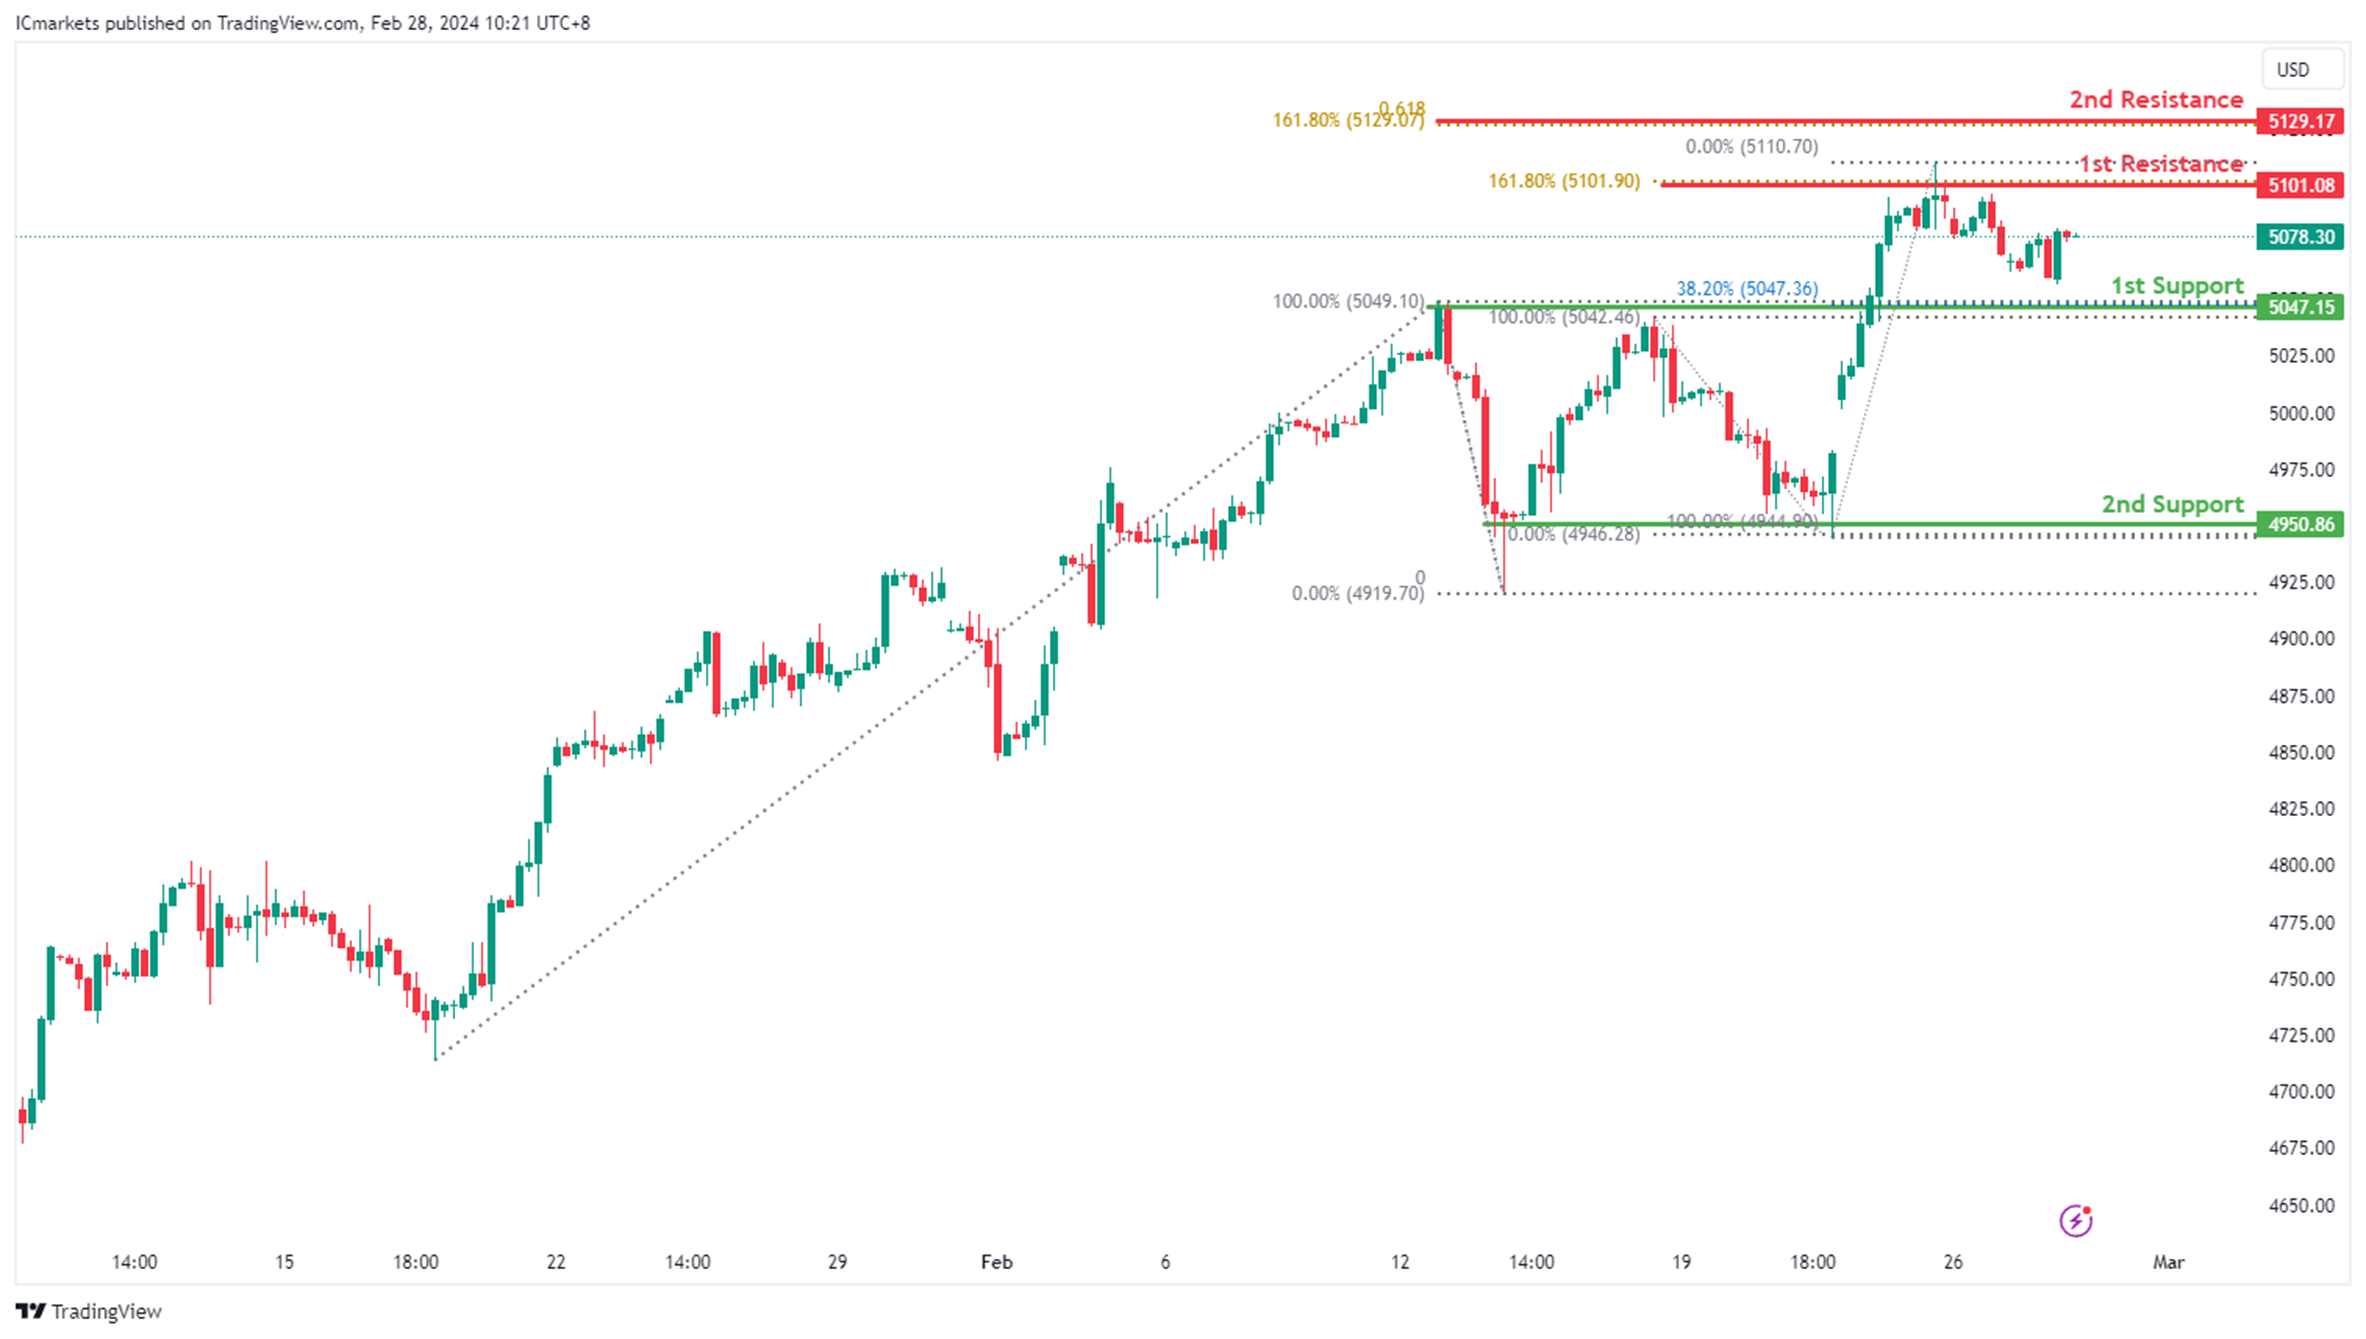
US500:
The US500 chart currently demonstrates an overall bullish momentum, suggesting a potential continuation of the upward trend towards the 1st resistance.
The 1st resistance level at 5,101.08 is identified as a pullback resistance that aligns with the 161.80% Fibonacci Extension level. Higher up, the 2nd resistance level at 5,129.17 is noted as a resistance that aligns with a confluence of Fibonacci levels i.e. the 61.80% Projection and the 161.80% Extension, adding to its significance as a potential barrier to further bullish movement.
On the support side, the 1st support level at 5,047.15 is identified as a pullback support that aligns with the 38.20% Fibonacci Retracement level. Further below, the 2nd support level at 4,950.86 is also marked as a pullback support, further reinforcing its significance as a potential area of support.
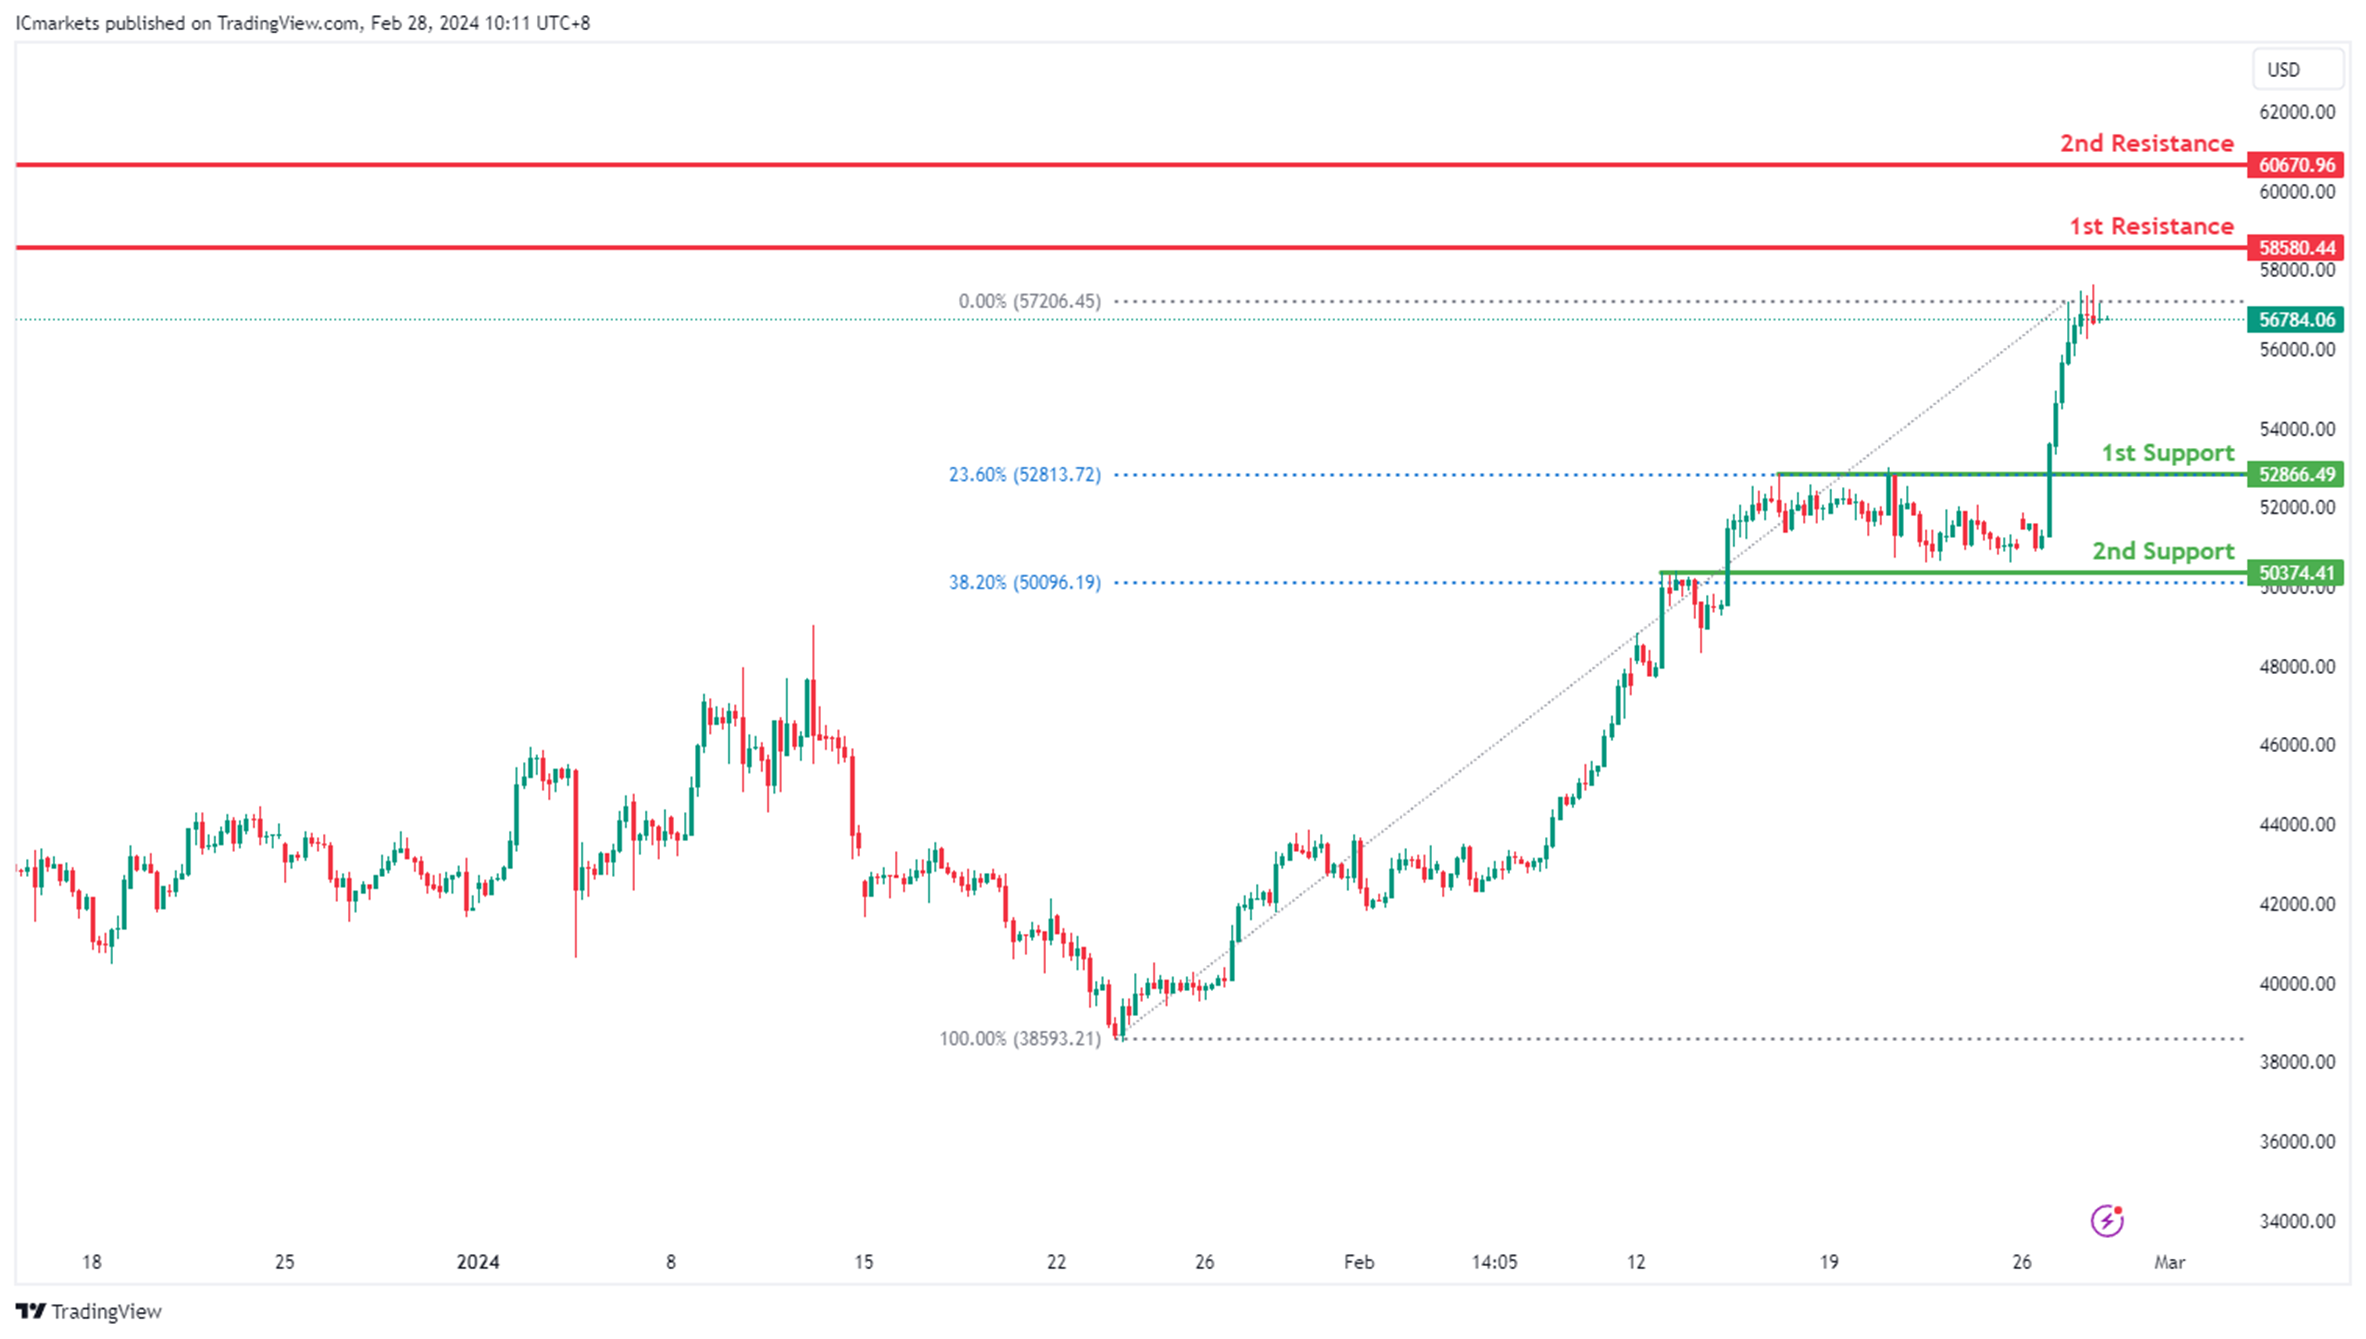
BTC/USD:
The BTC/USD chart currently exhibits an overall bullish momentum. In this context, there is a potential scenario for price to make a bullish continuation towards the 1st resistance.
The 1st resistance level at 58,580.44 is identified as a pullback resistance. Higher up, the 2nd resistance level at 60,670.96 is noted as an overlap resistance, adding to its significance as a potential barrier to further bullish movement.
On the support side, the 1st support level at 52,866.49 is identified as a pullback support that aligns with the 23.60% Fibonacci Retracement level. Further below, the 2nd support at 50,374.41 is marked as an overlap support that aligns with the 38.20% Fibonacci Retracement level, further reinforcing its significance as a potential level of support.
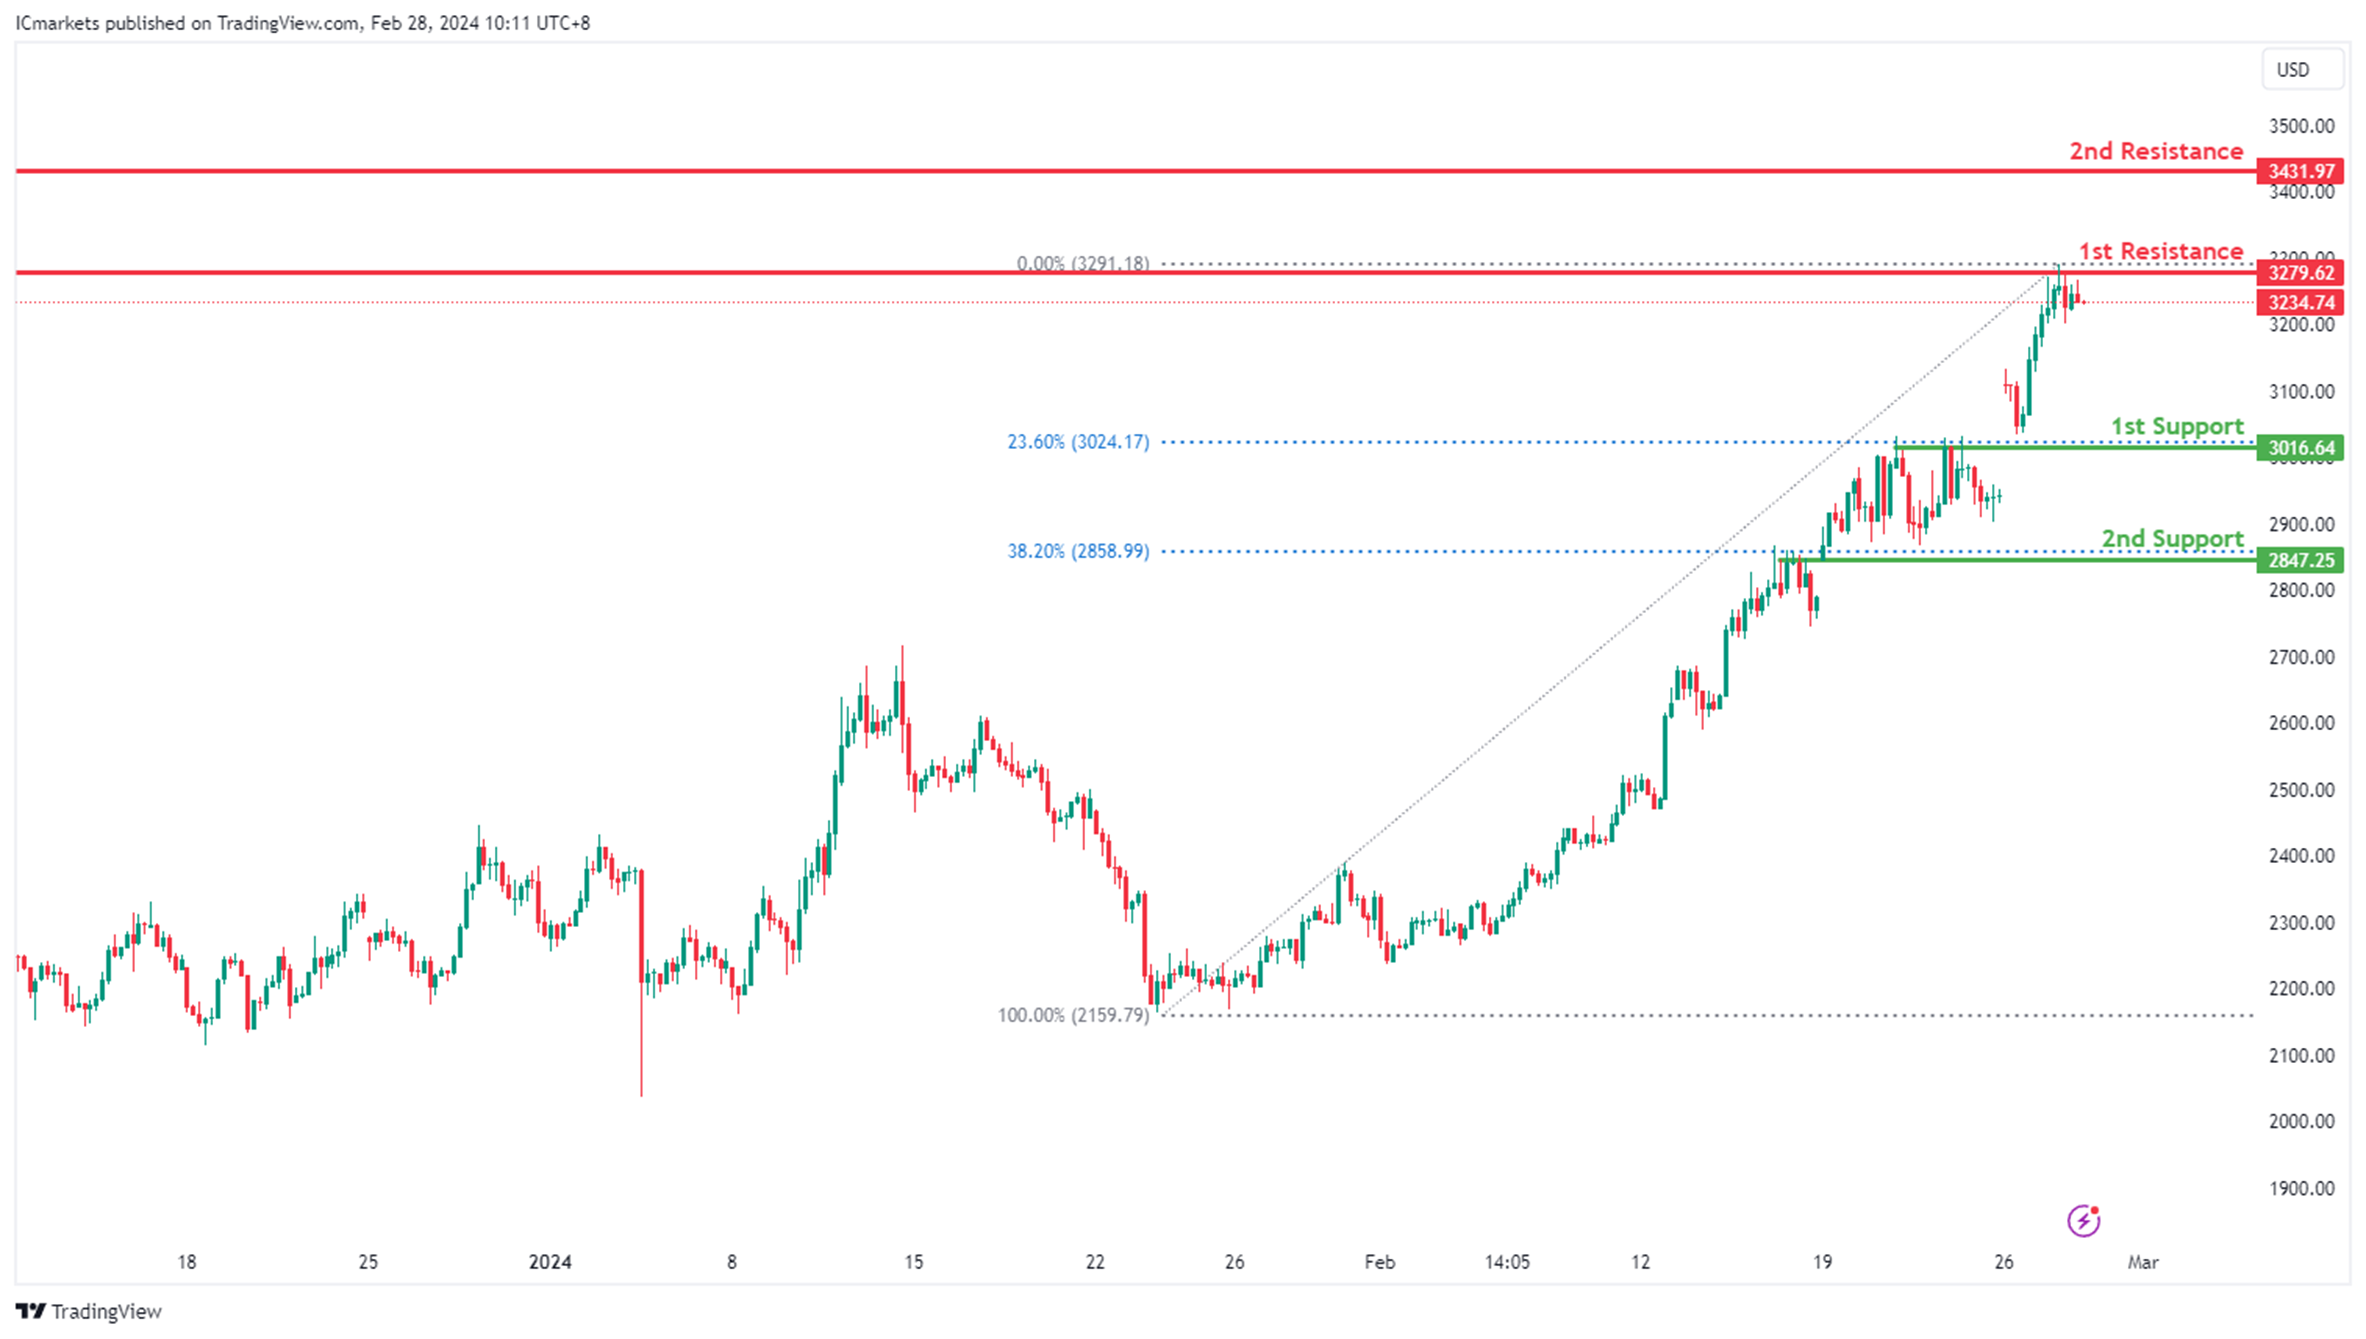
ETH/USD:
The ETH/USD chart currently exhibits an overall bullish momentum. In this context, there is a potential scenario for price to make a bullish continuation towards the 1st resistance.
The 1st resistance level at 3,279.62 is identified as a pullback resistance. Higher up, the 2nd resistance level at 3,431.97 is also noted as a pullback resistance, adding to its significance as a potential barrier to further bullish movement.
On the support side, the 1st support level at 3,016.64 is identified as a pullback support that aligns with the 23.60% Fibonacci Retracement level. Further below, the 2nd support at 2,847.25 is marked as an overlap support that aligns with the 38.20% Fibonacci Retracement level, further reinforcing its importance as a potential area of support.
WTI/USD:
The WTI (West Texas Intermediate) chart currently exhibits a neutral bias. In this context, there is a potential scenario for price to fluctuate between the 1st support and the 1st resistance.
The 1st support level at 76.17 is identified as a pullback support that aligns with the 38.20% Fibonacci Retracement level. Further below, the 2nd support level at 75.16 is also marked as a pullback support that aligns with the 50.00% Fibonacci Retracement level, reinforcing its significance as a key support level.
To the upside, the 1st resistance level at 79.07 is identified as a multi-swing-high resistance. Higher up, the 2nd resistance level at 80.79 is marked as a pullback resistance, further highlighting its importance as a potential resistance zone.

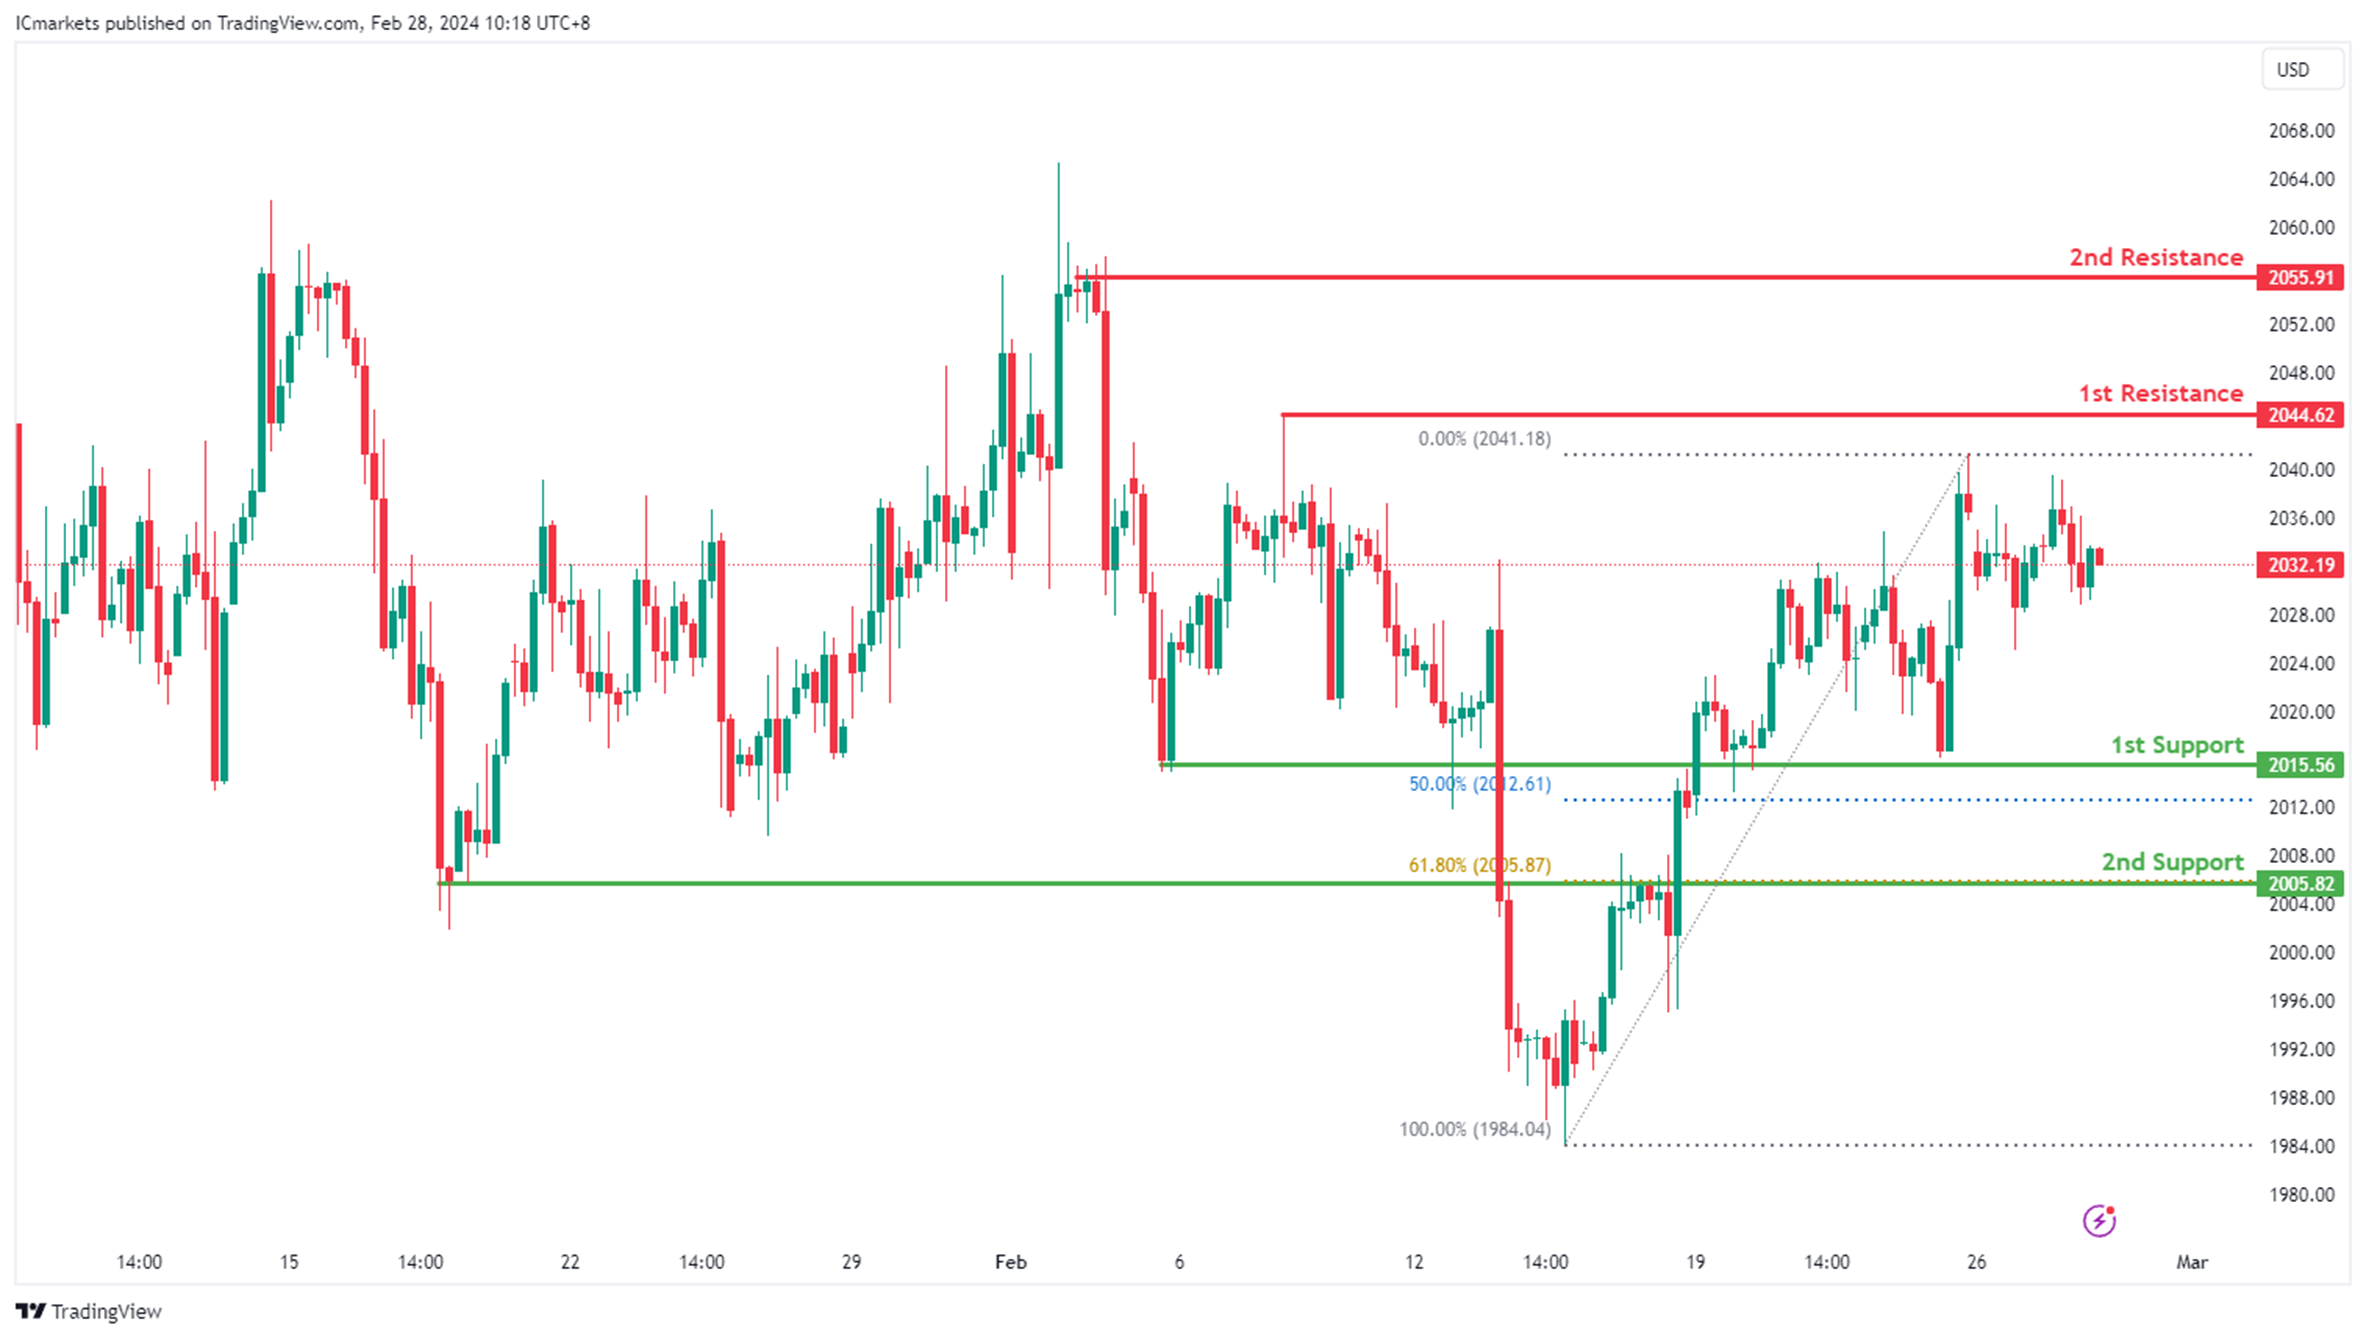
XAU/USD (GOLD):
The XAUUSD (Gold/USD) chart currently exhibits an overall bullish momentum. In this context, there is a potential scenario for price to make a bullish continuation towards the 1st resistance.
The 1st resistance level at 2,044.62 is identified as a pullback resistance. Higher up, the 2nd resistance level at 2,055.91 is also noted as a pullback resistance, adding to its significance as a potential barrier to further bullish movement.
On the support side, the 1st support level at 2,015.56 is identified as a pullback support that aligns close to the 50.00% Fibonacci Retracement level. Further below, the 2nd support at 2,005.82 is marked as an overlap support that aligns with the 61.80% Fibonacci Retracement level, further reinforcing its importance as a potential area of support.
Bitcoin Price Surges Toward $60K, US GDP Report Next
Key Highlights
- Bitcoin price extended its rally above $53,200 and $55,000.
- BTC cleared a major declining channel with resistance at $51,850 on the 4-hour chart.
- Ethereum also rallied above the $3,150 and $3,200 resistance levels.
- The US GDP could grow 3.3% in Q4 2023 (Preliminary).
Bitcoin Price Technical Analysis
Bitcoin price formed a support base above the $50,500 level. BTC started a fresh increase and broke many hurdles near $52,000 to enter a fresh uptrend.
Looking at the 4-hour chart, the price cleared a major declining channel with resistance at $51,850. The price settled well above the $55,000 resistance zone, the 100 simple moving average (red, 4 hours), and the 200 simple moving average (green, 4 hours).
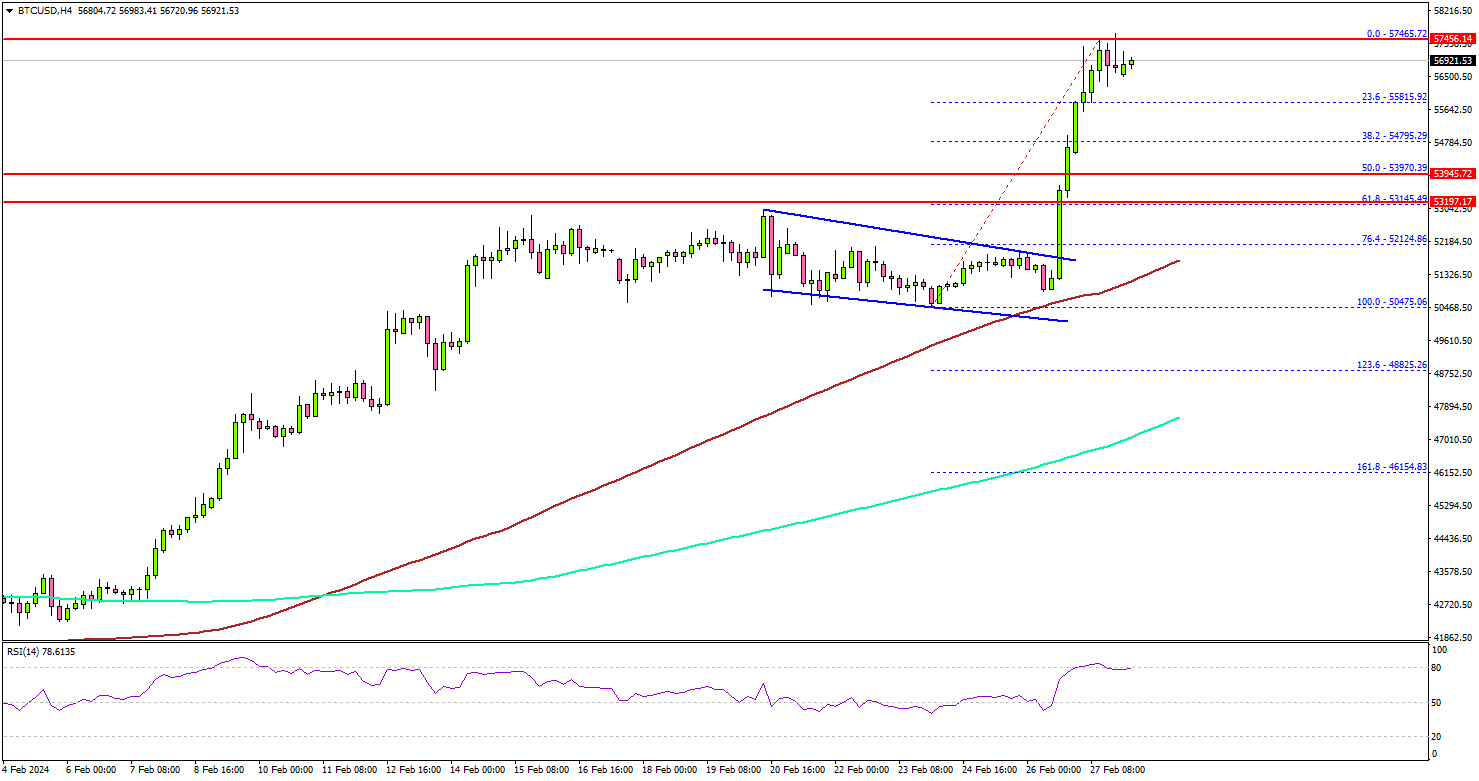
It tested the $57,500 zone and is currently consolidating gains. Immediate resistance is near the $58,000 level. The next resistance is near $58,800.
A successful close above the $58,800 level might start another steady increase. In the stated case, the price may perhaps rise toward the $60,000 level. Any more gains might send Bitcoin toward the $62,000 level in the near term.
If not, the price might start a downside correction. Immediate support is near the $55,800 zone. The next major support is $55,000. Any more losses might send the price toward the $53,850 support zone.
The next key support is near the $53,200 level, below which there is a risk of a drop toward the $52,000 level in the coming days.
Economic Releases
- US Gross Domestic Product for Q4 2023 (Preliminary) – Forecast 3.3% versus previous 3.3%.
- US Personal Income for Jan 2024 (MoM) - Forecast +0.2%, versus +0.3% previous.
Australia: January CPI First Impressions
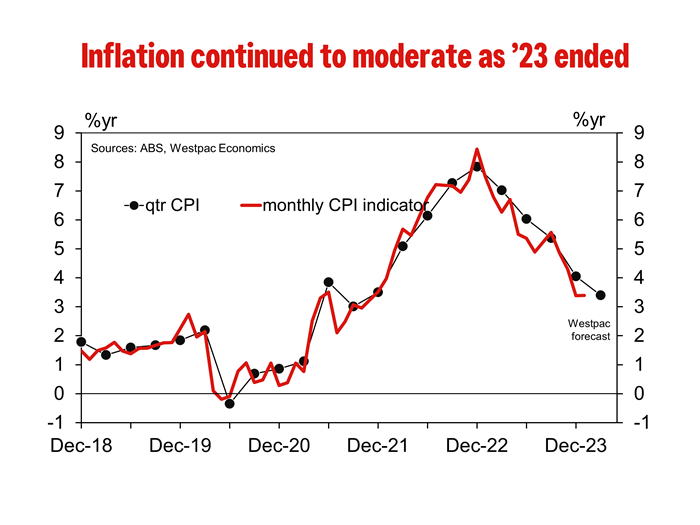
The Monthly CPI Indicator rose 3.4% in the year to January, in line with the outcome recorded in December. This remains the equal softest print for monthly inflation estimate since November 2021.
The January print was meaningfully less than Westpac’s forecast of 3.9%yr, and the market median forecast of 3.5%yr. Taken at face value the January Monthly CPI Indicator suggests that if there are any risks to our current March quarter CPI forecast of 0.7%qtr it is to the downside.
As noted in our preview, the first month of the quarter provides us with an update household durable goods but not a lot in the way of services outside of garments repairs & hire and maintenance/repairs to dwellings.
Diving into the details we find that while electricity and holiday travel was softer than we had expected, durable goods prices did not fall as much and as these prices are surveyed only in the first month of each quarter they will drive the quarterly forecast. The more robust durable goods prices offset weaker electricity and holiday travel prices, which are surveyed monthly so we will have two more months of data for these prices.
As such, we see the risks as balanced around our March quarter inflation forecasts; 0.7%qtr for the CPI and 0.8%qtr for the Trimmed Mean.
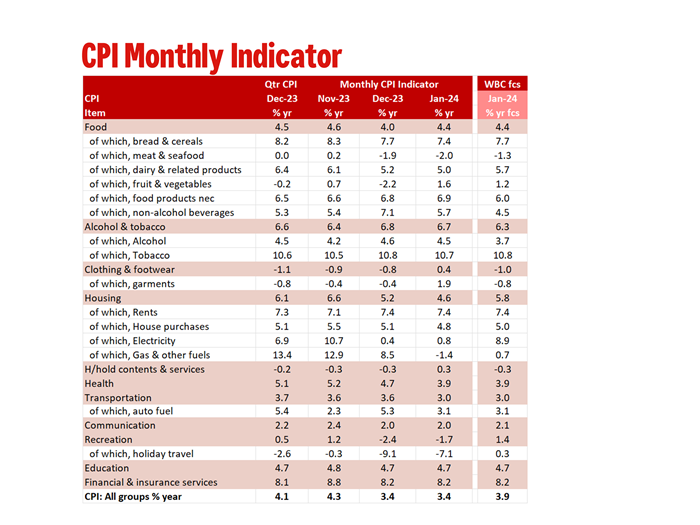
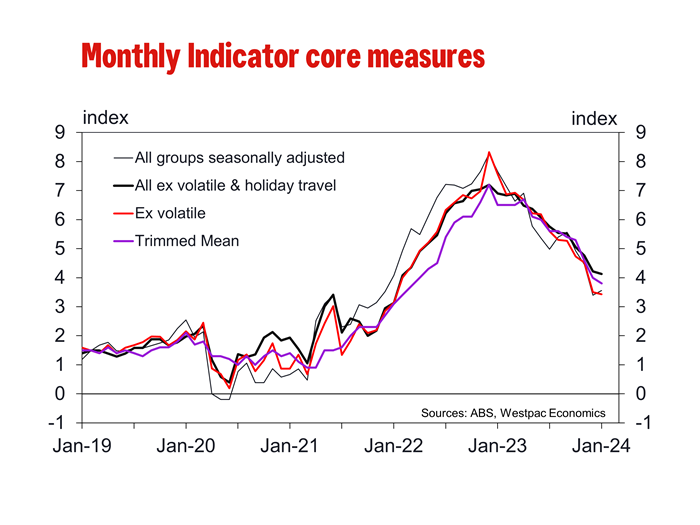
The Monthly Indicator Trimmed Mean printed 3.8%yr, down from 4.0%yr in December and well down from the recent peak of 7.2% in December 2022. The quarterly Trimmed Mean printed 4.2%yr in December and our current forecast for the March quarter is 3.8%yr.
The seasonally adjusted monthly indicator, which excludes volatile items (such as food and petrol) and holiday travel, increased 0.2% in January to be 4.0% higher in annual terms. This indicator has now been running at 0.2% in monthly terms for the past five months.
Fed’s Bowman: Not time for rate cuts yet
Fed Governor Michelle Bowman articulated that Fed is "not at that point" to initiate rate cuts. Additionally, she expressed readiness to increase rates further if progress on inflation "has stalled or reversed".
"Should the incoming data continue to indicate that inflation is moving sustainably toward our 2% goal, it will eventually become appropriate to gradually lower our policy rate to prevent monetary policy from becoming overly restrictive," Bowman said in a speech overnight.
However, "in my view, we are not yet at that point," she emphasized. "Reducing our policy rate too soon could result in requiring further future policy rate increases to return inflation to 2 percent in the longer run."
"While the current stance of monetary policy appears to be at a restrictive level that will bring inflation down to 2 percent over time, I remain willing to raise the federal funds rate at a future meeting should the incoming data indicate that progress on inflation has stalled or reversed," Bowman added.
Australia monthly CPI unchanged at 3.4% in Jan, trimmed mean CPI down to 3.8%
Australia monthly CPI was unchanged at 3.4% yoy in January, below expectation of a rise to 3.6% yoy. CPI excluding volatile items and holiday travel slowed from 4.2% yoy to 4.1% yoy. Trimmed mean CPI also slowed from 4.0% yoy to 3.8% yoy.
The detailed breakdown reveals that the main inflationary pressures came from specific sectors: Housing costs rose by 4.6%, food and non-alcoholic beverages by 4.4%, alcohol and tobacco by a significant 6.7%, and insurance and financial services saw the highest increase at 8.2%.
These increases were somewhat mitigated by a decrease in the recreation and culture sector, notably a -1.7% drop, primarily driven by a -7.1% fall in Holiday travel and accommodation, which provided a counterbalance to the overall annual inflation rate.
NZ First Impressions: RBNZ Monetary Policy Statement
The OCR remains at 5.5%. The RBNZ’s monetary policy strategy remains unchanged, implying the OCR will remain at 5.5% until 2025 – in line with Westpac’s forecasts.
- The OCR remains at 5.5%.
- The RBNZ reduced their OCR forward profile, implying around a 40% chance of a further OCR increase.
- The RBNZ’s inflation forecasts were revised lower over 2024, reflecting recent data.
- But the RBNZ’s 2025 forecasts were slightly revised up, reflecting persistent domestic inflation pressures.
- The RBNZ reaffirmed their commitment to seeing inflation at 2% in the second half of 2025.
- The RBNZ’s monetary policy strategy remains unchanged, implying the OCR will remain at 5.5% until 2025 – in line with Westpac’s forecasts. The RBNZ is staying the course.
Staying the course.
The RBNZ left the OCR unchanged as we expected at 5.5%. The overall tone of the Statement remains somewhat hawkish – but much less hawkish than market fears. Even though the OCR was left unchanged this time, the RBNZ still sees a risk of a need for a higher OCR to 5.75% in Q3 this year. The RBNZ’s updated OCR track was lowered, implying around a 40% chance of a further OCR increase (down from around 75% previously).
A key excerpt summarises the RBNZ’s view:
“Conditional on our central economic outlook, the Official Cash Rate (OCR) is expected to remain around current levels for an extended period in order for the MPC to meet its inflation target. The outlook for the OCR is slightly lower than in the November 2023 Statement. This reflects that the slightly lower outlooks for capacity pressures, import prices and house price inflation more than offset the higher outlook for export prices.”
For now, the RBNZ seems comfortable that their monetary policy strategy of holding the OCR at 5.5% for as long as it takes will be sufficient to bring inflation back to 2%. Still sticky non-tradables inflation and a slowly adjusting labour market is keeping the RBNZ on their toes. Hence the RBNZ continues to see some risk of a further OCR increase in the next few months.
The MPC continues to maintain a consensus regarding the level of the OCR. No vote was required.
As noted in our MPS review and subsequent note, we didn’t expect an increase in the OCR, with a straight interpretation of the data suggesting that the track could even be lowered. But we saw material risks of either an OCR increase or upgraded risks of one in the future, if the RBNZ were to focus on some particular more worrying aspects of the data (e.g., the stickiness of non-tradable inflation). These risks were not realised. We remain comfortable with our view that the OCR remains on hold at 5.5% over 2024.