
Sample Category Title
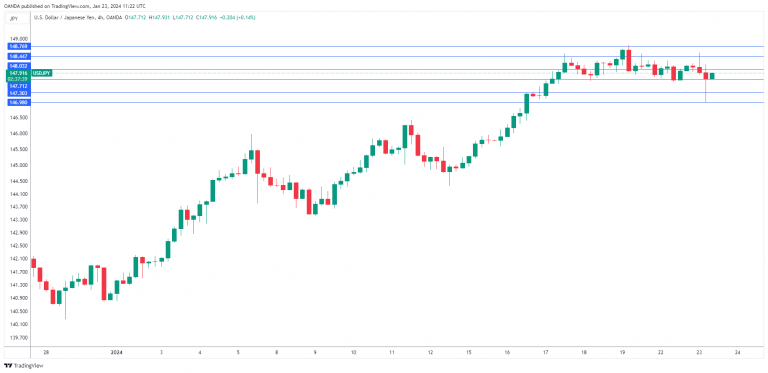
USD/JPY Mid-Day Outlook
Daily Pivots: (S1) 147.71; (P) 148.03; (R1) 148.44; More...
No change in USD/JPY's outlook as consolidation from 148.79 is still extending. Deeper retreat cannot be ruled out, but further rally is expected as long as 145.97 resistance turned support holds. Corrective fall from 151.89 should have completed at 140.25 already. Break of 148.79 will resume the rise from there for retesting 151.89/93 key resistance zone.
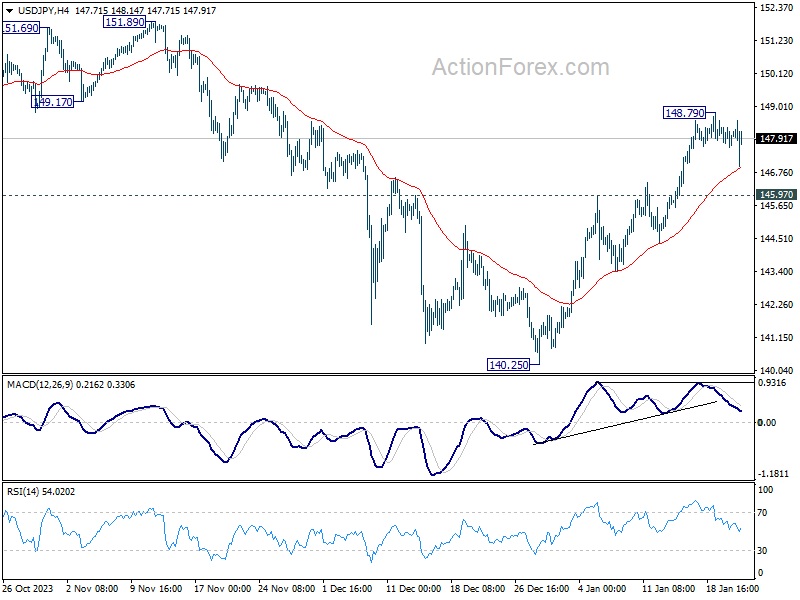
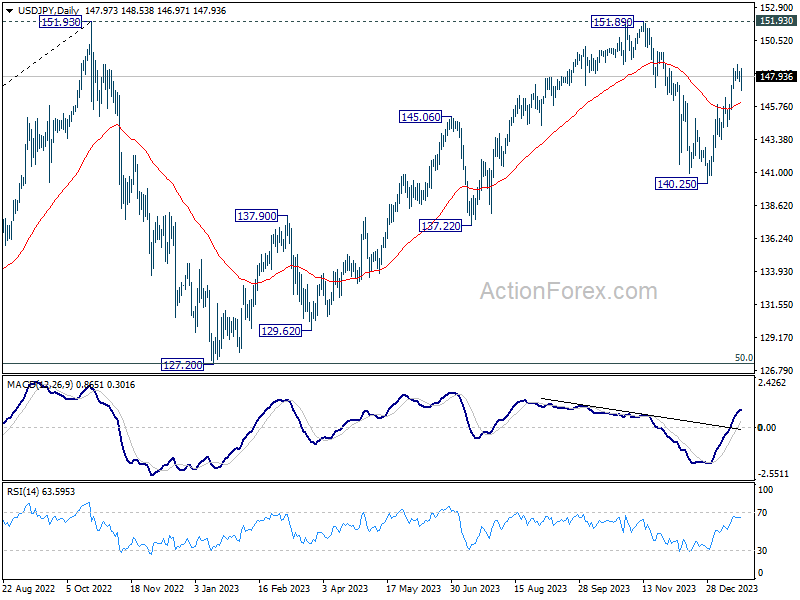
In the bigger picture, stronger than expected rebound from 140.25 dampened the original bearish review. Strong support from 55 W EMA (now at 141.89) is also a medium term bullish sign. Fall from 151.89 could be a correction to rise from 127.20 only. Decisive break of 151.89/93 will confirm resumption of long term up trend. This will now be the favored case as long as 140.25 support holds.
NZD/USD losing downside momentum as NZ CPI awaited
One of the spotlights will turn to New Zealand's inflation data in the upcoming Asian session. Market are expecting quarterly CPI to rise 0.5% qoq in Q4, slowed from Q3's 1.8% qoq. Annually, CPI is expected to fall from 5.6% yoy to 4.7% yoy.
Should these predictions materialize, the results would fall significantly below RBNZ's forecast from the November Monetary Policy Statement, which projected 0.8% qoq and 5.0% yoy, although the annual rate remains well above 1-3% target band.
There is a divergence of opinions regarding RBNZ's interest rate path this year. While some economists hold the view that OCR will remain at 5.50% through 2024, 2-year swap market is fully pricing in an OCR cut as early as May. Therefore, the inflation data set to be released tomorrow is poised to play a critical role in reshaping these rate cut expectations.
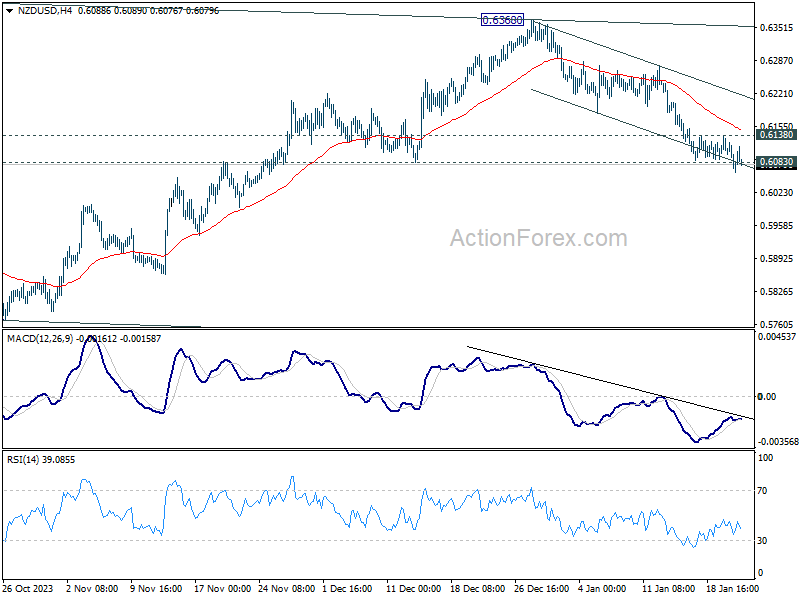
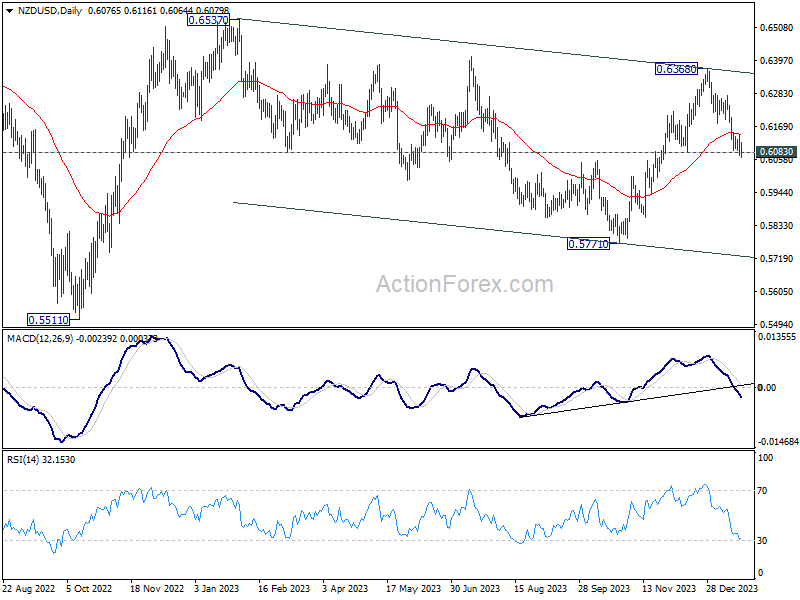
NZD/USD's fall from 0.6368 lost much momentum after breaching 0.6083 support, but there is no sign of a rebound yet. Sustained break of 0.6083 will strengthen the case that this decline is the third leg of the corrective pattern from 0.6537, and target 0.5771 support next. Nevertheless, break of 0.6138 minor resistance will neutralize immediate bearishness, and bring recovery first.
NZD: Will Markets Rebound Soon?
The New Zealand dollar (NZD) kicks off the week at 0.6116, showing minimal change. However, last week saw a 2% dip, pushing the NZD to a five-week low. Economic challenges persist in New Zealand, with the Performance of Services Index (PSI) revealing three contractions in the second half of 2023. November's PSI improved marginally to 51.2 from October's 49.2, indicating sluggish growth. Investors await Tuesday's report for December, seeking insights into the NZD's
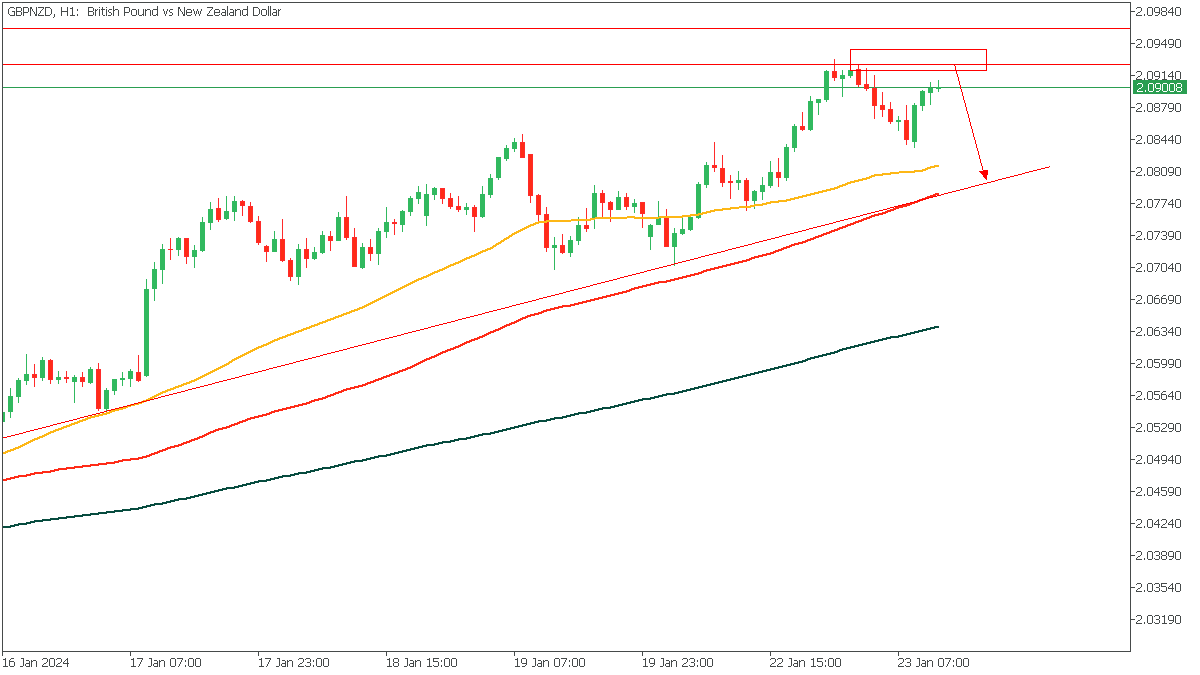
GBPNZD - H1 Timeframe
On the hourly timeframe, GBPNZD is seen to be approaching a key area of supply which overlaps the supply zone on the daily timeframe as well. To provide further confluence, we have a possible head-and-shoulders pattern currently developing on the H1. My sentiment is bearish, with the 100-period moving average as my target.
Analyst’s Expectations:
- Direction: Bearish
- Target: 2.08241
- Invalidation: 2.09687
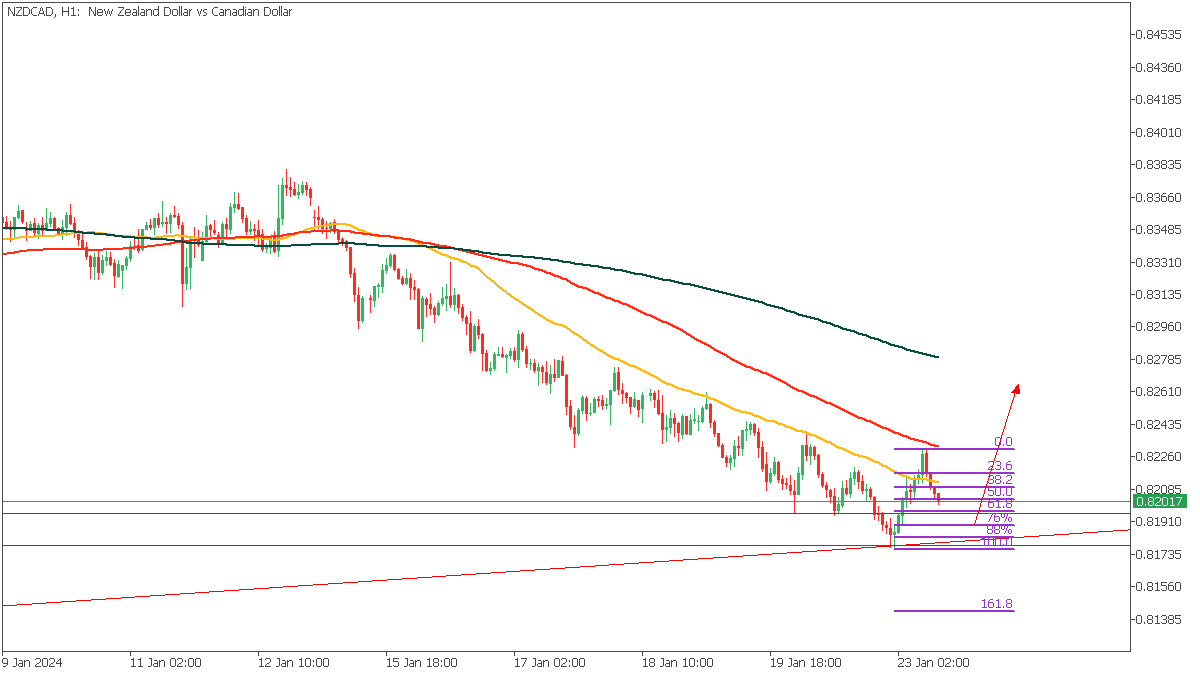
NZDCAD - H1 Timeframe
NZDCAD made an initial bounce off the demand zone on the Daily timeframe, with the reaction breaking above the previous high to create a new one. This suggests a shift in the trend, meaning we are very likely to see price create a higher low anytime now (especially based on the Fibonacci retracement levels). My sentiment is bullish, with 76% of the Fibonacci as my entry.
Analyst’s Expectations:
- Direction: Bullish
- Target: 0.82459
- Invalidation: 0.81749
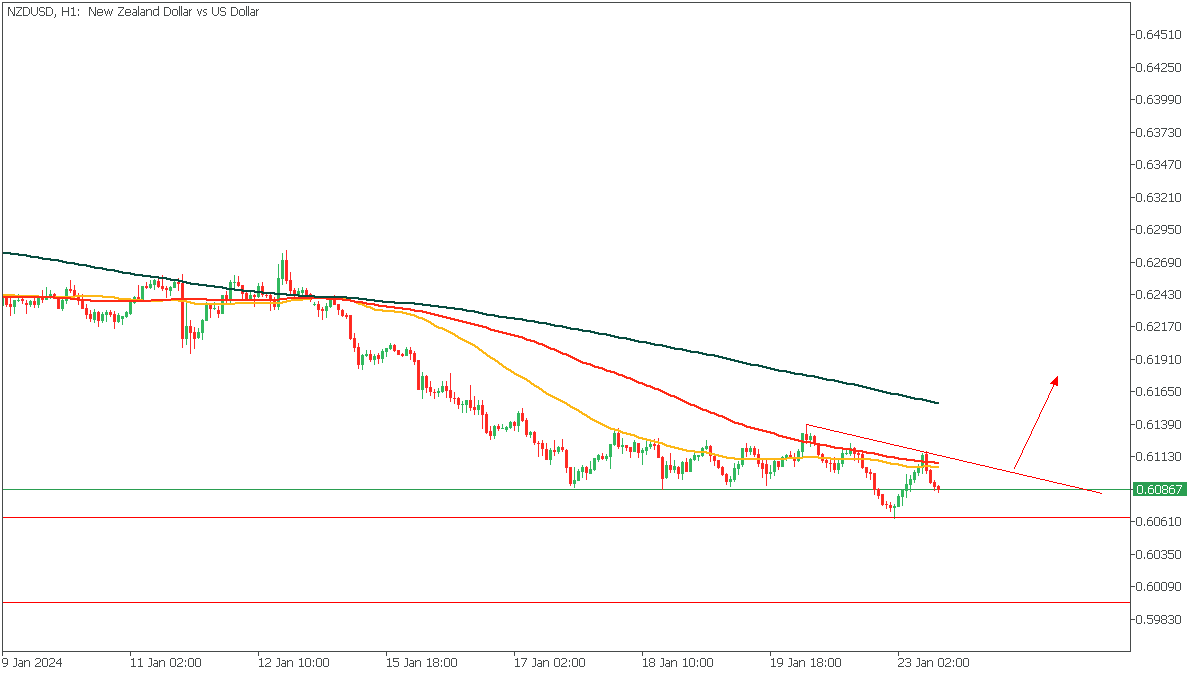
NZDUSD - H1 Timeframe
NZDUSD has not given me a clear direction yet based on my trading strategy, which means I will look to tow the price action patiently until the trendline overlapping the 50 and 100 moving averages gets broken. This will help ensure that I take a safer approach rather than an aggressive entry model. Generally, I am eyeing the possibility of a bullish reversal since price is almost at the demand zone on the daily timeframe.
Analyst’s Expectations:
- Direction: Bullish
- Target: 0.61720
- Invalidation: 0.60621
CONCLUSION
The trading of CFDs comes at a risk. Thus, to succeed, you have to manage risks properly. To avoid costly mistakes while you look to trade these opportunities, be sure to do your due diligence and manage your risk appropriately.
Japanese Yen Pares Gains after BOJ Meeting
The Japanese yen is slightly lower in the European session on Tuesday. USD/JPY fell 0.54% after today’s BoJ policy meeting but has pared most of those gains and is trading at 147.82, down 0.18%.
Bank of Japan stays pat
As expected, the BoJ maintained its policy settings at today’s meeting. In a unanimous decision, the BoJ board kept interest rates at -0.1% and maintained its yield curve control policy of an upper limit of 1% as a reference for 10-year Japanese government bonds. The BoJ lowered its core inflation forecast for fiscal 2024 to 2.4%, compared to 2.8% in the October forecast.
The BoJ played it safe at today’s meeting, keeping policy intact but lowering the inflation forecast. The BoJ doesn’t appear in a rush to tighten policy, but investors have been bitten before and are aware that the BoJ has a knack for surprising the markets. Governor Ueda has been hinting at a shift in policy, and the Bank’s negative rates seem out of place in a world of higher inflation.
Ueda has insisted that high inflation is due to cost-push factors and that he won’t tighten policy until wage growth increases, as this would provide evidence that inflation is driven by domestic demand and is sustainable at 2%. National wage talks commence in March and if it appears that employee wages will rise, the BoJ could make a major policy announcement in April or in June.
Governor Ueda stated in a follow-up press conference that the probability of reaching the 2% sustainable inflation target is rising and there is evidence of a positive wage-inflation cycle. The BoJ may not have made any changes at today’s meeting, but Ueda’s comments are slight hints that a policy change is only a question of time.
USD/JPY Technical
- USD/JPY has pushed through several support levels and is testing support at 146.98
- There is resistance at 148.44 and 148.76
Crypto’s Decline Looks More Like a Sell-off than a Correction
Market picture
The crypto market lost over 5% in 24 hours, to $1.52 trillion. Bitcoin has remained under pressure since the start of the week after pausing in the sell-off on Saturday and Sunday. The persistence of the sell-off has triggered a sell-off in many altcoins, losing with greater amplitude than BTC.
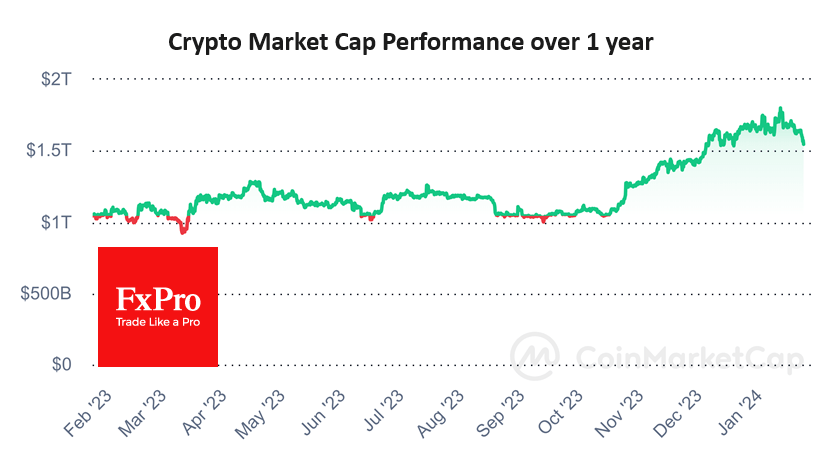
The very nature of the Bitcoin sell-off makes one look for an institutional trail, as it occurs predominantly during the most active trading hours of US exchanges. Whether this is due to capital flows due to the launch of spot ETFs or a shift in investor interest from the crypto market to equities is entirely possible.
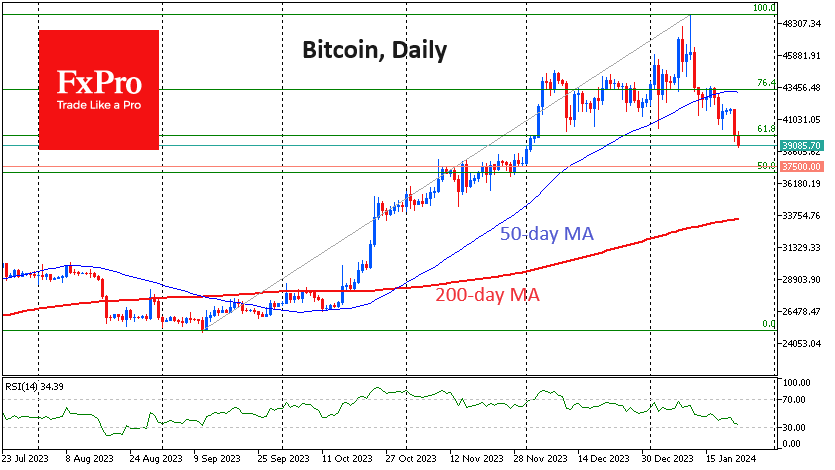
Having fallen below $39k, the Bitcoin price now risks going beyond the typical correction after the rally that started in September. Up to the $37.5K area, Bitcoin may encounter little support. But below that lies an area of prolonged consolidation, where the chances of another long tug-of-war are high. A step down from these levels will make one seriously consider a bearish outlook for cryptocurrencies for the next few weeks or months.
News background
Most investors who liquidate positions in Grayscale’s GBTC will channel funds into other bitcoin-ETFs, which will neutralise the current BTC weakness, Galaxy Digital CEO Mike Novogratz said. Earlier, a number of experts attributed the current bitcoin decline to liquidations of positions in Grayscale’s GBTC ETF fund.
According to CoinShares, investments in crypto funds fell by $21 million last week after record inflows since 2021; outflows were recorded after four weeks of growth. Investments in Bitcoin fell by $25 million, Ethereum by $14 million, and Solana by $8.5 million, while investments in funds that allow Bitcoin shorts rose by $13 million.
Crypto fund outflows last week were negligible, although the numbers mask very high trading volumes ($11.8bn), which is seven times the average weekly trading volume in 2023—existing ETFs with higher costs suffered in the US. Outflows from Grayscale’s GBTC fund totalled $2.23bn and could not be offset by investments in other ETFs, CoinShares noted.
Bitcoin will fall below $40K due to deteriorating liquidity in the financial system. The decline will continue until 31 January – the announcement of the US Treasury’s quarterly borrowing plan expects ex-CEO of BitMEX Arthur Hayes. To implement the strategy, he bought March put options with a strike price of $35K.
Kiarash Hossainpour, founder of Colorways Ventures and The Consensus, said Bitcoin is expected to come under heavy pressure in the first half of the year due to a likely sell-off from former and current large BTC holders such as GBTC, Mt.Gox, Celsius and FTX.
According to platform Crypto.com, the total number of cryptocurrency users grew 34 per cent from 432 million to 580 million at the end of 2023, with Bitcoin and Ethereum leading the way in terms of increased adoption. The number of BTC owners grew by 33% (from 222 million to 296 million) and ETH – by 39% (from 89 million to 124 million).
Price of Bitcoin Has Dropped Below 40,000: What’s Next?
The value of the main cryptocurrency has fallen below the psychological mark for the first time since December 4th of last year. According to on-chain metrics services, the decline in the price of Bitcoin on cryptocurrency exchanges triggered the liquidation of buyer positions for more than 25 million dollars in just 2 hours.
This decline confirms the significance of the three black crows pattern (indicated by the arrow) and the principle of "buy the rumour, sell the fact" – as we discussed in the Bitcoin price analysis on January 15th.
What's next? Will the price continue to decrease?
JPM head Jamie Dimon, as well as legendary investor Peter Schiff, are pessimistic. In their opinion, Bitcoin is a speculative asset. Jamie Dimon explicitly advises staying away from bitcoins, while Peter Schiff, comparing Bitcoin to gold, prefers the precious metal.
On the other hand, the current decrease may indicate a correction within an upward trend. This perspective is held by financial expert and publicist Anthony Scaramucci.
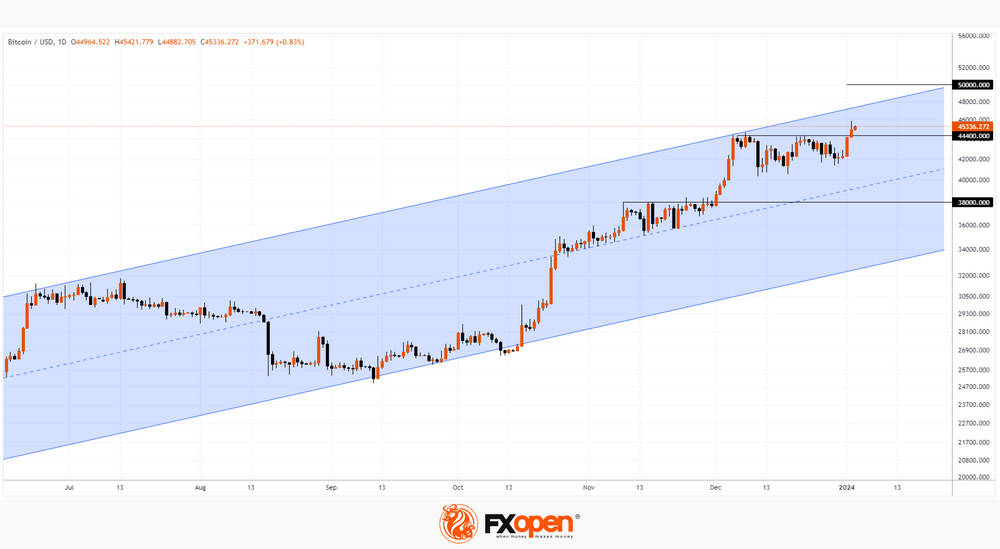
Today's Bitcoin chart shows that:
→ BTC/USD has dropped not only below the psychological mark but also below the lower boundaries A and B of the channels, shown in blue and purple on the chart.
→ The RSI indicator points to oversold conditions.
If the market shows signs of recovery, then:
→ the nature of this recovery (comparing the speed, volumes, and progress achieved relative to the decline from the peaks on January 11th) will provide important information to determine the strength or weakness of demand in the market;
→ the important psychological level at 40,000 will be considered support, an attempt to break which has failed. So far, bears are aiming to establish themselves below $40k. If they succeed, the psychological level may pose resistance in the future.
As long as the price of Bitcoin is below 44,000 (approximately 50% from the January peak), we may consider that the initiative is on the bears' side.
This article represents the opinion of the Companies operating under the FXOpen brand only. It is not to be construed as an offer, solicitation, or recommendation with respect to products and services provided by the Companies operating under the FXOpen brand, nor is it to be considered financial advice.
EURJPY Re-enters Its Bullish Channel
- EURJPY bounces back after 200-day SMA prevents decline
- Rejoins its bullish setup in place since summer
- Momentum indicators are within their positive territories
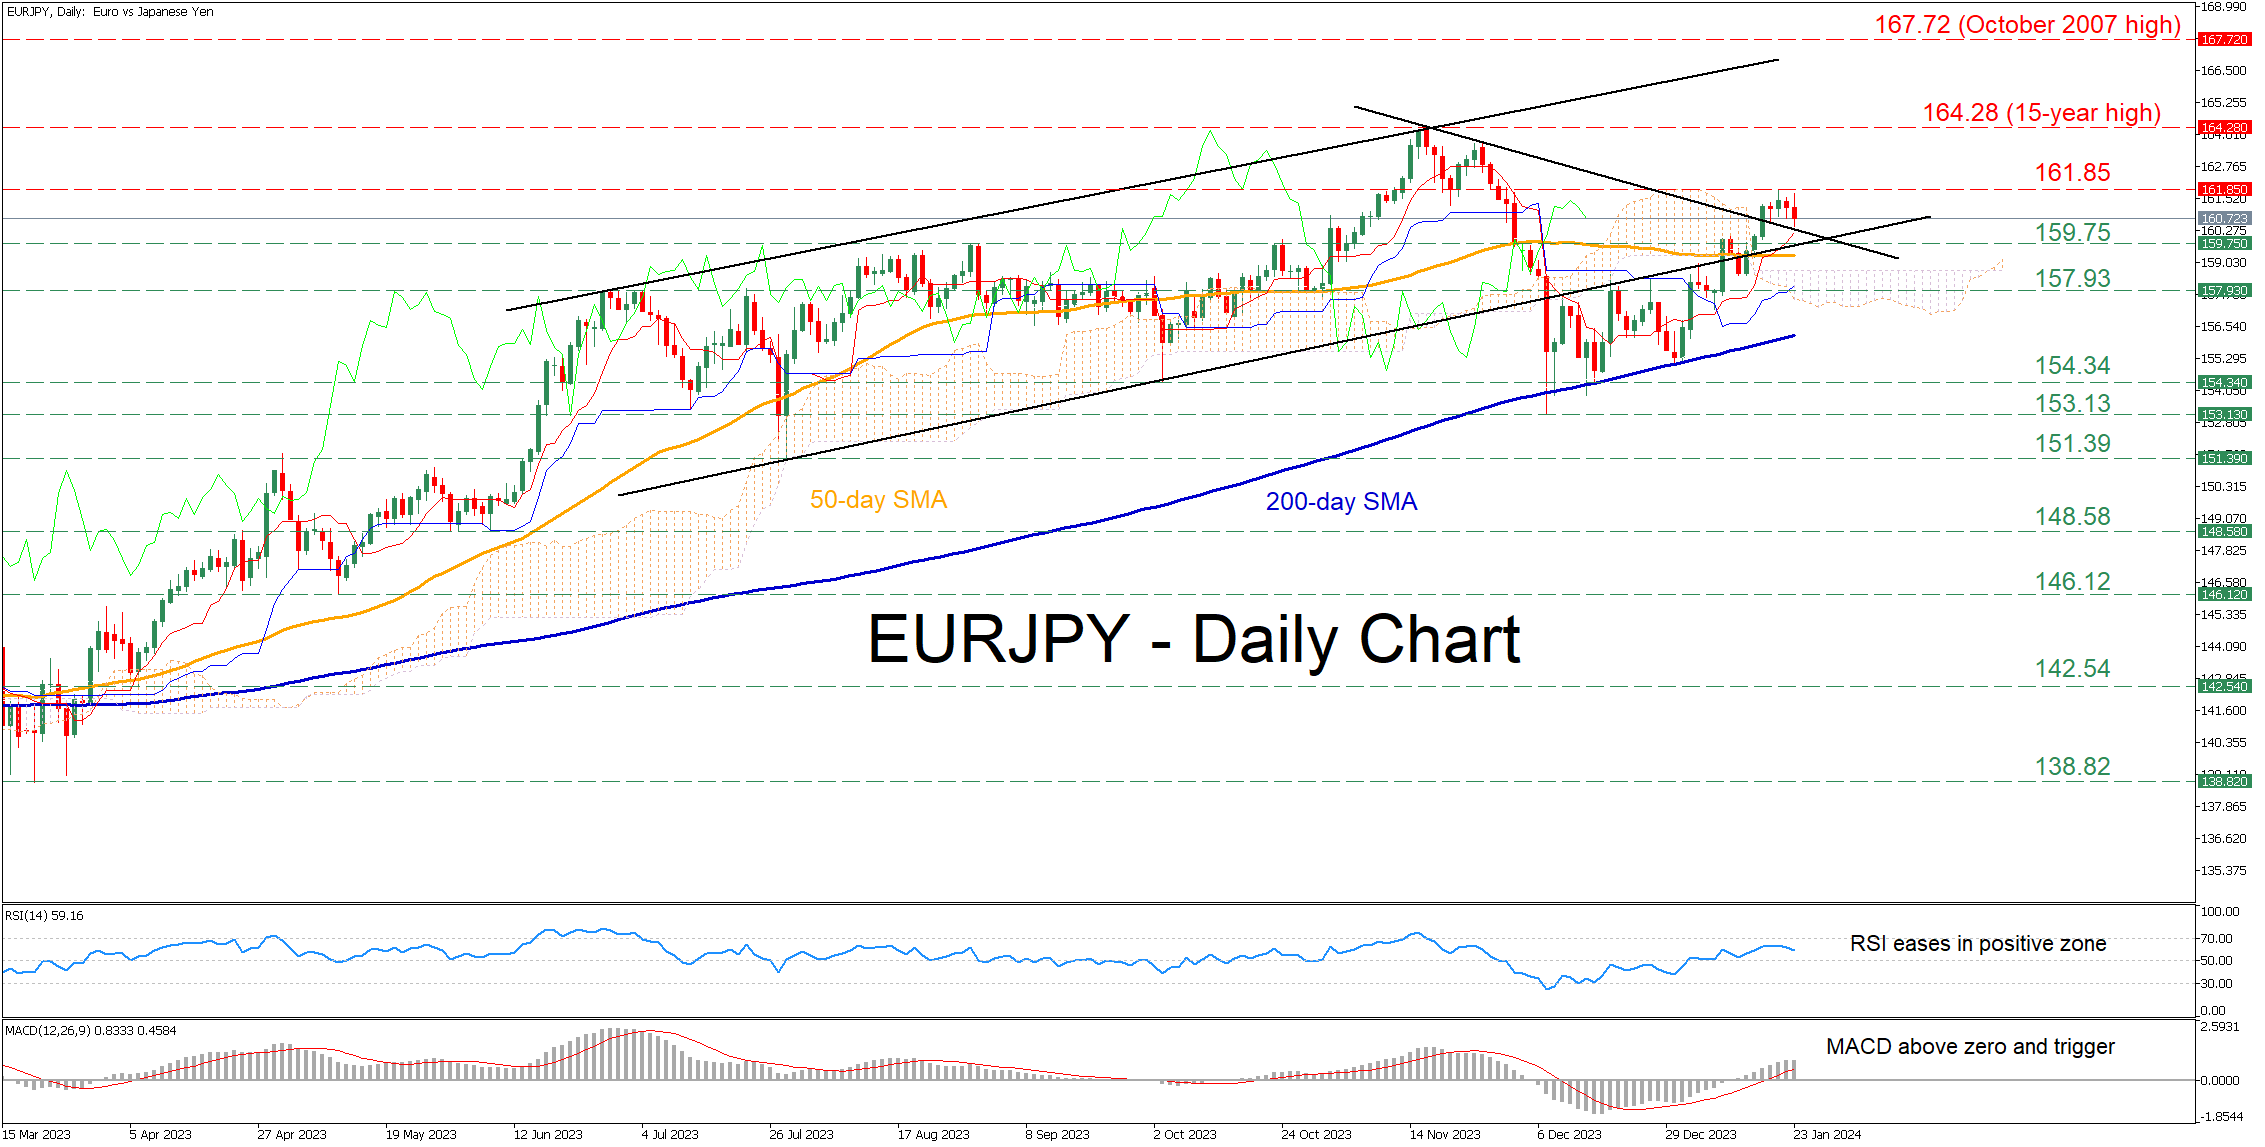
Should buying pressures persist, the price may revisit the January high of 161.85. A break above that area could pave the way for the 15-year high of 164.28. Failing to halt there, the pair could storm higher to fresh multi-year peaks, where the October 2007 high of 167.72 could curb any upside attempts.
On the flipside, if the price reverses lower, immediate support could be found at the previous resistance of 159.75, which overlaps with the lower bound of the ascending channel. Further retreats may then cease around 157.93, a region that acted both as resistance and support in recent months. Even lower, the October-December support of 154.34 could act as the next line of defence.
In brief, EURJPY managed to pause its short-term selloff with some help from the 200-day SMA and jump back above the Ichimoku cloud. Therefore, the technical picture will remain positive for as long as the price holds within its medium-term bullish pattern.
GER 40 Index Aims for Bullish Continuation
- German 40 index looks for a bullish channel breakout
- Will the index resume its long-term uptrend?
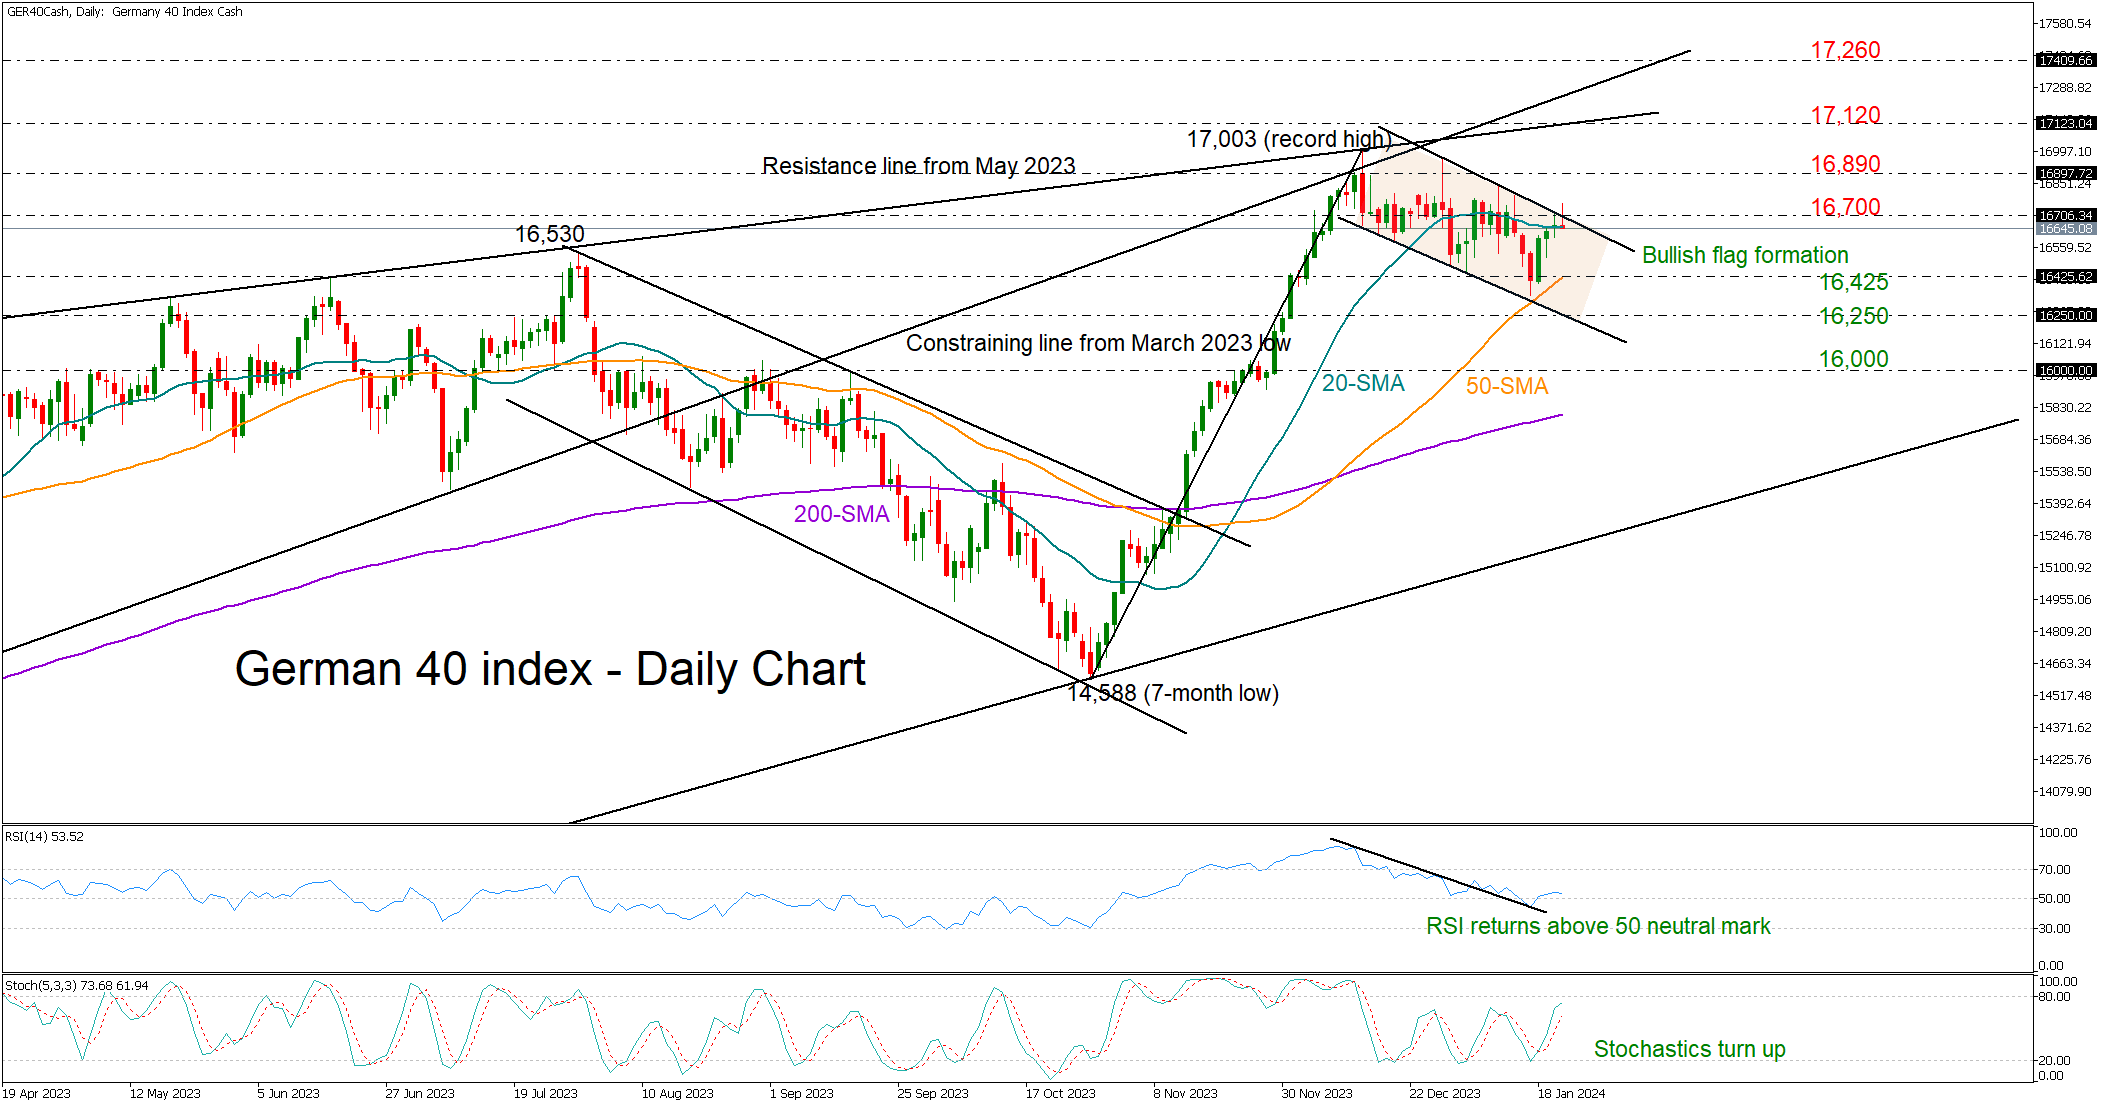
The German 40 index (cash) has been trending southwards within a channel since marking the record high of 17,000 in mid-December.
The downward-sloping formation could be part of a bullish continuation flag pattern followed by the almost vertical October-December uptrend. The index is currently seeking confirmation above the 20-day simple moving average (SMA) and the 16,700 level. If its efforts prove successful, it could crawl up to the 16,890 barrier, a break of which could see an advance towards the resistance line from May 2023 at 17,120. Even higher, the door could open for the constraining ascending line from March 2023 at 17,260.
The positive slope in the RSI, which has bounced back above its 50 neutral mark, and the upward move in the stochastic oscillator, are reflections of improving sentiment. Nevertheless, a pullback below the 20-day SMA could upset traders, shifting the attention back to the 50-day SMA at 16,425. Should that floor crack as well, the sell-off could expand towards the channel’s lower boundary seen at 16,250. Another failure there could expose the market to the 16,000 round level.
In brief, despite its short-term downward trajectory, the German 40 index seems to be seeking a bullish continuation, with the confirmation expected to come above 16,700.
Yen Strengthens Despite Unchanged BOJ Monetary Policy
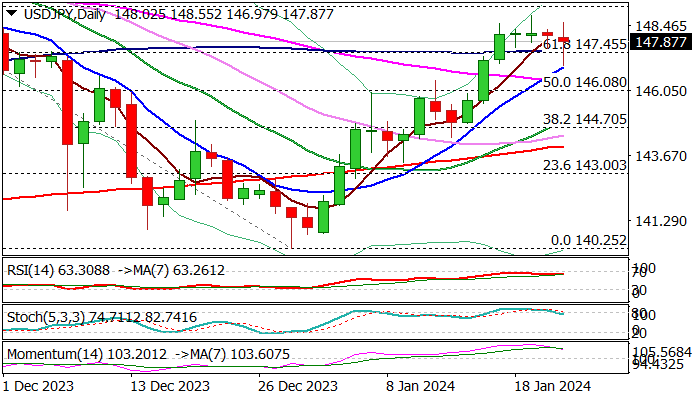
USDJPY fell on Tuesday after BoJ kept ultra-low rates unchanged, as yen strengthened on growing hopes that the central bank will start tightening policy soon.
Fresh dip comes after a triple daily Doji candle, which signaled strong indecision and generating an initial signal that larger uptrend is stalling, and reversal may follow.
Fading bullish momentum on daily chart and stochastic emerging from overbought territory, add to negative signals, though verification of initial signal will require close below cracked pivotal supports at 147.54/45 (100DMA / broken Fibo 61.8% of 151.90/140.25).
In such scenario, fresh bears will face more tough supports at 146.78/73 (Fibo 23.6% of 140.25/148.80 / daily Ichimoku cloud top), violation of which will further weaken near-term structure and expose next pivotal supports at 145.53/32 (Fibo 38.2% / daily cloud base).
Caution on failure to sustain break below 100 DMA which would keep the price action in extended sideways mode, but biased lower as long as the price stays below 149.00 resistance zone.
Res: 146.97; 148.80; 149.15; 149.70
Sup: 147.45; 146.92; 146.78; 146.43
Currencies Consolidate Awaiting Bank of Canada and ECB Verdicts
The last full trading week of January is highly saturated with important fundamentals. This morning, the Bank of Japan held its meeting, tomorrow, the Bank of Canada will announce its verdict, and on Thursday, the ECB's press conference is scheduled. Major currency pairs, in anticipation of the mentioned events, continue to trade within narrow corridors formed earlier.
USD/CAD
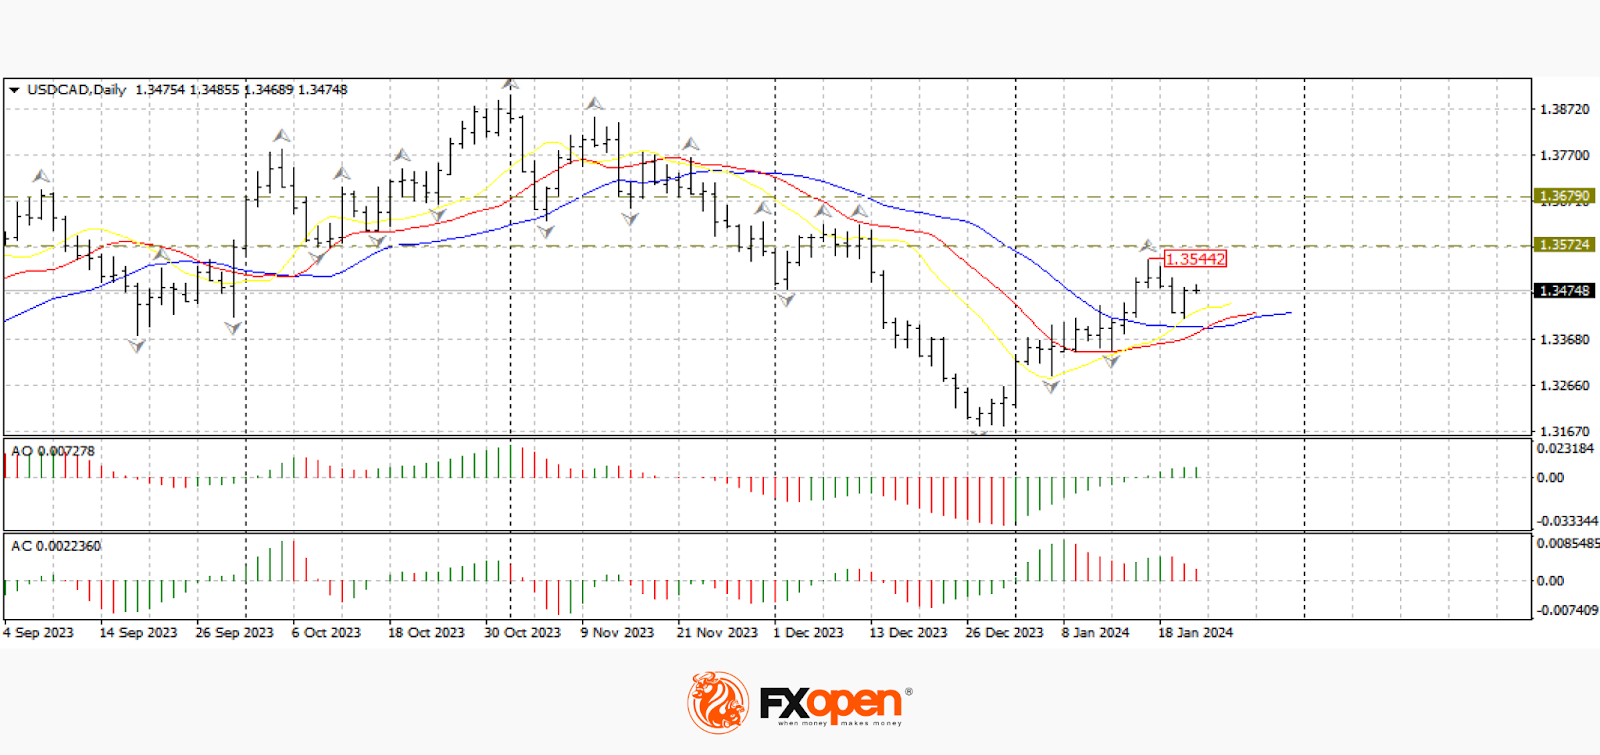
The USD/CAD chart shows that the currency pair is trading near recent highs at 1.3520-1.3480. After an early-year rise, the pair retreated to support at the alligator lines on the daily timeframe. Yesterday, the price dropped to 1.3420 but interrupted the downward correction and rose to 1.3480 by evening. With a corresponding fundamental background, the pair may break the upper fractal at 1.3540 and continue to rise towards 1.3680-1.3570. The cancellation of the upward scenario may be considered with a confident fixation below 1.3400.
At 16:30 GMT+3 today, we await the publication of data on the new housing price index in Canada for December. Tomorrow at 18:00 GMT+3, the Bank of Canada will announce its decision on the base interest rate. Analysts predict that officials will leave the rate unchanged. For market participants, the Canadian regulator's comments on credit and monetary policy for the current year will be crucial.
GBP/USD
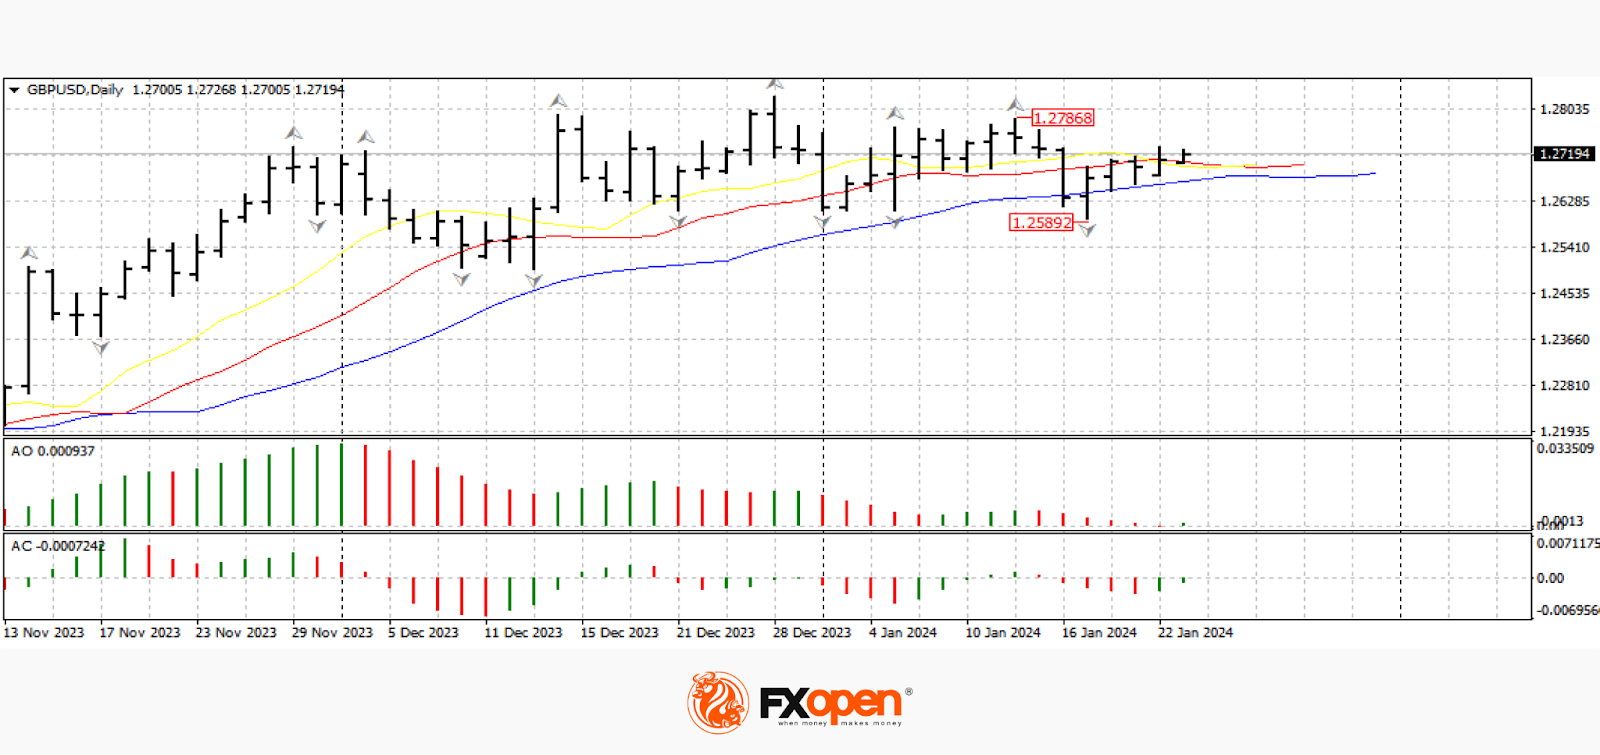
The GBP/USD chart shows the currency pair has held within a relatively narrow range for several days, between 1.2720 and 1.2600. Uncertainty in the credit and monetary policies of the Bank of England and the Federal Reserve keeps investors from both buying and selling the GBP/USD pair.
Tomorrow at 12:30 GMT+3, attention should be paid to the publication of data on the Purchasing Managers' Index (PMI) for the manufacturing sector in the UK for January. Also, tomorrow at 17:45 GMT+3, a block of important macroeconomic data will be released from the US, including the PMI for the services sector and the PMI for the manufacturing sector for the same period.
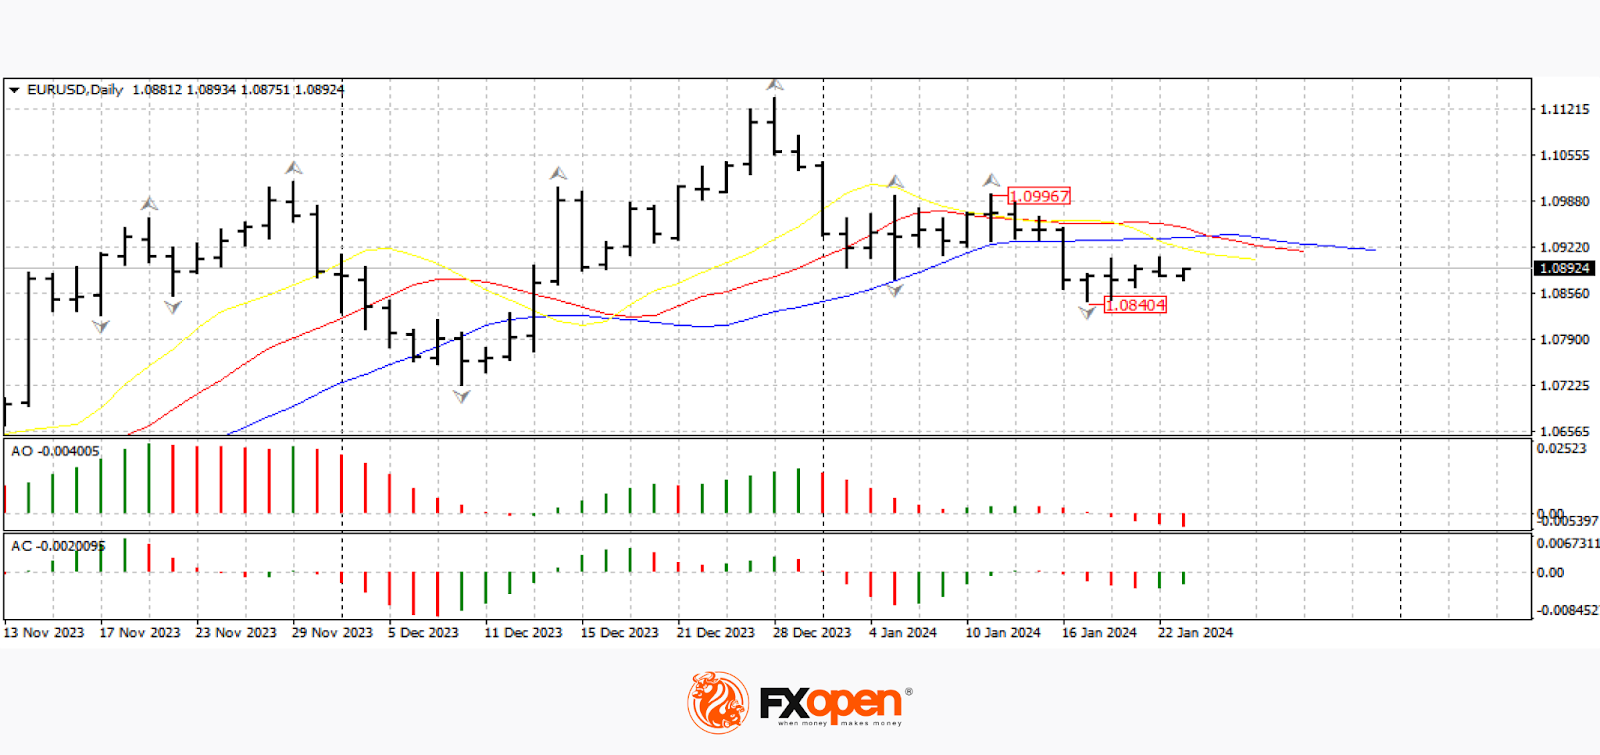
EUR/USD
The euro, after breaking the support at 1.0920, has been trading below the alligator lines on the daily timeframe for about a week. However, technical analysis of EUR/USD today suggests that there are no pronounced downward dynamics after the breakthrough of important levels: the price is trapped between 1.0900 and 1.0840.
Traders are likely awaiting the ECB's verdict; the European regulator's meeting is scheduled for Thursday. If officials' forecasts for the economic recovery of the Eurozone for the current year turn out to be pessimistic, the price may break support at 1.0840 and resume the downward movement towards 1.0700-1.0600. The breakdown of the downward scenario may be expected after a confident fixation above 1.1000.
This article represents the opinion of the Companies operating under the FXOpen brand only. It is not to be construed as an offer, solicitation, or recommendation with respect to products and services provided by the Companies operating under the FXOpen brand, nor is it to be considered financial advice.