
Sample Category Title
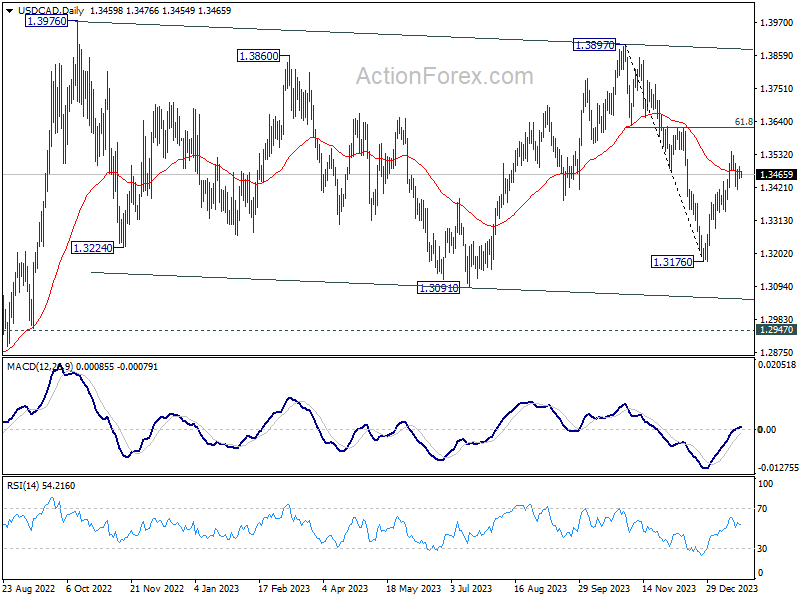
USD/CAD Daily Outlook
Daily Pivots: (S1) 1.3447; (P) 1.3469; (R1) 1.3485; More...
Intraday bias in USD/CAD remains neutral for moment. Consolidation from 1.3540 could extend further. But further rally is expected as long as 1.3342 minor support holds. Fall from 1.3897 should have completed at 1.3716. Break of 1.3540w ill target 1.3617 cluster resistance (61.8% retracement of 1.3897 to 1.3176 at 1.3622). Decisive break there will pave the way to 1.3897/3976 key resistance zone.
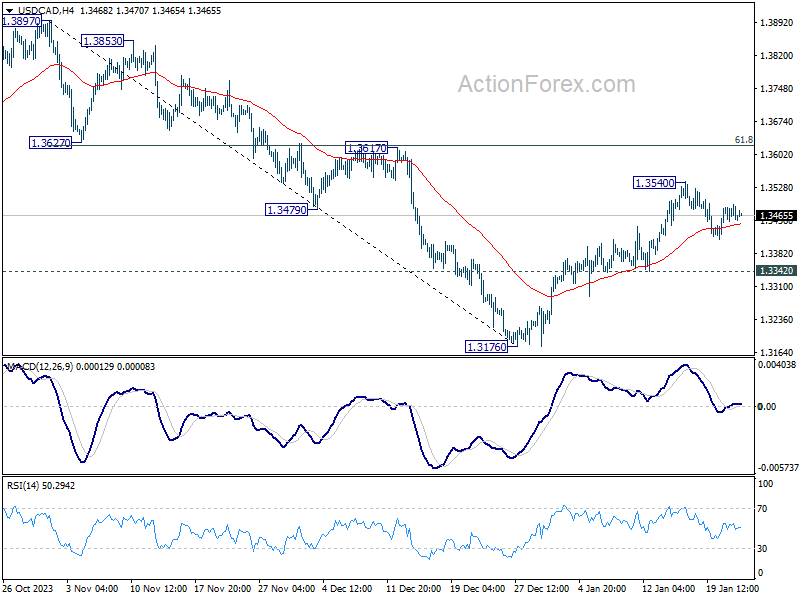
In the bigger picture, price actions from 1.3976 (2022 high) are viewed as a corrective pattern only. In case of another fall, strong support should emerge above 1.2947 resistance turned support to bring rebound. Overall, larger up trend from 1.2005 (2021 low) is still expected to resume through 1.3976 at a later stage.
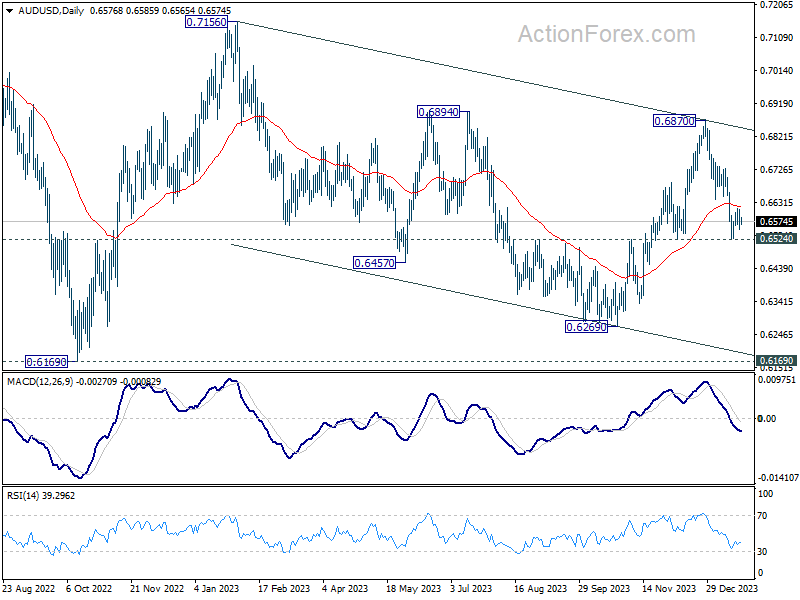
AUD/USD Daily Report
Daily Pivots: (S1) 0.6550; (P) 0.6581; (R1) 0.6610; More...
Intraday bias in AUD/USD stays neutral for the moment. Consolidation from 0.6524 could extend further. But further decline is expected as long as 0.6639 support turned resistance holds. Firm break of 0.6524 support will argue that whole rebound from 0.6269 has completed, and bring deeper fall to this support.
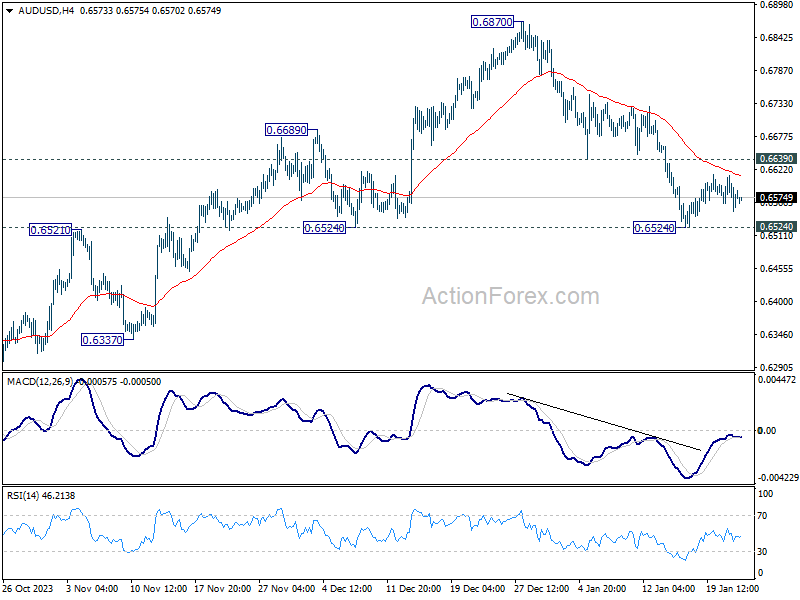
In the bigger picture, price actions from 0.6169 (2022 low) are seen as a medium term corrective pattern to the down trend from 0.8006 (2021 high). Sideway trading could continue in range of 0.6169/7156 for some more time. But as long as 0.7156 holds, an eventual downside breakout would be mildly in favor.
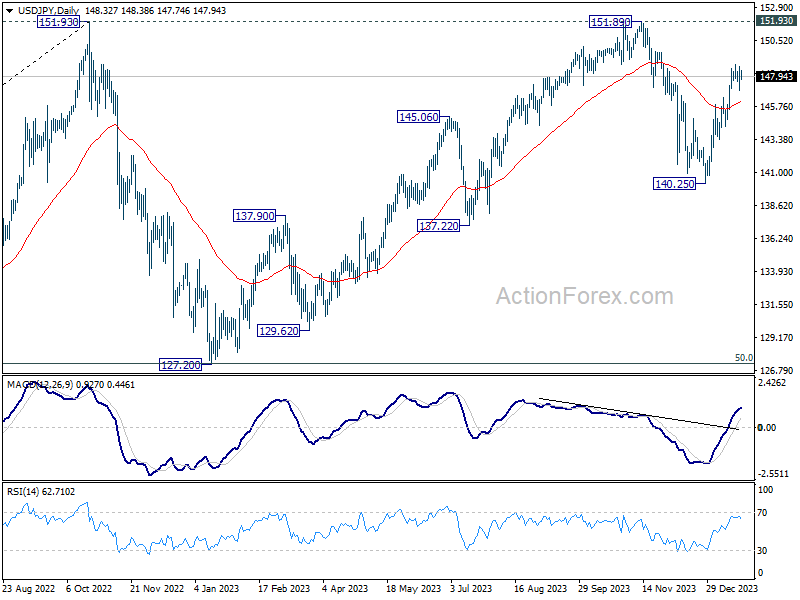
USD/JPY Daily Outlook
Daily Pivots: (S1) 147.34; (P) 148.02; (R1) 149.05; More...
Intraday bias in USD/JPY remains neutral as consolidation from 148.79 is extending. Deeper retreat cannot be ruled out, but further rally is expected as long as 145.97 resistance turned support holds. Corrective fall from 151.89 should have completed at 140.25 already. Break of 148.79 will resume the rise from there for retesting 151.89/93 key resistance zone.
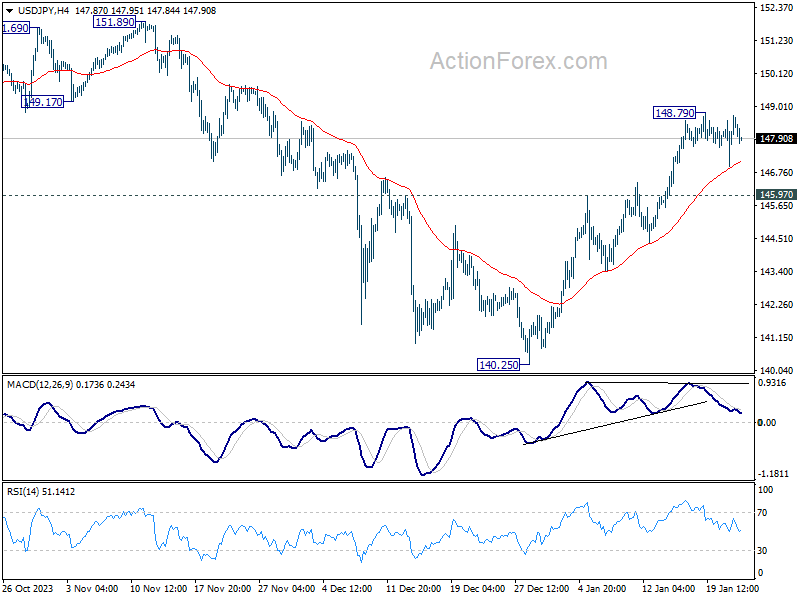
In the bigger picture, stronger than expected rebound from 140.25 dampened the original bearish review. Strong support from 55 W EMA (now at 141.89) is also a medium term bullish sign. Fall from 151.89 could be a correction to rise from 127.20 only. Decisive break of 151.89/93 will confirm resumption of long term up trend. This will now be the favored case as long as 140.25 support holds.
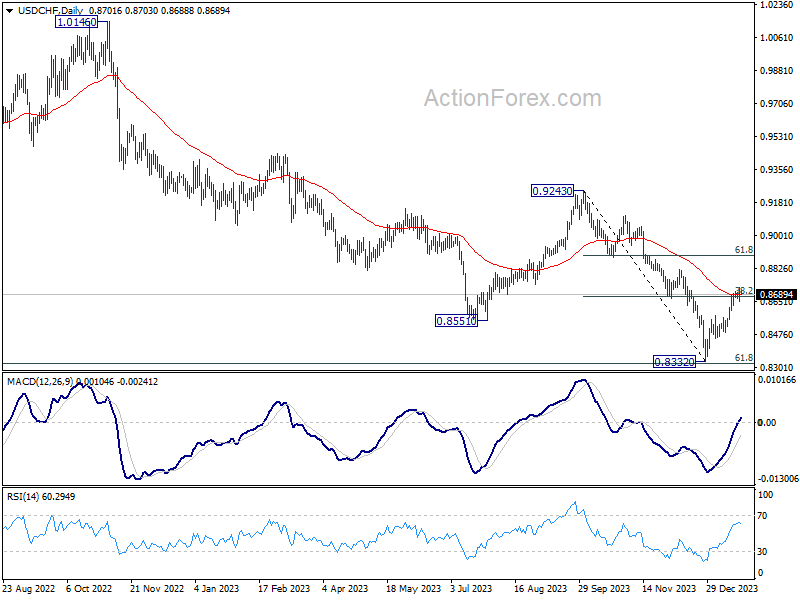
USD/CHF Daily Outlook
Daily Pivots: (S1) 0.8659; (P) 0.8694; (R1) 0.8737; More....
Intraday bias in USD/CHF is mildly on the upside at this point. Sustained trading above 38.2% retracement of 0.9243 to 0.8332 at 0.8680 and 55 D EMA (now at 0.8686) will turn near term outlook bullish for 61.8% retracement 0.8995. Nevertheless, break of 0.8632 minor support will turn intraday bias back to the downside for deeper pullback.
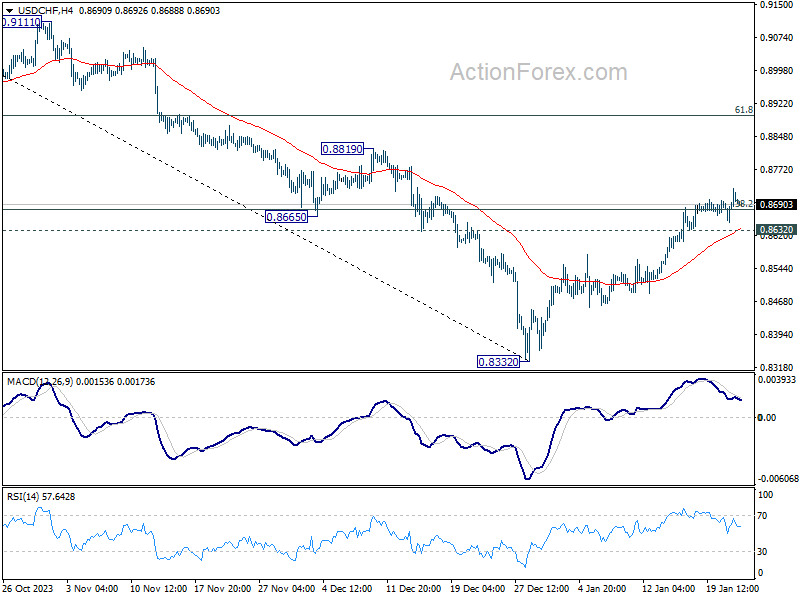
In the bigger picture, while rebound from 0.8332 could be strong, there is no clear sign of medium term bottoming yet. This rebound is tentatively seen as a corrective move for now. Also, outlook will stay bearish as long as 0.9243 resistance holds. Larger down trend from 1.0146 (2022 high) should resume through 0.8332 low at a later stage.
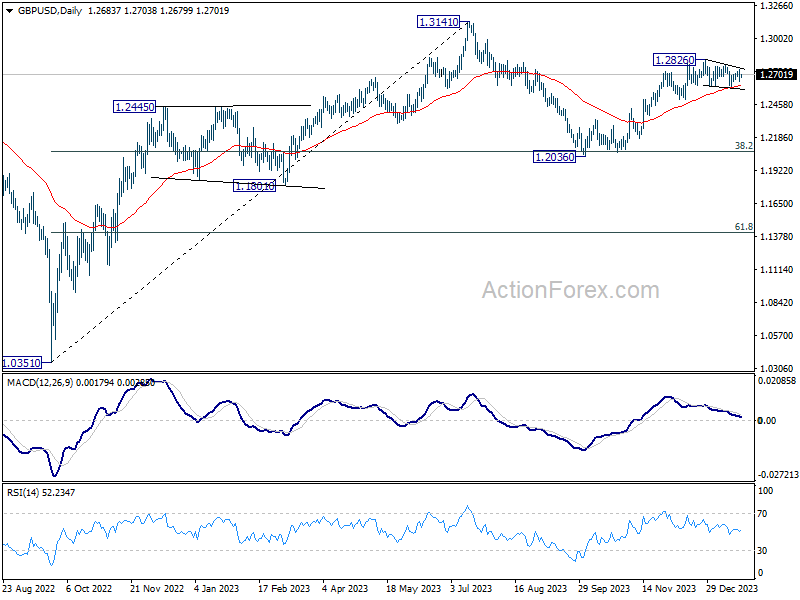
GBP/USD Daily Outlook
Daily Pivots: (S1) 1.2642; (P) 1.2694; (R1) 1.2740; More...
GBP/USD is still extending the consolidation pattern from 1.2826 and intraday bias remains neutral. Another fall cannot be ruled out, but downside will likely be contained above 1.2499 support to bring rebound. On the upside, firm break of 1.2784 resistance will suggest that the consolidation pattern has completed. Further rally should then be seen through 1.2826 towards 1.3141 high.
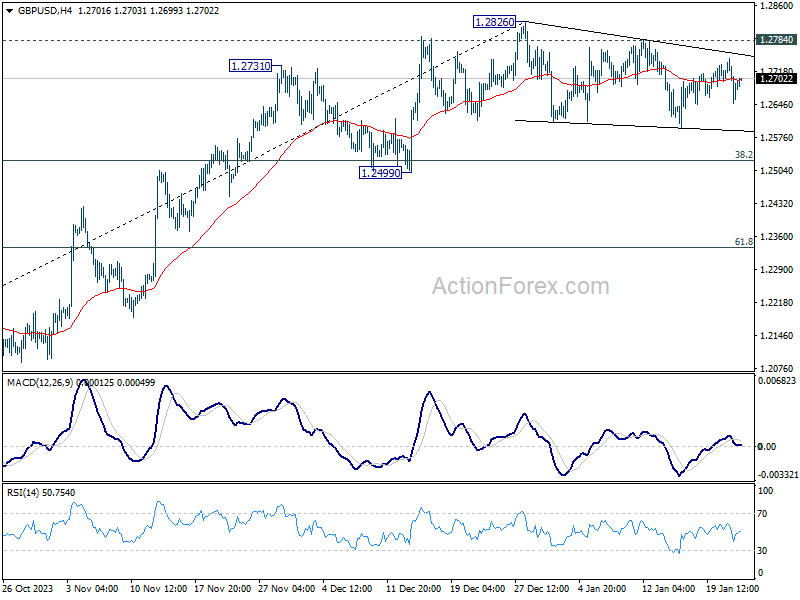
In the bigger picture, price actions from 1.3141 medium term top are seen as a corrective pattern to up trend from 1.0351 (2022 low). Rise from 1.2036 is seen as the second leg that's in progress. Upside should be limited by 1.3141 to bring the third leg of the pattern. Meanwhile, break of 1.2499 support will argue that the third leg has already started for 38.2% retracement of 1.0351 (2022 low) to 1.3141 at 1.2075 again.
NZD/JPY: JPY Crosses Under Downside Pressure after BoJ’s Hawkish Guidance
- Japanese Government Bond (JGB) yields on the upmove ex-post BoJ.
- Positive yield premium shrinkage (JGB over the rest of the world) may put further downside pressure on JPY crosses carry trades.
- Watch NZD/JPY where RBNZ may reduce its hawkish rhetoric reinforced by NZ Q4’s soft inflation data.
Bank of Japan (BoJ) concluded its first monetary policy meeting for 2024 yesterday and left its key short-term negative rate unchanged at -0.1% as expected.
The key takeaway from BoJ is more forceful forward guidance with a hawkish tilt that arose from BoJ Governor Ueda’s press conference where he sounded more confident that BoJ will likely hit its 2% inflation target in the medium to long term, a contrast to his previous remarks in prior press conferences where he had stressed that accommodating ultra-easy monetary policy was still required because of the “unclear path” of inflation trajectory in Japan.
Hence, this latest set of forward guidance from BoJ has sent a signal to the markets that an end to its short-term negative interest rates policy is imminent, high odds are now being priced for the removal of negative interest rates on its April or June meeting, also taking into account that BoJ has allowed the 10-year Japanese Government Bond (JGB) bond yield to move more freely according to market forces after it scrapped the hard-capped 1% upper limit to make it as a “reference level” during last October monetary policy meeting.
JGB yields are moving up
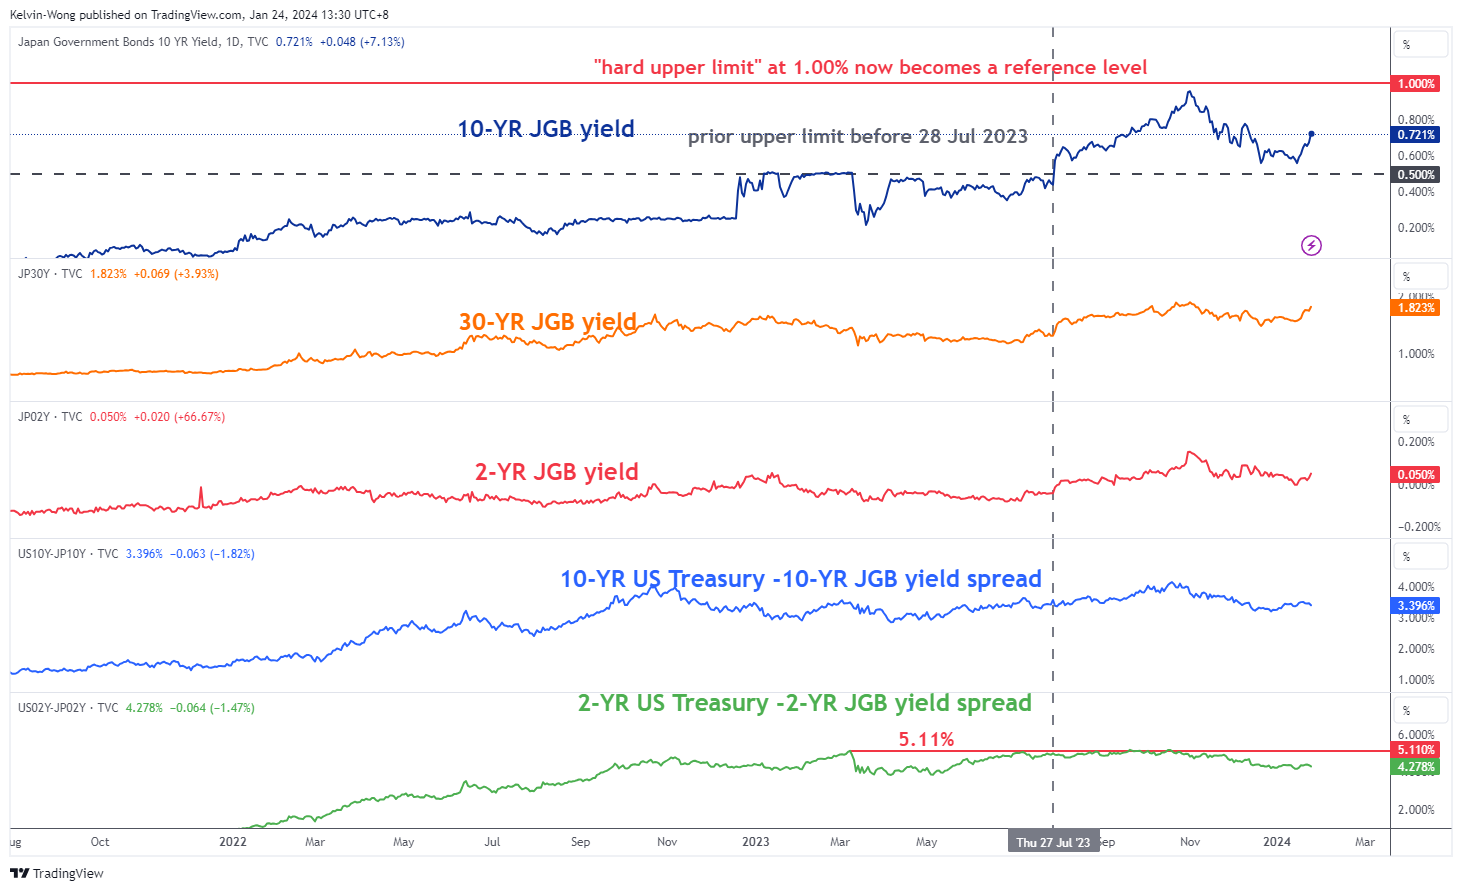
Fig 1: JGB yields medium-term trends as of 24 Jan 2024 (Source: TradingView, click to enlarge chart)
All in all, it has sent the 2-year and 10-year JGB yields rallying where the 10-year JGB yield has ticked up by 16 basis points (bps) from 15 January 2024 to 0.72% at this time of the writing. In addition, the short-end 2-year JGB yield rallied by 5 bps, albeit at a slower pace to 0.05% over the same period (see Fig 1).
JPY crosses carry trades under downside pressure
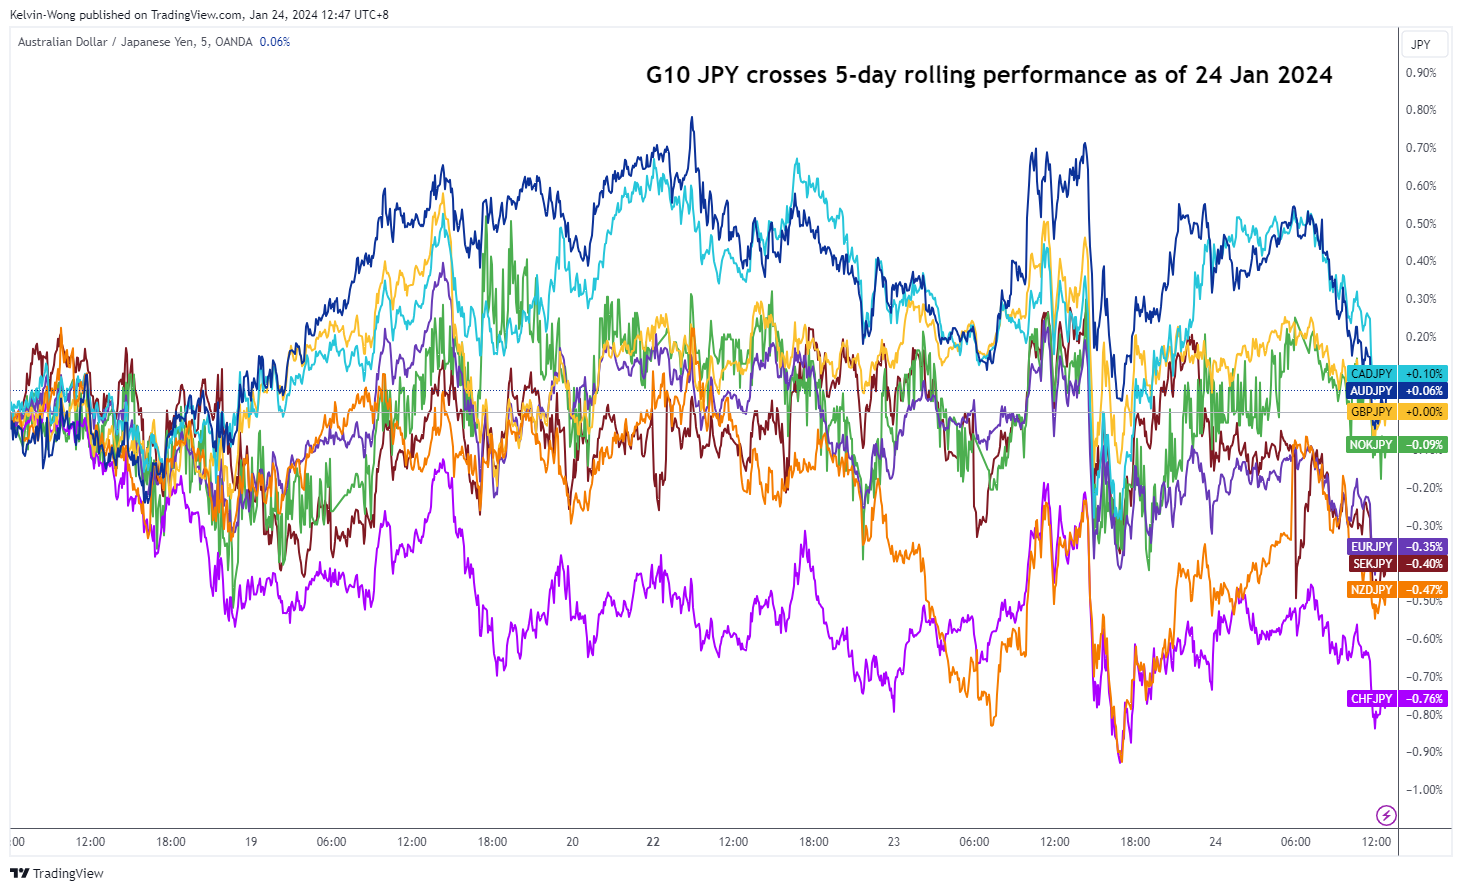
Fig 2: 5-day rolling performances of G-10 JPY crosses as of 24 Jan 2024 (Source: TradingView, click to enlarge chart)
The recent up moves (potentially future rallies due to the anticipated faster pace normalization of BoJ’s current ultra-easy monetary policy) in the JGB yields have reduced the positive carry trade yield premium capture opportunities via using JPY as a funding currency.
Since it is getting more “costly” now to deploy such carry trade set-ups, it has triggered a reflexive negative feedback loop into the price actions of the G-10 JPY crosses and the worst hits were the CHF/JPY (-0.76%), and NZD/JPY (-0.47%) based on a 5-day rolling performance basis at this time of the writing (see Fig 1).
Yield spread premium shrinkage of New Zealand Government Bond
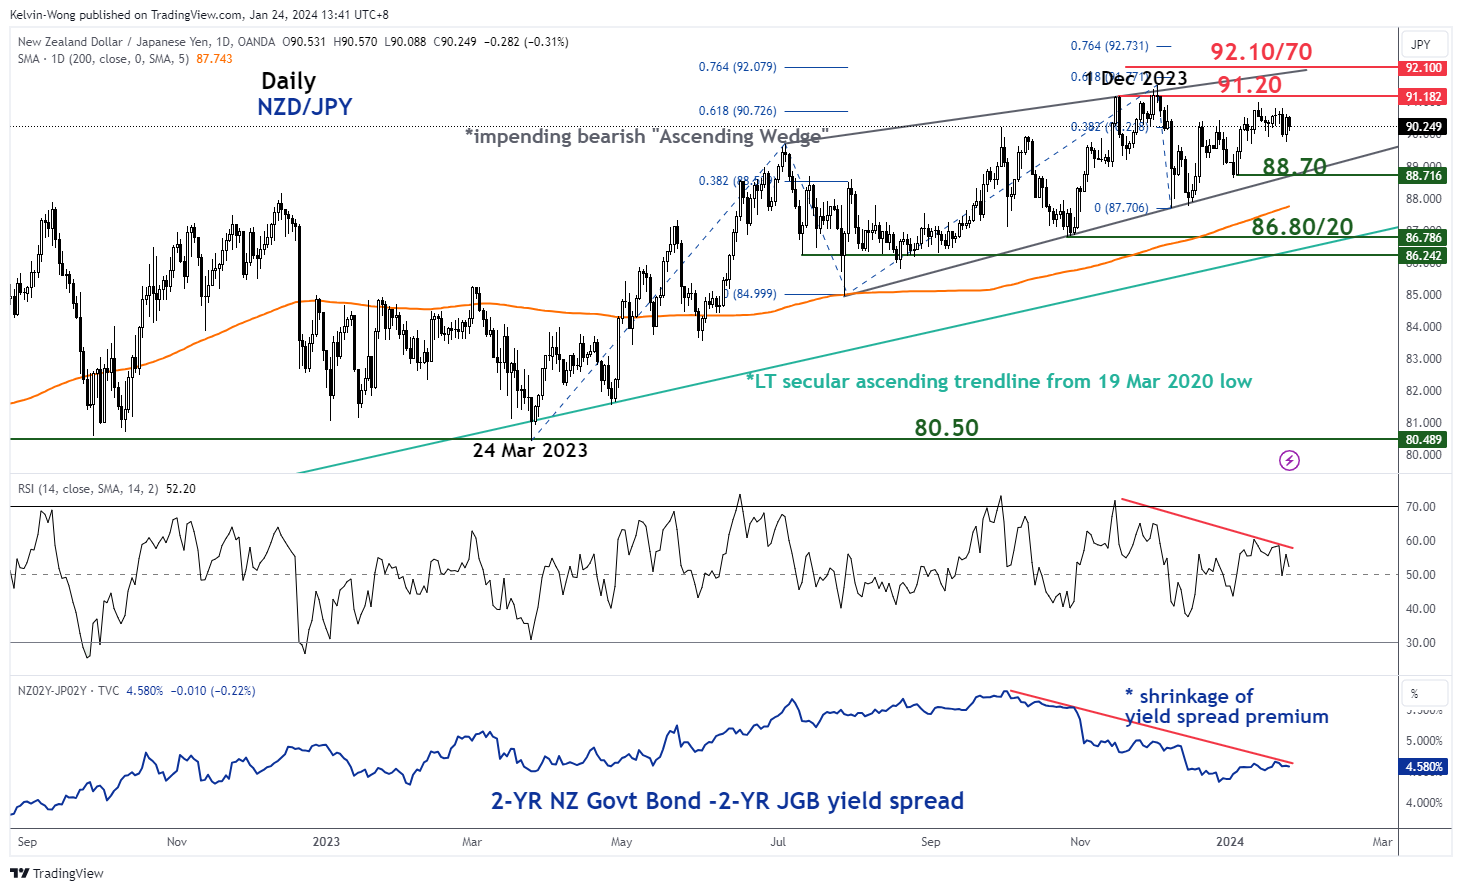
Fig 3: NZD/JPY medium-term trend as of 24 Jan 2024 (Source: TradingView, click to enlarge chart)
The 2-year yield spread premium of the New Zealand Government Bond over JGB has shrunk significantly from a decade-plus high of 5.80% printed recently on 3 October 2023 to 4.58% today (-122 bps) which in turn acts as another potential downside pressure catalyst on the NZD/JPY cross pair.
Also, today’s release of New Zealand’s Q4 2023 inflation rate continued to decelerate to 4.7% y/y from 5.6% y/y in Q3 2023; its lowest reading since Q2 2021 which is likely to reduce the current hawkish rhetoric of New Zealand central bank, RBNZ.
The potential net result; a further slide in the 2-year New Zealand Government Bond yield may be still on the cards (see Fig 3)
In the lens of technical analysis, the long-term secular uptrend phase of the NZD/JPY from its 19 March 2020 swing low may be coming to a terminal end where its price actions have recently traced out an impending multi-month bearish “Ascending Wedge” configuration since 28 July 2023 coupled with a bearish divergence condition seen on its daily RSI momentum indicator.
These observations suggest that NZD/JPY may be evolving into a major toppish configuration where a potential significant multi-month corrective decline could unfold next.
Watch the 90.75 key short-term resistance on NZD/JPY
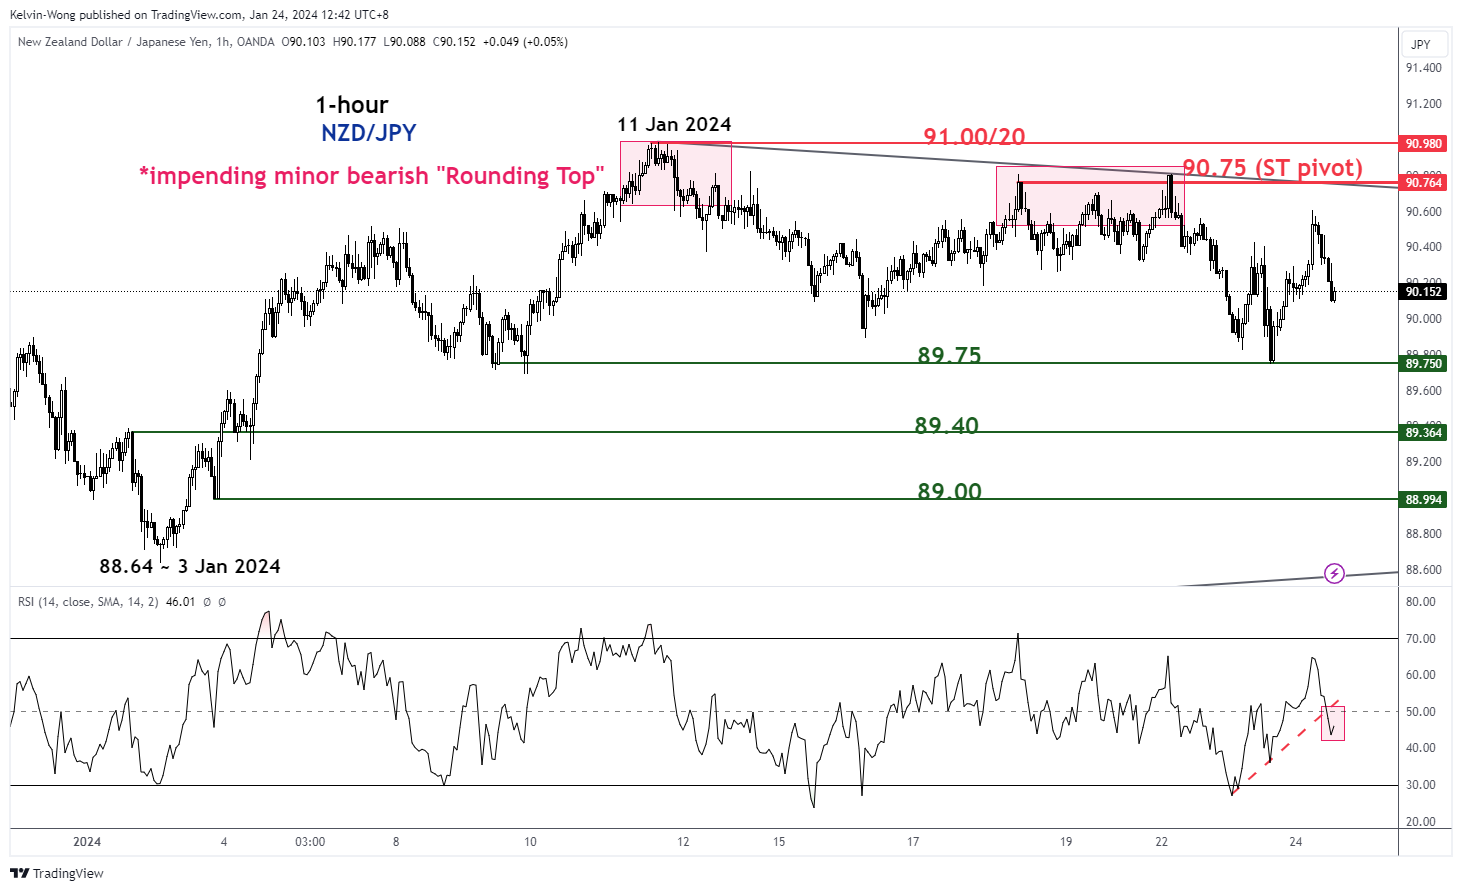
Fig 4: NZD/JPY minor short-term trend as of 24 Jan 2024 (Source: TradingView, click to enlarge chart)
In the short-term as depicted on the hourly chart, the price actions of NZD/JPY are suggesting further potential downside as it traced out a minor bearish “Rounding Top” configuration with a current trendline breakdown of its hourly RSI momentum indicator below the 50 level.
A break below the near-term support of 89.75 (neckline of the minor “Rounding Top”) exposes the next intermediate supports at 89.40 and 89.00.
On the other hand, clearance above the 90.75 key short-term pivotal resistance negates the bearish tone to see the major resistance coming in at 91.00/91.20.
EUR/USD Daily Outlook
Daily Pivots: (S1) 1.0812; (P) 1.0864; (R1) 1.0906; More...
EUR/USD's breach of 1.0843 temporary low suggests that fall from 1.1138 is resuming. Intraday bias is back on the downside for 1.0722 support first. Decisive break there will argue that whole rise from 1.0447 has completed, and target this low. Nevertheless, on the upside, firm break of 1.0915 will indicate short term bottoming, on bullish convergence condition in 4H MACD, and turn bias back to the upside for stronger rebound.
In the bigger picture, price actions from 1.1274 are viewed as a corrective pattern to rise from 0.9534 (2022 low). Rise from 1.0447 is seen as the second leg. While further rally could cannot be ruled out, upside should be limited by 1.1274 to bring the third leg of the pattern. Meanwhile, sustained break of 1.0722 support will argue that the third leg has already started for 1.0447 and below.
Forex Markets Hesitant, Eurozone and UK PMIs, BoC in Focus
The forex markets are currently extending a phase of indecision. Dollar, after briefly rallying against Euro and Swiss Franc, saw its gains diminish. Australian Dollar's initial surge, fueled by optimism over China's proposed stock market rescue plan, also quickly dissipated.
Presently, Japanese Yen emerges as the strongest currency for the week, continuing its near-term consolidation. It is closely followed by Dollar and British Pound. On the other end of the spectrum, Australian Dollar is lagging, trailed by Canadian Dollar and Euro.
But it's emphasized that all major pairs and crosses are trading inside last week's range, only except GBP/CHF. PMI data from Eurozone UK has the potential to trigger some meaning movement, especially in EUR/GBP. Then, the spotlight will turn to BoC rate decision later in the day.
It's widely anticipated that BoC will hold the interest rate steady at the 22-year peak of 5.00%. This expectation is set against the backdrop of Canada's headline inflation rate, which recently re-accelerated to 3.4% in December. BoC Governor Tiff Macklem is expected to underscore the ongoing challenge of taming inflation and to caution against any premature considerations for a rate cut.
The consensus among economists is that any potential rate reduction by the BoC would most likely occur in June or later. Given that's it's only January now, it is improbable that Macklem will offer any substantial hints or directional guidance at this juncture.
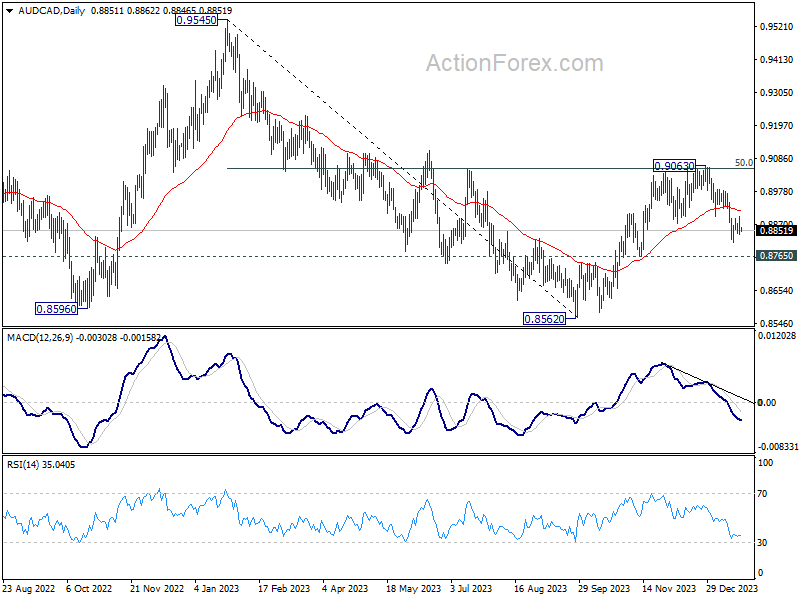
Technically, AUD/CAD's rebound from 0.8562 should have completed at 0.9063, after hitting 50% retracement of 0.9545 to 0.8562 at 0.9054. Deeper fall should be seen to 0.8765. Sustained break there will target 0.8562 low. This will remain the favored case as long as 55 D EMA (now at 0.8912) holds.
In Asia, at the time of writing, Nikkei is down -1.00%. Hong Kong HSI is up 0.42%. China Shanghai SSE is down -0.70%. Singapore Strait Times is up 0.21%. Japan 10-year JGB yield is up 0.0900 at 0.727. Overnight, DOW fell -0.25%. S&P 500 rose 0.29%. NASDAQ rose 0.43%. 10-year yield rose 0.048 to 4.142.
Japan's PMI shows modest growth, manufacturing still in contraction
Japan's PMI Manufacturing rose fractionally from 47.9 to 48.0 in January, below expectation of 48.2. Manufacturing remained in contraction for the eighth consecutive months. PMI Services rose from 5.15 to 52.7. PMI Composite rose from 50.0 to 51.1.
Usamah Bhatti, Economist at S&P Global Market Intelligence, noted that while "modest" the private sector is having the strongest growth since September. However, there was disparity between the sectors, with services reaching a four-month high, while manufacturing marked its eighth consecutive month of contraction.
Regarding inflation, Bhatti said input price inflation "remains high historically". But output inflation eased to its "lowest since February 2022". This indicates that while input costs are still elevated, businesses are not passing these costs fully onto consumers.
Japan's exports exceed JPY 1T in 2023, US reclaims top export destination
Japan's exports rose 9.8% yoy to JPY 9648B in December, marking the biggest increase in a year. This boost was largely driven by 20.4% yoy jump in exports to US, predominantly from the automotive sector, while exports to Europe climbed by 10.3% yoy. Notably, shipments to China saw 9.6% yoy rise, registering their first growth in 13 months, primarily led by chip-making equipment. In contrast, imports declined -6.8% yoy to JPY 9586B. Consequently, trade balance turned positive, recording JPY 62.1B surplus.
Analyzing the whole year, Japan's trade deficit in 2023 more than halved to JPY -9.29T from the previous year. The country's total exports rose by 2.8% to reach JPY 100.89T , surpassing the JPY 100T mark for the first time ever. Meanwhile, total imports saw -7.0% decrease to JPY 110.18T.
A significant shift was observed in Japan's export destinations in 2023. US reclaimed its position as the largest recipient of Japanese exports by value for the first time in four years, surpassing China. Exports to US reached JPY 20.27T, showing 11.0% increase, while exports to China decreased by -6.5% to JPY 17.76T.
New Zealand CPI slows to 0.5% qoq, 4.7% yoy in Q4
New Zealand CPI rose 0.5% qoq in Q4, down from 1.8% qoq in Q3, matched expectations. Tradeable inflation turned negative to -0.2% qoq, from 1.8% qoq. Non-tradeable inflation slowed to 1.1% qoq, down from 1.7% qoq.
Annually, CPI slowed from 5.6% yoy to 4.7% yoy, matched expectations. Tradeable inflation slowed from 4.7% yoy to 3.0% yoy. non-tradeable inflation also slowed from 6.3% yoy to 5.9% yoy.
"While this is the smallest annual rise in the CPI in over two years, it remains above the Reserve Bank of New Zealand's target range of 1 to 3 percent," consumers prices senior manager Nicola Growden said.
Australia's PMI manufacturing Hits 11-month high, services Lagging
Australia PMI Manufacturing rose from 47.6 to 50.3 in January, back in expansion, and a 11-month high. PMI Services rose slightly from 47.1 to 47.9, a 3-month high. PMI Composite rose from 46.9 to 48.1, a 4-month high, but still in contraction.
Warren Hogan, Chief Economic Advisor at Judo Bank noted the PMI data indicates a that the economy remains on RBA's "narrow path" for soft landing. He highlights the manufacturing sector's rebound as a key factor in mitigating broader economic downturn risks.
Despite the general economic slowdown, Hogan observes that labor demand remains unexpectedly robust, differing from past economic cycles. However, he cautions that inflation pressures are still high, pointing out, "Input and output price indexes remain at levels suggesting CPI inflation is above the RBA's target range."
SNB's Jordan: Real Franc appreciation hurts, yet no recession in sight
SNB Chairman Thomas Jordan, in his overnight address at an event, acknowledged the impact of the Franc's nominal appreciation on lowering inflation. However, he warned, the "Franc has also appreciated in real terms in 2023. And that hurts, companies feel that."
Despite the challenges posed by Franc's appreciation, Jordan expressed confidence in the Swiss economy's resilience. "Economists are confident that there won't be a recession — and we are also confident, otherwise we would forecast one," he commented, adding "So no recession, just weak growth."
Looking ahead, Jordan reiterated SNB's inflation expectations, stating that they anticipate Swiss inflation to approach but not exceed the 2% ceiling of their target range this year. The central bank does not foresee inflation breaching this mark until 2026.
Looking ahead
PMI from Eurozone and UK are the main focuses in European session. Later in the day, spotlight is on BoC rate decision. US will publish PMIs too.
EUR/USD Daily Outlook
Daily Pivots: (S1) 1.0812; (P) 1.0864; (R1) 1.0906; More...
EUR/USD's breach of 1.0843 temporary low suggests that fall from 1.1138 is resuming. Intraday bias is back on the downside for 1.0722 support first. Decisive break there will argue that whole rise from 1.0447 has completed, and target this low. Nevertheless, on the upside, firm break of 1.0915 will indicate short term bottoming, on bullish convergence condition in 4H MACD, and turn bias back to the upside for stronger rebound.
In the bigger picture, price actions from 1.1274 are viewed as a corrective pattern to rise from 0.9534 (2022 low). Rise from 1.0447 is seen as the second leg. While further rally could cannot be ruled out, upside should be limited by 1.1274 to bring the third leg of the pattern. Meanwhile, sustained break of 1.0722 support will argue that the third leg has already started for 1.0447 and below.
Economic Indicators Update
| GMT | Ccy | Events | Actual | Forecast | Previous | Revised |
|---|---|---|---|---|---|---|
| 21:45 | NZD | CPI Q/Q Q4 | 0.50% | 0.50% | 1.80% | |
| 21:45 | NZD | CPI Y/Y Q4 | 4.70% | 4.70% | 5.60% | |
| 22:00 | AUD | Manufacturing PMI Jan P | 50.3 | 47.6 | ||
| 22:00 | AUD | Services PMI Jan P | 47.9 | 47.1 | ||
| 23:30 | AUD | Westpac Leading Index M/M Dec | 0.00% | 0.10% | ||
| 23:50 | JPY | Trade Balance (JPY) Dec | -0.41T | -0.45T | -0.41T | -0.35T |
| 00:30 | JPY | Manufacturing PMI Jan P | 48 | 48.2 | 47.9 | |
| 00:30 | JPY | Services PMI Jan P | 52.7 | 51.5 | ||
| 08:15 | EUR | France Manufacturing PMI Jan P | 42.5 | 42.1 | ||
| 08:15 | EUR | France Services PMI Jan P | 46 | 45.7 | ||
| 08:30 | EUR | Germany Manufacturing PMI Jan P | 43.7 | 43.3 | ||
| 08:30 | EUR | Germany Services PMI Jan P | 49.5 | 49.3 | ||
| 09:00 | EUR | Eurozone Manufacturing PMI Jan P | 44.8 | 44.4 | ||
| 09:00 | EUR | Eurozone Services PMI Jan P | 49.1 | 48.8 | ||
| 09:30 | GBP | Manufacturing PMI Jan P | 46.7 | 46.2 | ||
| 09:30 | GBP | Services PMI Jan P | 53.5 | 53.4 | ||
| 14:45 | CAD | BoC Interest Rate Decision | 5.00% | 5.00% | ||
| 14:45 | USD | Manufacturing PMI Jan P | 47.7 | 47.9 | ||
| 14:45 | USD | Services PMI Jan P | 51.1 | 51.4 | ||
| 15:30 | USD | Crude Oil Inventories | -1.2M | -2.5M | ||
| 15:30 | CAD | BoC Press Conference |
Technical Outlook and Review
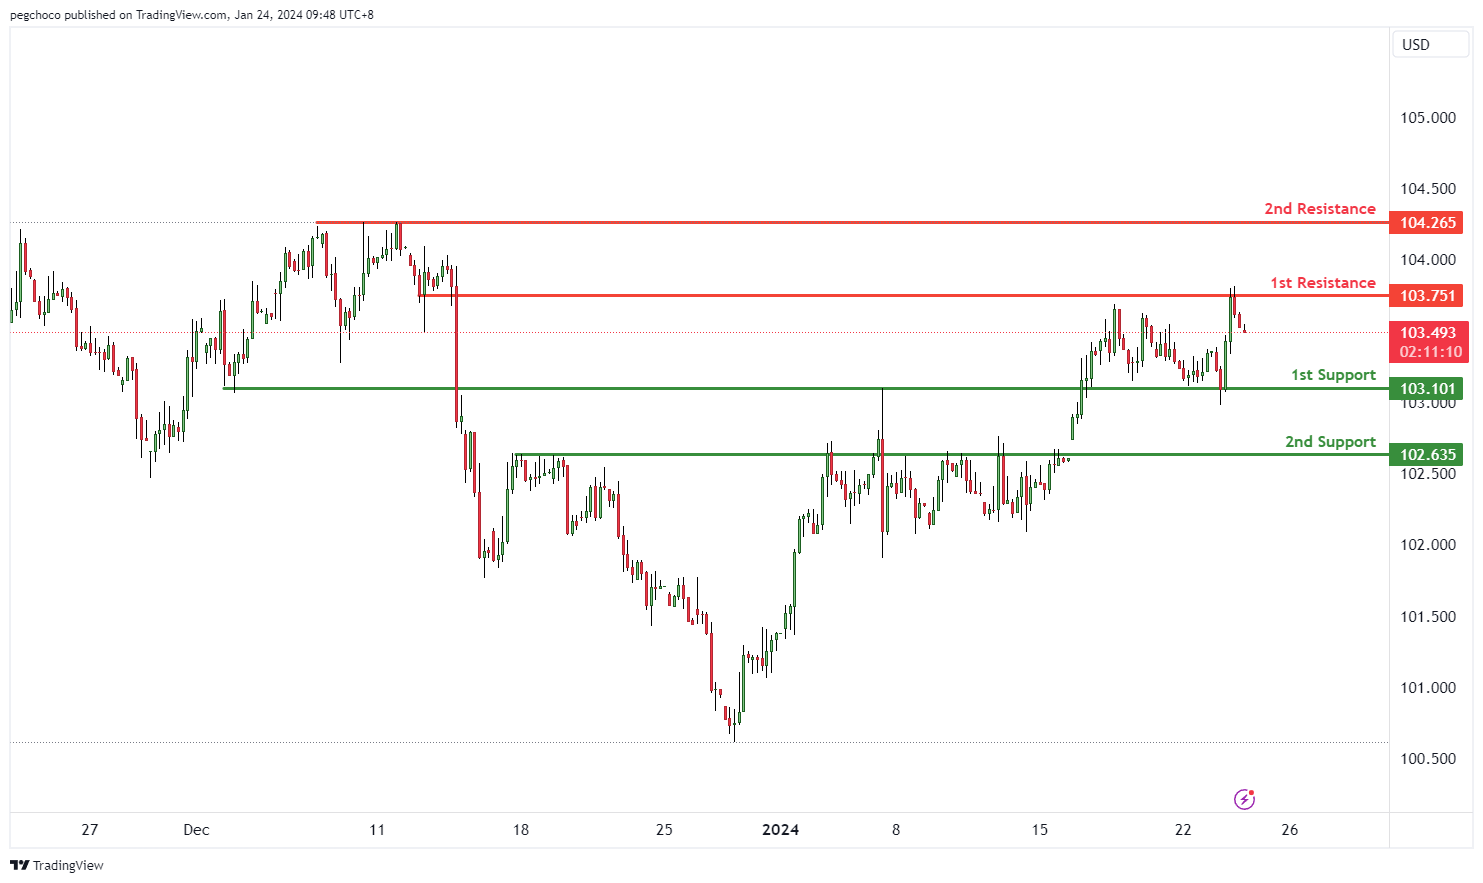
DXY:
The DXY (US Dollar Currency Index) chart is currently displaying a bearish overall momentum, indicating weakness in the US Dollar. There is a potential for a bearish continuation in the price towards the 1st support level.
The 1st support level at 103.10 is considered significant as it represents an overlap support, indicating that this price level has previously acted as both support and resistance. This suggests that it may be a strong area where price could potentially find support during a bearish move.
The 2nd support level at 102.63 is identified as a pullback support, implying that it might serve as a notable support zone during price pullbacks.
On the resistance side, the 1st resistance level at 103.75 is recognized as an overlap resistance, signifying that this price level has historically served as both support and resistance. This historical significance makes it a potential barrier where selling pressure could emerge.
The 2nd resistance level at 104.26 is categorized as a multi-swing high resistance, indicating that it represents a historical point where the price has encountered resistance and potential selling interest.
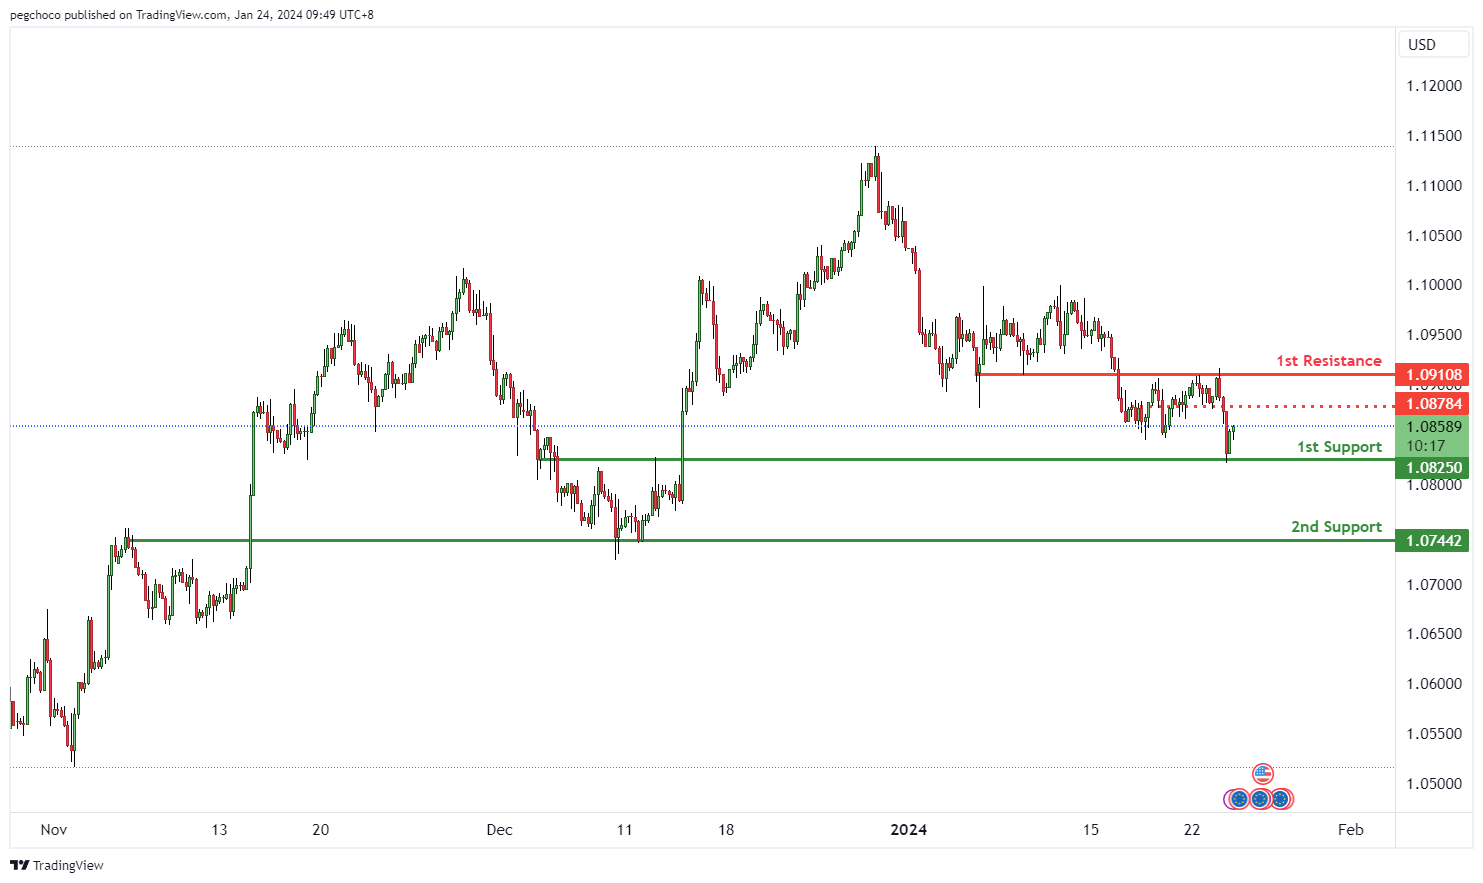
EUR/USD:
The EUR/USD trading pair is currently exhibiting a bullish overall momentum, indicating strength in the Euro relative to the US Dollar. Your analysis suggests that there is potential for a bullish continuation in the price towards the 1st resistance level.
The 1st support level at 1.0825 is considered significant as it represents an overlap support, indicating that this price level has previously acted as both support and resistance. This suggests that it may be a strong area where price could potentially find support during a bullish move.
The 2nd support level at 1.0744 is also identified as an overlap support, further emphasizing its historical significance as a level where price has previously found support.
On the resistance side, the 1st resistance level at 1.0910 is recognized as an overlap resistance, signifying that this price level has historically served as both support and resistance. This makes it a potential barrier where selling pressure may emerge.
Additionally, there is an intermediate resistance level at 1.0878, characterized as pullback resistance. This suggests that it might act as a notable resistance point during price pullbacks.
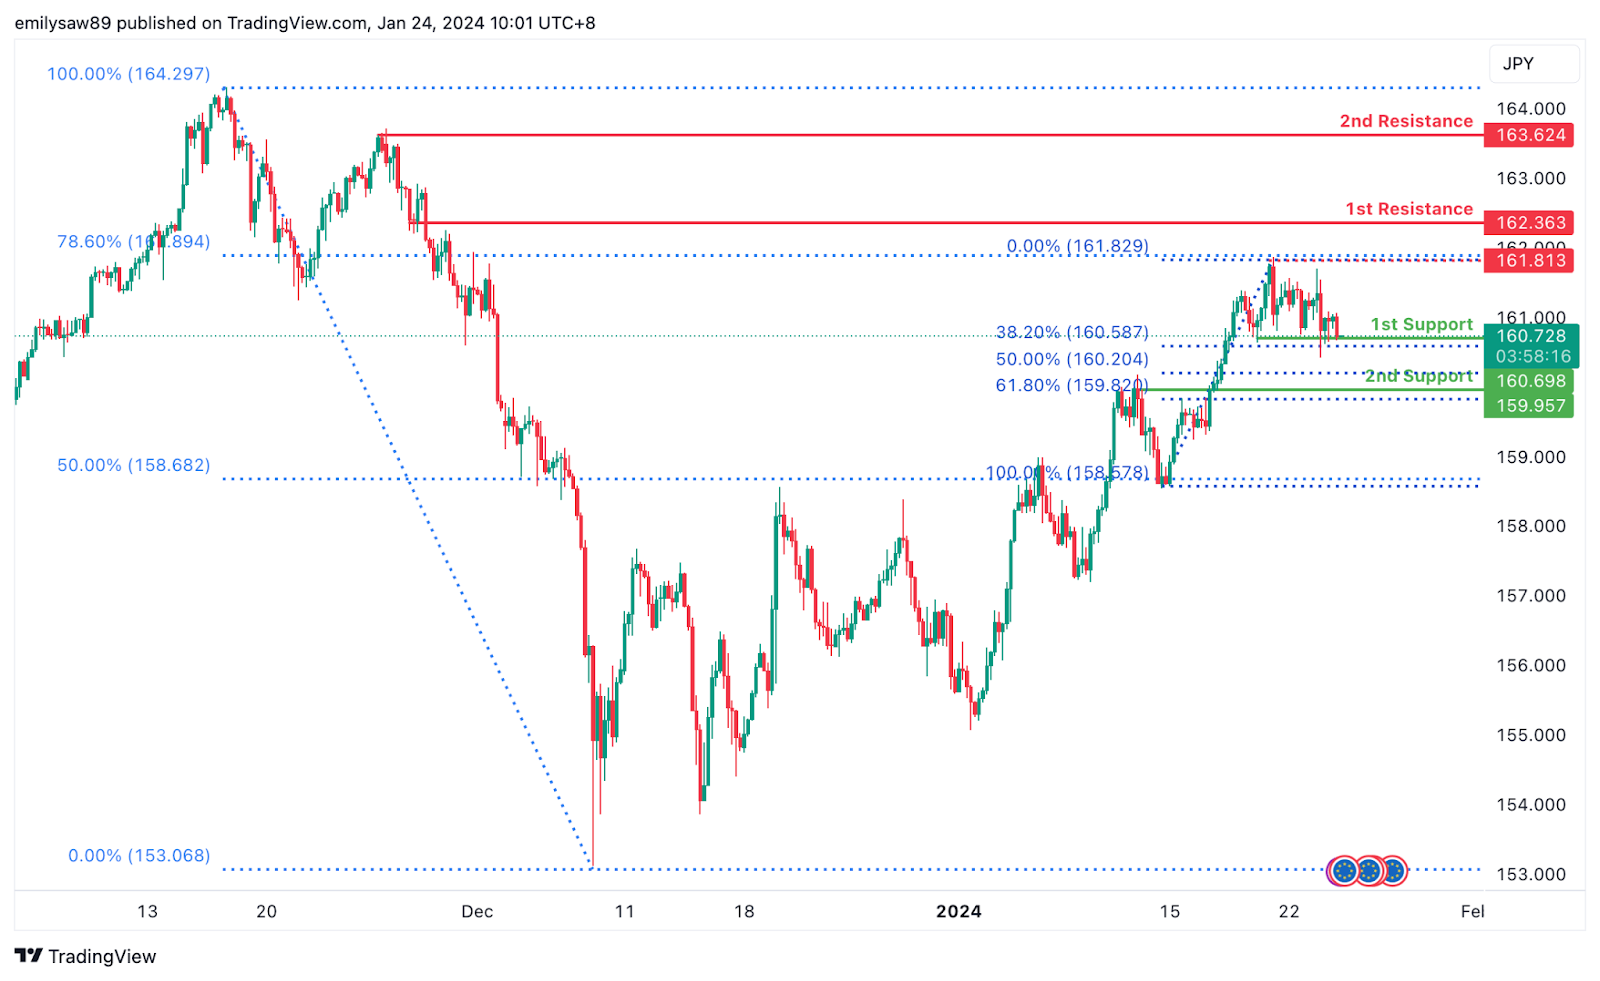
EUR/JPY:
The EUR/JPY chart currently exhibits a bearish overall momentum, indicating a downward trend in prices. Traders should consider potential levels for a bearish continuation.
The 1st support at 160.70 is identified as a pullback support and coincides with the 38.20% Fibonacci Retracement. This level is historically significant, representing a zone where buying interest has previously emerged. Additionally, the 2nd support at 159.96 is recognized as an overlap support and aligns with the 61.80% Fibonacci Retracement, providing added confluence to the support zone.
On the resistance side, the 1st resistance at 162.36 represents a level where selling interest may intensify, acting as a pullback resistance. The 2nd resistance at 163.62 is noteworthy for being a swing high resistance, indicating a potential barrier to upward movement.
An intermediate resistance level at 161.81 is also highlighted as a point where the price may encounter selling pressure, aligning with both swing high resistance and the 78.60% Fibonacci Retracement.
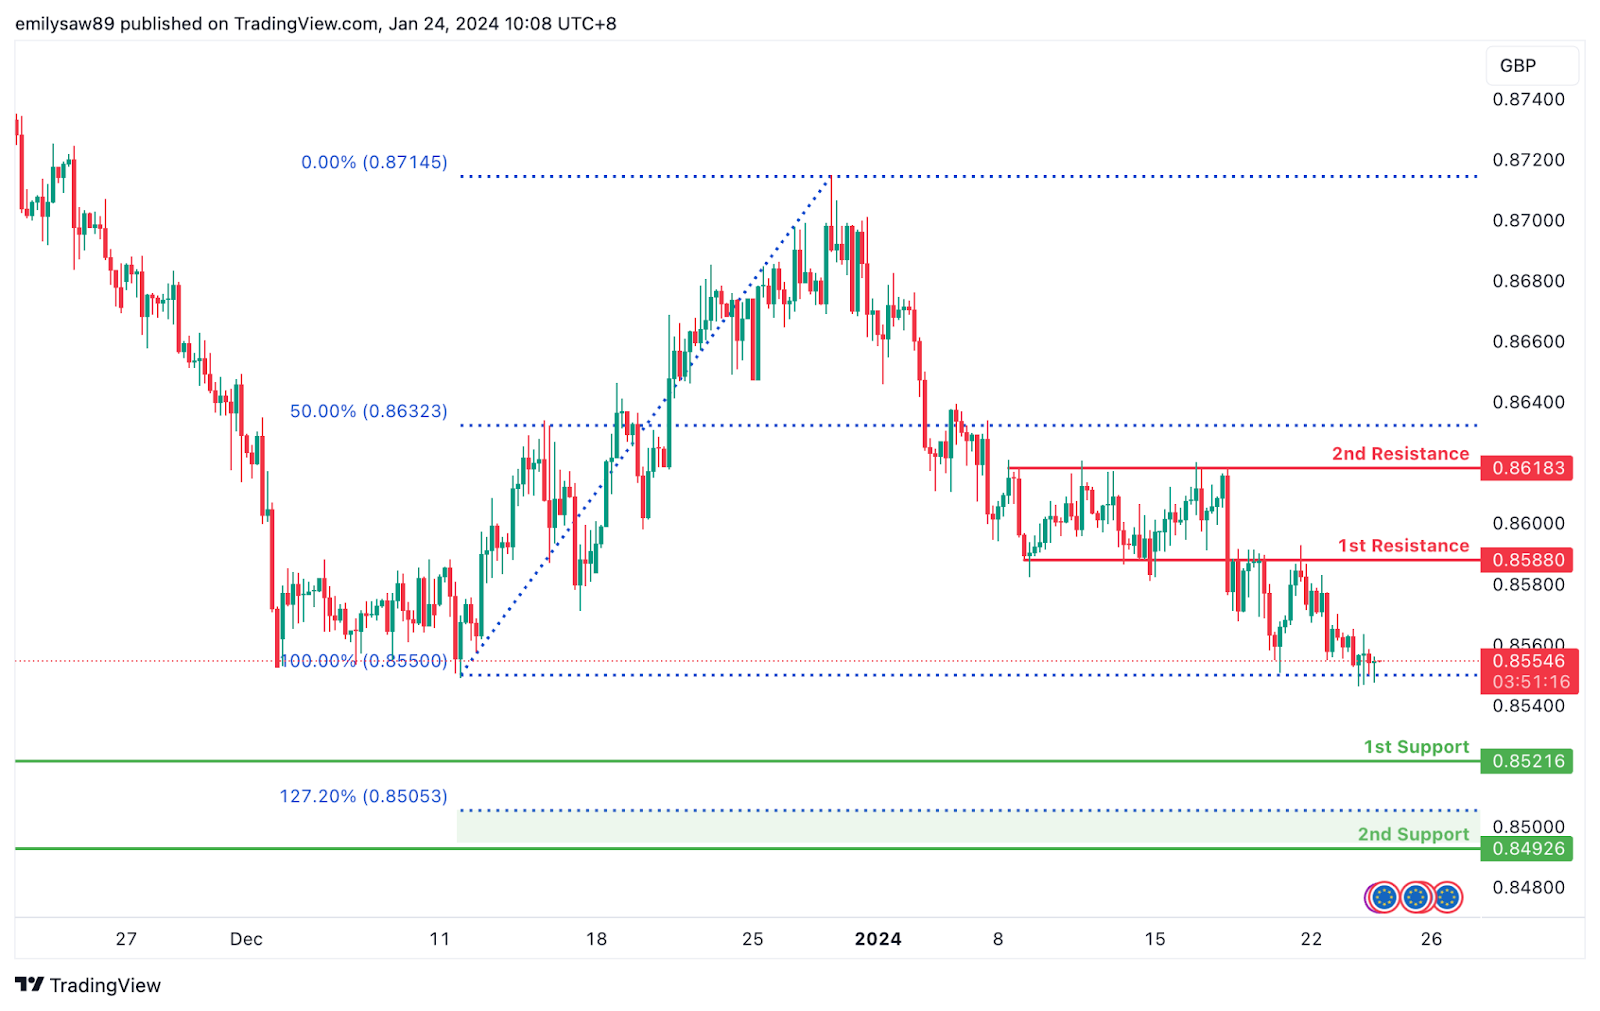
EUR/GBP:
The EUR/GBP chart currently indicates a bearish overall momentum, signaling a downward trend in prices. Traders should consider potential levels for a bearish continuation.
The 1st support at 0.8522 is identified as a swing low support, suggesting historical significance as a level where buying interest has previously emerged. Additionally, the 2nd support at 0.8493 aligns with both swing low support and the 127.20% Fibonacci Extension, adding confluence to the potential support zone.
On the resistance side, the 1st resistance at 0.8588 is recognized as an overlap resistance, indicating a level where selling interest may intensify. The 2nd resistance at 0.8618 represents a multi-swing high resistance, suggesting a potential barrier to upward movement.
GBP/USD:
The GBP/USD trading pair is currently experiencing a bullish overall momentum, indicating strength in the British Pound relative to the US Dollar. According to your analysis, there is potential for a bullish continuation in the price towards the 1st resistance level.
The 1st support level at 1.2642 is considered significant due to it being an overlap support, suggesting that this price level has historically acted as both support and resistance. Additionally, it aligns with the 61.80% Fibonacci Retracement level, adding further significance to this support zone.
The 2nd support level at 1.2596 is identified as a swing low support, indicating that this level corresponds to a previous significant low point on the chart and reinforcing its importance as a support level.
On the resistance side, the 1st resistance level at 1.2763 is recognized as a multi-swing high resistance. It also coincides with the 78.60% Fibonacci Retracement level, making it a potential strong resistance point where selling pressure may emerge.
The 2nd resistance level at 1.2813 is characterized as a swing high resistance, indicating its historical significance as a point where the price has encountered resistance.
Additionally, there is an intermediate resistance level at 1.2700, identified as pullback resistance. This level suggests that it might act as a notable resistance point during price pullbacks.
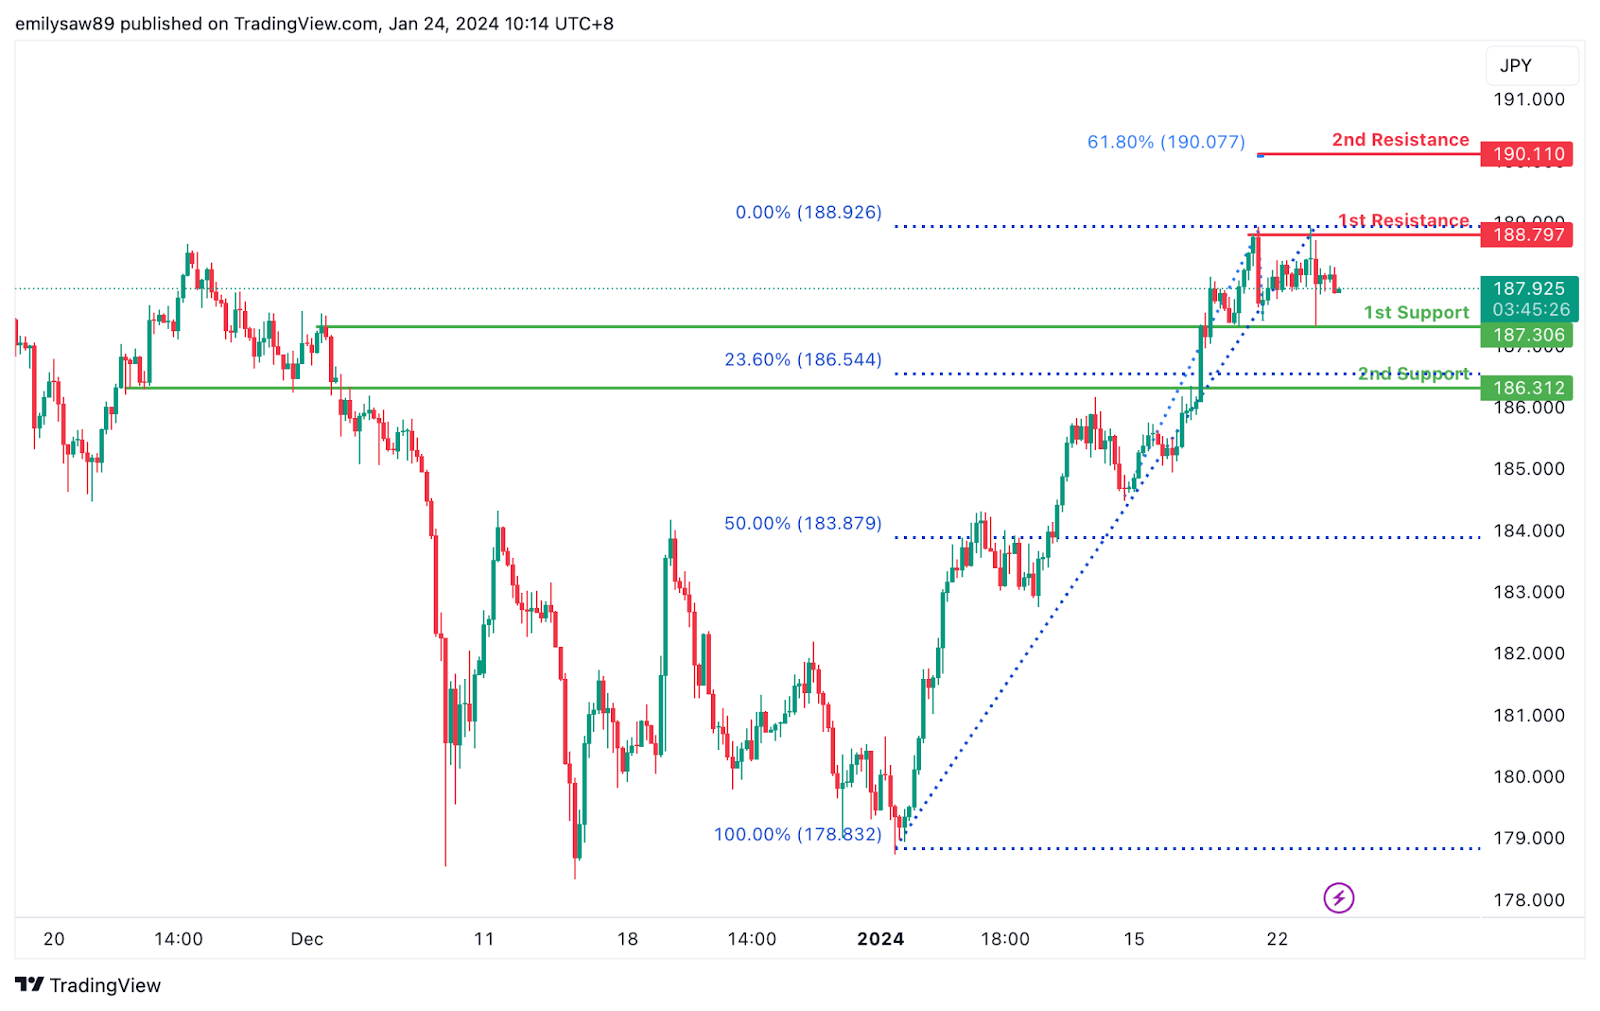
GBP/JPY:
The GBP/JPY chart currently demonstrates a neutral overall momentum, indicating a lack of a clear trend direction. Traders should be aware of potential fluctuations between the 1st resistance and 1st support levels.
The 1st support at 187.31 is identified as an overlap support, suggesting historical significance and a level where buying interest may emerge. Additionally, the 2nd support at 186.31 aligns with both overlap support and the 23.60% Fibonacci Retracement, providing additional strength to the support zone.
On the resistance side, the 1st resistance at 188.80 is recognized as a swing high resistance, representing a level where selling interest may intensify. The 2nd resistance at 190.11 corresponds to the 61.80% Fibonacci Projection, adding significance to this potential resistance level.
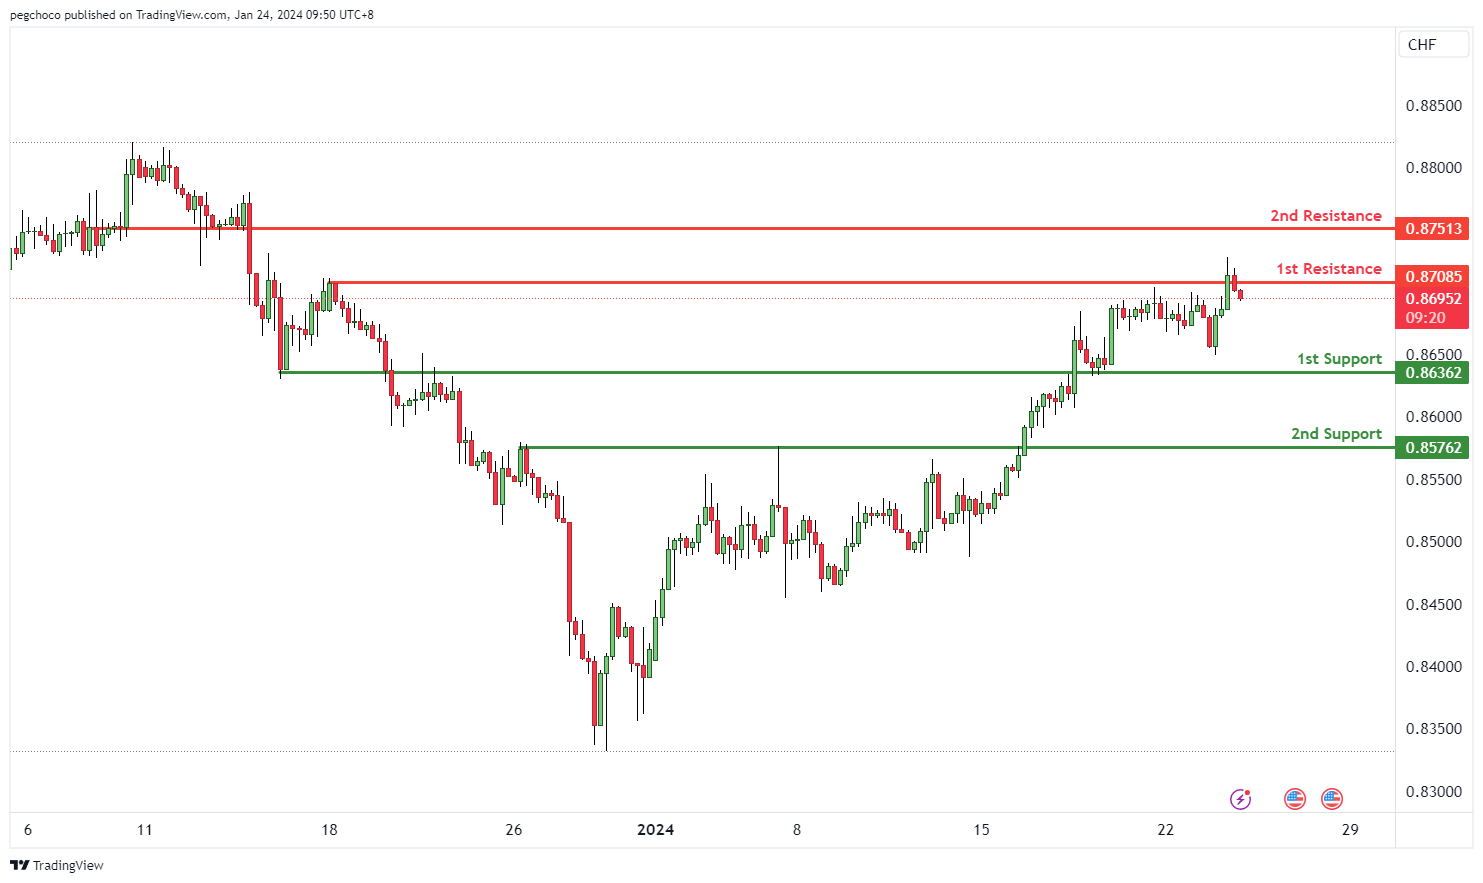
USD/CHF:
The USD/CHF trading pair is currently showing a bearish overall momentum, indicating weakness in the US Dollar relative to the Swiss Franc. According to your analysis, there is potential for a bearish reaction off the 1st resistance level followed by a drop towards the 1st support level.
The 1st support level at 0.8636 is considered significant due to its categorization as an overlap support, suggesting that this price level has previously acted as both support and resistance. This historical significance makes it a potential area where price could find support during a bearish move.
The 2nd support level at 0.8576 is identified as a pullback support, implying that it might serve as a notable support zone during price pullbacks.
On the resistance side, the 1st resistance level at 0.8708 is recognized as a swing high resistance, indicating that it has historically served as a point of resistance where selling pressure may emerge.
The 2nd resistance level at 0.8751 is characterized as a pullback resistance, suggesting that it might act as a strong resistance point during price pullbacks.
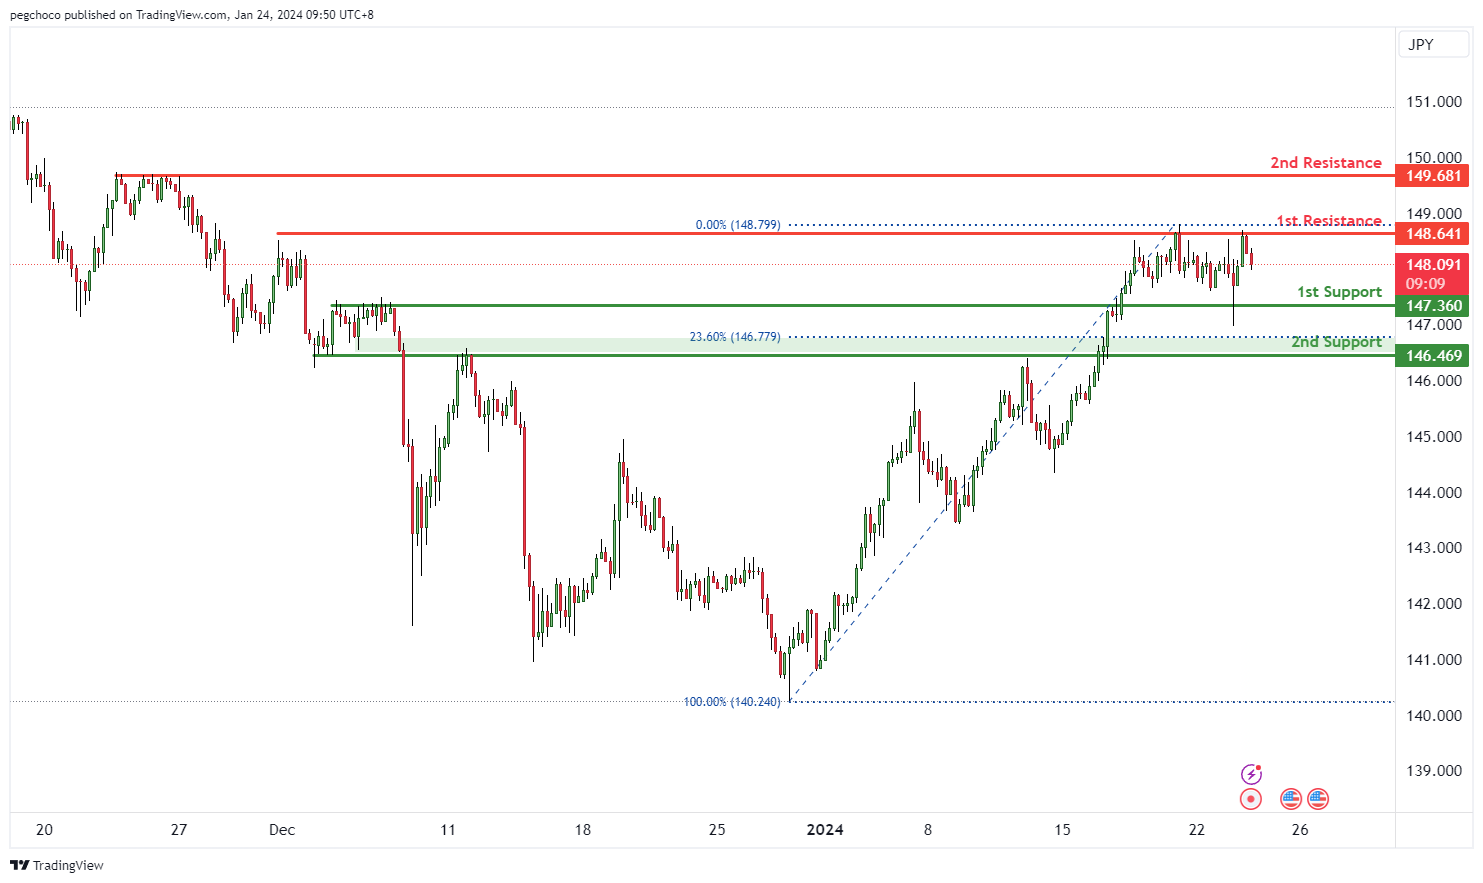
USD/JPY:
The USD/JPY trading pair is currently experiencing a bearish overall momentum, indicating weakness in the US Dollar relative to the Japanese Yen. Your analysis suggests that there is potential for a bearish break off the 1st support level, followed by a drop towards the 2nd support level.
The 1st support level at 147.36 is considered significant due to its classification as an overlap support, indicating that this price level has historically acted as both support and resistance. This suggests that it may be a strong area where price could potentially find support during a bearish move.
The 2nd support level at 146.46 is also identified as an overlap support, further reinforcing its importance as a level where price has previously found both support and resistance.
On the resistance side, the 1st resistance level at 148.64 is recognized as a multi-swing high resistance. This implies that it represents a historical point where the price has encountered resistance and potential selling interest.
The 2nd resistance level at 149.68 is categorized as a multi-swing high resistance, indicating its significance as a point where the price has historically faced resistance.
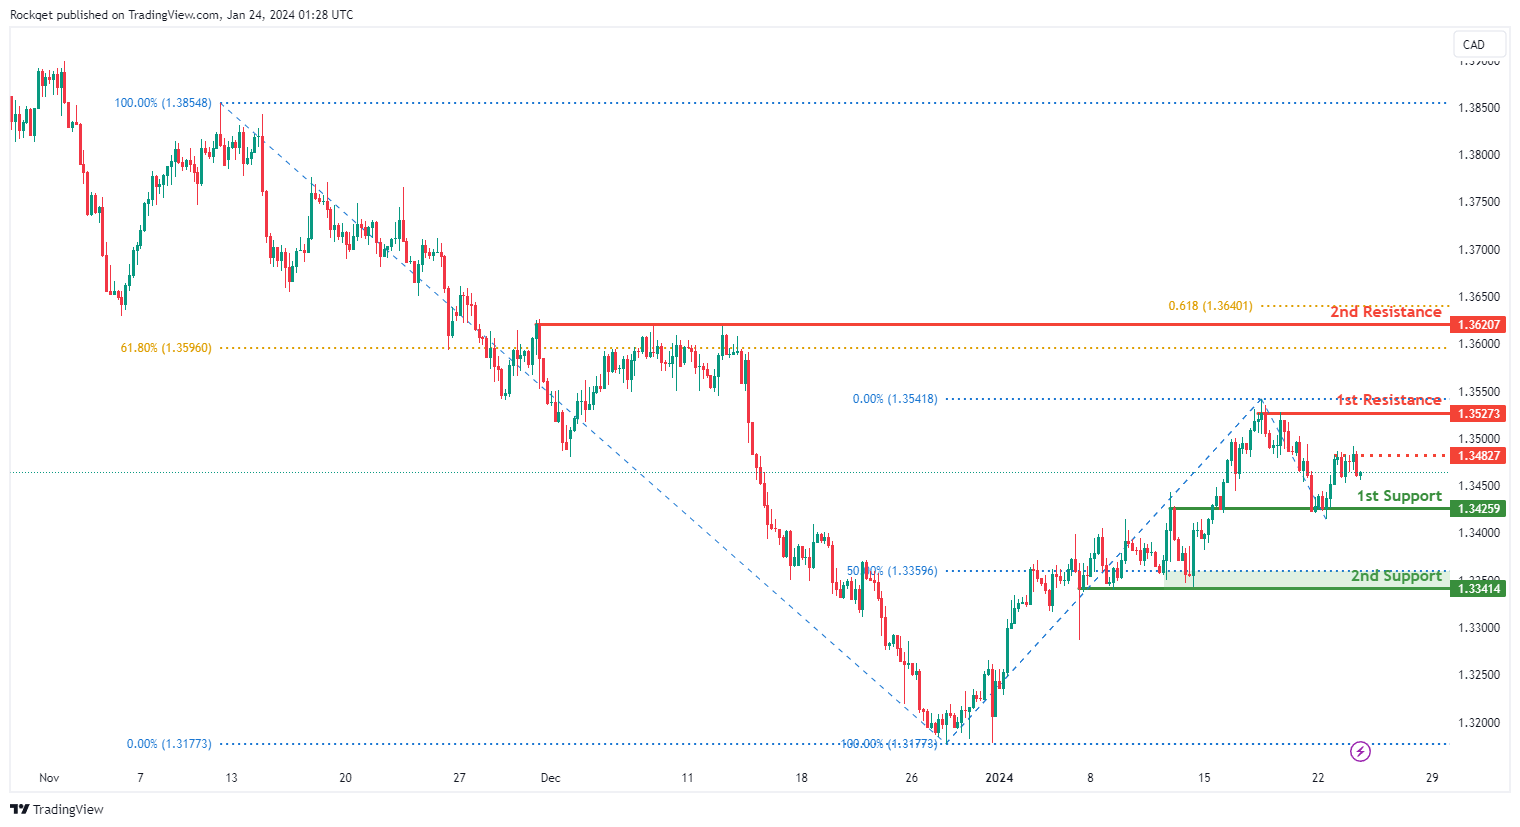
USD/CAD:
The USD/CAD chart currently exhibits an overall bullish momentum. In this context, there is a potential scenario for price to rise towards the 1st resistance.
The 1st resistance level at 1.3527 is identified as a pullback resistance. Higher up, the 2nd resistance level at 1.3620 is also noted as a pullback resistance that aligns close to a confluence of Fibonacci levels i.e. the 61.80% retracement and the 61.80% projection, further reinforcing its significance as a potential resistance zone.
To the downside, the 1st support level at 1.3425 is identified as an overlap support. Further below, the 2nd support level at 1.3341 is marked as a pullback support that aligns close to the 50.00% Fibonacci retracement level, further reinforcing its importance as a key support level.
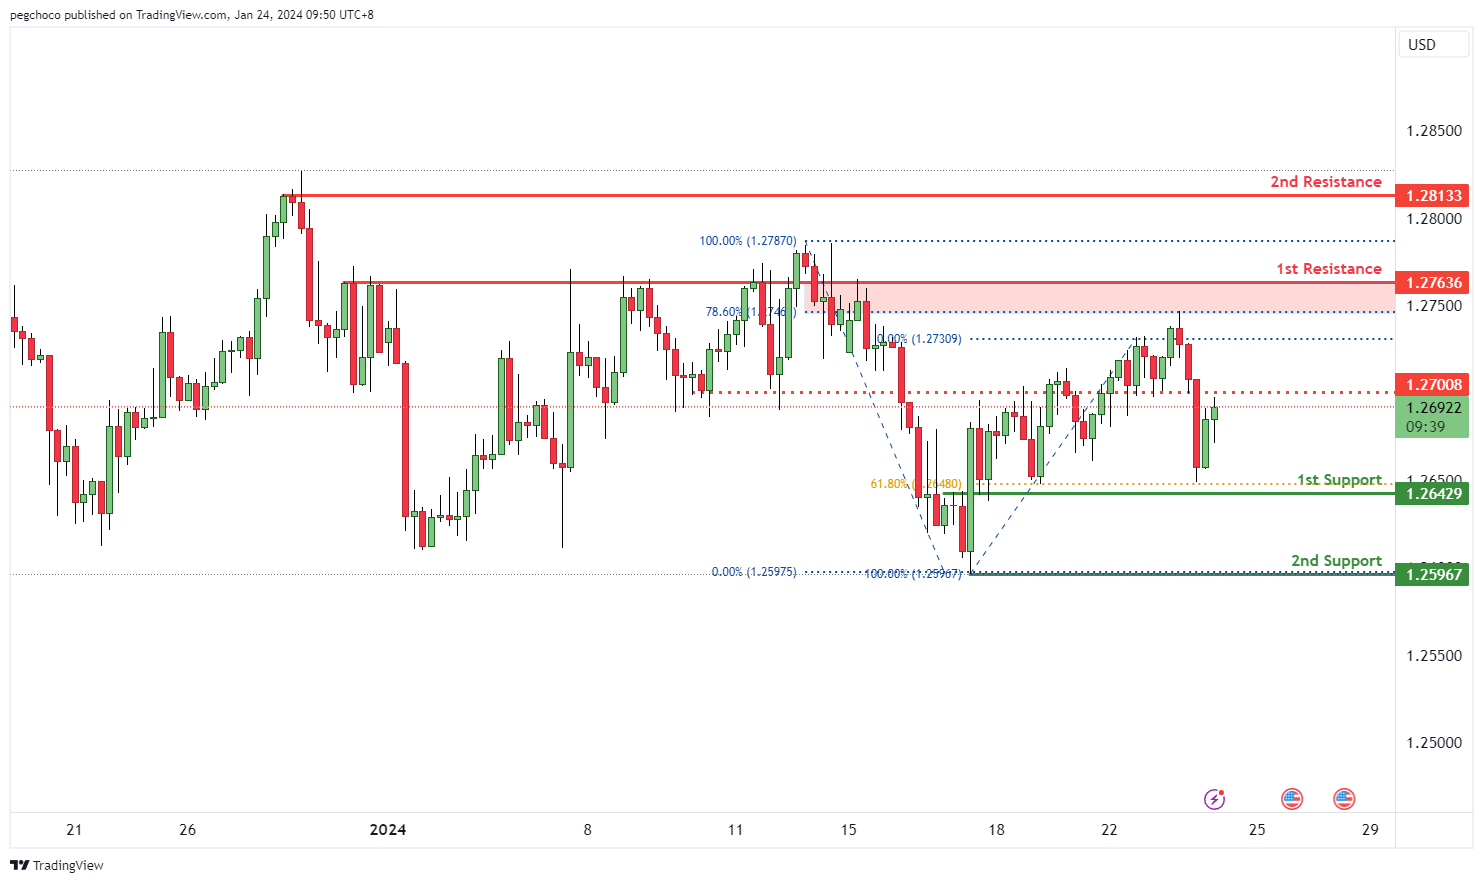
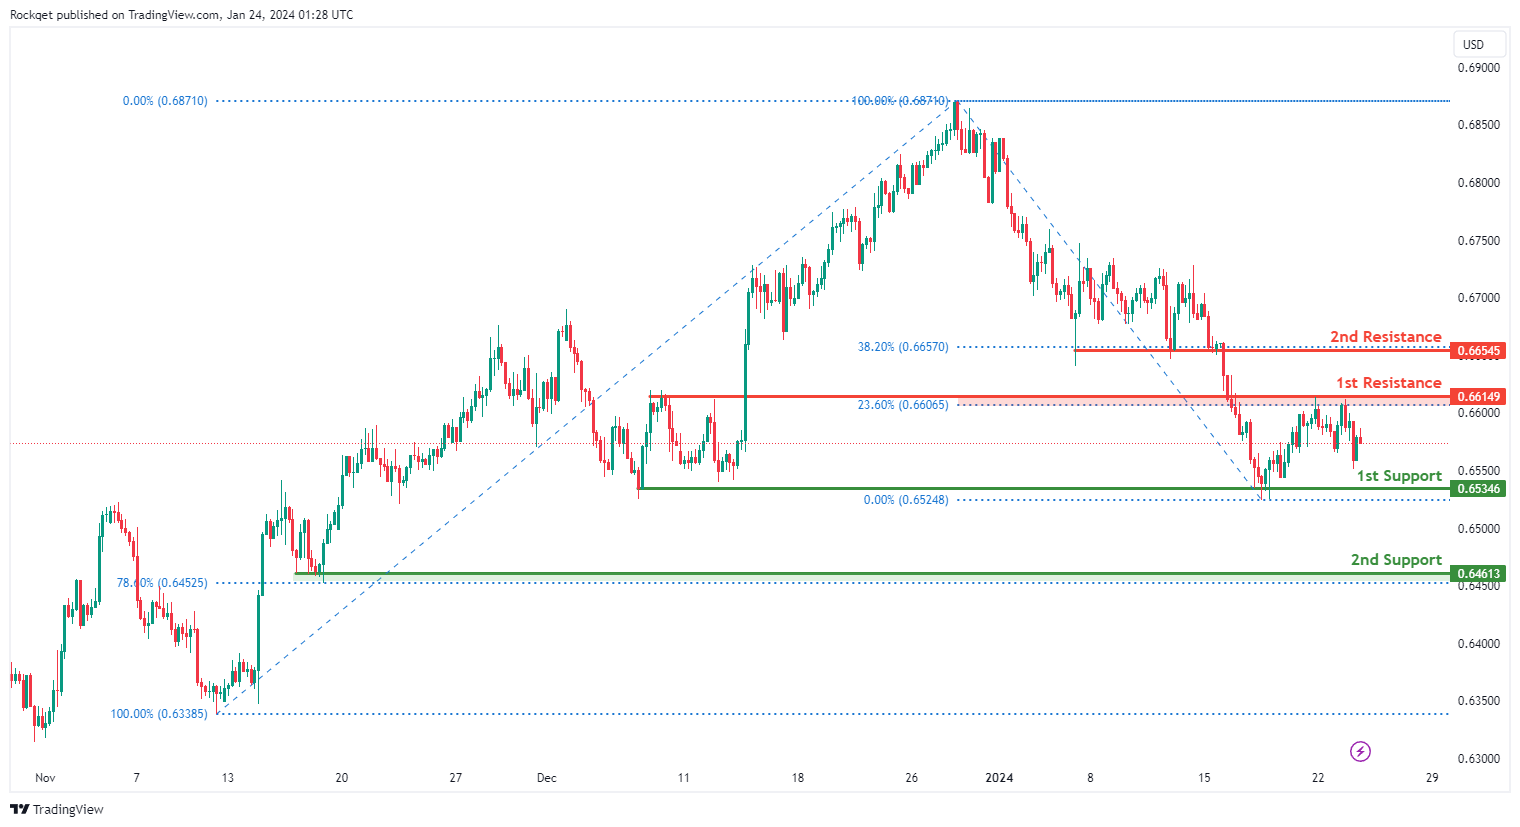
AUD/USD:
The AUD/USD chart currently exhibits an overall bearish momentum. In this context, there is a potential scenario for price to drop towards the 1st support.
The 1st support level at 0.6534 is identified as a pullback support. Further below, the 2nd support level at 0.6461 is also marked as a pullback support that aligns with the 78.60% Fibonacci retracement level, further reinforcing its importance as a key support level.
To the upside, the 1st resistance level at 0.6614 is identified as a pullback resistance that aligns with the 23.60% Fibonacci retracement level. Higher up, the 2nd resistance level at 0.6654 is also noted as a pullback resistance that aligns with the 38.20% Fibonacci retracement level, suggesting a potential barrier for further upside movement.
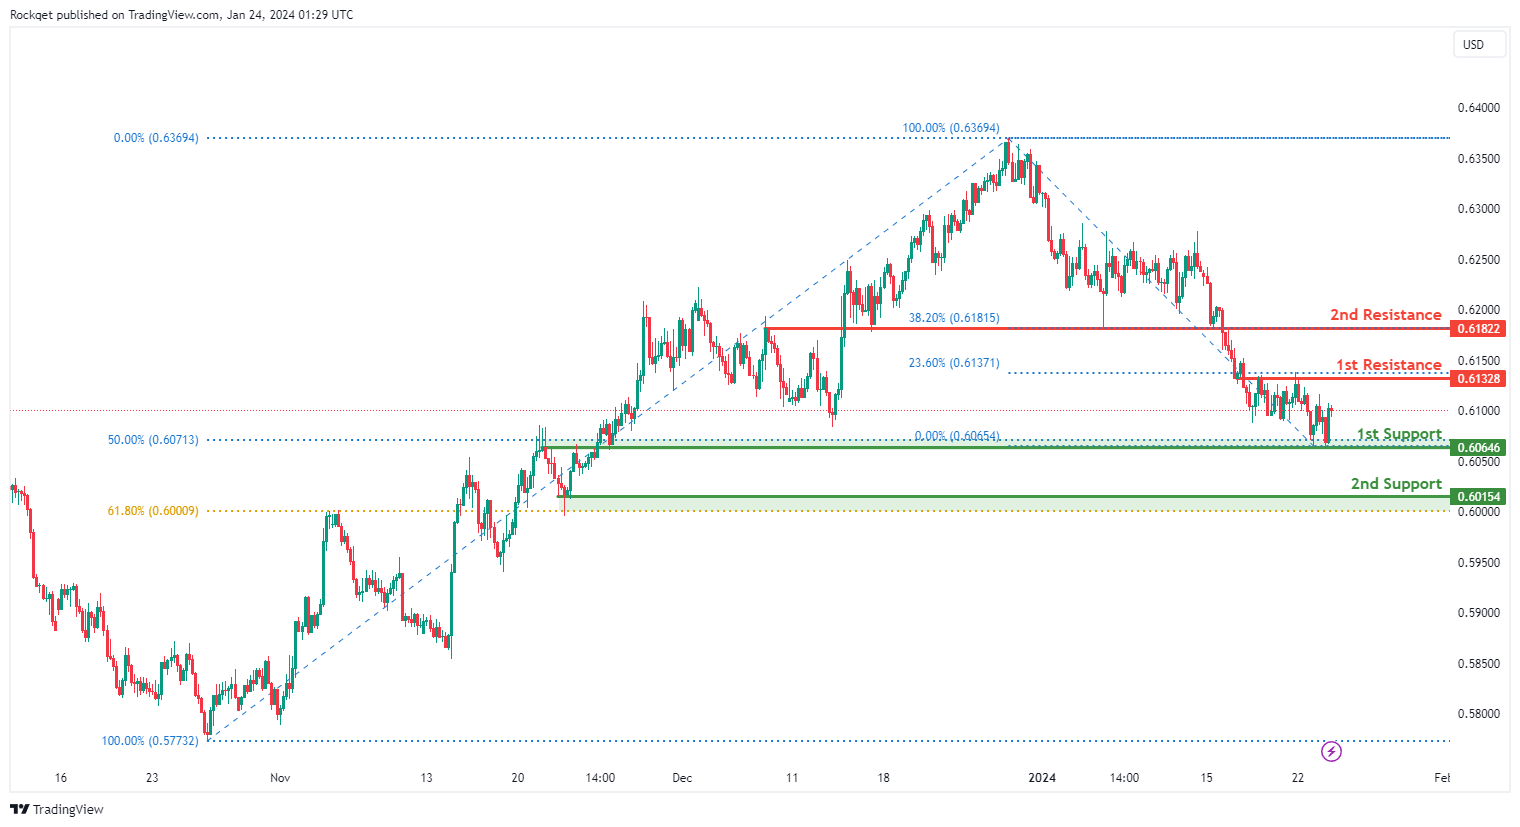
NZD/USD
The NZD/USD chart currently exhibits an overall bearish momentum. In this context, there is a potential scenario for price to drop towards the 1st support.
The 1st support level at 0.6064 is identified as an overlap support that aligns close to the 50.00% Fibonacci retracement level. Further below, the 2nd support level at 0.6015 is marked as a pullback support that aligns close to the 61.80% Fibonacci retracement level, further reinforcing its importance as a key support level.
To the upside, the 1st resistance level at 0.6132 is identified as an overlap resistance that aligns with the 23.60% Fibonacci retracement level. Higher up, the 2nd resistance level at 0.6182 is also noted as an overlap resistance that aligns with the 38.20% Fibonacci retracement level, suggesting a potential barrier for further upside movement.
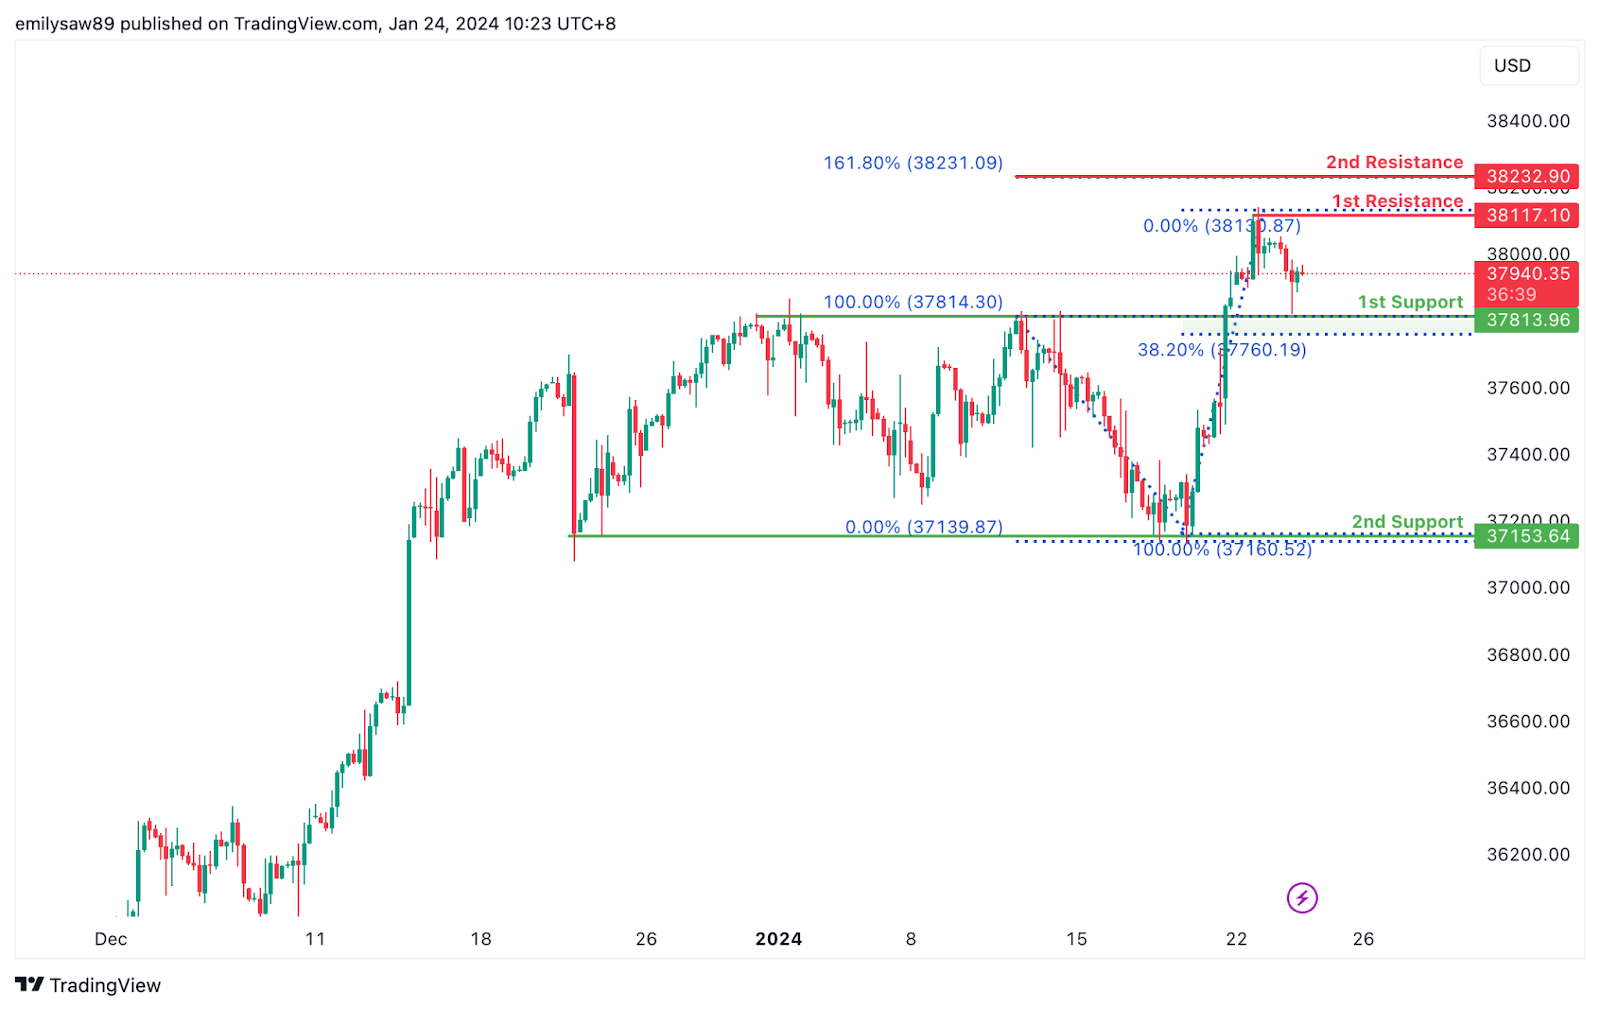
DJ30:
The DJ30 (Dow Jones Industrial Average) chart currently indicates a bearish overall momentum, suggesting a downward trend. Considering this momentum, there is a possibility of a bearish reaction off the 1st resistance, leading to a potential drop to the 1st support.
The 1st support at 37813.96 is considered favorable for several reasons. It is identified as an overlap support, indicating historical significance and a level where buying interest has emerged before. Additionally, this support aligns with the 38.20% Fibonacci Retracement, providing confluence and strengthening the support level. The 2nd support at 37153.64 is recognized as a multi-swing low support, adding further significance to the potential support zone.
On the resistance side, the 1st resistance at 38232.90 is acknowledged as a level where selling interest may intensify. This resistance is strengthened by the presence of the 161.80% Fibonacci Extension, adding significance to the potential resistance level. The intermediate resistance at 38117.10 is identified as a swing high resistance, contributing to the overall resistance zone.
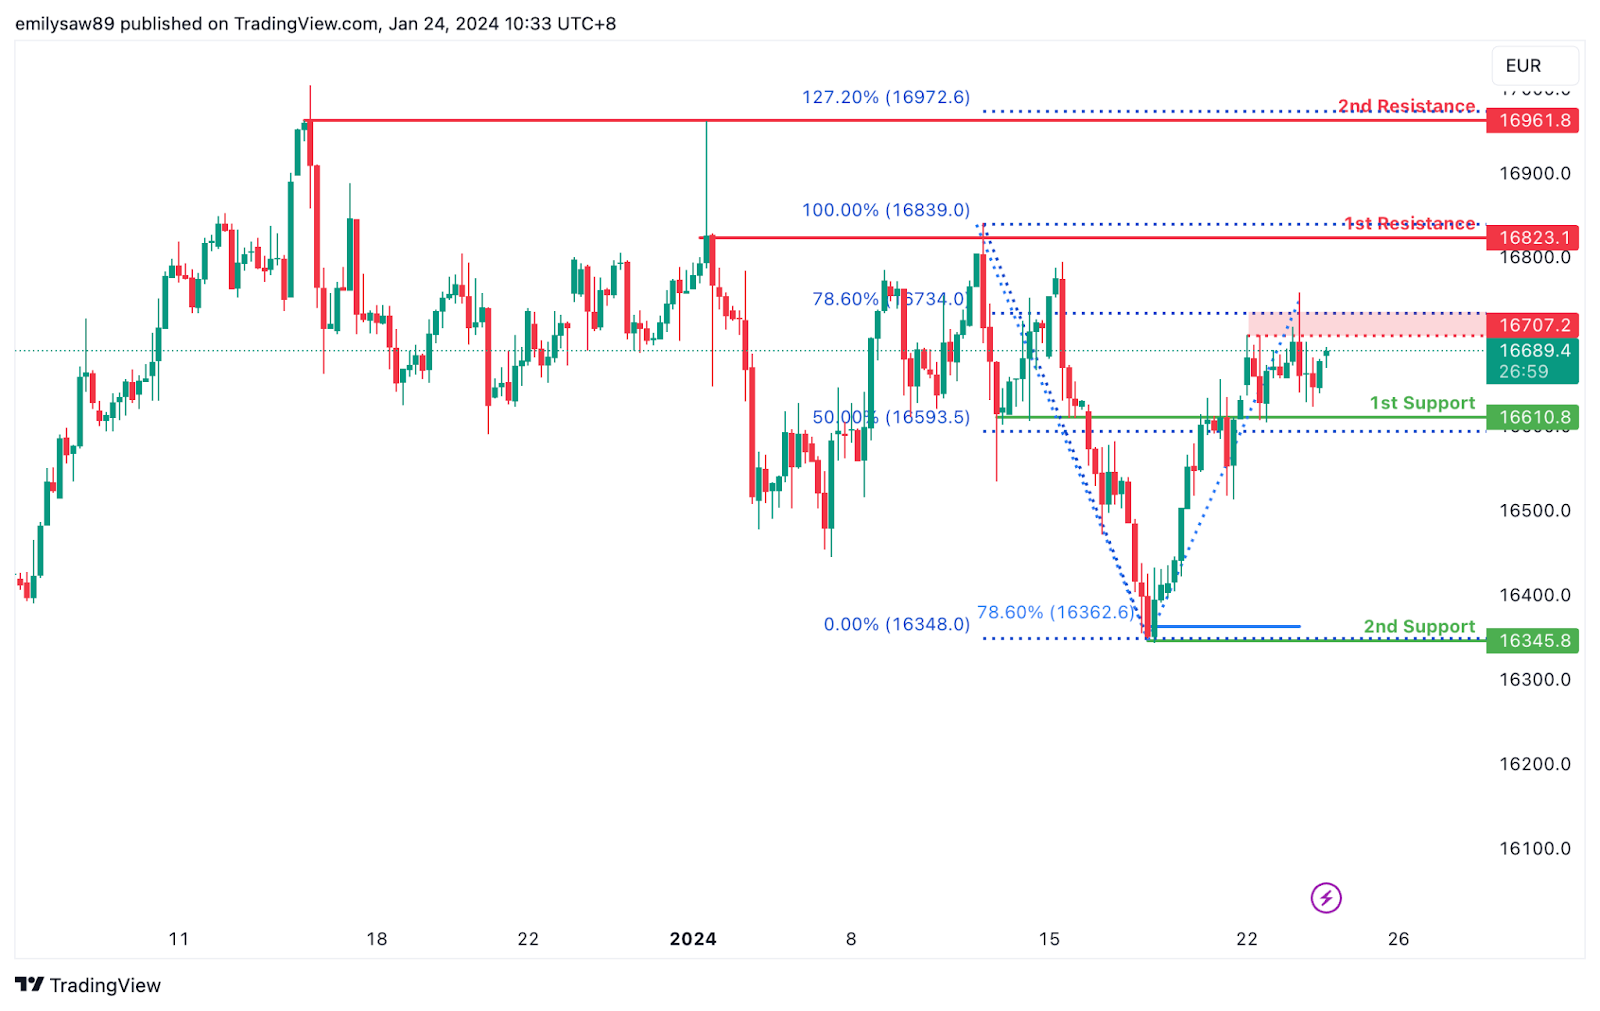
GER40:
The GER40 chart currently exhibits a weak bullish overall momentum with low confidence, suggesting uncertainty in the trend direction. Several factors contribute to this weak bullish momentum, and as a result, the price could potentially make a bullish continuation towards the 1st resistance.
The intermediate support at 16610.80 is considered favourable as it represents a pullback support, indicating a level where buying interest has emerged during corrective phases. The 1st support at 16345.80 is recognized as a swing low support and coincides with the 78.60% Fibonacci Projection, adding confluence to its potential as a support level.
On the resistance side, the 1st resistance at 16823.10 is identified as a multi-swing high resistance, suggesting a historical level where selling interest has been prominent. The 2nd resistance at 16961.80 is noteworthy for the presence of the 127.20% Fibonacci Extension, adding significance to this potential resistance level. The intermediate resistance at 16707.20 is recognized as a pullback resistance and aligns with the 78.60% Fibonacci Retracement, contributing to the overall resistance zone.
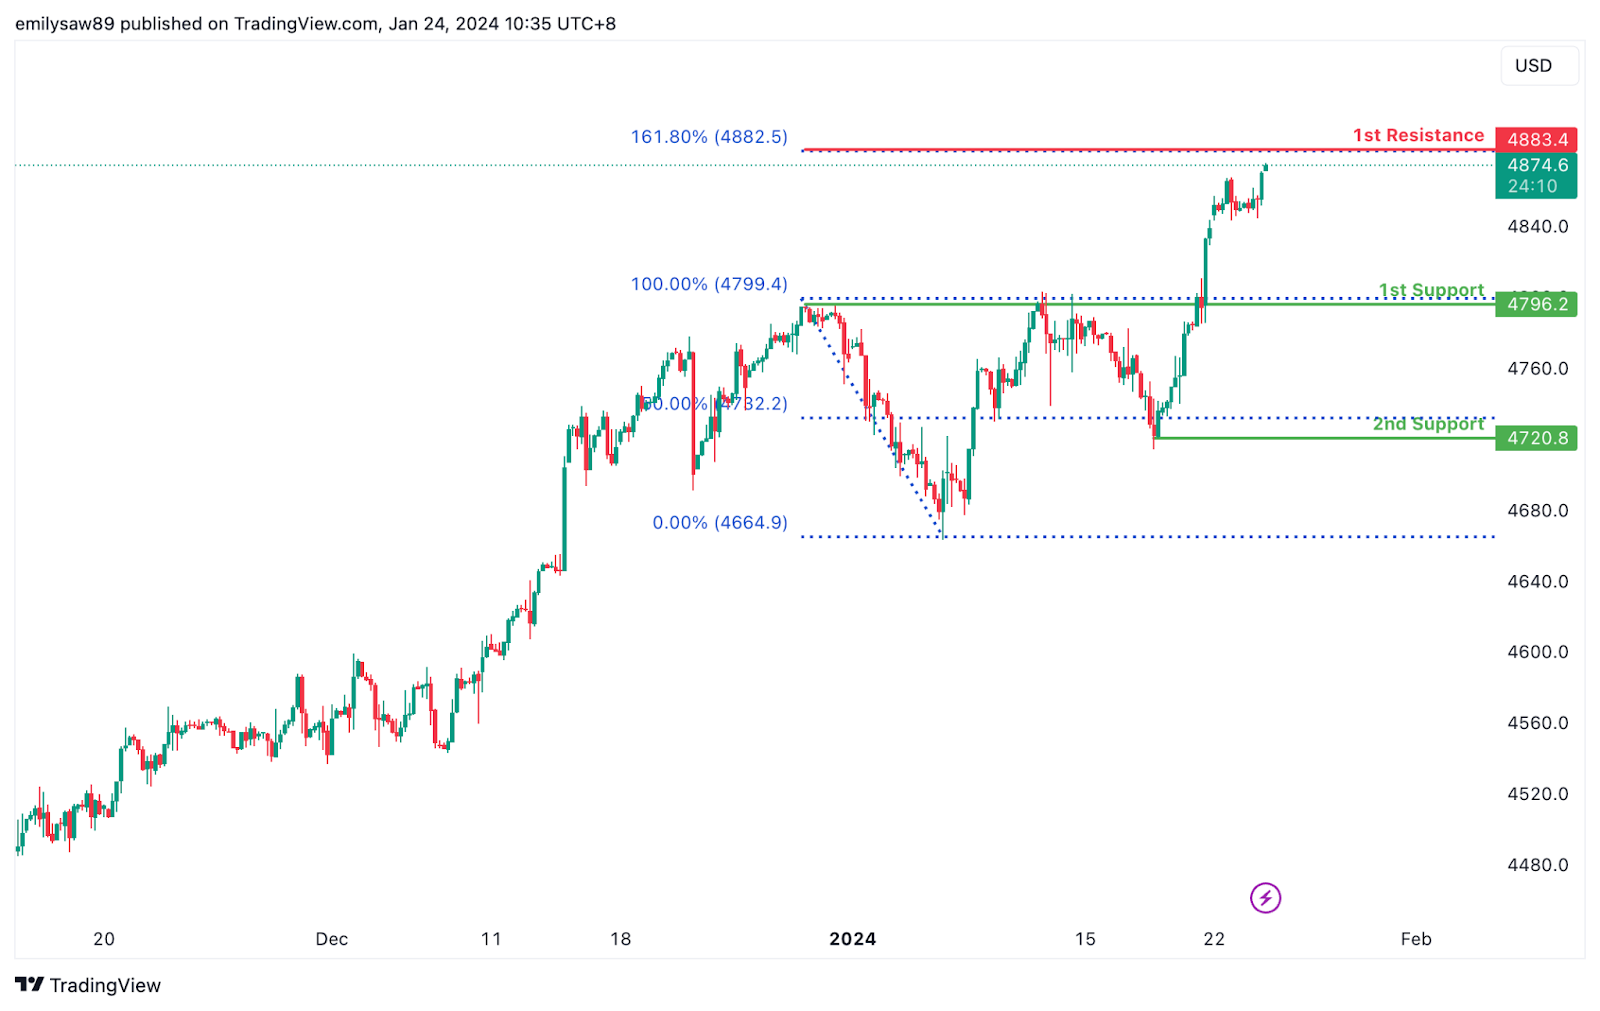
US500:
The US500 chart currently exhibits a bullish overall momentum, indicating a positive trend direction. Several factors contribute to this bullish momentum, suggesting potential upward movement in the price.
The 1st support at 4796.2 is considered favorable due to its identification as an overlap support, indicating a level where buying interest has previously emerged. Additionally, the 2nd support at 4720.8 is recognized as a swing low support, providing additional strength to the support zone.
On the resistance side, the 1st resistance at 4883.4 is noteworthy for the presence of the 161.80% Fibonacci Extension, adding significance to this potential resistance level.
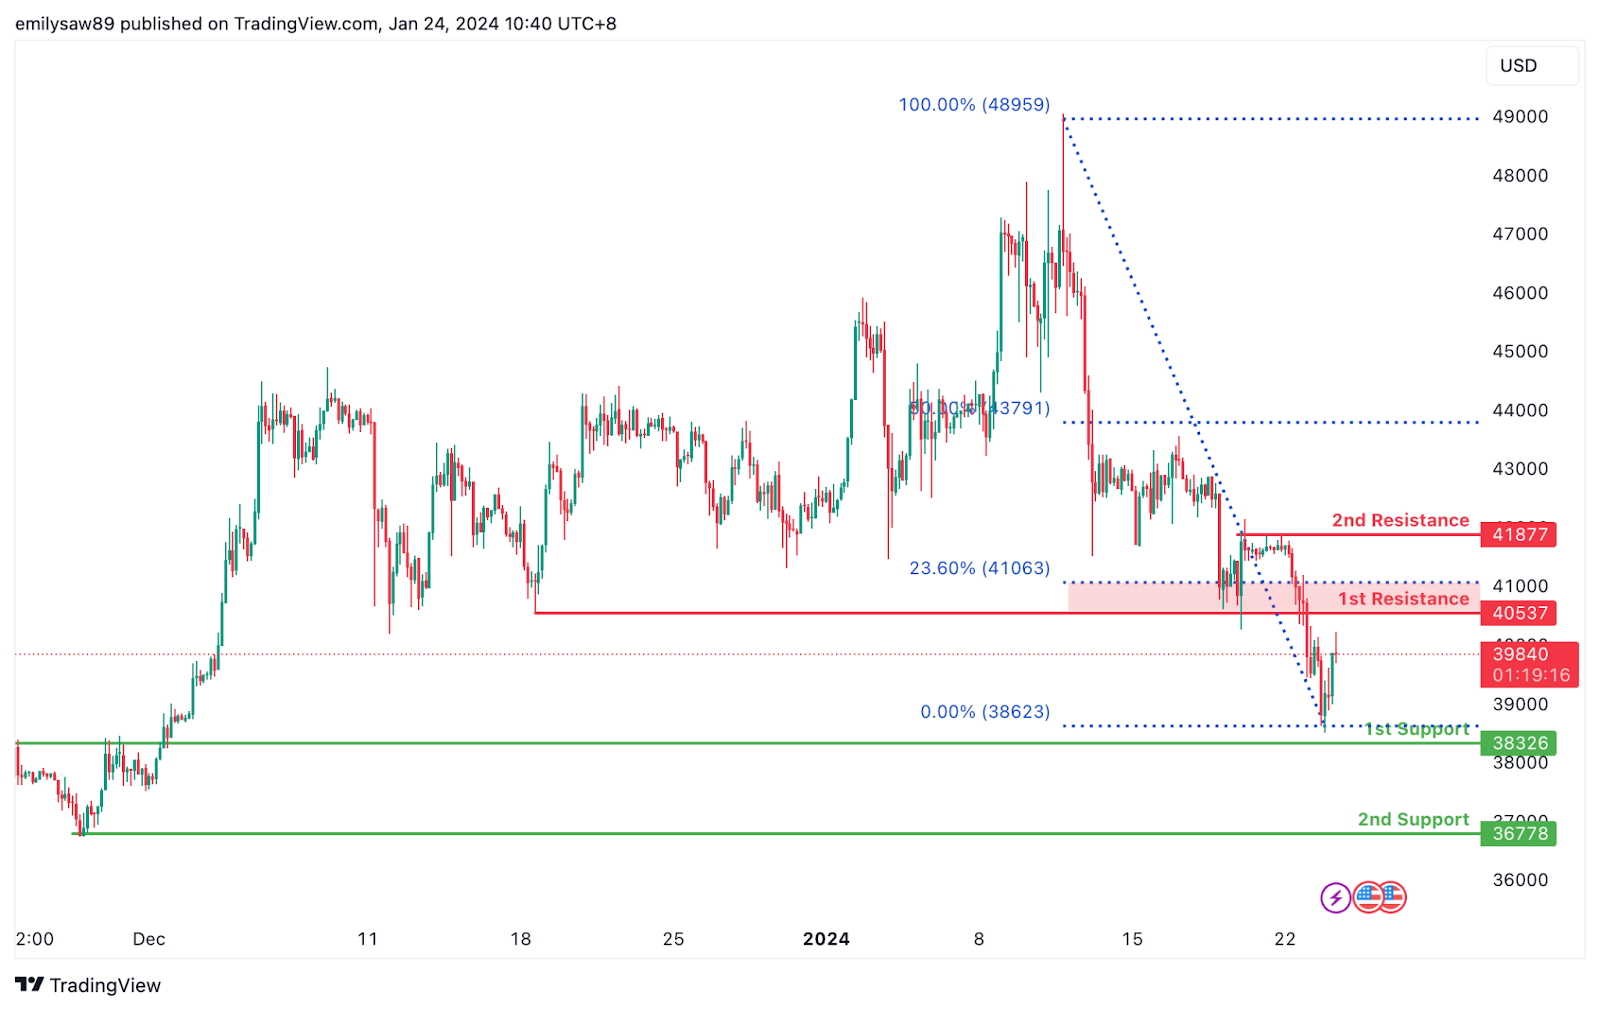
BTC/USD:
The BTC/USD chart currently exhibits a weak bullish overall momentum with low confidence, indicating a tentative upward trend. Several factors contribute to this weak bullish momentum, suggesting potential upward movement in the price.
The 1st support at 38326 is considered favorable due to its identification as an overlap support, indicating a historical level where buying interest has emerged. Additionally, the 2nd support at 36678 is recognized as a swing low support, providing additional strength to the support zone.
On the resistance side, the 1st resistance at 40537 is noteworthy for the presence of the 23.60% Fibonacci Retracement, adding significance to this potential resistance level. Furthermore, the 2nd resistance at 41877 is acknowledged as a multi-swing high resistance, contributing to the overall resistance zone.
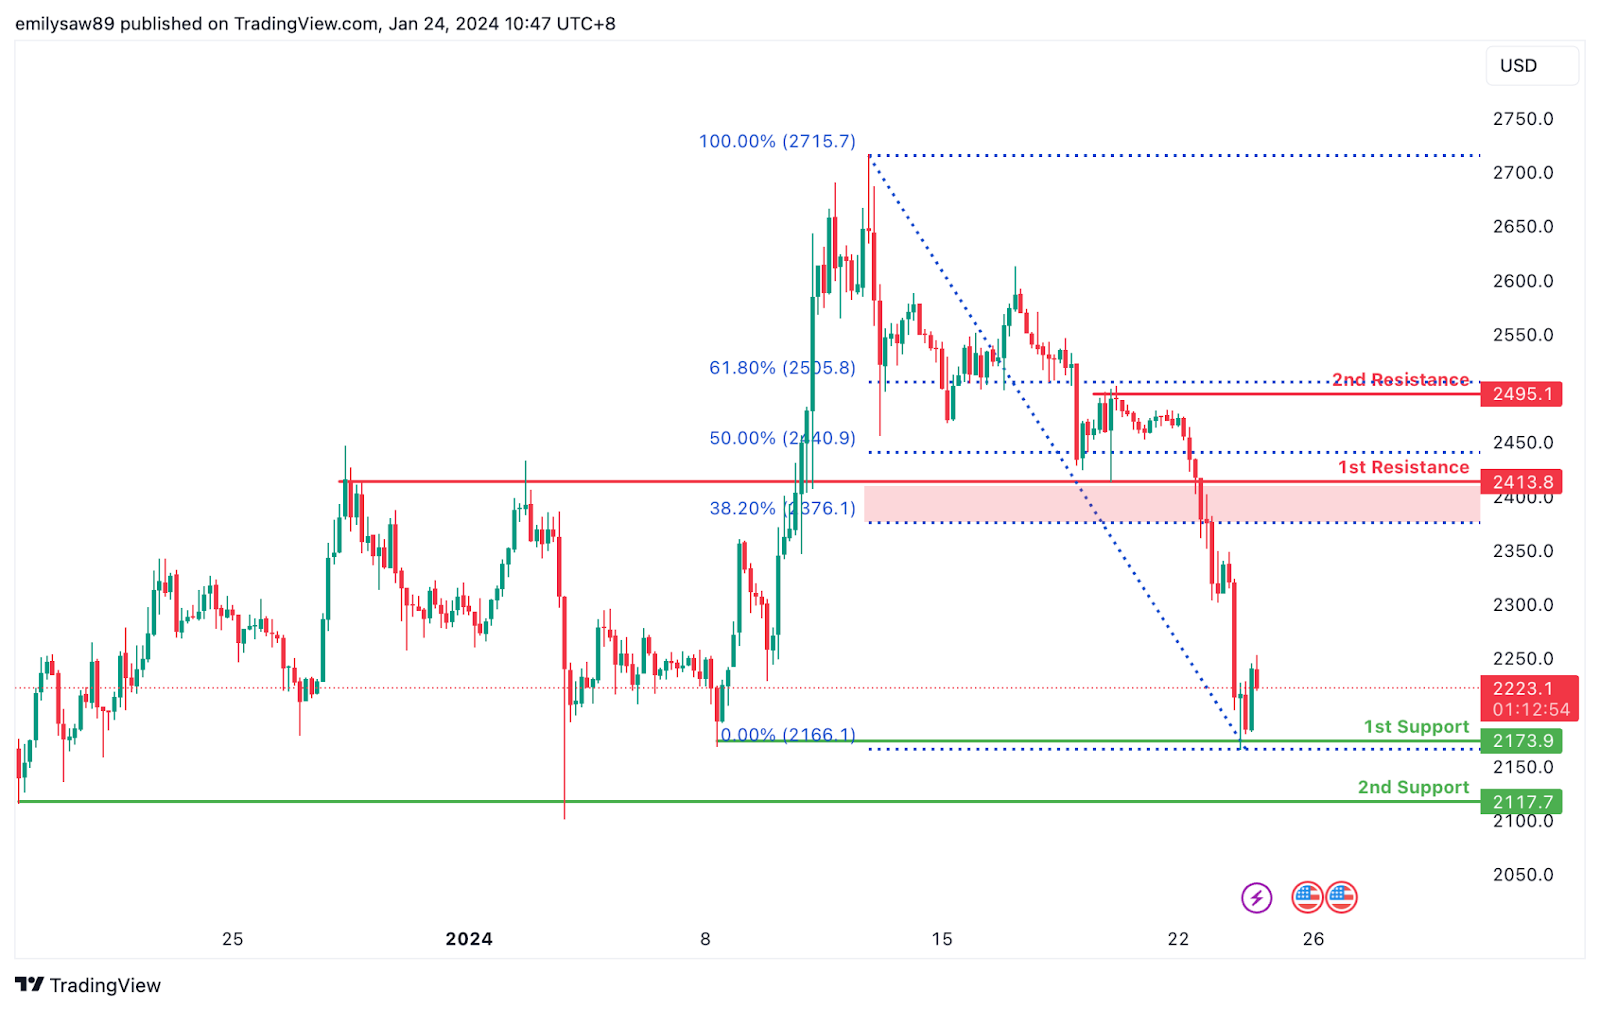
ETH/USD:
The ETH/USD chart currently displays a weak bullish overall momentum with low confidence, suggesting a hesitant upward trend. Several factors contribute to this weak bullish momentum, indicating the potential for upward movement in the price.
The 1st support at 2173.90 is considered favorable as it is identified as a swing low support, representing a historical level where buying interest has previously emerged. Additionally, the 2nd support at 2117.70 is recognized as a multi-swing low support, providing additional strength to the support zone.
On the resistance side, the 1st resistance at 2413.80 is noteworthy for the presence of an overlap resistance and the 38.20% Fibonacci Retracement, adding significance to this potential resistance level. Furthermore, the 2nd resistance at 2495.10 is acknowledged as a pullback resistance and aligns with the 61.80% Fibonacci Retracement, contributing to the overall resistance zone.
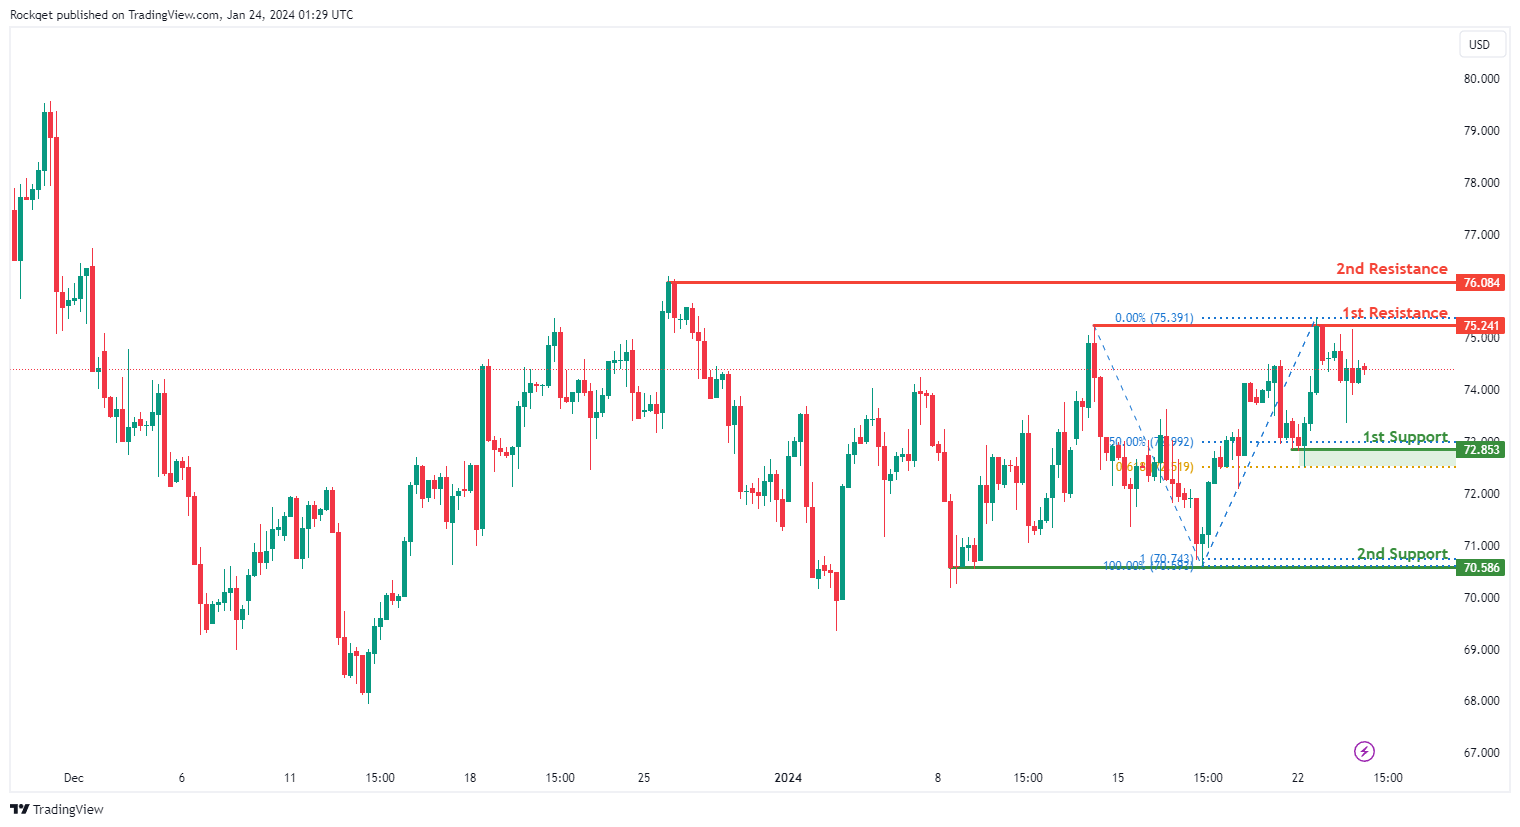
WTI/USD:
The WTI (West Texas Intermediate) chart currently exhibits a neutral bias. In this context, there is a potential scenario for price to fluctuate between the 1st resistance and the 1st support.
The 1st resistance level at 75.24 is identified as a pullback resistance. Higher up, the 2nd resistance level at 76.08 is also noted as a swing-high resistance, suggesting a potential barrier for further upside movement.
To the downside, the 1st support level at 72.85 is identified as a pullback support that aligns with a confluence of Fibonacci levels i.e. the 50.0% retracement and the 61.80% projection. Further below, the 2nd support level at 70.58 is marked as a pullback support, further reinforcing its importance as a key support level.
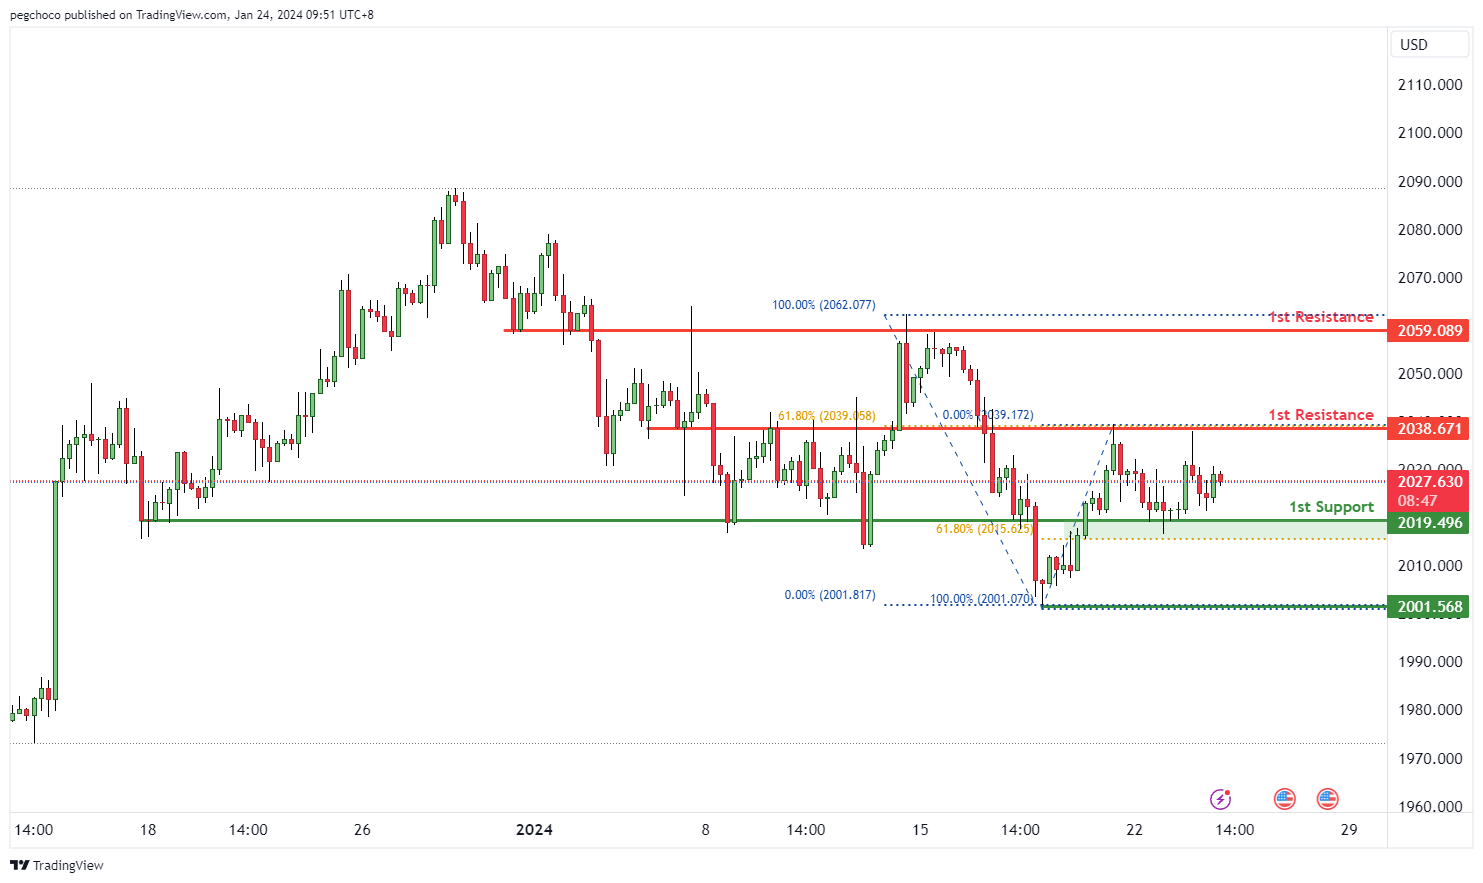
XAU/USD (GOLD):
The XAUUSD (Gold/US Dollar) chart is currently exhibiting a neutral overall momentum, indicating a lack of a strong directional bias in the market. Your analysis suggests that there is potential for price to fluctuate between the 1st resistance and the 1st support level.
The 1st support level at 2019.00 is considered significant due to its classification as an overlap support. Additionally, it coincides with the 61.80% Fibonacci Retracement level, adding further significance to this support zone. This implies that it has historically acted as both support and resistance and may serve as an important area where price could potentially find support during periods of price fluctuation.
The 2nd support level at 2001.56 is identified as a swing low support, indicating that this level corresponds to a previous significant low point on the chart. This reinforces its importance as a potential support level during price fluctuations.
On the resistance side, the 1st resistance level at 2038.67 is recognized as an overlap resistance and also coincides with the 61.80% Fibonacci Retracement level. This suggests that it may be a strong resistance point where selling pressure could emerge during price fluctuations.
The 2nd resistance level at 2059.08 is also identified as an overlap resistance, emphasizing its historical significance as a potential barrier for further upward price movement.
Japan’s exports exceed JPY 1T in 2023, US reclaims top export destination
Japan's exports rose 9.8% yoy to JPY 9648B in December, marking the biggest increase in a year. This boost was largely driven by 20.4% yoy jump in exports to US, predominantly from the automotive sector, while exports to Europe climbed by 10.3% yoy. Notably, shipments to China saw 9.6% yoy rise, registering their first growth in 13 months, primarily led by chip-making equipment. In contrast, imports declined -6.8% yoy to JPY 9586B. Consequently, trade balance turned positive, recording JPY 62.1B surplus.
Analyzing the whole year, Japan's trade deficit in 2023 more than halved to JPY -9.29T from the previous year. The country's total exports rose by 2.8% to reach JPY 100.89T , surpassing the JPY 100T mark for the first time ever. Meanwhile, total imports saw -7.0% decrease to JPY 110.18T.
A significant shift was observed in Japan's export destinations in 2023. US reclaimed its position as the largest recipient of Japanese exports by value for the first time in four years, surpassing China. Exports to US reached JPY 20.27T, showing 11.0% increase, while exports to China decreased by -6.5% to JPY 17.76T.