Sample Category Title
Gold Not Out of the Woods Yet
- Gold below key barriers ahead of next week's FOMC policy announcement
- Technical signals cannot promise a meaningful rally
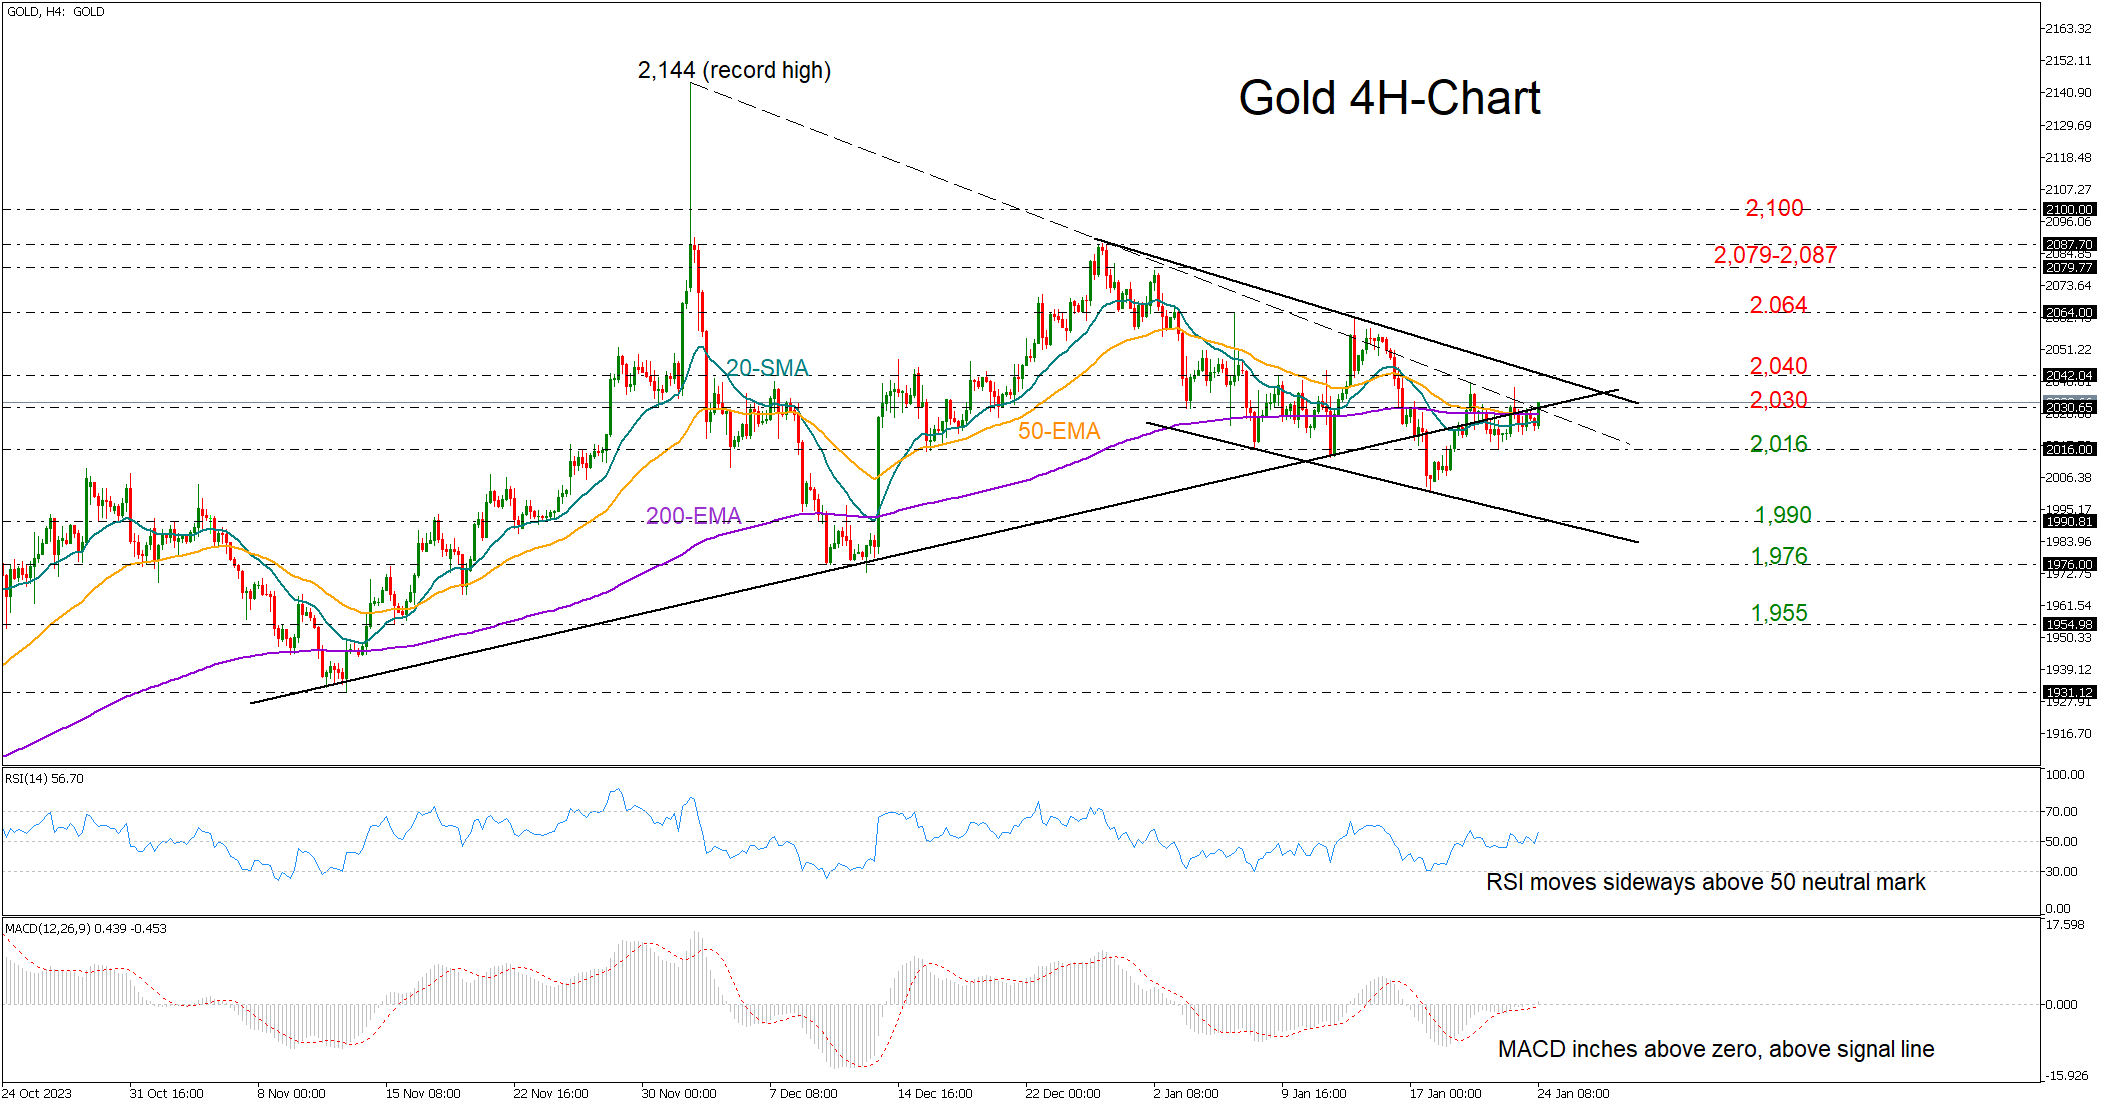
Gold has been in a tight range within the 2,016-2,030 region so far this week, struggling to find enough buyers to close successfully above its exponential moving averages (EMAs) on the four-hour chart and the broken support trendline from November.
The technical indicators point to a neutral-to-bullish bias, with the RSI maintaining a sideways trajectory above its 50 neutral mark and the MACD set to enter the positive region. That said, the current consolidation phase seems to be developing within a monthly bearish channel, which could also halt any potential bullish extensions near 2,040.
A successful close above 2,040 is required for a fast rally towards the 2,065 constraining zone. Even higher, the price could re-challenge December’s important 2,079-2,087 territory ahead of the 2,100 psychological mark. Should the bulls claim the latter, the spotlight will fall again to the record high of 2,144.
If the precious metal slides below the 2,016 support area instead, a new bearish wave could start towards the channel’s lower boundary seen at 1,990. Additional losses from there could retest December’s floor around 1,976.
Summing up, gold could remain exposed to downside risks unless it closes clearly above the bearish channel and the 2,040 level.
USDCAD: Key Levels to Consider for Further Upside or Deeper Correction
Bullish Scenario: Consider buying at levels 1.3428 or 1.3462 with take profit targets at 1.3990 (TP1), 135.00 (TP2), and 1.3510 in extension (TP3). It is recommended to set a stop loss (S.L.) below 1.3410 or at least 1% of the account capital**.
Bearish Scenario: Selling below 1.3460 (waiting for a retracement to the zone) with TP1 at 1.3430, TP2 at 1.3415, and TP3 at 1.34 in extension. It is advised to place a stop loss above 1.3477 or at least 1% of the account capital**. A trailing stop can be utilized.
Fundamental Analysis
Today, Wednesday, January 24, the Bank of Canada (BoC) issues its first policy statement of 2024 at 14:45. No change in the current interest rate of 5.00% is expected.
According to recent data, core inflation in Canada exceeded expectations in December, ruling out a significant shift in the dovish direction of the BoC in today's meeting. Despite this, some reports have highlighted the negative impact that high rates are having on other sectors of the economy.
The latest BoC Business Outlook Survey reported weakened demand and less favourable business conditions in the fourth quarter for investments, leading most companies to not plan new hires. However, lower inflation is still the primary goal of high rates and may soften in the coming months, favouring potential rate cuts starting in the second quarter, likely in April.
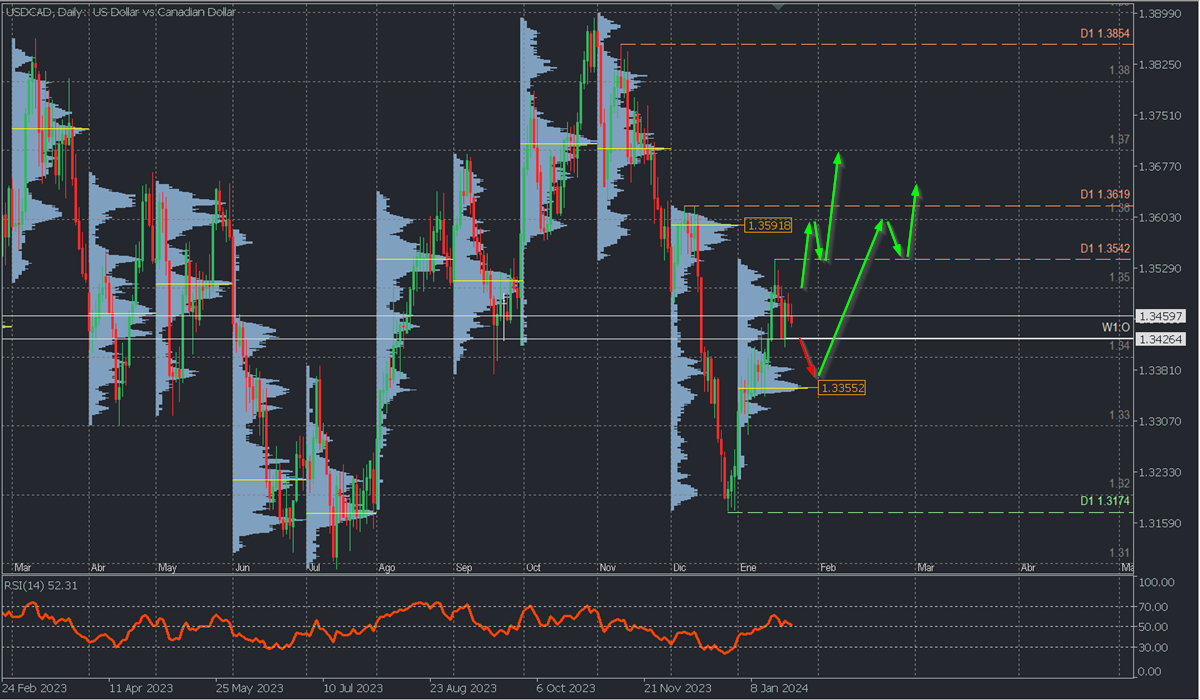
Daily Chart Analysis
The USDCAD pair has been in a macro bullish correction since the beginning of the month, reaching a peak at 1.3542 and forming a high-volume node that could be interpreted as a selling zone. From here, we evaluate key levels for two possible scenarios:
Bearish Scenario:
If quotes fall below the week's opening at 1.3426, sales towards the current Point of Control (POC) of the month (which may vary as the month has not ended) at 1.3355 can be expected. This level formed the last price buying zone and coincides with a Fibonacci retracement of 50%. This zone can act as a pivot defended by the bulls or be broken by bearish force.
Only a decisive breakout of the high-volume node forming the buying zone will indicate a continued downtrend with a target at the macro support of 1.3174.
Bullish Scenario:
After a 50% correction, a rebound from 1.3355 will offer an opportunity to activate a new upward impulse towards 1.3542, the next selling zone from December around 1.3592, and resistance at 1.3619, reversing the macro downtrend with a decisive or confirmed breakout with two rising highs.
Anticipated: An early rebound will occur with the failure of the price to break below the weekly opening of 1.3426 and the rapid surpassing of 1.35 and 1.3542, opening the door to further ascent towards 1.3619 and beyond into February.
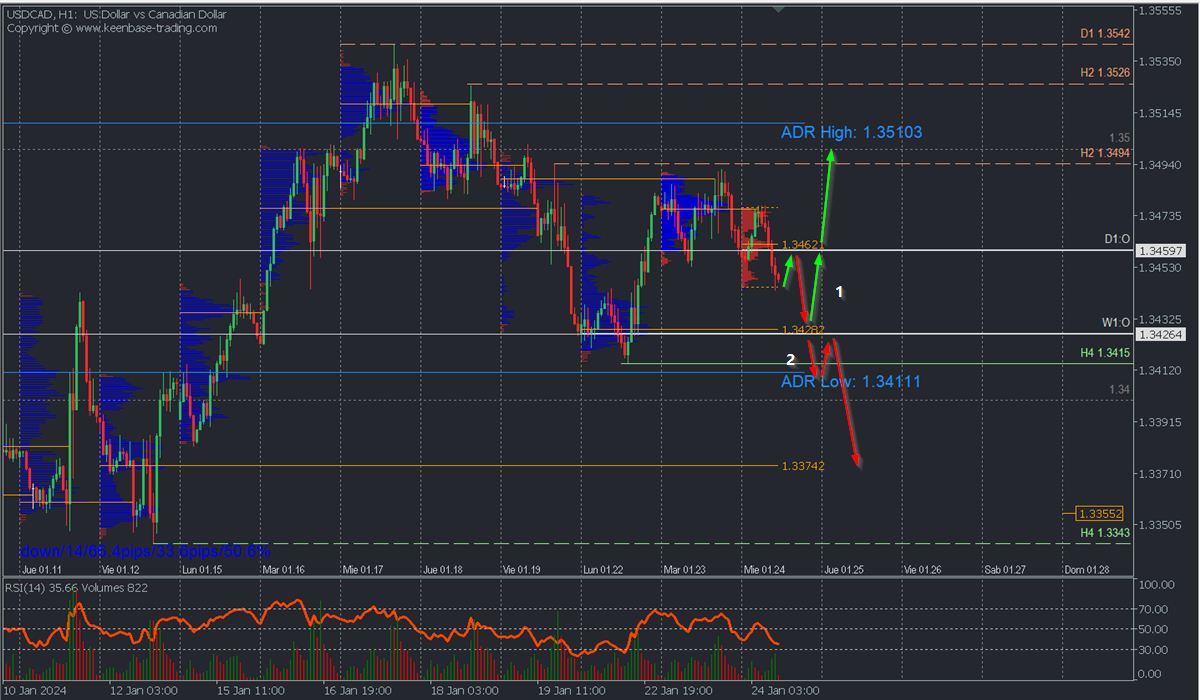
H1 Chart Scenario:
The formation of a reversal pattern below the resistance at 1.3494 anticipates a short-term bearish scenario, especially with quotes below the uncovered POC* of the early sessions at 1.3462, near the day's opening.
1. The first intraday scenario: Aims for sales at Monday's uncovered POC* at 1.3428, converging with the weekly opening. This buying zone is expected to be defended by the bulls, causing a new price rebound towards 1.35 and the Average Daily Range (ADR) High at 1.3510, signalling an intraday sequence change.
2. The second intraday scenario: Will be activated after the decisive breakout (candle body) of the buying zone around 1.3428, with a possible breakdown of support at 1.3415, indicating greater bearish strength seeking the next buying liquidity zone around 1.3374, likely in the next day.
*Uncovered POC: POC = Point of Control: It is the level or zone where the highest volume concentration occurred. If there was a bearish move previously from it, it is considered a selling zone and forms a resistance area. Conversely, if there was a bullish impulse previously, it is considered a buying zone, usually located at lows, forming support zones.
**Consider this risk management suggestion
It is crucial that risk management is based on capital and traded volume. For this, a maximum risk of 1% of the capital is recommended. It is suggested to use risk management indicators such as the Easy Order.
Bundesbank report warns of German economy’s vulnerability to China’s economic woes
In its latest monthly report, Bundesbank issued a cautionary message about China's current economic struggles and their potential impact on Germany. The report notes that China is grappling with "significant economic problems," and the relationship between China and Western industrial nations has "noticeably deteriorated recently." Such geopolitical risks, if they materialize, could have severe repercussions for the German economy.
The Bundesbank essay posits that "an economic crisis in China of the kind that has occurred in other countries in the past following a correction of excessive credit growth would probably be bearable for the German economy." However, the impact would not be negligible, with projections indicating that Germany's real GDP could be -0.7% lower in the first year of a potential crisis in China, and then -1% in the second year.
The report also highlights a more severe scenario: "However, an abrupt decoupling, for example as a result of a geopolitical crisis, would have a significantly greater impact on German industry in particular." In such an event, German companies with direct involvement in China could face considerable losses in sales and profit. Industries like automotive, mechanical engineering, electronics, and electrical engineering are particularly reliant on Chinese demand.
Moreover, Bundesbank emphasizes the broader risks associated with the close economic ties between Germany and China: "the close real economic ties between Germany and China also pose considerable risks for the German financial system."
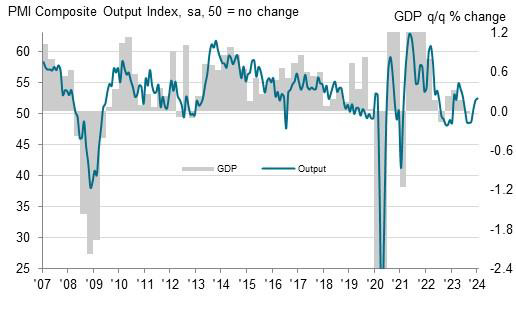
UK PMI composite rises to 52.5, may delay BoE rate cut
UK PMI Manufacturing rose from 46.2 to 47.3 in January, a 9-month high. PMI Services rose from 53.4 to 53.8, an 8-month high. PMI Composite rose from 52.1 to 52.5, a 7-month high.
Chris Williamson, Chief Business Economist at S&P Global Market Intelligence, noted that UK business activity growth has "accelerated for a third straight month". He described this as a "promising start" to the year.
According to the survey data, UK economy is expected to grow at a quarterly rate of 0.2% after a flat fourth quarter, thereby "skirting recession and showing signs of renewed momentum".
However, Williamson highlighted a crucial implication of this unexpected growth strength in January, which could lead BoE to reconsider the timing of any anticipated interest rate cuts.
This reassessment is particularly pertinent in light of supply disruptions in the Red Sea, which have reignited inflationary pressures in the manufacturing sector. Williamson indicated that inflation is expected to remain stubbornly in the 3-4% range in the near term.
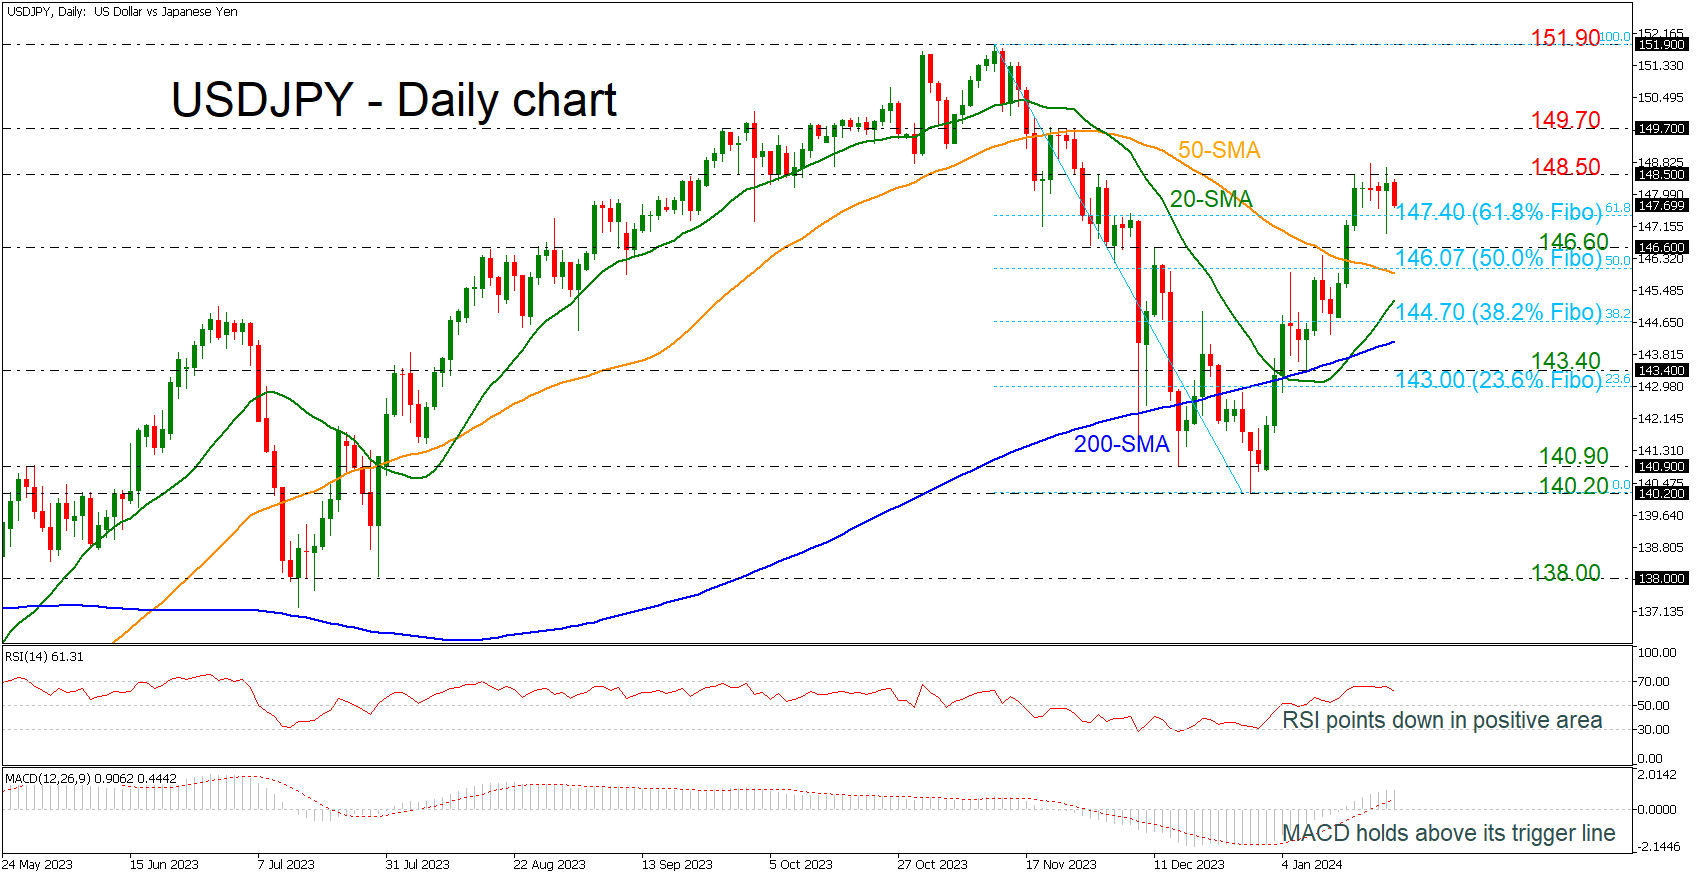
USDJPY Dives Near 61.8% Fibonacci
- USDJPY fails to surpass 148.50 resistance
- Rebounds off 140.20 still intact
- However, RSI and MACD suggest negative correction
USDJPY has been struggling to surpass the 148.50 resistance level over the last five days after the upward movement from the 140.20 support level. The pair is still holding above the 61.8% Fibonacci retracement level of the down leg from 151.90 to 140.20 at 147.40 and well above the simple moving averages (SMAs).
However, the technical oscillators are suggesting a bearish retracement in the market. The RSI is pointing down above the neutral threshold of 50, while the MACD is moving horizontally beyond its trigger and zero lines.
A successful climb above the 148.50 barricade could open the way for steeper increases until the next strong resistance of 149.70 and the 151.90 mark, registered from the high of 151.90.
On the other hand, a decline below the 61.8% Fibonacci of 147.70 could drive the pair until the next support of 146.60 before the bulls meet the 50-day SMA, which coincides with the 50.0% Fibonacci of 146.07. Underneath this area, traders could have a close eye on the 20- and the 200-day SMAs at 145.25 and 145.15 respectively, where the 38.2% Fibonacci of 144.70 also lies.
Summarizing, USDJPY is having an upside correction and the fact that is standing above the 61.8% Fibonacci is raising optimism for further bullish actions in the short-term. A move below it would endorse the technical oscillators scenario for a downside move.
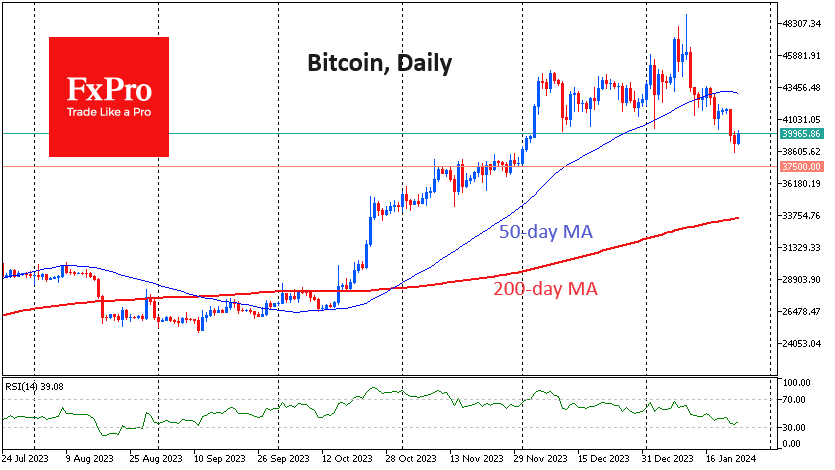
Global Risk Appetite Pauses Crypto Sell-off
Market picture
Bitcoin reversed to the upside on Tuesday afternoon. The price drop to $38.5K attracted buyers on the background of another update of all-time highs by leading US indices, which supported risk appetite.
In early trading on Wednesday, Bitcoin’s price is testing the $40K level. This is an attempt to break the downtrend by climbing above the previous day’s highs. Now, it seems that the sellers in Bitcoin have not yet exhausted their potential, and we should be ready for a new momentum of decline to $37.5K.
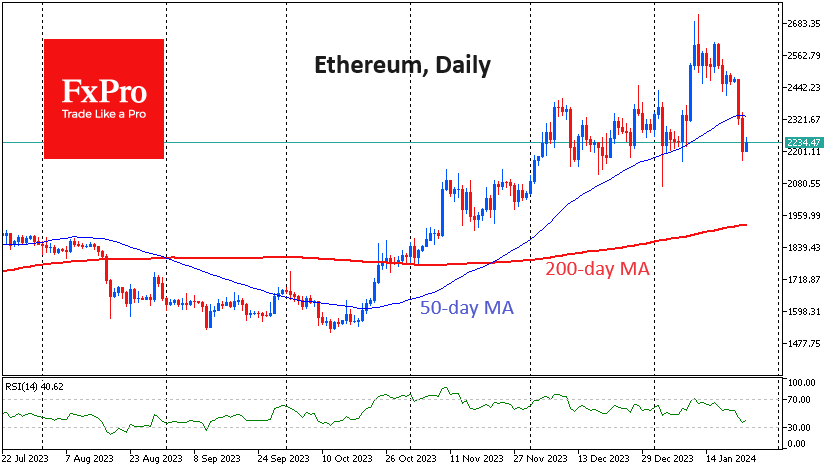
Some downside room remains in Ethereum also. It has rolled back to the lower boundary of the December consolidation, but from current levels, there is still potential for a correction to $2000, where the rally started at the end of November.
The pressure on Grayscale’s GBTC bitcoin fund has not diminished. According to CoinDesk, the FTX exchange going through bankruptcy proceedings got rid of 22.3 million GBTC shares worth around $908 million. Bloomberg calculated that, in total, investors got rid of GBTC shares worth $3.45 billion after spot ETFs were approved. Bitcoin outflows from GBTC exceed demand.
News background
BitMEX co-founder Arthur Hayes does not rule out a further fall in Bitcoin and bets on the asset dropping to $35K by the end of March. At the same time, he sticks to the bullish scenario in the long term.
MN Trading founder Michael van de Poppe urged buying Bitcoin below $40K, calling it a good opportunity. He said BTC had gathered liquidity and is nearing a localised bottom, with altcoins “showing strength”.
The US Congress has taken an interest in Meta’s plans for cryptocurrencies. Maxine Waters, a member of the Financial Services Committee of the US House of Representatives, requested information from Meta about the corporation’s possible plans for digital assets.
OKB, the native token of the crypto exchange OKX, collapsed by 50% in less than a minute. The exchange said it has launched an investigation into the incident, details of which it will disclose at a later date.
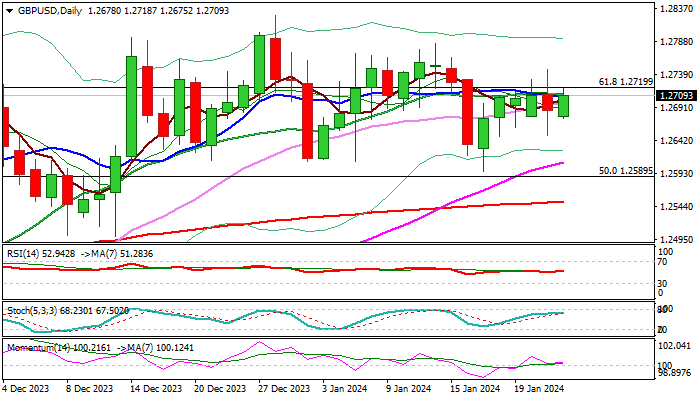
GBP/USD: Cable Regained Traction and Attacks Pivotal Barriers ahead of UK PMI Data
Cable bounced above 1.2700 mark on Wednesday morning, keeping bullish bias after Tuesday’s close in red and indecision signal from strong rejection on both sides.
Fresh strength cracks again pivotal barriers at 1.2710/20 (converged 10/20DMA’s/Fibo 61.8% of 1.3141/1.2037) which so far resisted several attacks.
Close above these levels is needed to signal bullish continuation of recovery leg from 1.2596 (Jan 17 low) and expose target at 1.2785 (Jan 12 lower top) which guards key barrier at 1.2875 (Dec 28 peak and six-month high).
Technical studies are bullishly aligned on daily chart (14-d momentum is holding in the positive territory and RSI rose from neutral zone) and support the action for now.
Tuesday’s spike low (1.2649) marks initial support, followed by more significant rising 55DMA/weekly cloud top (1.2610/00).
Markets focus on release of UK January flash PMI’s (Manufacturing 46.7 f/c vs 46.2 prev/Services 53.2 f/c vs 53.4 prev) for fresh direction signals.
Res: 1.2747; 1.2785; 1.2827; 1.2844.
Sup: 1.2649; 1.2610; 1.2589; 1.2551.
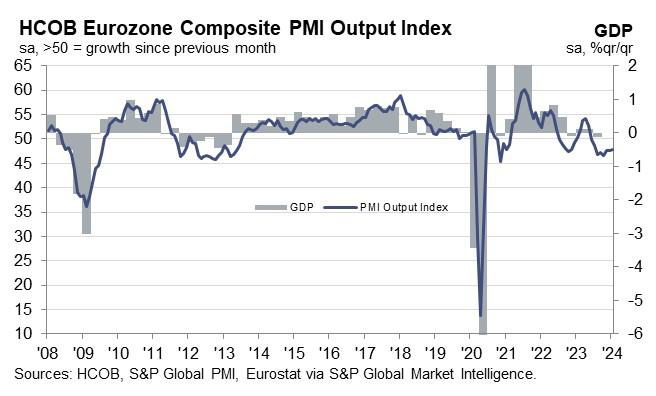
Eurozone’s PMI composite climbs to 47.9, price data echo ECB hawks’ caution
Eurozone PMI Manufacturing rose from 44.4 to 46.6 in January, a 10-month high. However, PMI services fell from 48.8 to 48.4. PMI Composite rose from 47.6 to 47.9, a 6-month high.
Cyrus de la Rubia, Chief Economist at Hamburg Commercial Bank, noted that Eurozone's manufacturing sector is experiencing a "widespread easing of the downward trajectory witnessed in the past year". He highlights that this positive trend is "evident across key indicators such as output, employment, and new orders."
While the services sector is contracting, de la Rubia points out that the contraction is "currently moderate". He also notes a "silver lining," as there is an increase in companies expanding their workforce, which indicates a degree of optimism in the market.
De la Rubia's observation that PMI price indicators are in line with the sentiments of the hawks within ECB. He states they are "all about shouting 'hold your horses'", emphasizing a need for a measured approach and advising against rushing into early rate cuts.
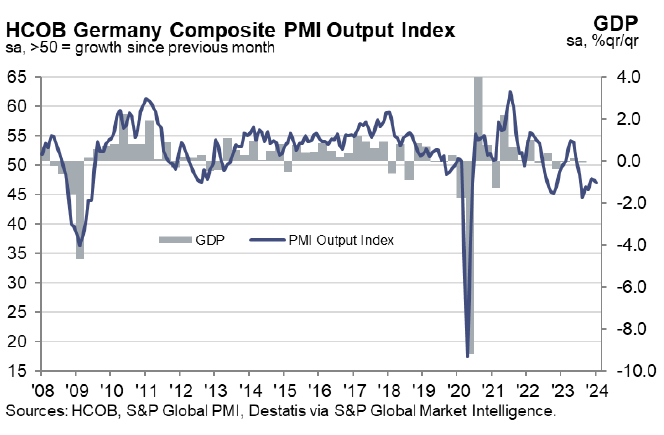
Germany’s PMI composite falls to 47.1, continuation of recession
Germany PMI Manufacturing rose from 43.3 to 45.4 in January, an 11-month high. PMI Services fell from 49.3 to 47.6, a 5-month low. PMI Composite fell from 47.4 to 47.1, a 3-month low.
Cyrus de la Rubia, Chief Economist at Hamburg Commercial Bank, noted: "Services activity has not only declined for the fourth consecutive month but has also accelerated in its downturn. Manufacturing, remaining in recessionary territory for the 19th straight month, has displayed a somewhat softened downturn."
De la Rubia further added, "Recognizing the inherent uncertainty at this early stage, our GDP Nowcast, which considers the PMI data, suggests a continuation of the recession into the current quarter, however."
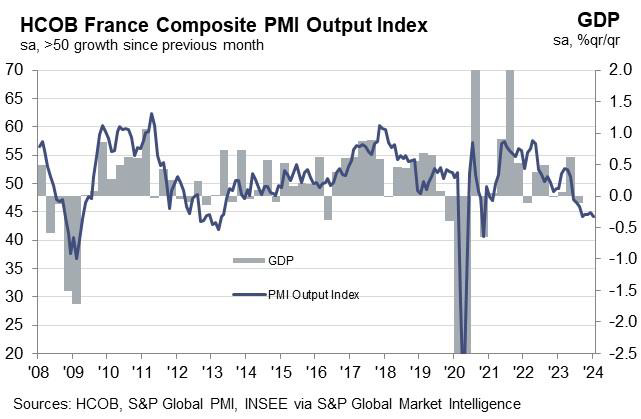
France’s PMI Composite dips to 44.2: Signals Q1 stagnation with downside risks
France PMI Manufacturing rose from 42.1 to 43.2 in January. PMI Services fell from 45.7 to 45.0. PMI Composite fell from 44.8 to 44.2.
Norman Liebke, Economist at Hamburg Commercial Bank, said the PMIs show a "depressing picture overall". According to the bank's nowcast model, the economy is likely to "stagnate" in Q1, and "risks are to the downside.
Liebke added that "most probably, the ECB won't start cutting rates in the next few months amid surging wages" He further explained that rising input prices, particularly due to higher wages, support the ECB's cautious stance on reducing interest rates. Businesses in France have been largely successful in transferring these increased costs to consumers, as evidenced by the rise in selling prices, especially in the labor-intensive service sector.