Sample Category Title
USD/CAD Daily Outlook
Daily Pivots: (S1) 1.3459; (P) 1.3494; (R1) 1.3558; More...
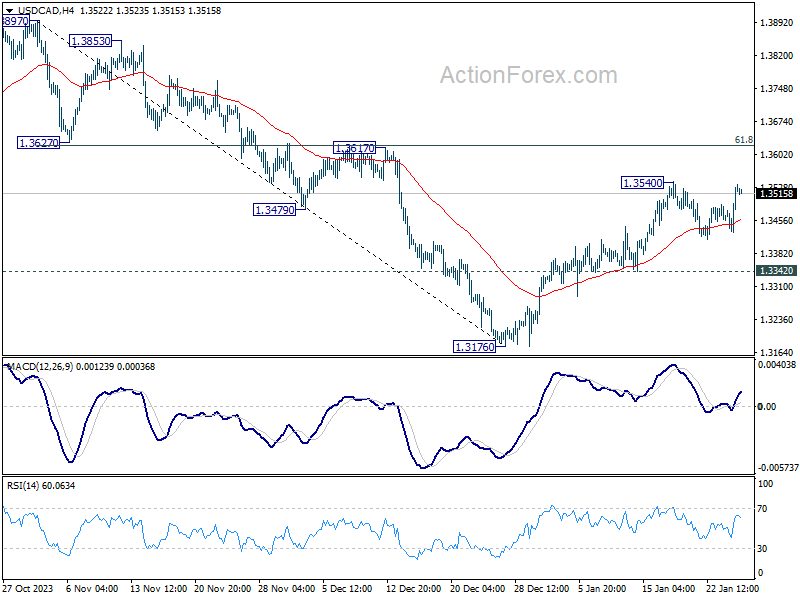
USD/CAD is staying below 1.3540 despite strong recovery overnight. Intraday bias remains neutral first and more consolidations could be seen. But further rally is expected as long as 1.3342 minor support holds. Fall from 1.3897 should have completed at 1.3716. Break of 1.3540w ill target 1.3617 cluster resistance (61.8% retracement of 1.3897 to 1.3176 at 1.3622). Decisive break there will pave the way to 1.3897/3976 key resistance zone.
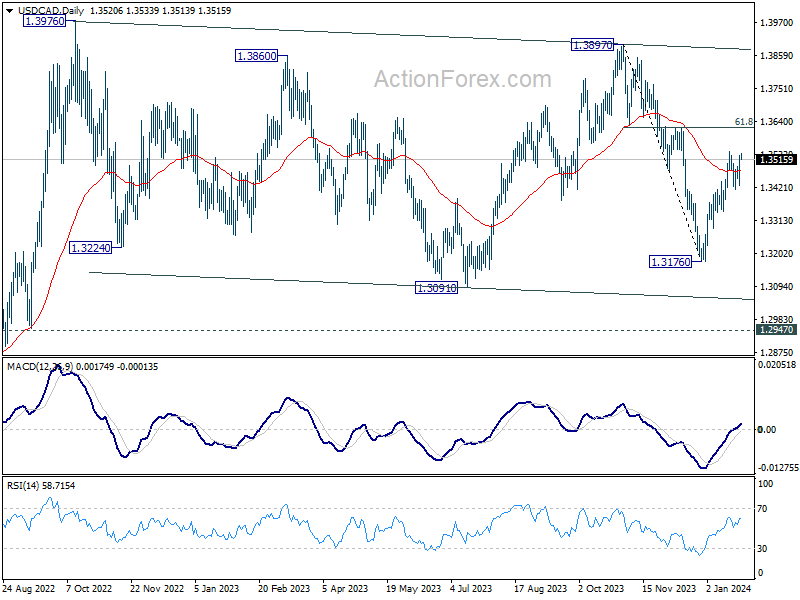
In the bigger picture, price actions from 1.3976 (2022 high) are viewed as a corrective pattern only. In case of another fall, strong support should emerge above 1.2947 resistance turned support to bring rebound. Overall, larger up trend from 1.2005 (2021 low) is still expected to resume through 1.3976 at a later stage.
US Stocks Begin Profit-Taking as Investors Eye GDP; ECB Rate Decision Also Awaited
Range trading continues in most major pairs and crosses for the week so far. Dollar's selloff was relatively short-lived overnight, as US stocks retreated rather deeply after initial rally. There is sign of profit-taking in equities, which could curb any selling pressure in the greenback in the near term. However, Dollar's next move remains contingent on the upcoming US GDP release today and PCE inflation tomorrow.
Today's ECB rate decision and Germany's Ifo Business Climate index are key focal points for Euro. While it's improbable that the ECB will provide any concrete indications regarding the timing of rate adjustments, President Christine Lagarde's commentary on Eurozone economy could be a game-changer. Any expressions of deep concern might spark renewed speculation about an imminent rate cut, potentially exerting further pressure on Euro, especially considering its relative weakness against Sterling and Swiss Franc.
Turning our gaze to Asia-Pacific, the ongoing rebound in Chinese and Hong Kong stock markets has yet to make a substantial impact on the currency markets. Australian Dollar is notably struggling to maintain momentum in its rebound, while New Zealand Dollar also appears to be under some strain. Following BoC decision to maintain its interest rate stance, Canadian Dollar is experiencing some bearish pressure. On the other hand, Japanese Yen stands out as one of the stronger performers this week. However, it's important to note that Yen's strength is more reflective of a consolidation phase in the aftermath of its recent downward trend, rather than a fundamental bullish shift.
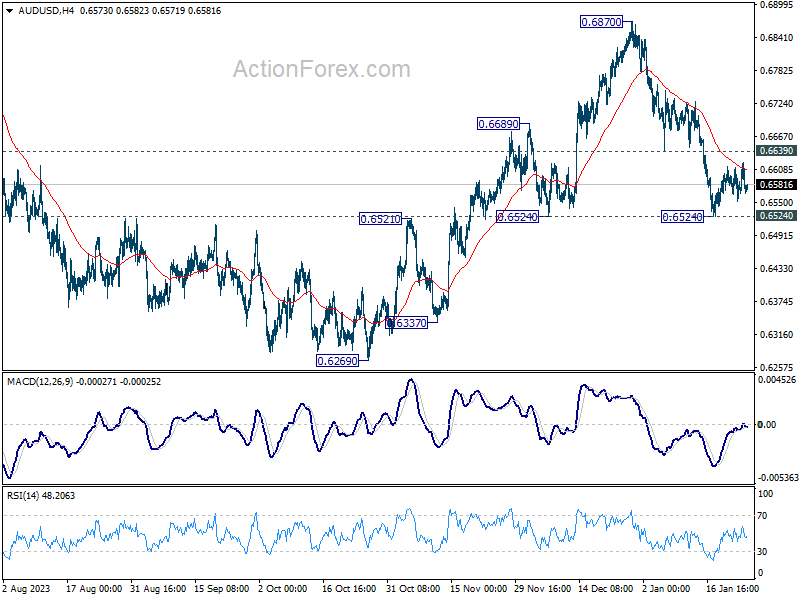
Technically, AUD/USD is worth a watch today after initial rejection by 55 4H EMA. Near term outlook stays bearish with 0.6639 minor resistance intact. Firm break of 0.6524 will resume the decline from 0.6870. That could also prompt downside acceleration back towards 0.6269 low. The next move in AUD/USD could depend on whether US stocks are turning into a corrective phase after recent record run.
In Asia, Nikkei closed up 0.03%. Hong Kong HSI is up 1.94%. China Shanghai SSE is up 2.76%. Singapore Strait Times is down -0.30%. Japan 10-year JGB yield is up 0.0229 at 0.745. Overnight, DOW fell -0.26%. S&P 500 rose 0.08%. NASDAQ rose 0.36%. 10-year yield rose 0.036 to 4.178.
ECB to stand pat, await Lagarde's take on rate cut and economic outlook
ECB is widely expected to keep monetary policy unchanged today. Main refinancing rate will be held at 4.50%, and deposit rate at 4.00%. Given the lack of significant new data since the December meeting, it's improbable that ECB will offer fresh policy directions. Instead, it's expected that the market will have to await March meeting, which will include new economic projections, for any substantial updates.
President Christine Lagarde is likely to continue her stance against the speculation of imminent rate cuts. It is anticipated that she will emphasize the persistence of underlying price pressures, especially in the services sector, and highlight the various risks still in play. These risks range from impending wage negotiations to geopolitical tensions, such as the ongoing Red Sea blockade.
However, the tone adopted by Lagarde regarding the Eurozone's economic condition will be scrutinized closely. Recent economic data, including this week's PMIs suggests that Eurozone might be already in a recession in the last quarter and is witnessing a sluggish start to the new year. Should President Lagarde express heightened concern over the economic situation, it could potentially trigger market participants to increase their bets on an earlier rate cut.
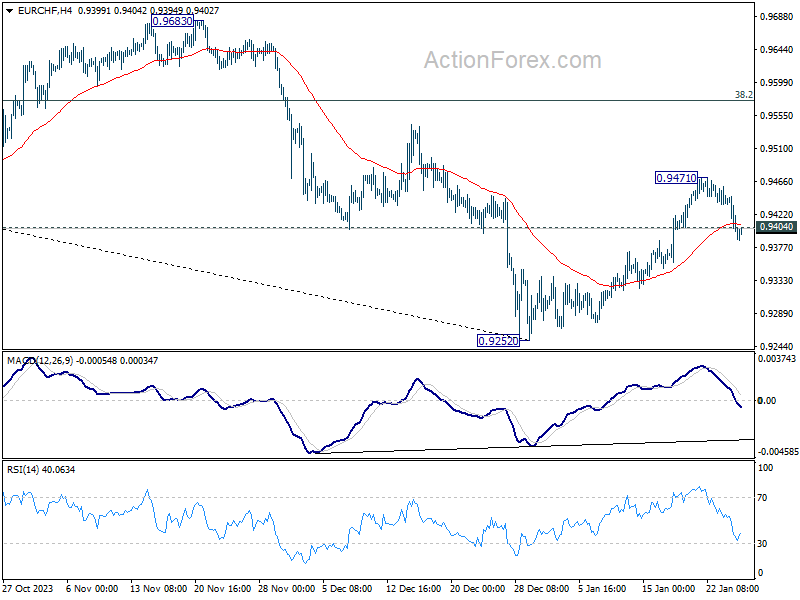
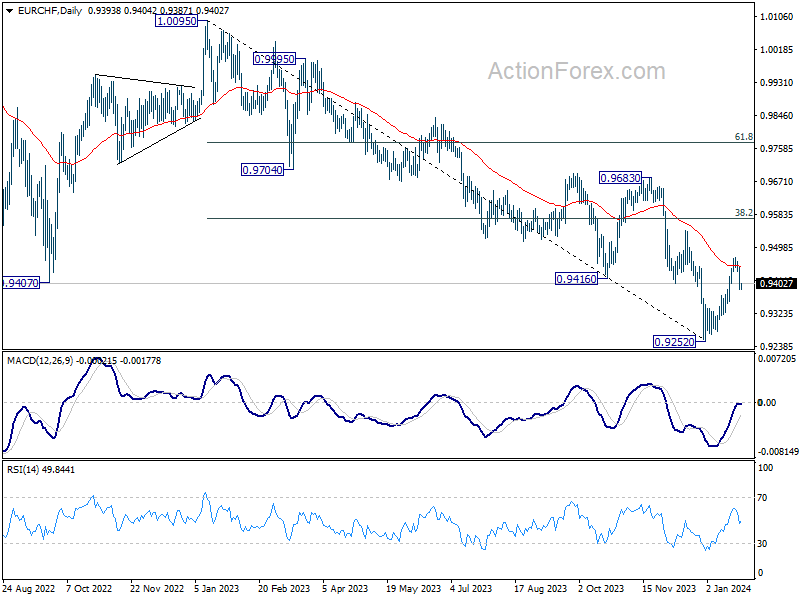
EUR/CHF's deep retreat this week suggests initial rejection by 55 D EMA (now at 0.9447). Deeper pull back is now mildly in favor as long as 0.9471 holds, towards 0.9252 low. But a break there is not envisaged at this point. Meanwhile, break of 0.9471 will resume the rebound, as a correction to whole down trend from 1.0095, to 38.2% retracement of 1.0095 to 0.9252 at 0.9574.
US Q4 GDP in spotlight: A test for S&P 500 amid profit taking
Financial markets are also keenly focused on US GDP data today. Analysts expect GDP to grow at an annualized rate of 2.0% in Q4, marking a slowdown from the previous quarter's 4.9%, and reaching the lowest rate since Q2 of 2022. This anticipated reading would align with the notion that the US economy, while experiencing a rapid cooling, remains resilient. A key component under scrutiny is the performance of consumption growth, which has been a significant support for the economy. Also to be featured from the US, durable goods orders, trade balance, jobless claims, and new home sales will be released.
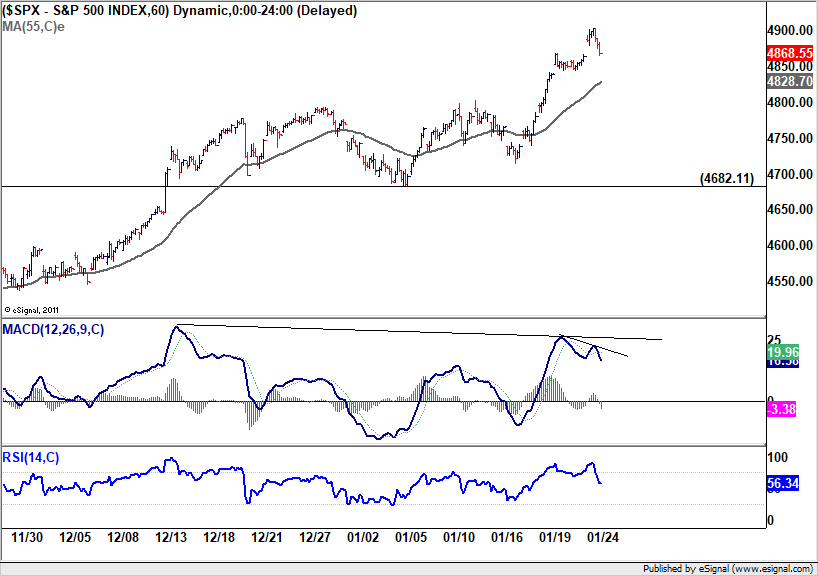
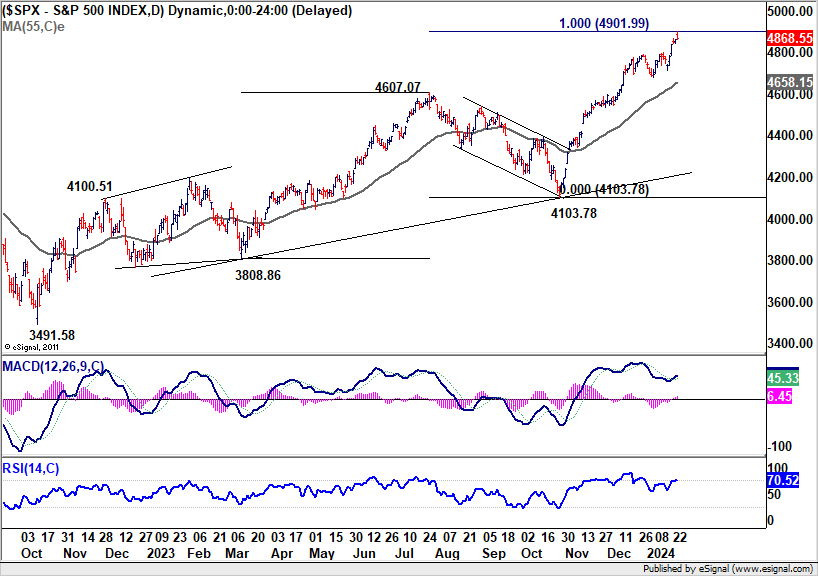
Notable profit taking was seen in the US stock markets after initial rally overnight. S&P 500 closed up just 0.08% at 4868.55, after climbing to 4903.68. Technically, there is prospect of a prolonged near-term consolidation given that SPX has just met 100% projection of 3808.86 to 4607.07 from 4103.78 at 4901.99.
Break of 55 H EMA (now at 4828.70) could trigger deeper correction towards 4682.11 support, which is slightly above 55 D EMA (now at 4658.15), and set the range for sideway consolidations.
Nevertheless, another rally, as supported by strong GDP data today, and sustained trading above 4901.99 would set the stage for a take on 5000 psychological level quickly.
USD/CAD Daily Outlook
Daily Pivots: (S1) 1.3459; (P) 1.3494; (R1) 1.3558; More...
USD/CAD is staying below 1.3540 despite strong recovery overnight. Intraday bias remains neutral first and more consolidations could be seen. But further rally is expected as long as 1.3342 minor support holds. Fall from 1.3897 should have completed at 1.3716. Break of 1.3540w ill target 1.3617 cluster resistance (61.8% retracement of 1.3897 to 1.3176 at 1.3622). Decisive break there will pave the way to 1.3897/3976 key resistance zone.
In the bigger picture, price actions from 1.3976 (2022 high) are viewed as a corrective pattern only. In case of another fall, strong support should emerge above 1.2947 resistance turned support to bring rebound. Overall, larger up trend from 1.2005 (2021 low) is still expected to resume through 1.3976 at a later stage.
Economic Indicators Update
| GMT | Ccy | Events | Actual | Forecast | Previous | Revised |
|---|---|---|---|---|---|---|
| 00:30 | AUD | RBA Bulletin Q4 | ||||
| 09:00 | EUR | Germany IFO Business Climate Jan | 86.7 | 86.4 | ||
| 09:00 | EUR | Germany IFO Current Assessment Jan | 88.6 | 88.5 | ||
| 09:00 | EUR | Germany IFO Expectations Jan | 84.9 | 84.3 | ||
| 13:15 | EUR | ECB Main Refinancing Rate | 4.50% | 4.50% | ||
| 13:30 | USD | Initial Jobless Claims (Jan 19) | 199K | 187K | ||
| 13:30 | USD | GDP Annualized Q4 P | 2.00% | 4.90% | ||
| 13:30 | USD | GDP Price Index Q4 P | 2.20% | 3.30% | ||
| 13:30 | USD | Goods Trade Balance (USD) Dec P | -88.7B | -90.3B | ||
| 13:30 | USD | Wholesale Inventories Dec P | -0.20% | -0.20% | ||
| 13:30 | USD | Durable Goods Orders Dec | 1.00% | 5.40% | ||
| 13:30 | USD | Durable Goods Orders ex Transport Dec | 0.20% | 0.40% | ||
| 13:45 | EUR | ECB Press Conference | ||||
| 15:00 | USD | New Home Sales Dec | 646K | 590K | ||
| 15:30 | USD | Natural Gas Storage | -154B |
Technical Outlook and Review
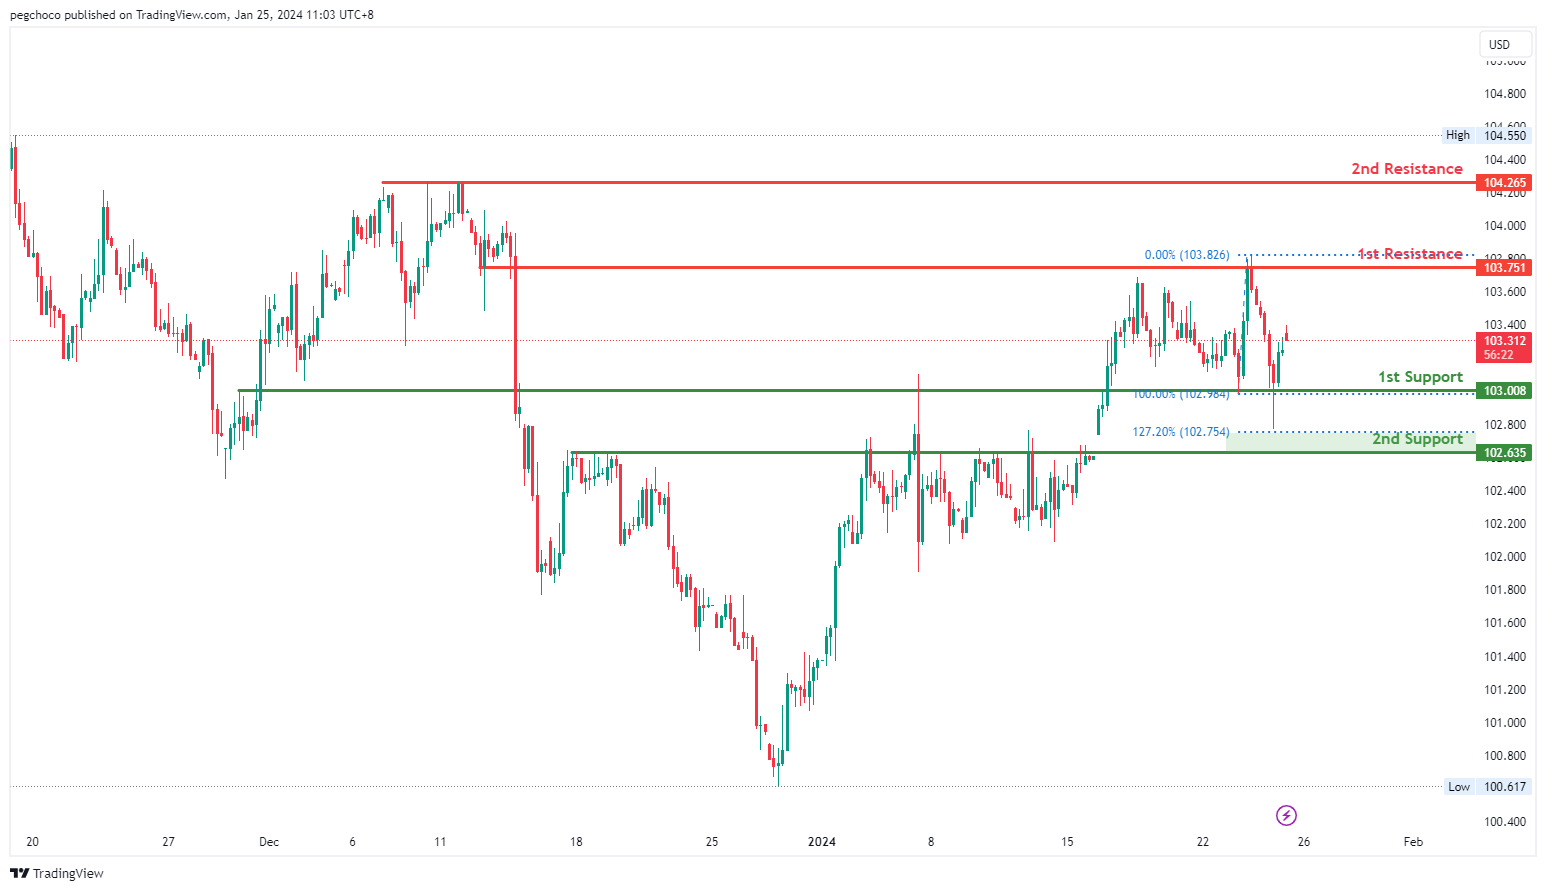
DXY:
The DXY (US Dollar Currency Index) chart currently demonstrates a bullish overall momentum, indicating strength in the US Dollar. Your analysis suggests that there is potential for a bullish continuation in the price towards the 1st resistance level.
The 1st support level at 103.10 is considered significant as it represents an overlap support, indicating that this price level has previously acted as both support and resistance. This historical significance suggests it may serve as a strong area where price could potentially find support during a bullish move.
The 2nd support level at 102.63 is identified as a pullback support and also coincides with the 127.20% Fibonacci Extension level. This confluence of factors adds further significance to this support zone, implying that it may act as a notable support level during price pullbacks.
On the resistance side, the 1st resistance level at 103.75 is recognized as an overlap resistance, suggesting that this price level has historically served as both support and resistance. This makes it a potential barrier where selling pressure could emerge.
The 2nd resistance level at 104.26 is categorized as a multi-swing high resistance, indicating that it represents a historical point where the price has encountered resistance and potential selling interest.
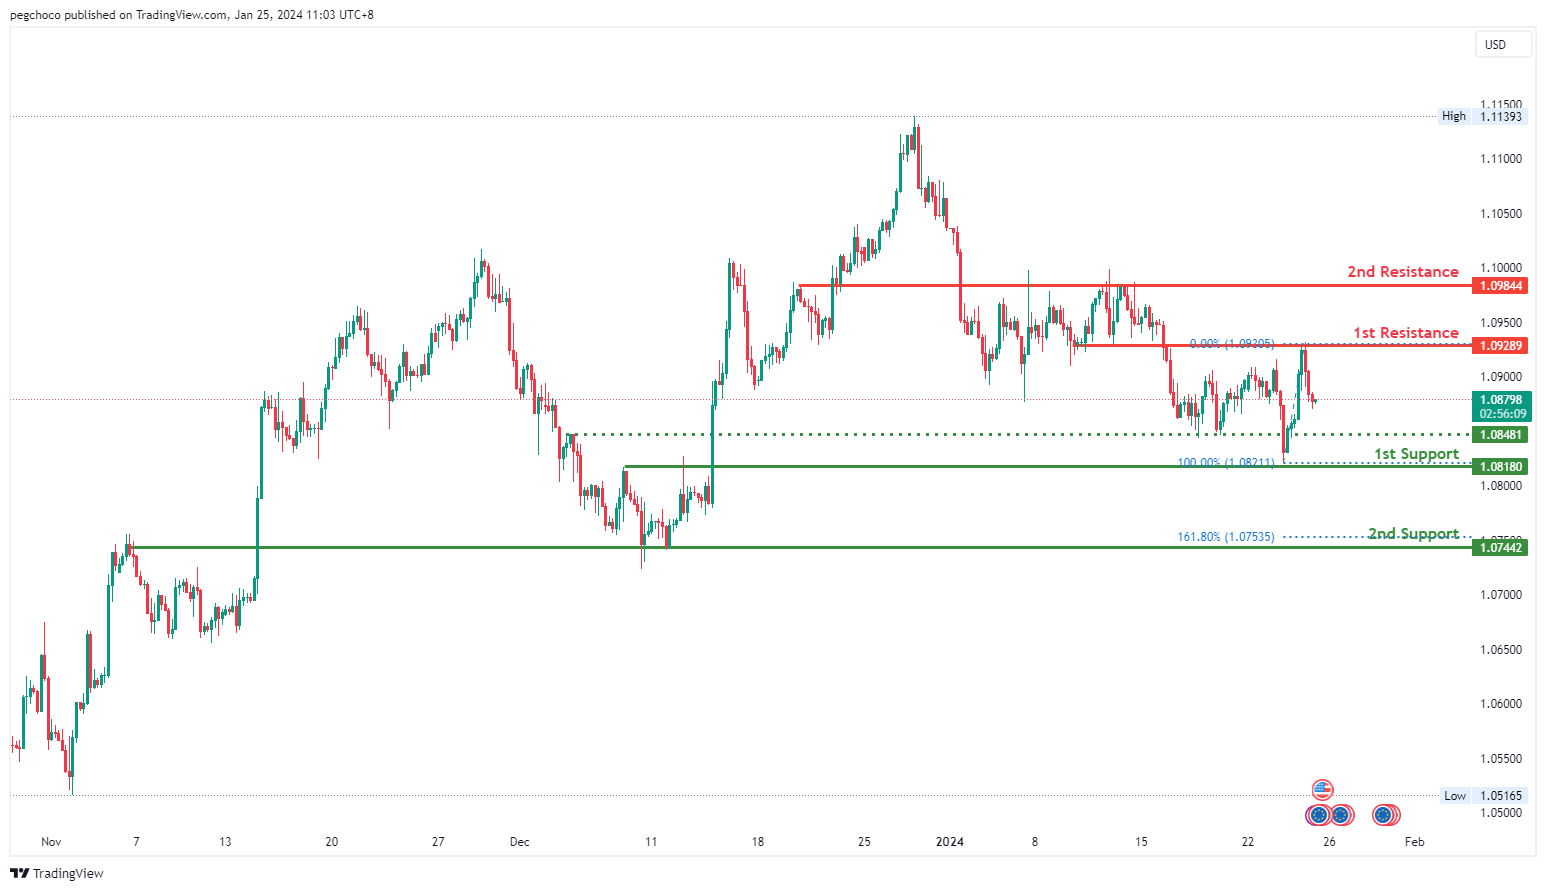
EUR/USD:
The EUR/USD trading pair is currently displaying a bearish overall momentum, indicating weakness in the Euro relative to the US Dollar. Your analysis suggests that there is potential for a bearish continuation in the price towards the 1st support level.
The 1st support level at 1.0818 is considered significant as it represents an overlap support, indicating that this price level has previously acted as both support and resistance. This suggests that it may serve as a strong area where price could potentially find support during a bearish move.
The 2nd support level at 1.0744 is identified as an overlap support and also coincides with the 161.80% Fibonacci Extension level. This confluence of factors adds further significance to this support zone, implying that it may act as a notable support level during price declines.
On the resistance side, the 1st resistance level at 1.0928 is recognized as an overlap resistance, suggesting that this price level has historically served as both support and resistance. This makes it a potential barrier where selling pressure could emerge.
The 2nd resistance level at 1.0984 is also identified as an overlap resistance, emphasizing its historical significance as a potential barrier for further upward price movement.
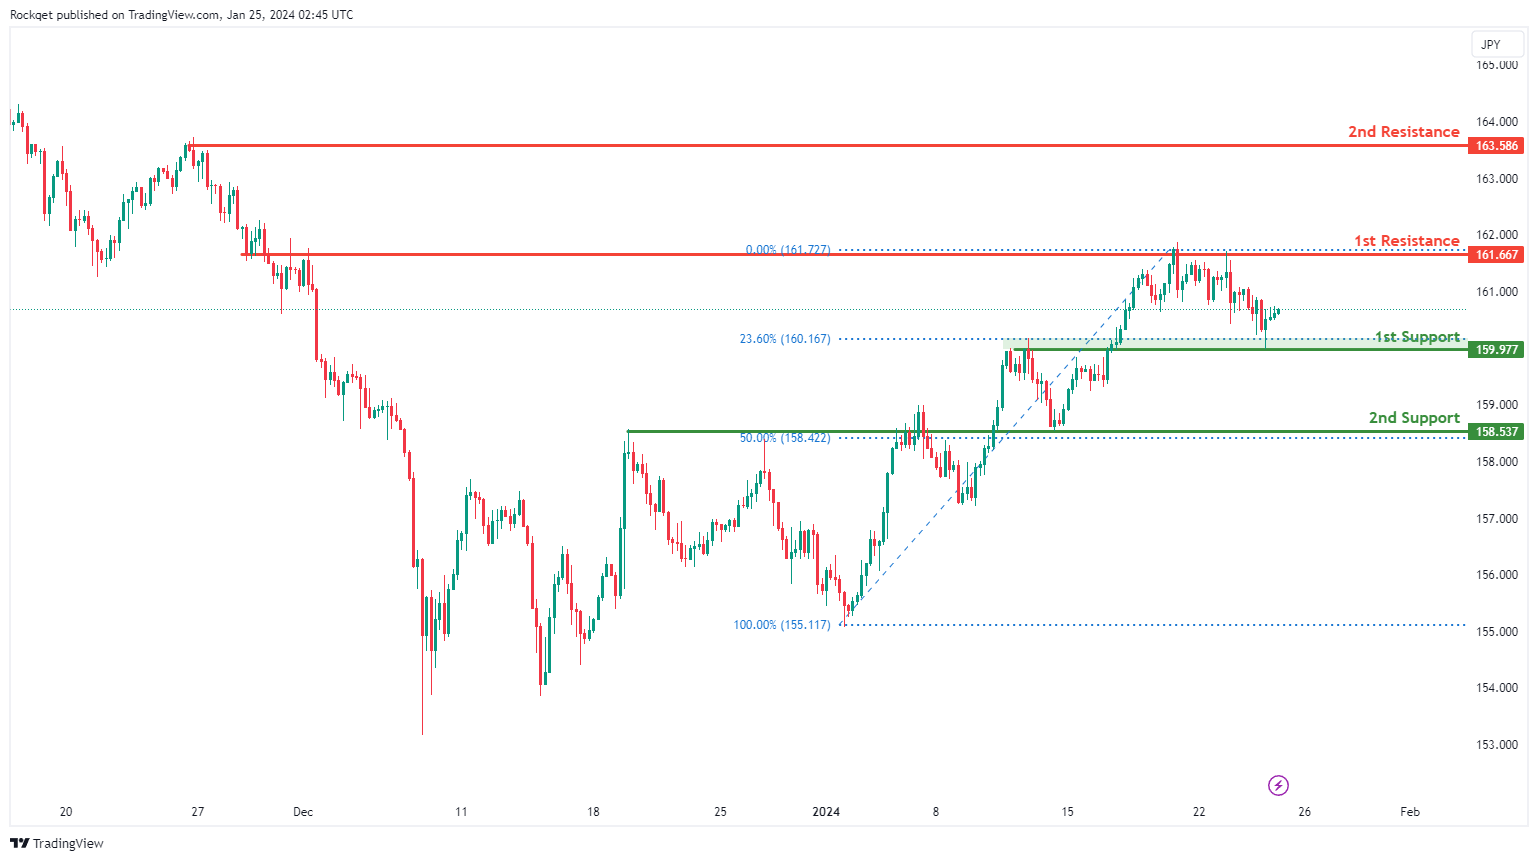
EUR/JPY:
The EUR/JPY chart currently demonstrates a bullish overall momentum, indicating a positive trend direction. There are key support and resistance levels that traders should monitor for potential price movements.
The 1st support at 159.98 is identified as an overlap support and coincides with the 23.60% Fibonacci Retracement, suggesting historical significance as a level where buying interest has emerged before.
Additionally, the 2nd support at 158.54 is recognized as an overlap support and aligns with the 50% Fibonacci Retracement, providing additional strength to the support zone.
On the resistance side, the 1st resistance at 161.67 is significant for being an overlap resistance, marking a historical level where selling pressure has been present.
Furthermore, the 2nd resistance at 163.59 is a swing high resistance, indicating a potential point of price reversal.
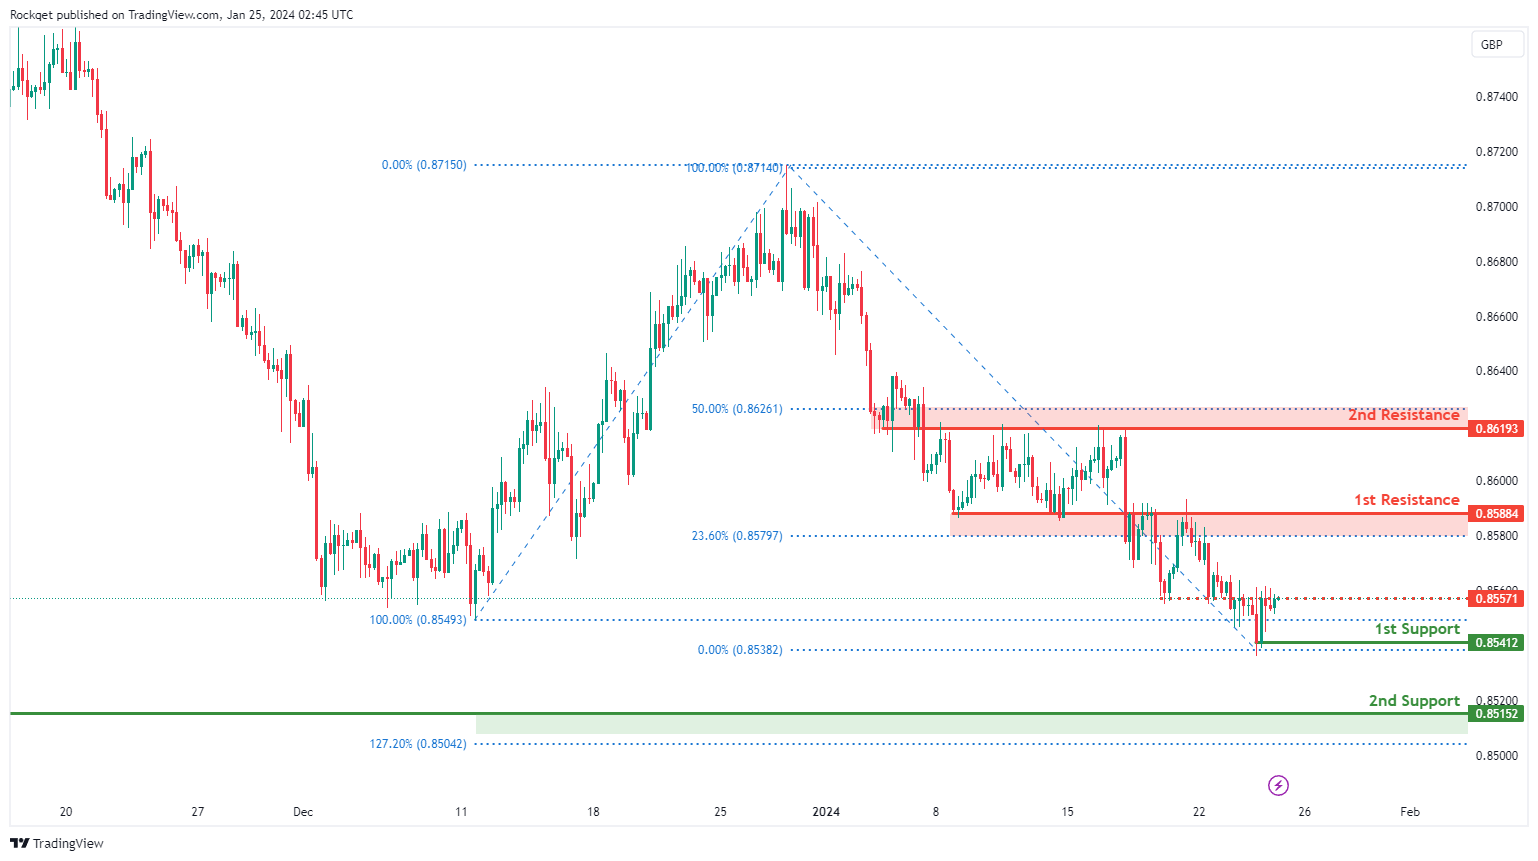
EUR/GBP:
The EUR/GBP chart currently exhibits a bullish overall momentum, suggesting a positive trend direction. Several key support and resistance levels are identified, providing insights for potential price movements.
The 1st support at 0.8541 is considered favorable as it is recognized as a swing low support, representing a historical level where buying interest has previously emerged.
Additionally, the 2nd support at 0.8515 is acknowledged as a swing low support and coincides with the 127.20% Fibonacci Extension, adding confluence to the support zone.
On the resistance side, the intermediate resistance at 0.8557 is identified as an overlap resistance, marking a level where selling pressure may be present.
The 1st resistance at 0.8588 is significant for being an overlap resistance and aligns with the 23.60% Fibonacci Retracement, providing additional strength to this potential resistance level.
Furthermore, the 2nd resistance at 0.8619 is recognized as an overlap resistance and corresponds to the 50% Fibonacci Retracement.
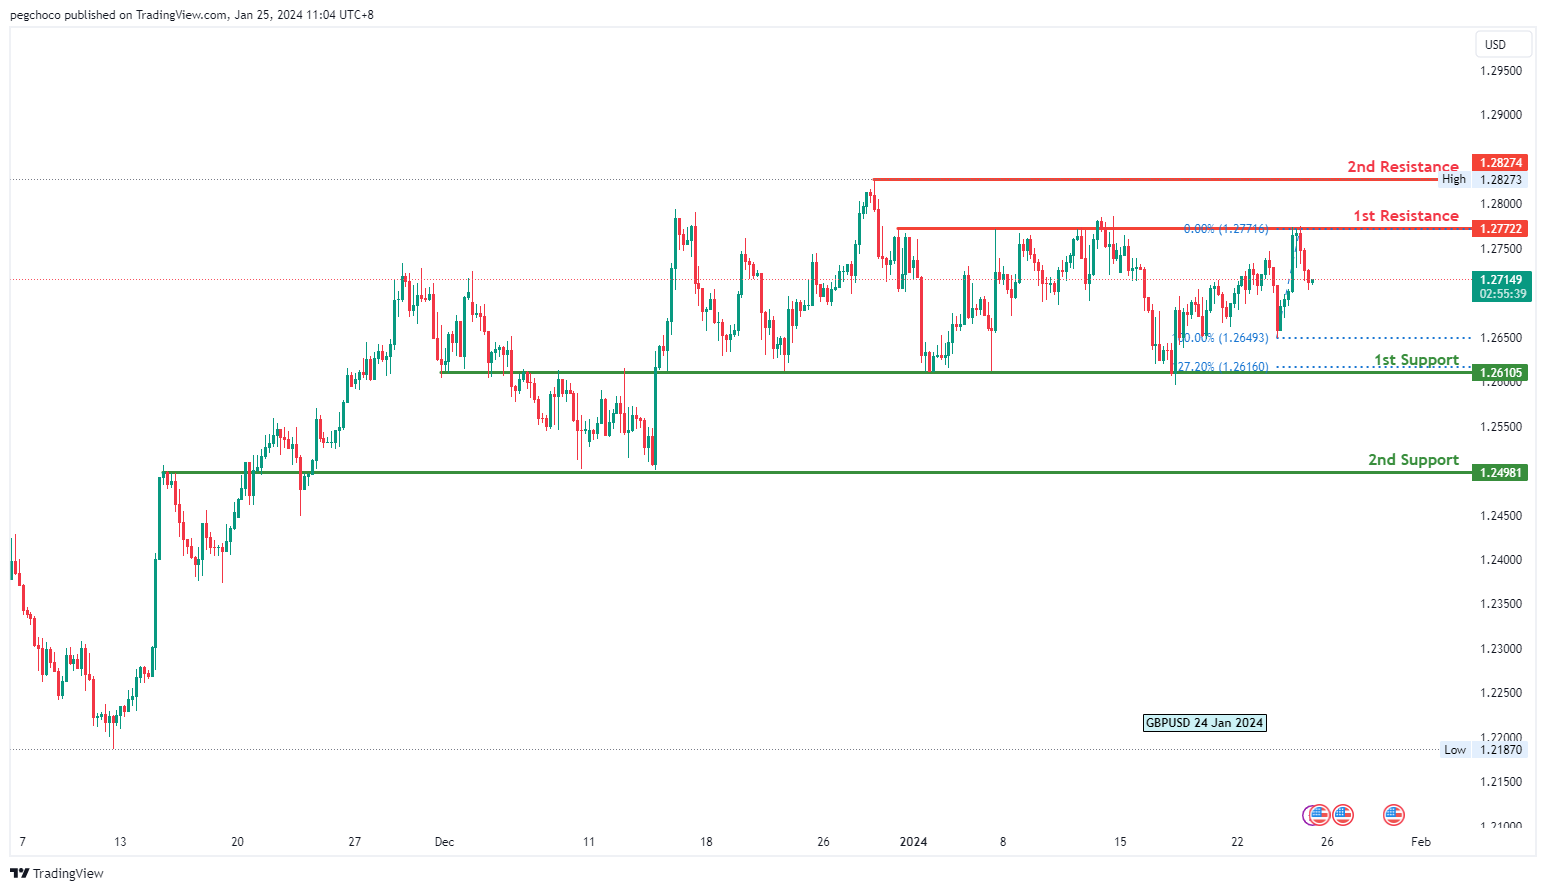
GBP/USD:
The GBP/USD trading pair currently has a bearish overall momentum, indicating weakness in the British Pound relative to the US Dollar. Your analysis suggests that there is potential for a bearish continuation in the price towards the 1st support level.
The 1st support level at 1.2610 is considered significant as it represents an overlap support and also coincides with the 127.20% Fibonacci Extension level. This confluence of factors adds further significance to this support zone, implying that it may serve as a strong area where price could potentially find support during a bearish move.
The 2nd support level at 1.2498 is identified as an overlap support, reinforcing its importance as a level where price has previously found both support and resistance.
On the resistance side, the 1st resistance level at 1.2772 is recognized as a multi-swing high resistance, indicating that it represents a historical point where the price has encountered resistance and potential selling interest.
The 2nd resistance level at 1.2827 is categorized as a swing high resistance, suggesting that it represents a historical point where the price has encountered resistance.
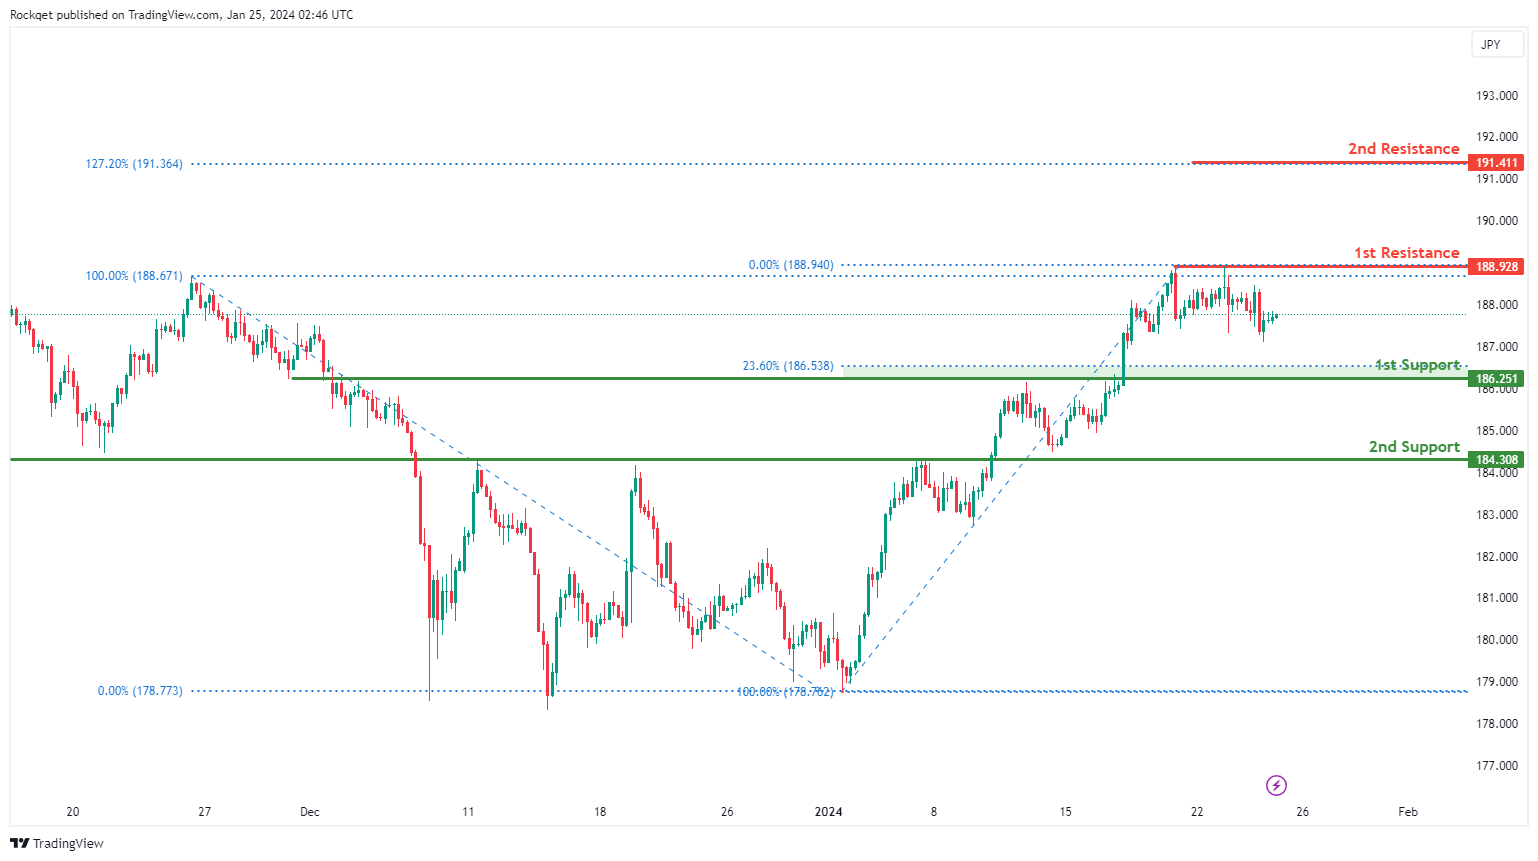
GBP/JPY:
The GBP/JPY chart currently demonstrates a neutral overall momentum, indicating a lack of a clear trend direction. In such a market environment, the price could potentially experience fluctuations between key support and resistance levels.
The 1st support at 186.25 is identified as an overlap support and coincides with the 23.60% Fibonacci Retracement, marking a historical level where buying interest has previously emerged. Additionally, the 2nd support at 184.31 is recognized as a pullback support, providing additional strength to the support zone.
On the resistance side, the 1st resistance at 188.93 is considered significant for being a swing high resistance. This level suggests a historical point where selling pressure has been notable. Furthermore, the 2nd resistance at 191.41 is noteworthy as it aligns with the 127.20% Fibonacci Extension, adding confluence to its potential as a resistance level.
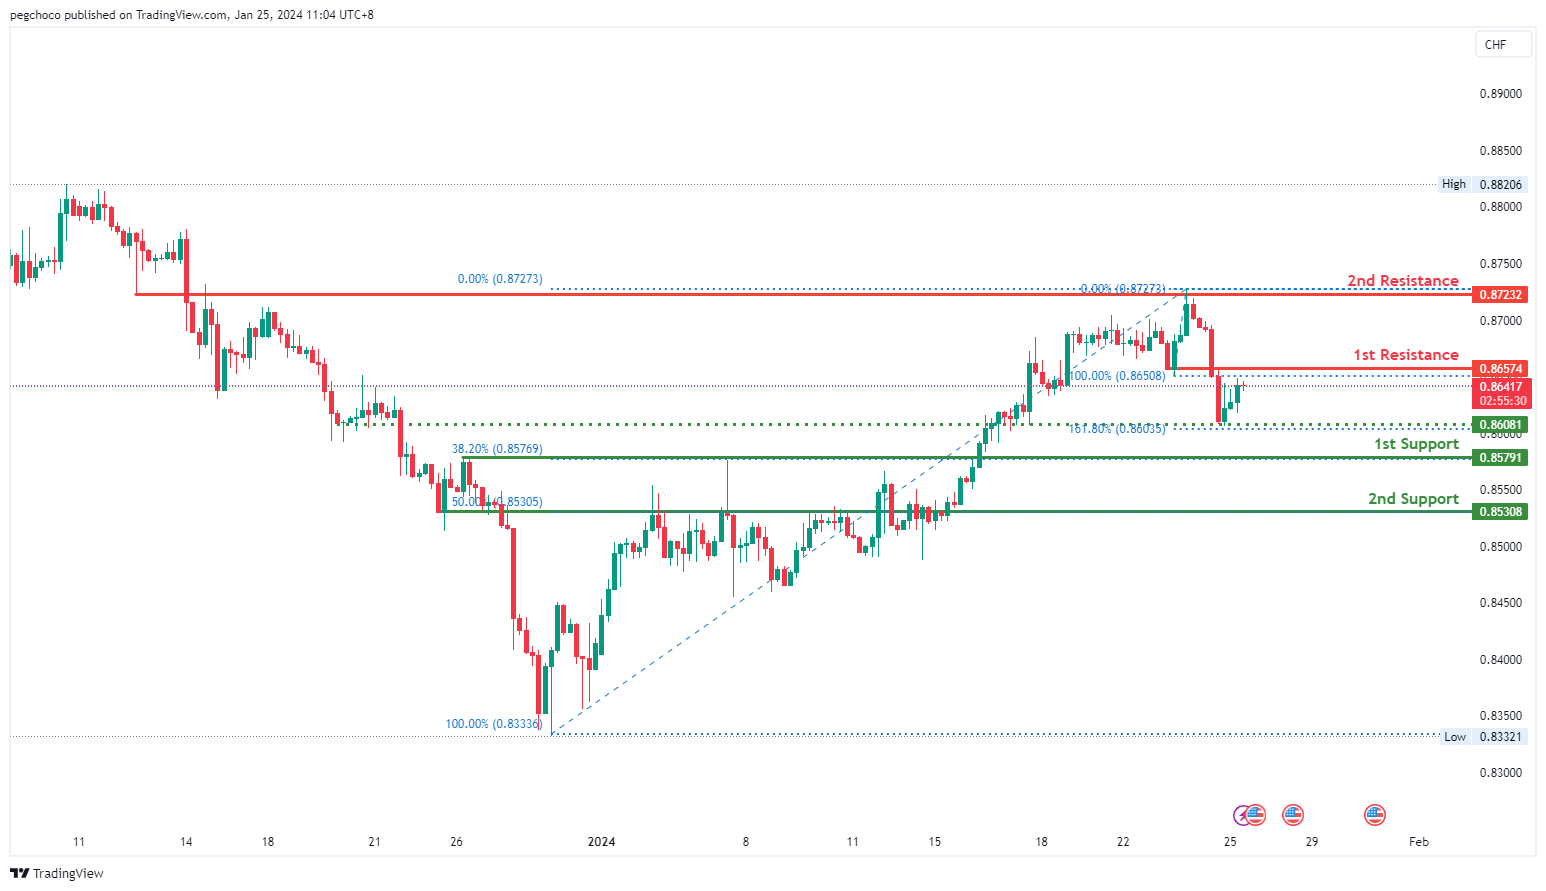
USD/CHF:
The USD/CHF trading pair is currently displaying a bearish overall momentum, indicating weakness in the US Dollar relative to the Swiss Franc. According to your analysis, there is potential for a bearish reaction off the 1st resistance level, followed by a drop towards the 1st support level.
The 1st support level at 0.8579 is considered significant as it represents a pullback support and coincides with the 38.20% Fibonacci Retracement level. This confluence of factors adds further significance to this support zone, suggesting it may serve as a strong area where price could potentially find support during a bearish move.
The 2nd support level at 0.8530 is identified as a pullback support and aligns with the 50% Fibonacci Retracement level, further reinforcing its importance as a potential support level during price pullbacks.
On the resistance side, the 1st resistance level at 0.8657 is recognized as a pullback resistance, implying that it might act as a notable resistance point during price pullbacks.
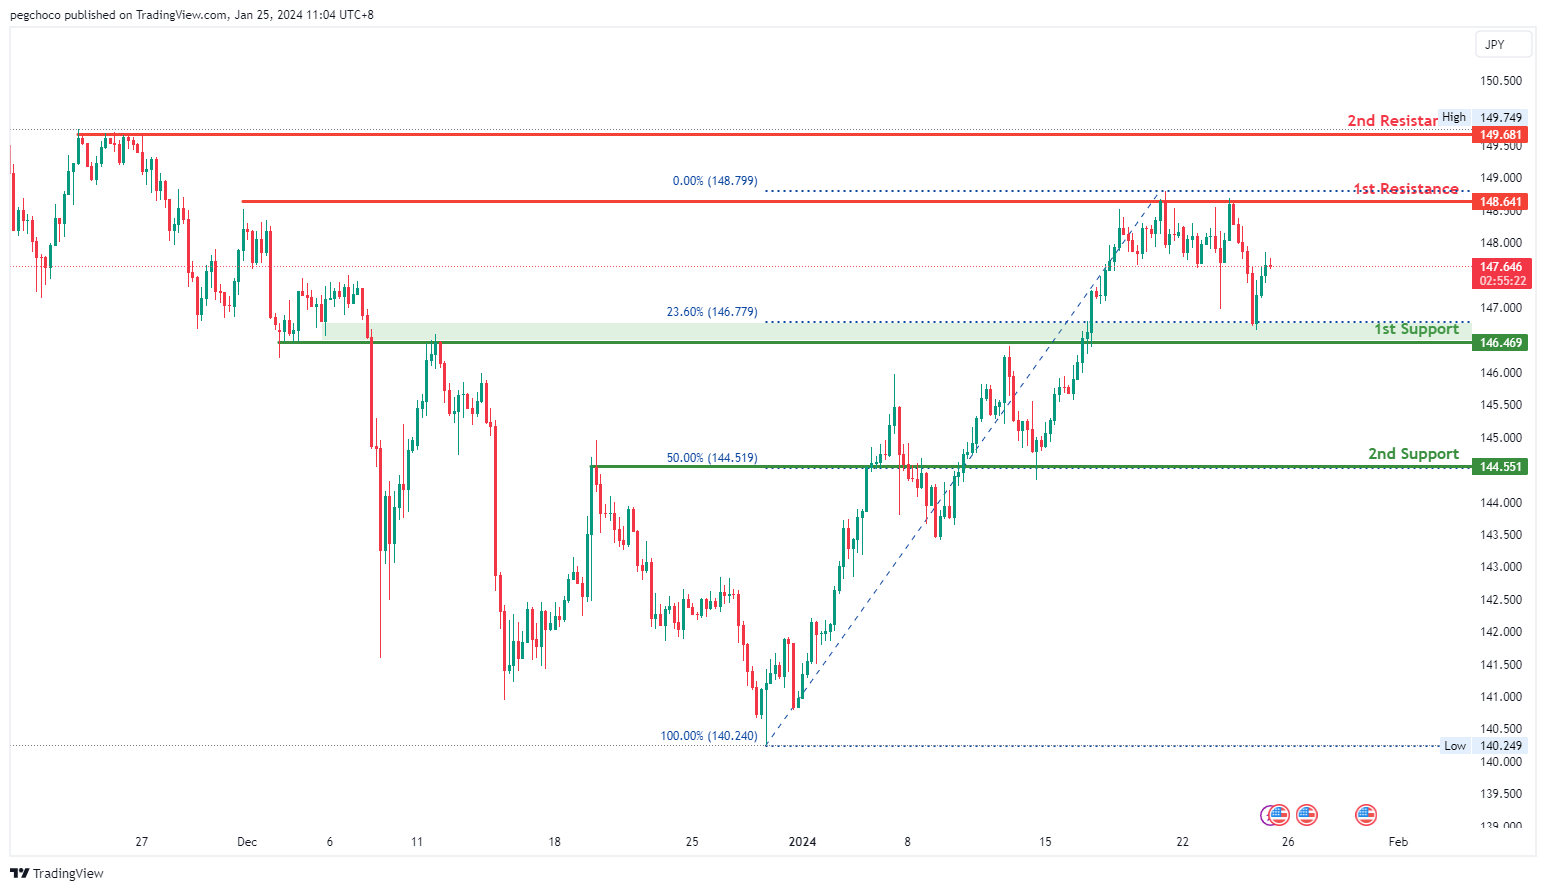
USD/JPY:
The USD/JPY trading pair currently demonstrates a bearish overall momentum, indicating weakness in the US Dollar relative to the Japanese Yen. According to your analysis, there is potential for a short-term rise in price towards the 1st resistance level before reversing off it and subsequently dropping towards the 1st support level.
The 1st support level at 146.46 is considered significant as it represents an overlap support and also coincides with the 23.60% Fibonacci Retracement level. This confluence of factors adds further significance to this support zone, suggesting it may serve as a strong area where price could potentially find support during a bearish move.
The 2nd support level at 144.55 is identified as an overlap support and aligns with the 50% Fibonacci Retracement level, further reinforcing its importance as a potential support level during price declines.
On the resistance side, the 1st resistance level at 148.64 is recognized as a multi-swing high resistance. This implies that it represents a historical point where the price has encountered resistance and potential selling interest.
The 2nd resistance level at 149.68 is categorized as a multi-swing high resistance, indicating its significance as a point where the price has historically faced resistance.
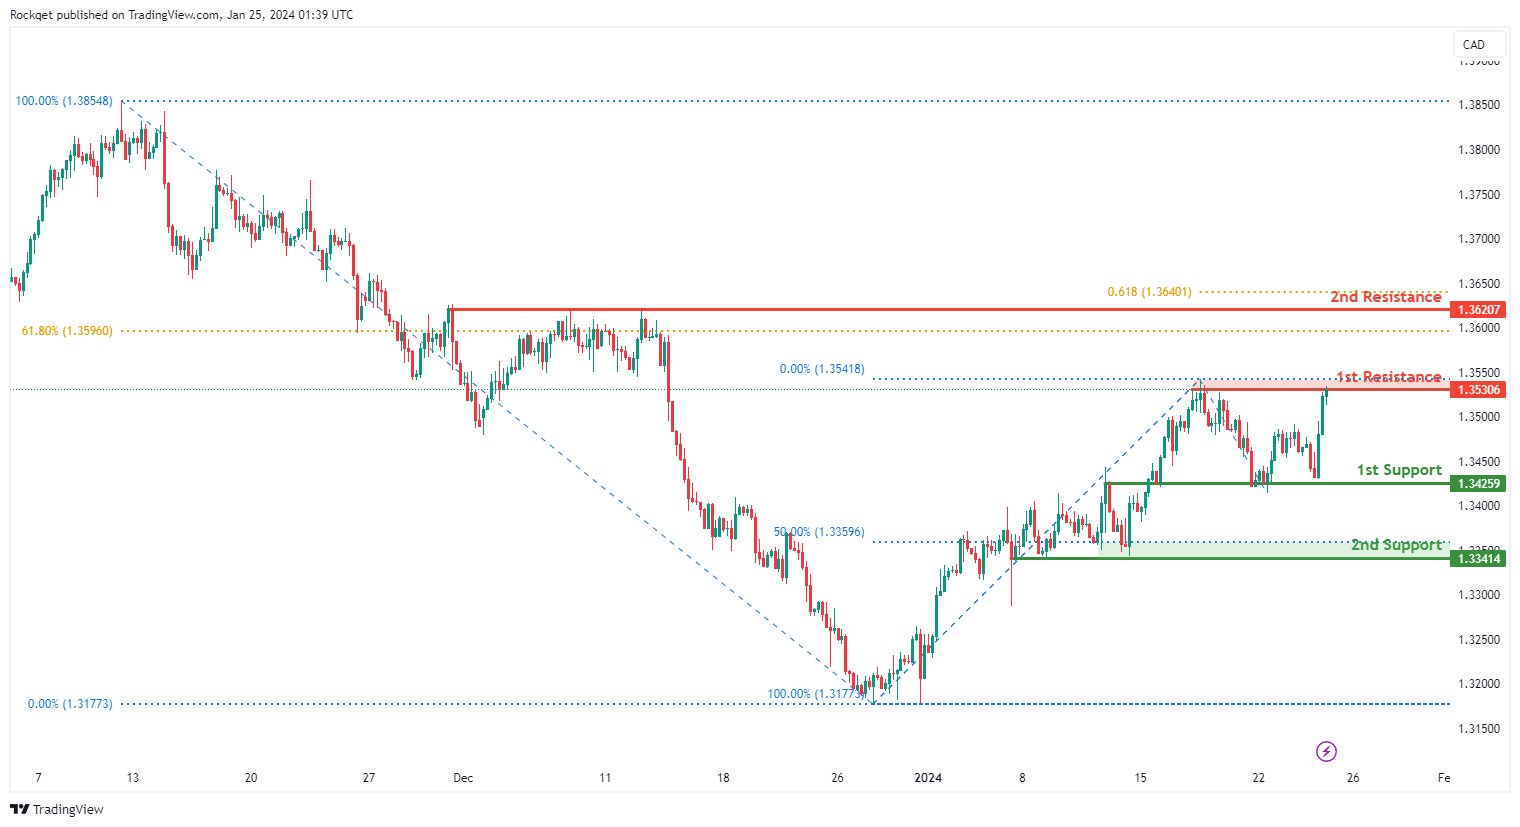
USD/CAD:
The USD/CAD chart currently exhibits an overall bullish momentum. However, there is a potential scenario for price to make a bearish reaction off the 1st resistance to drop lower before resuming the uptrend.
The 1st resistance level at 1.3530 is identified as a pullback resistance. Higher up, the 2nd resistance level at 1.3620 is also noted as a pullback resistance that aligns close to a confluence of Fibonacci levels i.e. the 61.80% retracement and the 61.80% projection, further reinforcing its significance as a potential resistance zone.
To the downside, the 1st support level at 1.3425 is identified as an overlap support. Further below, the 2nd support level at 1.3341 is marked as a pullback support that aligns close to the 50.00% Fibonacci retracement level, further reinforcing its importance as a key support level.
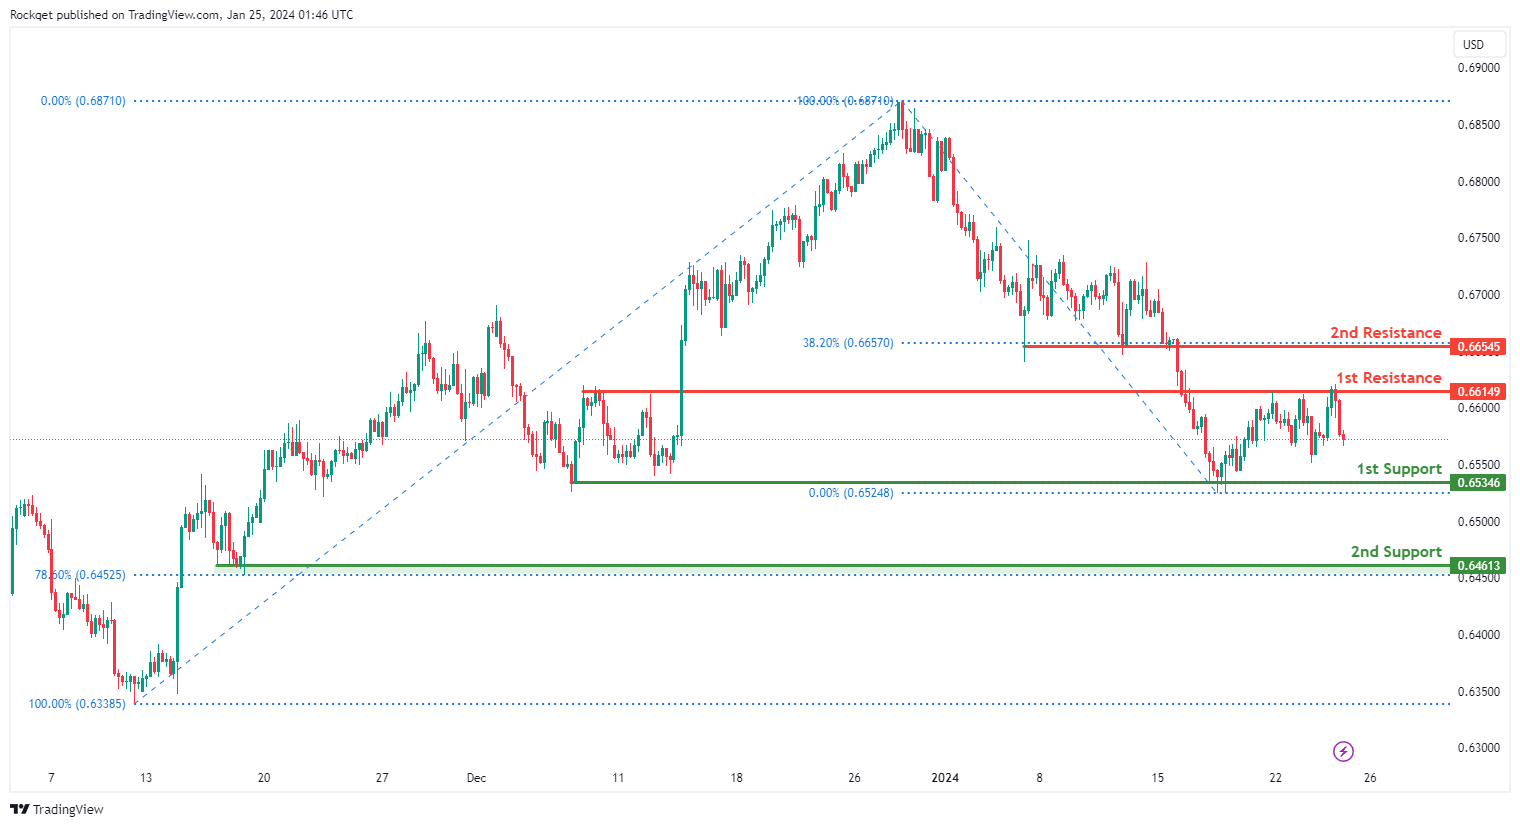
AUD/USD:
The AUD/USD chart currently exhibits an overall bearish momentum. In this context, there is a potential scenario for price to drop towards the 1st support.
The 1st support level at 0.6534 is identified as a pullback support. Further below, the 2nd support level at 0.6461 is also marked as a pullback support that aligns close to the 78.60% Fibonacci retracement level, further reinforcing its importance as a key support level.
To the upside, the 1st resistance level at 0.6614 is identified as a pullback resistance. Higher up, the 2nd resistance level at 0.6654 is also noted as a pullback resistance that aligns with the 38.20% Fibonacci retracement level, suggesting a potential barrier for further upside movement.
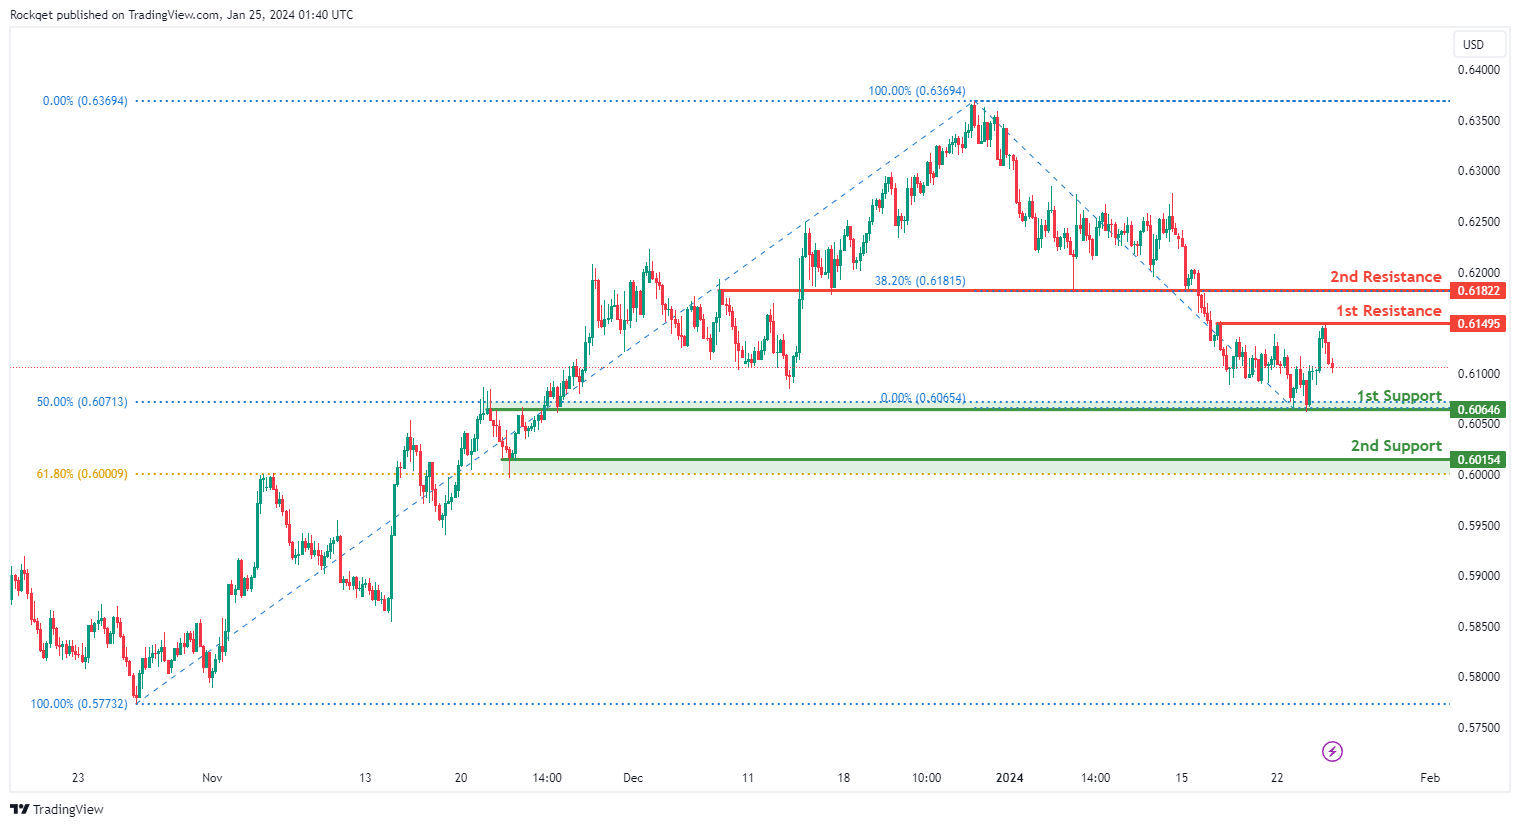
NZD/USD
The NZD/USD chart currently exhibits an overall bearish momentum. In this context, there is a potential scenario for price to drop towards the 1st support.
The 1st support level at 0.6064 is identified as an overlap support that aligns close to the 50.00% Fibonacci retracement level. Further below, the 2nd support level at 0.6015 is marked as a pullback support that aligns close to the 61.80% Fibonacci retracement level, further reinforcing its importance as a key support level.
To the upside, the 1st resistance level at 0.6149 is identified as a pullback resistance. Higher up, the 2nd resistance level at 0.6182 is noted as an overlap resistance that aligns with the 38.20% Fibonacci retracement level, suggesting a potential barrier for further upside movement.
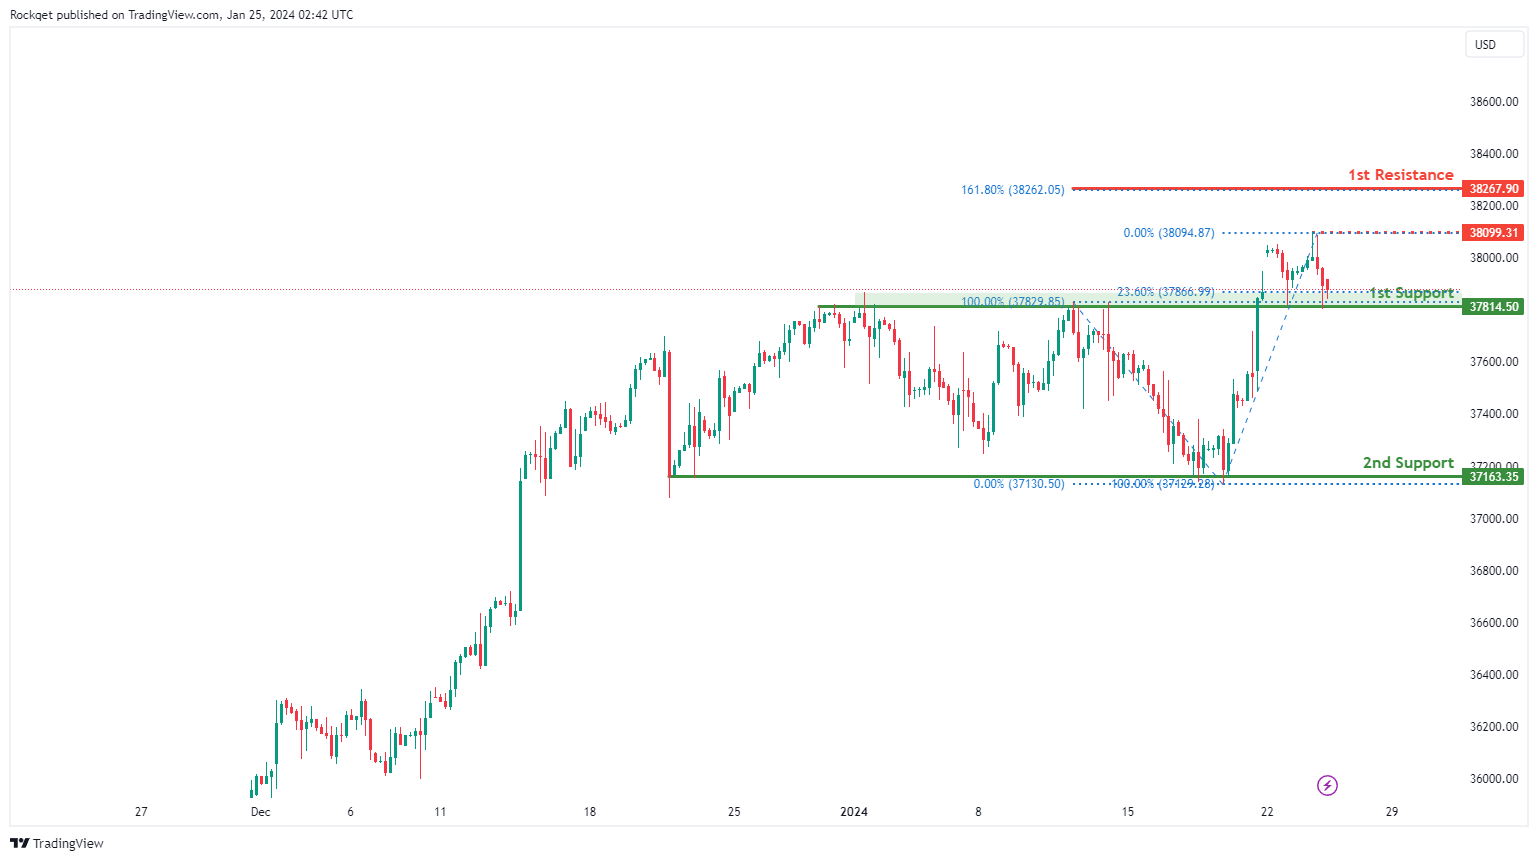
DJ30:
The DJ30 (Dow Jones Industrial Average) chart currently exhibits a bearish overall momentum, indicating a prevailing downward trend. In this market scenario, the price is anticipated to potentially continue its bearish movement towards the 1st support.
The 1st support at 37814.50 is considered favorable for several reasons. Firstly, it is identified as an overlap support, representing a historical level where buying interest has previously emerged. Additionally, this support level coincides with the 23.60% Fibonacci Retracement, further strengthening its significance.
The 2nd support at 37163.35 is recognized as a multi-swing low support, providing additional reinforcement to the potential support zone.
On the resistance side, the intermediate resistance at 38099.31 is highlighted as a level where swing high resistance is observed. This level may pose a challenge to the bearish momentum.
Furthermore, the 1st resistance at 38267.90 is identified as the 161.80% Fibonacci Extension, adding confluence to its potential as a resistance level.
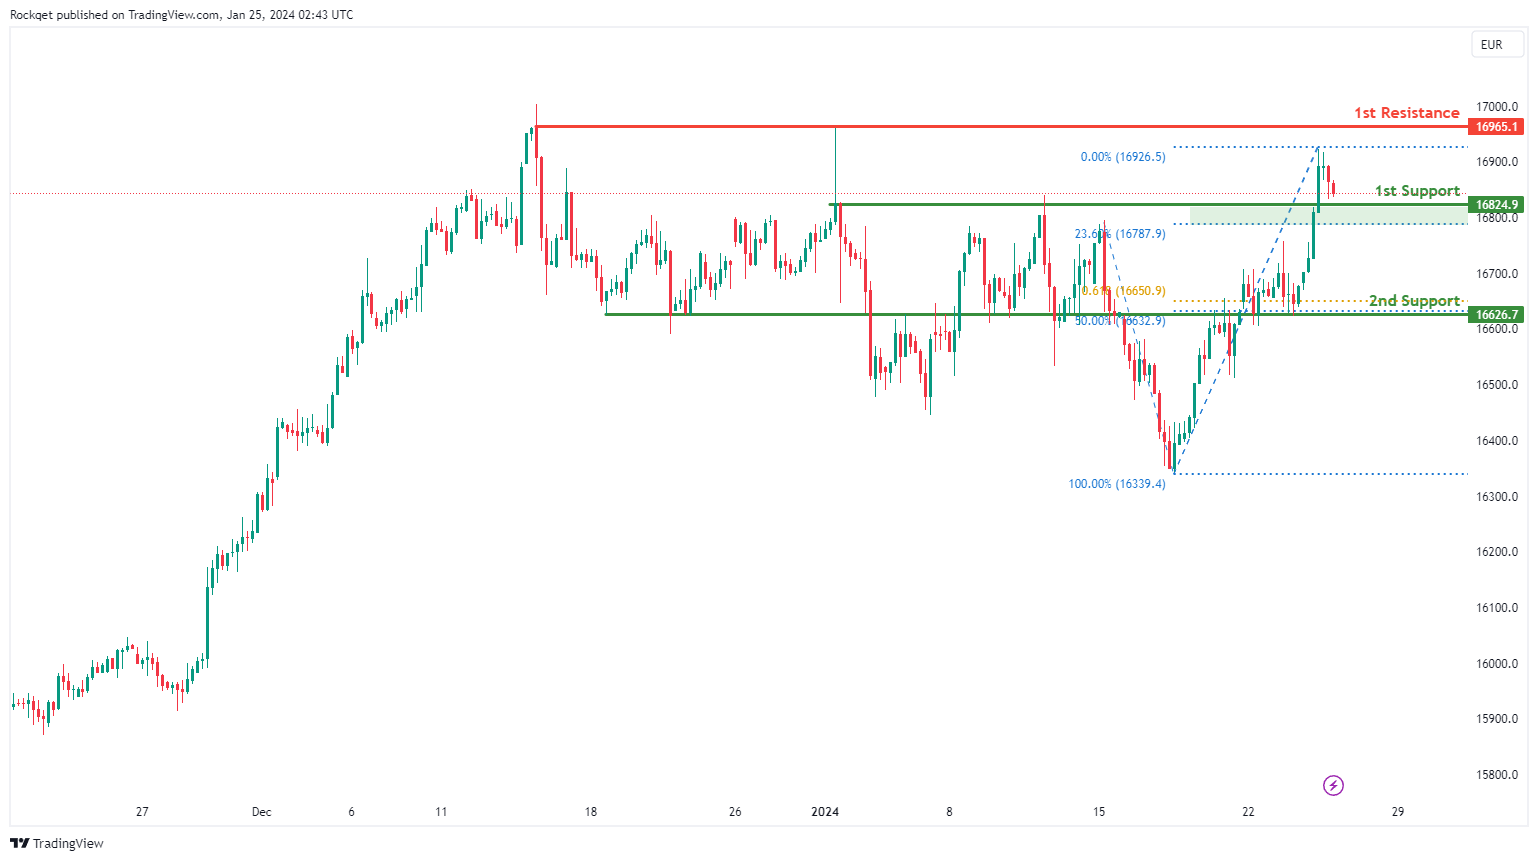
GER40:
The GER40 (DAX) chart currently exhibits a bearish overall momentum, indicating a prevailing downward trend. Several factors contribute to this bearish momentum, suggesting potential downward movement in the price.
The 1st support at 16824.90 is considered favorable for several reasons. Firstly, it is identified as a pullback support, indicating a historical level where buying interest has previously emerged. Additionally, this support level aligns with the 23.60% Fibonacci Retracement, adding confluence to its significance.
The 2nd support at 16626.70 is recognized as a multi-swing low support, providing additional strength to the potential support zone. Furthermore, it coincides with the 50% Fibonacci Retracement and the 61.80% Fibonacci Projection, further reinforcing its importance.
On the resistance side, the 1st resistance at 16965.10 is highlighted as a swing high resistance. This level may act as a barrier to the bearish momentum.
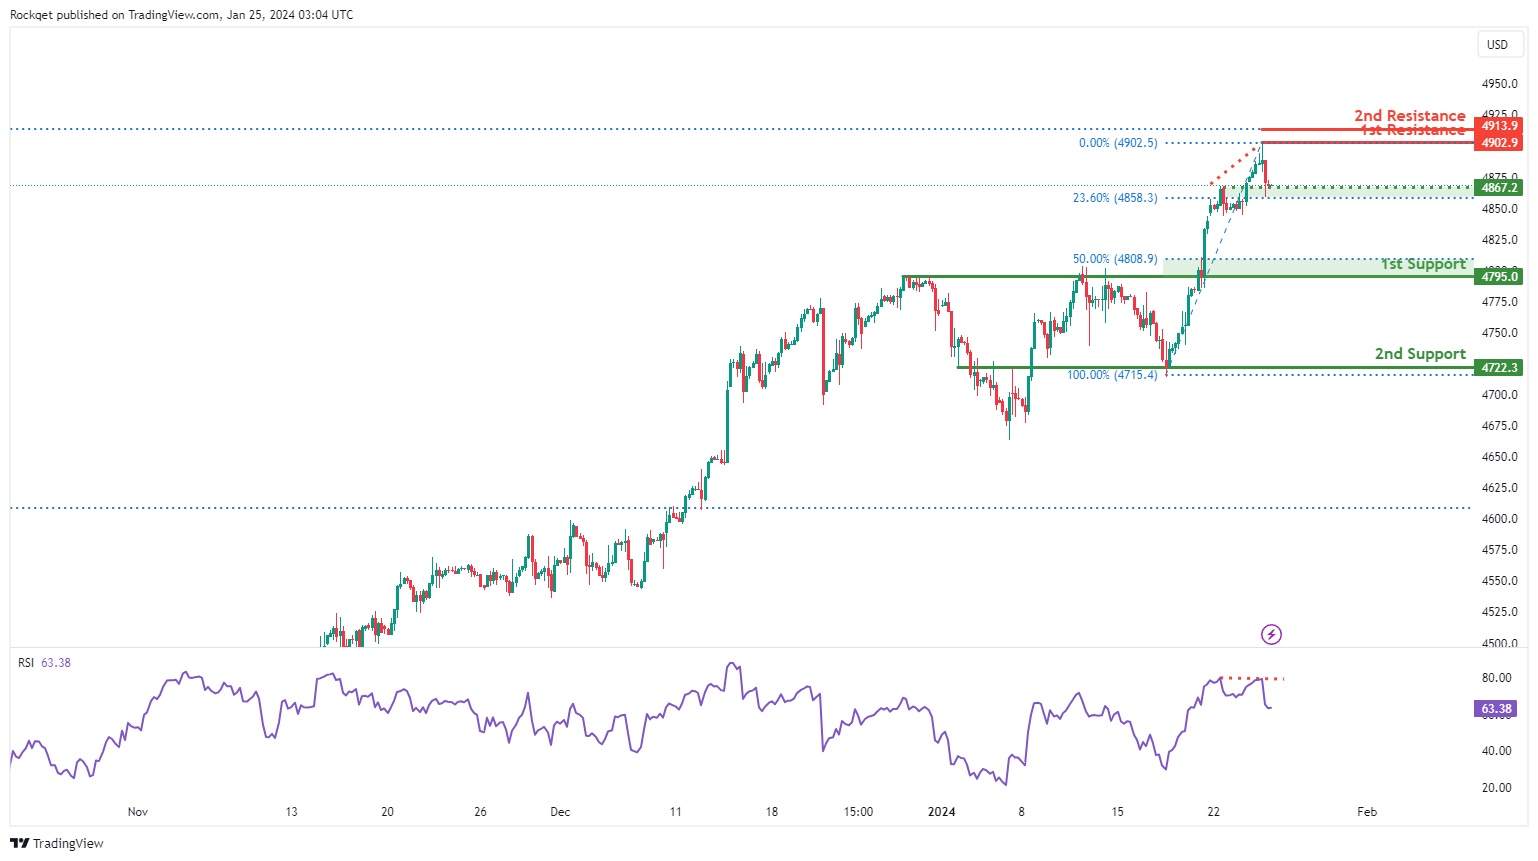
US500:
The US500 (S&P 500) chart currently portrays a bearish overall momentum, signaling a prevailing downward trend. Various factors contribute to this bearish sentiment, hinting at potential further declines in the price.
The 1st support at 4795.0 holds significance for several reasons. Firstly, it serves as a pullback support, representing a historical level where buying interest has previously emerged. Additionally, this support level aligns harmoniously with the 50% Fibonacci Retracement, enhancing its overall significance.
The 2nd support at 4722.3 is identified as an overlap support, adding robustness to the potential support zone.
Intermediate support at 4867.2 is characterized by its nature as an overlap support and its alignment with the 23.60% Fibonacci Retracement. This confluence reinforces the importance of this support level.
On the resistance levels, the 1st resistance at 4902.9 stands out as a swing high resistance, potentially acting as a barrier to the bearish momentum.
The 2nd resistance at 4913.9 corresponds to the 161.80% Fibonacci Extension, adding an additional layer of significance to the potential resistance zone.
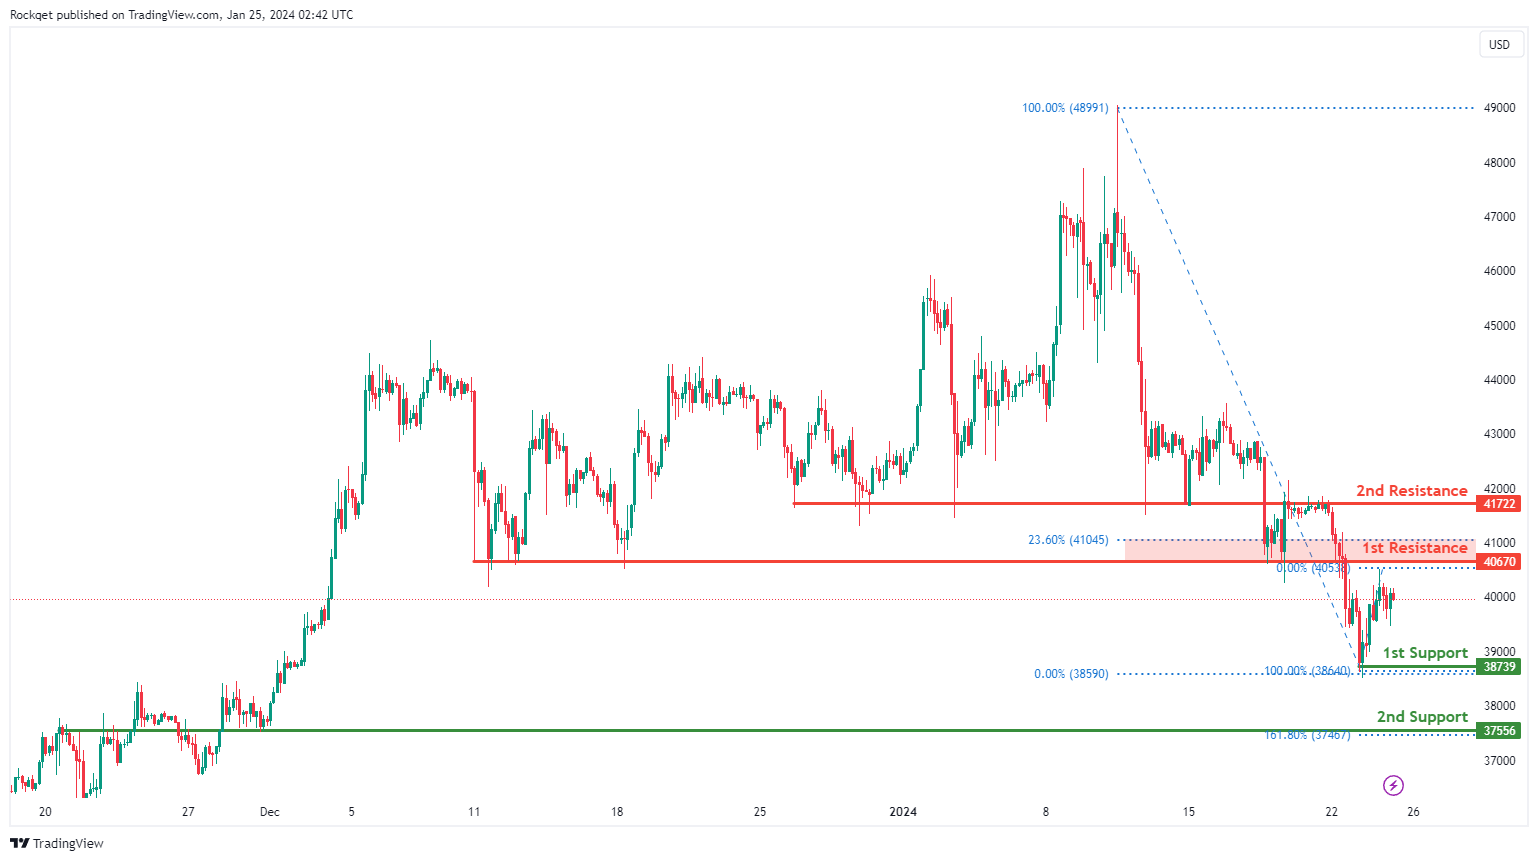
BTC/USD:
The BTC/USD chart currently reflects a weak bullish overall momentum with low confidence, indicating a tentative upward trend. Several factors contribute to this weak bullish sentiment, suggesting the potential for cautious upward movement in the price.
The 1st support at 38739 is considered favorable due to its identification as a swing low support, representing a historical level where buying interest has previously emerged.
Additionally, the 2nd support at 37556 is recognized as an overlap support, and it aligns with the 161.80% Fibonacci Extension, providing added strength to the support zone.
On the resistance side, the 1st resistance at 40670 is noteworthy for the presence of an overlap resistance and the 23.60% Fibonacci Retracement. This confluence adds significance to the potential resistance level, making it a crucial area to watch.
Furthermore, the 2nd resistance at 41722 is acknowledged as an overlap resistance, further reinforcing its importance.
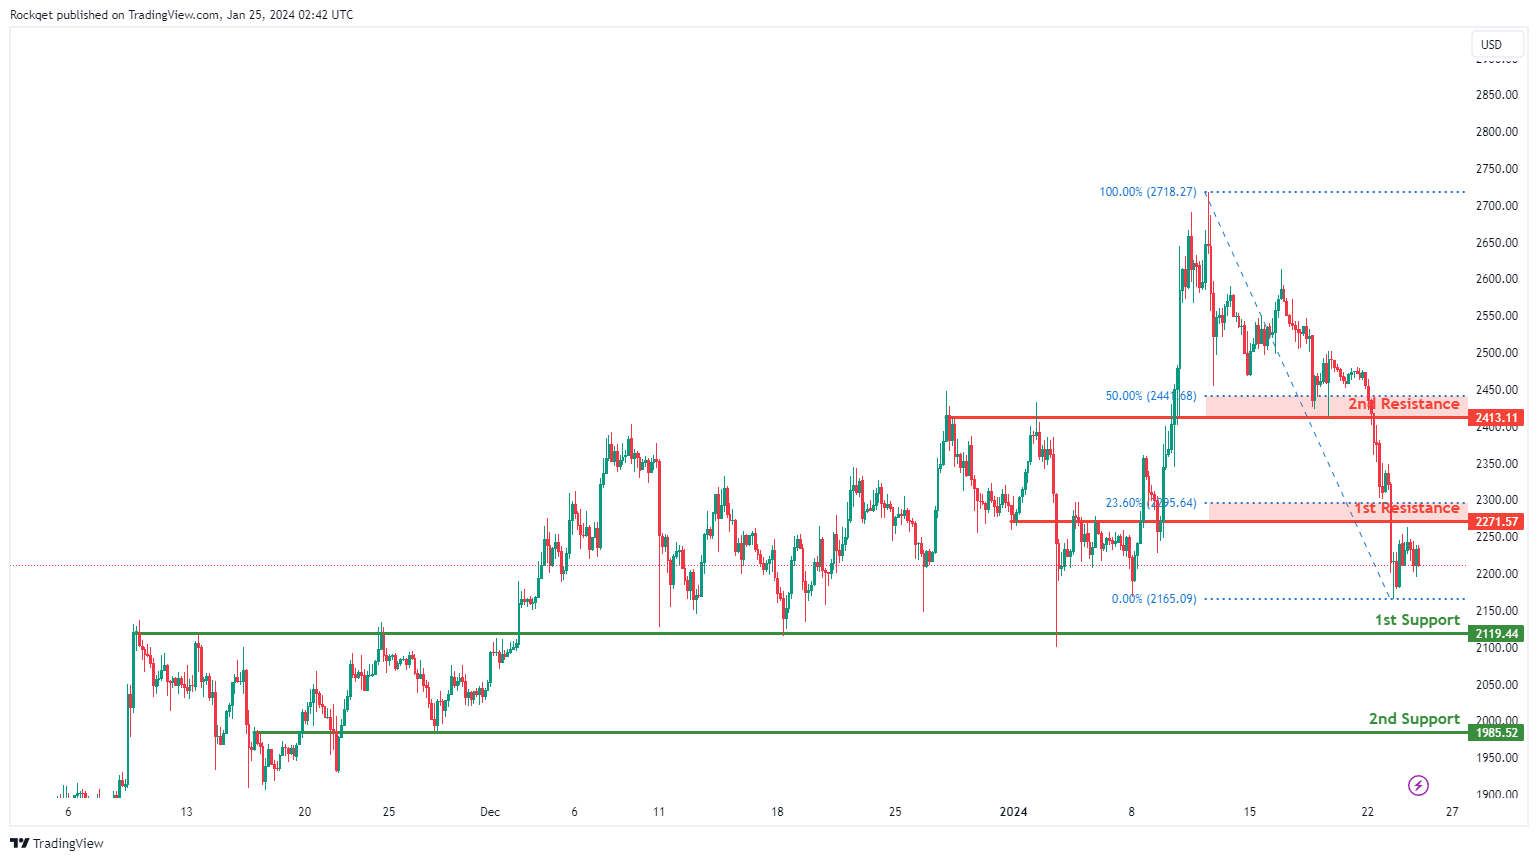
ETH/USD:
The ETH/USD chart currently demonstrates a neutral overall momentum, indicating a lack of a clear trend direction. The market sentiment suggests that the price could potentially experience fluctuations between the 1st resistance and 1st support levels.
The 1st support at 2119.44 is considered a significant level for several reasons. Firstly, it is identified as an overlap support, signifying a historical area where buying interest has previously emerged.
Additionally, the 2nd support at 1985.52 is recognized as another overlap support, adding further strength to the potential support zone.
On the resistance side, the 1st resistance at 2271.57 is noteworthy for the presence of an overlap resistance and the 23.60% Fibonacci Retracement. This confluence adds significance to the potential resistance level, making it a key area to monitor.
Furthermore, the 2nd resistance at 2413.11 is acknowledged as an overlap resistance, further reinforcing its importance.
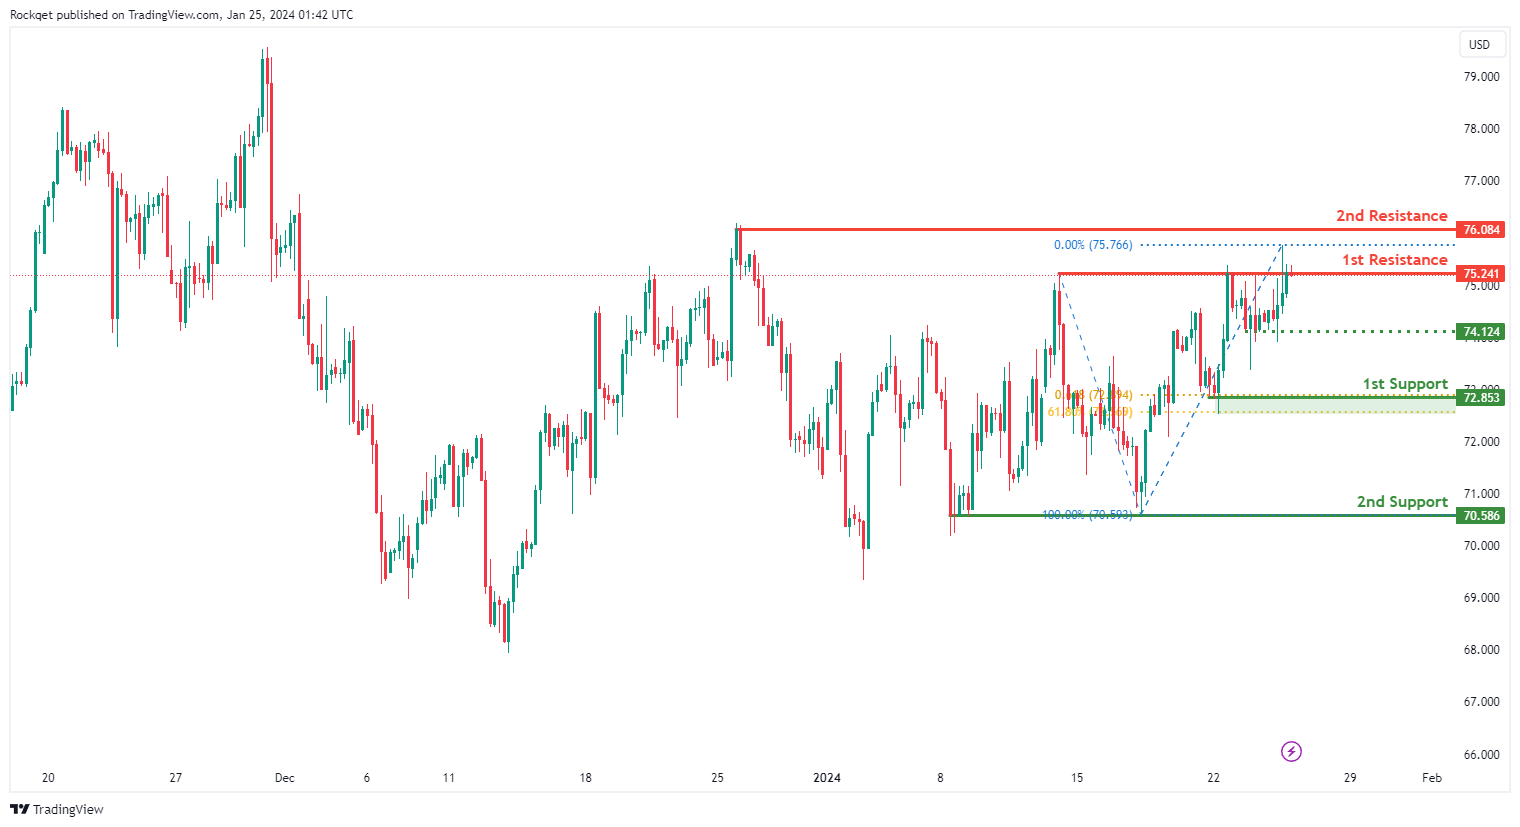
WTI/USD:
The WTI (West Texas Intermediate) chart currently exhibits a neutral bias. In this context, there is a potential scenario for price to fluctuate between the 1st resistance and the 1st support.
The 1st resistance level at 75.24 is identified as a pullback resistance. Higher up, the 2nd resistance level at 76.08 is also noted as a swing-high resistance, suggesting a potential barrier for further upside movement.
To the downside, the intermediate support level at 74.12 is identified as a pullback support while the 1st support level at 72.85 is noted as a pullback support that aligns with a confluence of Fibonacci levels i.e. the 61.8% retracement and the 61.80% projection. Further below, the 2nd support level at 70.58 is marked as a pullback support, further reinforcing its importance as a key support level.
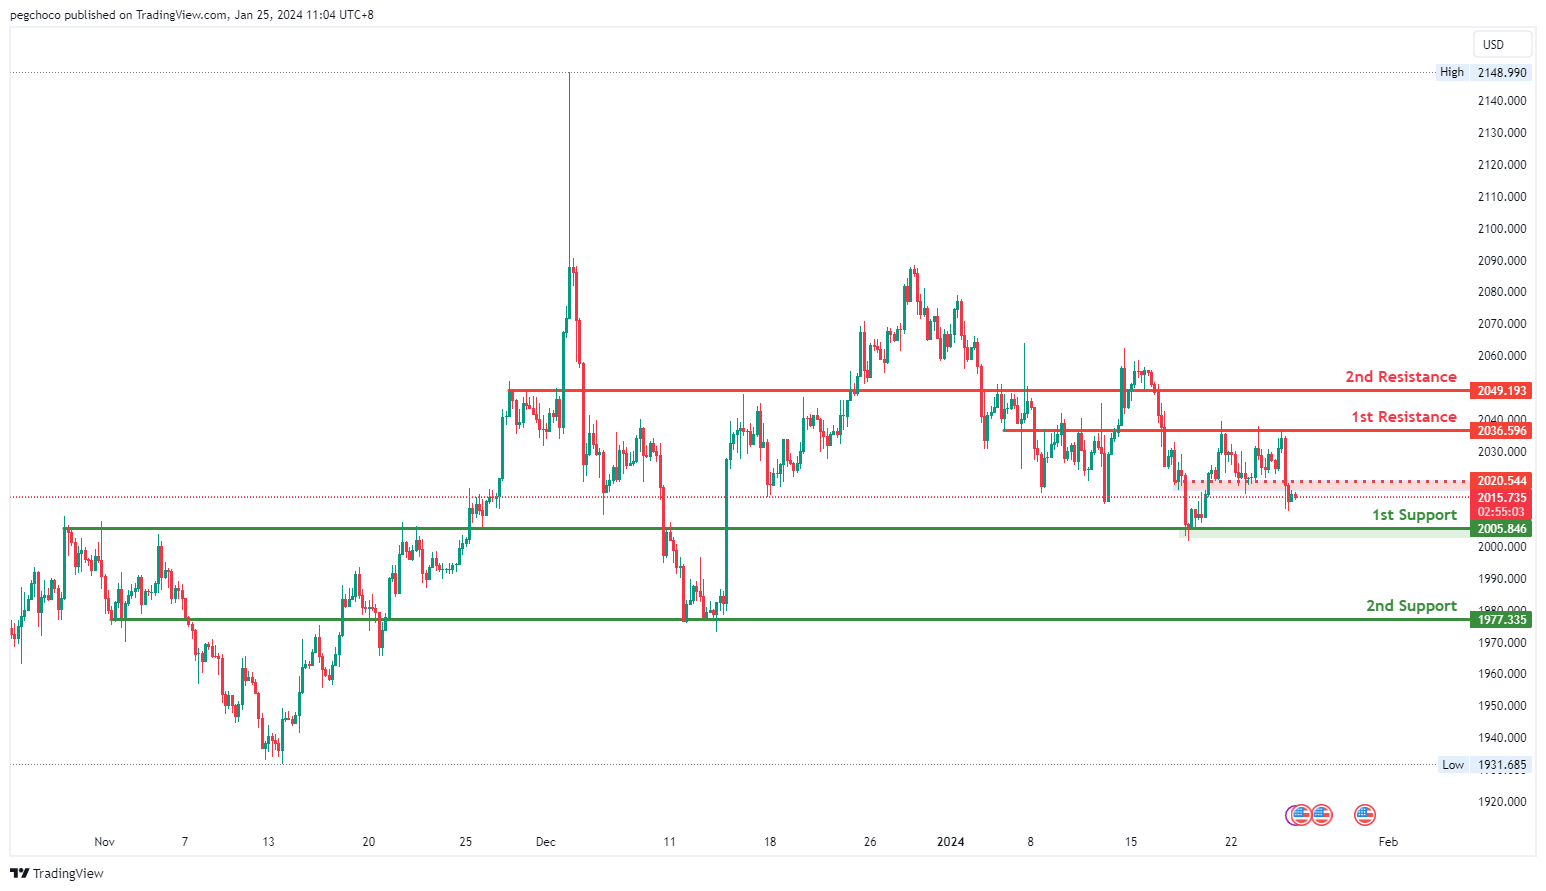
XAU/USD (GOLD):
The XAUUSD (Gold/US Dollar) chart is currently demonstrating a bearish overall momentum, indicating weakness in the price of gold. Your analysis suggests that there is potential for a bearish continuation in the price towards the 1st support level.
The 1st support level at 2005.84 is considered significant as it represents an overlap support and coincides with the 161.80% Fibonacci Extension level. This confluence of factors adds further significance to this support zone, suggesting it may serve as a strong area where price could potentially find support during a bearish move.
The 2nd support level at 1977.33 is identified as an overlap support, reinforcing its importance as a level where price has previously found both support and resistance.
On the resistance side, the 1st resistance level at 2036.59 is recognized as an overlap resistance, indicating that this price level has historically served as both support and resistance. This makes it a potential barrier where selling pressure could emerge.
The 2nd resistance level at 2049.19 is characterized as a pullback resistance, suggesting that it might act as a notable resistance point during price pullbacks.
ECB to stand pat, await Lagarde’s take on rate cut and economic outlook
ECB is widely expected to keep monetary policy unchanged today. Main refinancing rate will be held at 4.50%, and deposit rate at 4.00%. Given the lack of significant new data since the December meeting, it's improbable that ECB will offer fresh policy directions. Instead, it's expected that the market will have to await March meeting, which will include new economic projections, for any substantial updates.
President Christine Lagarde is likely to continue her stance against the speculation of imminent rate cuts. It is anticipated that she will emphasize the persistence of underlying price pressures, especially in the services sector, and highlight the various risks still in play. These risks range from impending wage negotiations to geopolitical tensions, such as the ongoing Red Sea blockade.
However, the tone adopted by Lagarde regarding the Eurozone's economic condition will be scrutinized closely. Recent economic data, including this week's PMIs suggests that Eurozone might be already in a recession in the last quarter and is witnessing a sluggish start to the new year. Should President Lagarde express heightened concern over the economic situation, it could potentially trigger market participants to increase their bets on an earlier rate cut.
EUR/CHF's deep retreat this week suggests initial rejection by 55 D EMA (now at 0.9447). Deeper pull back is now mildly in favor as long as 0.9471 holds, towards 0.9252 low. But a break there is not envisaged at this point. Meanwhile, break of 0.9471 will resume the rebound, as a correction to whole down trend from 1.0095, to 38.2% retracement of 1.0095 to 0.9252 at 0.9574.
US Q4 GDP in spotlight: A test for S&P 500 amid profit taking
Financial markets are keenly focused on US GDP data today. Analysts expect GDP to grow at an annualized rate of 2.0% in Q4, marking a slowdown from the previous quarter's 4.9%, and reaching the lowest rate since Q2 of 2022. This anticipated reading would align with the notion that the US economy, while experiencing a rapid cooling, remains resilient. A key component under scrutiny is the performance of consumption growth, which has been a significant support for the economy.
Notable profit taking was seen in the US stock markets after initial rally overnight. S&P 500 closed up just 0.08% at 4868.55, after climbing to 4903.68. Technically, there is prospect of a prolonged near-term consolidation given that SPX has just met 100% projection of 3808.86 to 4607.07 from 4103.78 at 4901.99.
Break of 55 H EMA (now at 4828.70) could trigger deeper correction towards 4682.11 support, which is slightly above 55 D EMA (now at 4658.15), and set the range for sideway consolidations.
Nevertheless, another rally, as supported by strong GDP data today, and sustained trading above 4901.99 would set the stage for a take on 5000 psychological level quickly.
Cliff Notes: Labour Demand and Investment Under Pressure
Key insights from the week that was.
In Australia, the latest NAB business survey delivered another sombre update on the state of the domestic economy at the turn of the year – the “December” survey was in the field January 3-15. In an environment characterised by high inflation, elevated interest rates and weak consumer spending, business conditions declined a further 2pts to +7 as trading conditions slipped below average. Forward orders point to persistent weakness having contracted in seven of the past eight months. Business confidence meanwhile continues to oscillate at well below-average levels, currently –1.
As discussed in our analysis of the NAB survey, last week’s December labour force survey reported that businesses reduced hours worked by 1.3% in the second half of 2023, on par with Australia’s GFC experience. Conditions as measured by the NAB survey are likely to result in a further decline in hours and a throttling back of business investment. These outcomes are consistent with Westpac’s expectation that Australian GDP growth will remain below trend throughout 2024.
On a more positive note, the NAB survey reported a continued easing in cost and price pressures through the final months of the year. Final product price inflation is now tracking at a 0.9%qtr pace according to the survey, the softest pace since February 2021. In line with these developments and a benign read for Q4 inflation in New Zealand, Westpac confirmed its forecast for next week's Australian Q4 CPI at 0.8%qtr/4.3%yr for headline inflation and 0.9%qtr/4.4%yr for the trimmed mean.
Continued progress with inflation in 2024 and soft economic momentum should allow the RBA to commence rate cuts in Q3 2024, with 125bps of rate cuts from Q3 2024 to Q3 2025 to leave the cash rate at 3.10% by end-2025. A return to trend GDP growth in 2025 remains our baseline expectation.
Offshore, central banks remained cautious on near-term risks, but showed increasing confidence in achieving their medium-term objectives.
The Bank of Japan maintained its policy stance in January. Updates to GDP growth for fiscal 2023 and 2024 were minimal, FY2023’s slight downward revision offset by a modest upgrade to FY2024. Forecasts for core inflation (less fresh food and energy) were broadly the same as October, the BoJ still anticipating this measure of inflation will moderate to 1.9%yr by 2025. The BoJ also continue to expect inflation expectations to drift up and prompt stronger growth in wages and consequently consumption into the medium term. Risks to this view are most prominent near term. Results from the spring wage negotiations will be available through March/April and the BoJ’s take presented in the March statement.
The Bank of Canada kept rates steady at its January meeting despite December’s upside inflation surprise. Shelter inflation remains high and is expected to show further persistence, keeping CPI above the 3%yr top of the target range during H1 2024. In the accompanying press statement, Governor Tiff Macklem did not ‘rule out’ further policy rate increases, with inflation expectations and persistence in wage growth risks to their sanguine baseline view. However, in the absence of an unexpected resurgence in inflation, in coming months discussion will focus on how much longer rates need to remain on hold. The revised forecasts were supportive of moderate policy easing from mid-to-late 2024. GDP is expected to remain weak in 2024 then return near trend in 2025. Inflation meanwhile is seen back at 2.0%yr in 2025.
In Europe, the ECB’s Bank Lending Survey showed that demand for loans continued to decline across both households and firms in Q4 2023, the consequence of high inflation and interest rates as well as a decline in fixed asset investment. Expectations for Q1 2024 were constructive, with net demand expected to increase in Q1 2024 for the first time since 2022. However, banks remain very cautious on the outlook, risk perceptions seeing credit conditions become more restrictive in the quarter, and a further tightening anticipated in Q1 2024. 2023’s rate hikes and their consequences are clearly still transmitting through the economy.
Coming back to China. Overnight, the PBoC announced a 50bp cut to banks’ Reserve Requirement Ratio, freeing up lending capacity. This follows reports of support for the equity market via buying by large government-linked entities. The intent behind these measures is principally to buoy, or at least hold up, sentiment across the economy while the benefits of rapid growth in high-tech manufacturing permeate and the cost of structural reform in the property sector is worked through. Authorities are likely to continue their targeted approach to supporting the economy through 2024, assuming 2023’s gains in manufacturing, infrastructure and trade continue.
Still to come offshore are the European Central Bank’s January meeting and, in the US, Q4 GDP and December PCE data, with the inflation print the market’s primary focus.
XAUUSD: Traders Await Breakout
Gold prices, currently near $2,030, saw a modest decrease of 1% over the past week and a 2% dip since the start of 2024. Meanwhile, silver surpassed $22 per ounce, experiencing a 4% drop in the week and a 6.5% decline in the year so far. Upcoming scrutiny of economic data, particularly the Q4 US GDP report on Thursday, will influence metal markets. Projections indicate a 2.4% growth, potentially allowing the Federal Reserve to maintain higher US interest rates amidst economic flexibility.
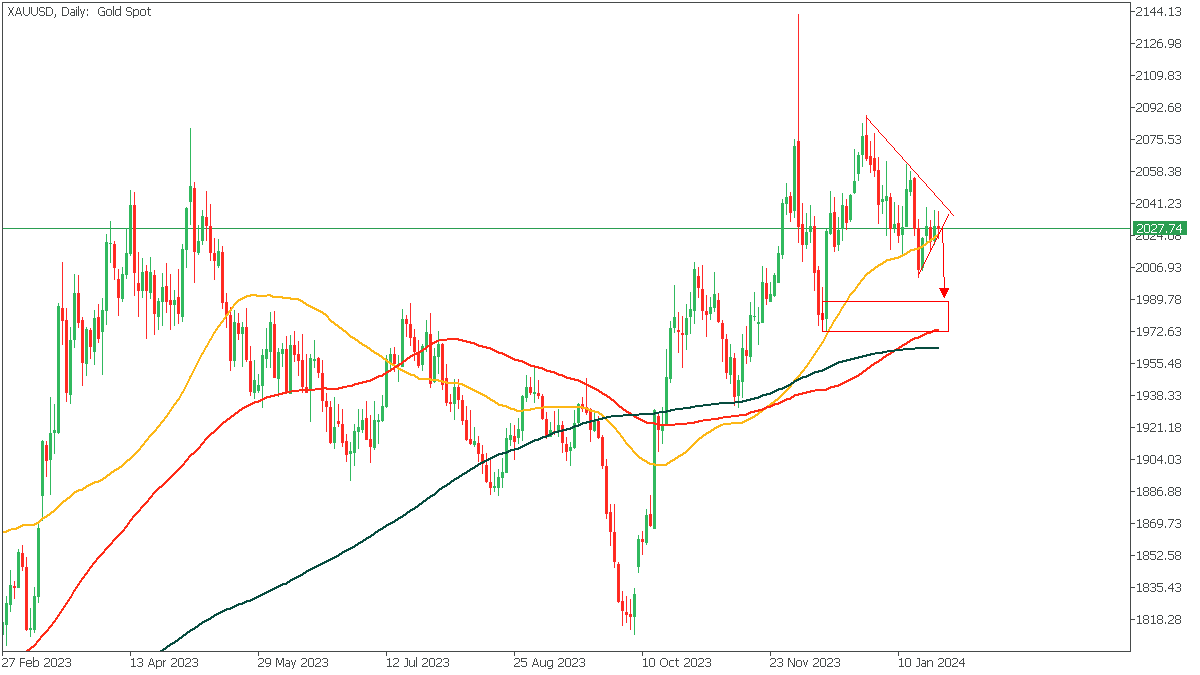
XAUUSD - D1 Timeframe
The overall market structure on the Daily timeframe of XAUUSD appears to be largely bullish, however, since price failed to create a higher high before the onset of the retracement, I think that we may get to see a new lower low being formed. The 100-day moving average is my target.
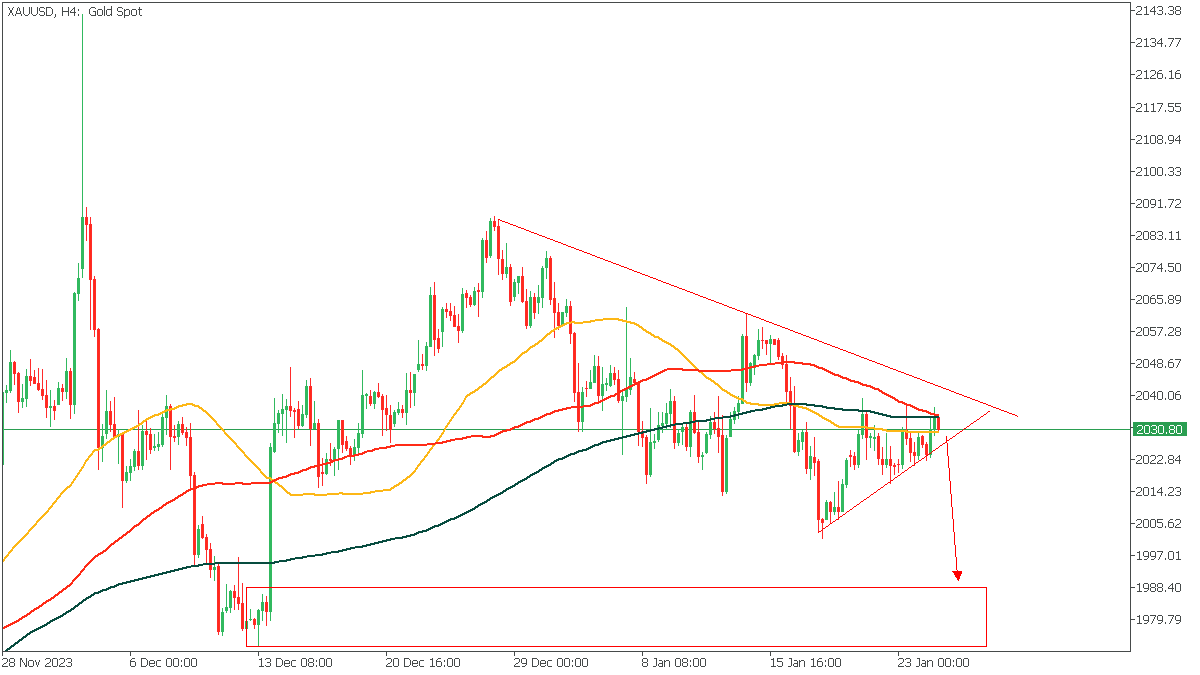
XAUUSD - H4 Timeframe
On the 4-hour timeframe of XAUUSD, price is set to break out of the wedge pattern. I expect price to break out lower since the three moving averages converge together to form a united resistance level whilst maintaining their bearish array. Overall, I will wait for the breakout of the trendline in other to position properly for a short entry.
Analyst’s Expectations:
- Direction: Bearish
- Target: $1997.55
- Invalidation: $2037.14
CONCLUSION
The trading of CFDs comes at a risk. Thus, to succeed, you have to manage risks properly. To avoid costly mistakes while you look to trade these opportunities, be sure to do your due diligence and manage your risk appropriately.
EURUSD Displays Volatility in Advent of First ECB Meeting of 2024
Tomorrow marks a poignant day for those observing the European economy as the European Central Bank is scheduled to hold its first monetary policy meeting of this year.
The European Union's central bank has continued to maintain a conservative approach in recent months, rather similar to that of the Bank of England and the Federal Reserve; however, perhaps it could be suggested that the European Central Bank has been a bit less aggressive with its interest rate rises than those of the United Kingdom and the United States over the past two years.
Tomorrow's meeting is being widely anticipated by financial markets participants as the first European Central Bank meeting in which a pause or potential reduction in interest rates could be announced, along with possible timescales relating to any such reduction if such a move is on the table.
Just one day before the meeting takes place, it is clear that some analysts within investment banks and fund managers are considering that the deposit rate will remain at 4.0% within European Union member states, and the general consensus among market participants to hint toward reductions of approximately 50 basis points in June and more than 125 base points during the course of the latter part of 2024.
In this regard, all ears will be focused on tomorrow's meeting.
In terms of currency price movements in the advent of this important economic policy-related event concerning the second most important major currency in the world, there has been a degree of volatility during the early hours of trading today.
It is not necessarily clear as to what has caused this. However, the US dollar's strong position in the light of the stellar performances of the stocks of some major publicly-listed companies included in prestigious indices is one factor alluding to the favourable position of the US economy overall despite the inflation, high interest rates and bank demises that have made high profile news over the past two years.
Therefore, a good US position rather than a weak European position may be a factor. However, there are some industrial concerns relating to potential supply chain issues due to the geopolitical situation in the Red Sea, which has caused many firms to cancel cargo ship operations transporting items through that major shipping route.
Indicative pricing only
Today, the EURUSD pair began the morning in the European session by trading around the mid-1.08 range, according to the FXOpen price chart, which is quite a difference from the 1.11 mark that the pair traded on December 28. Moving into 2024, the EURUSD has been experiencing an overall downward direction. Therefore, tomorrow's monetary policy meeting may provide further insight and clarity on the euro's medium-term position.
This article represents the opinion of the Companies operating under the FXOpen brand only. It is not to be construed as an offer, solicitation, or recommendation with respect to products and services provided by the Companies operating under the FXOpen brand, nor is it to be considered financial advice.
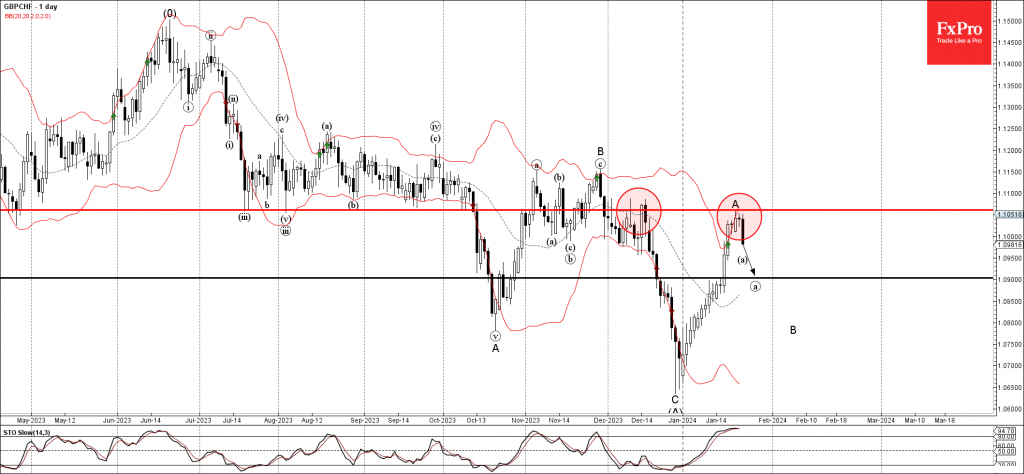
GBPCHF Wave Analysis
- GBPCHF falling inside minor impulse wave a
- Likely to fall to support level 1.0900
GBPCHF continues to fall inside the minor impulse wave a of the B-wave which started earlier from the key resistance level 1.1060 (which reversed the pair multiple times in December).
The resistance level 1.1060 was further strengthened by the upper daily Bollinger Band.
Given the strength of the active downtrend and the overbought daily Stochastic, GBPCHF currency pair can be expected to fall further to the next support level 1.0900 (target for the completion of the active wave a).
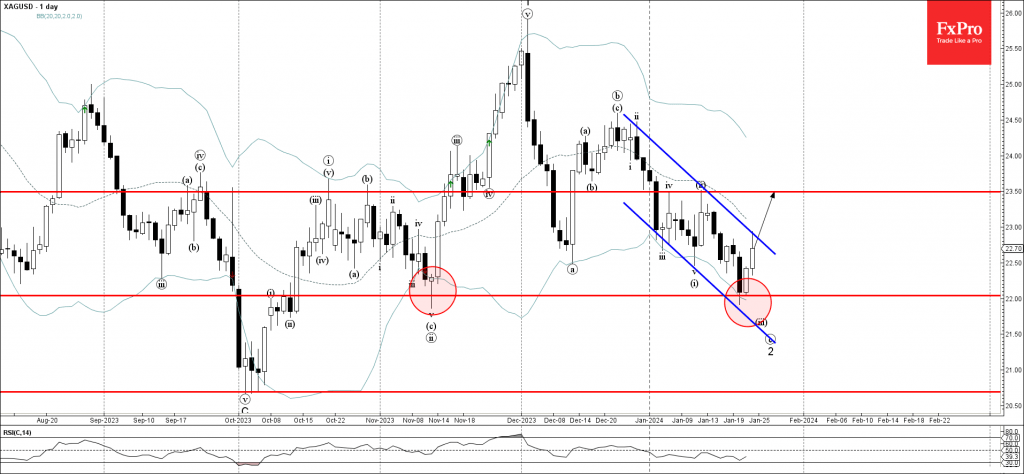
Silver Wave Analysis
- Silver reversed from support level 22.00
- Likely to rise to resistance level 23.500
Silver recently reversed up from the key support level 22.00 (which reversed the daily Morning Star in November as can be seen below).
The support level 22.00 was strengthened by the lower daily Bollinger Band and by the support trendline of the daily down channel from December.
Silver can be expected to rise further to the next resistance level 23.500 (top of the previous correction is and ii).