Sample Category Title
Forex Markets Steady with Stabilized Sentiment, Aussie’s Recovery Dampened by Job Data
The forex market displayed relative tranquility in Asian session, with major currencies confined to tight ranges. This subdued atmosphere reflects a degree of stabilization in investor sentiment, mirrored in the performance of major Asian stock indexes which are either experiencing mild recoveries or registering only slight losses. A notable exception to this picture is China's Shanghai SSE, which is extending its recent decline. This persistent downturn in the Chinese market is fueled by deep-rooted pessimism about the economy after this week's economic data, and subdued expectations for any significant stimulus measures from the government.
In addition, broader investor sentiment is also showing signs of change, particularly in response to the evolving expectation of major central banks on interest rate cuts. There's a growing realization among investors that rate cuts might not occur as early or as rapidly as previously anticipated, dampening some of the earlier optimism in the markets.
Dollar, although seeing a slight retreat, continues to hold its position as the strongest currency for the week. Euro follows as the second strongest currency, bolstered by a chorus of comments from ECB officials who have pushed back against expectations of aggressive monetary easing. Sterling ranks as the third strongest, continues to ride on yesterday's CPI data, and it may have the potential to surpass the Euro, especially if tomorrow's UK retail sales data proves supportive. Conversely, Swiss Franc is lagging among European currencies, impacted by SNB President Thomas Jordan's warnings about the real appreciation of Franc and its negative impact on the Swiss economy.
Japanese Yen is lingering at the bottom, with New Zealand Dollar and Australian Dollar also underperforming. Aussie's recovery is being capped by poor job data, though the significant job loss in December might be attributable to a change in hiring patterns in the last quarter only, as noted by the ABS. Canadian Dollar, on the other hand, is faring relatively better among commodity currencies, supported by CPI data released earlier in the week.
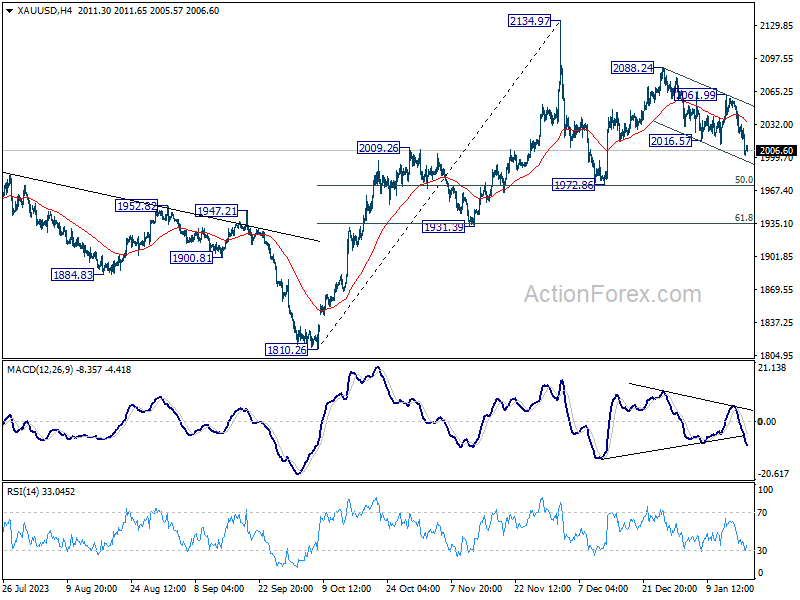
Technically Gold's fall from 2088.24 resumed on Dollar strength, and it's now eyeing 2000 psychological support. Current development argues that price actions from 2134.97 spike is correcting whole rise from 1810.26, with decline from 2088.24 as the third leg. Deeper fall is expected as long as 55 4H EMA (now at 2036.57) holds, to 1972.86 cluster support (50% retracement of 1810.26 to 2134.97 at 1972.61. Firm break there will target 1931.39 cluster (61.8% retracement at 1934.29) next.
In Asia, at the time of writing, Nikkei is down -0.10%. Hong Kong HSI is up 0.23%. China Shanghai SSE is down -1.94%. Singapore Strait Times is down -0.38%. Japan 10-year JGB yield is up 0.0356 at 0.644. Overnight, DOW fell-0.25%. S&P 500 fell -0.56%. NASDAQ fell -0.59%. 10-year yield rose 0.040 to 4.106.
Fed's Beige Book: Widespread signs of slowing job market
Fed's Beige Book noted a majority of the 12 Districts observed "little to no change in economic activity". Of the districts that reported varying trends, three experienced "modest growth", while one district encountered a "moderate decline".
The Beige Book also noted positive consumer activity during the holiday season. Most districts met retail expectations, with three districts exceeding them.
In terms of employment, the report presents a mixed picture. Seven districts reported "little or no net change" in employment levels, while four districts experienced "modest to moderate" job growth. Importantly, "nearly all districts" cited signs of a "cooling labor market", signaling a potential shift or slowdown in hiring and employment growth across the country.
Price dynamics also varied among the districts. Six districts noted "slight or modest price increases", and two reported "moderate increases". Five districts observed that the rate of price increases had "subsided" somewhat compared to the previous period. Three other districts did not report any significant change in price pressures.
Australia's employment drops by 65.1K in Dec, following two months of robust growth
Australia had an unexpected contraction in employment in December, with a decrease of -65.1k jobs, significantly deviating from expectation of 15.4k. This decline was marked by a substantial drop in full-time employment by -106.6k, which was only partially offset by 41.4k increase in part-time jobs.
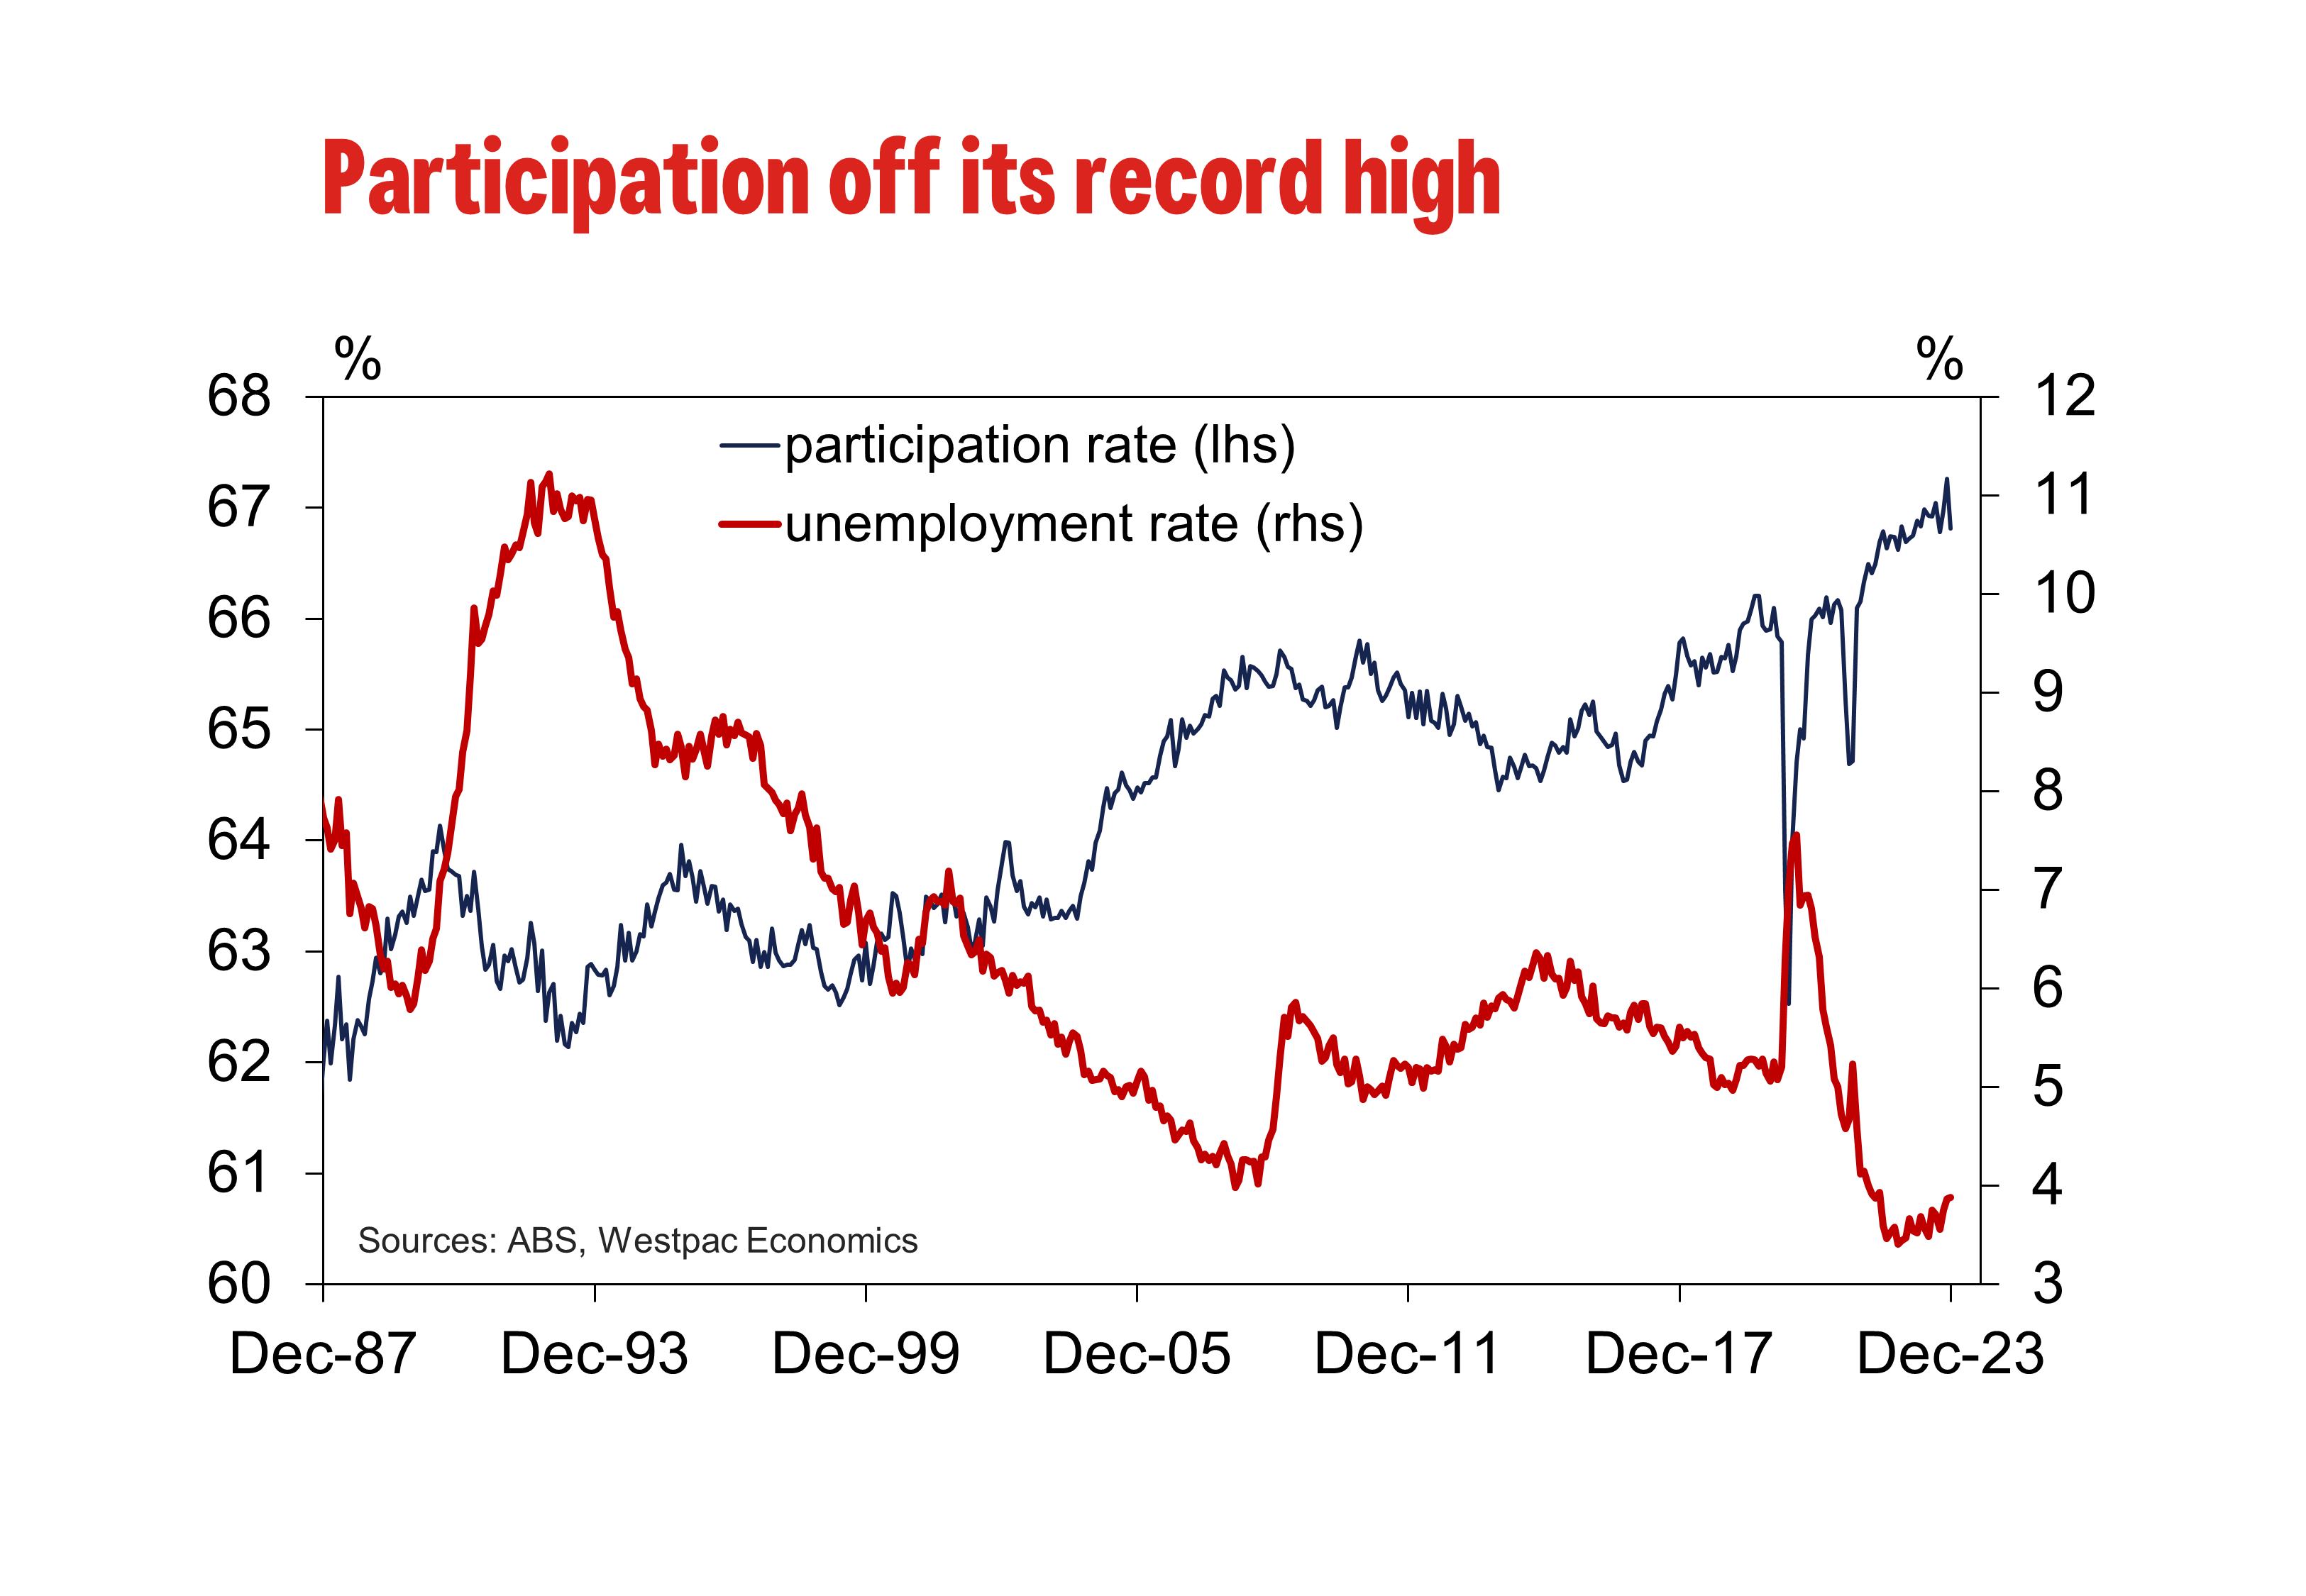
Despite this downturn in job creation, unemployment rate remained steady at 3.9%, aligning with expectations. Participation rate declined -0.4% to 66.8%. Additionally, there was -0.5% mom decrease in the total monthly hours worked.
David Taylor, ABS head of labour statistics, noted combined strong growth of 117k in October and November, and the fall in large contraction in December, "reflected changes in the timing of employment growth in the last few months of 2023, compared with earlier years."
Over the past twelve months, employment grew an average of 32k. Also, both the unemployment and underemployment rates remained relatively low and the participation rate and employment-to-population ratio relatively high. Taylor noted that suggests "the labour market remains tight."
Japan's core machinery orders decline -4.9% mom in Nov
Japan's core private-sector machinery orders fell notably by -4.9% mom in November, significantly below expectation of -0.8% mom. This decline marks the first downturn in three months and points to a potential slowdown in business investment. On a year-on-year basis, core machinery orders decreased -4.0% yoy, falling short of the anticipated 0.2% yoy increase.
The Japanese government has maintained its assessment that machinery orders have "stalled" for 13 consecutive months. This continued stagnation in machinery orders is particularly concerning as they are often regarded as a leading indicator of capital spending over the next six to nine months. The implication is that businesses might be exercising caution in their investment decisions, possibly due to uncertainty in the economic outlook or other external factors impacting their spending plans.
Breaking down the orders by sector, manufacturing industry saw substantial reduction in orders, with -7.8% mom drop. Service sector also recorded a slip in orders, down -0.4% mom.
Looking ahead
ECB's meeting account is the main focus in Euroepan session. Later in the day, US will release jobless claims, building permits and housing starts, Philly Fed survey.
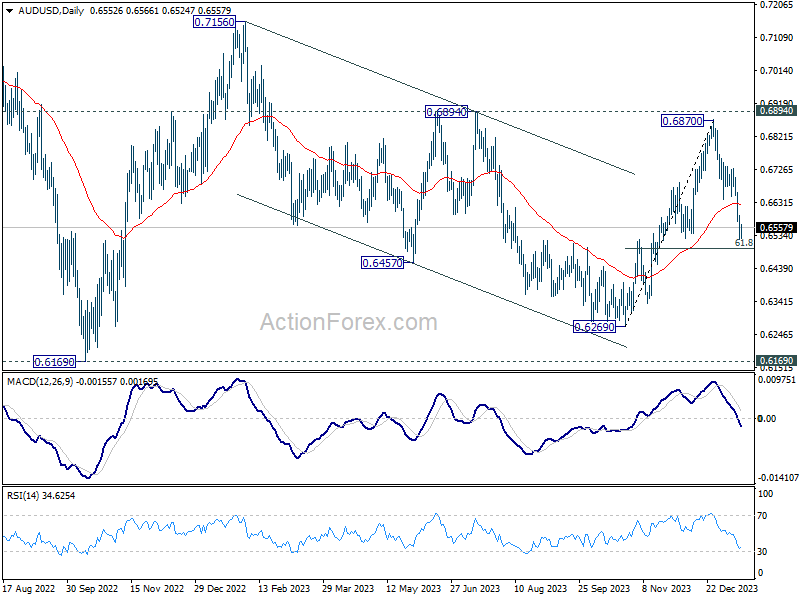
AUD/USD Daily Report
Daily Pivots: (S1) 0.6520; (P) 0.6557; (R1) 0.6590; More...
Intraday bias in AUD/USD remains on the downside at this point. Current fall from 0.6870 should target 61.8% retracement of 0.6269 to 0.6870 at 0.6497. Sustained break there will argue that whole rebound from 0.6269 has completed, and bring deeper fall to this support. On the upside, above 0.6594 minor resistance will turn intraday bias neutral first.
In the bigger picture, price actions from 0.6169 (2022 low) are seen as a medium term corrective pattern to the down trend from 0.8006 (2021 high). Sideway trading could continue in range of 0.6169/7156 for some more time. But as long as 0.7156 holds, an eventual downside breakout would be mildly in favor.
Economic Indicators Update
| GMT | Ccy | Events | Actual | Forecast | Previous | Revised |
|---|---|---|---|---|---|---|
| 23:50 | JPY | Machinery Orders M/M Nov | -4.90% | -0.80% | 0.70% | |
| 00:00 | AUD | Consumer Inflation Expectations Jan | 4.50% | 4.50% | ||
| 00:01 | GBP | RICS Housing Price Balance Dec | -30% | -43% | -41% | |
| 00:30 | AUD | Employment Change Dec | -65.1K | 15.4K | 61.5K | 72.6K |
| 00:30 | AUD | Unemployment Rate Dec | 3.90% | 3.90% | 3.90% | |
| 04:30 | JPY | Industrial Production M/M Nov F | -0.90% | -0.90% | -0.90% | |
| 09:00 | EUR | Eurozone Current Account (EUR) Nov | 30.9B | 33.8B | ||
| 12:30 | EUR | ECB Monetary Policy Meeting Accounts | ||||
| 13:30 | USD | Initial Jobless Claims (Jan 12) | 207K | 202K | ||
| 13:30 | USD | Housing Starts Dec | 1.43M | 1.56M | ||
| 13:30 | USD | Building Permits Dec | 1.47M | 1.47M | ||
| 13:30 | USD | Philadelphia Fed Manufacturing Survey Jan | -6.9 | -10.5 | ||
| 15:30 | USD | Natural Gas Storage | -166B | -140B | ||
| 16:00 | USD | Crude Oil Inventories | -0.6M | 1.3M |
Technical Outlook and Review
DXY:
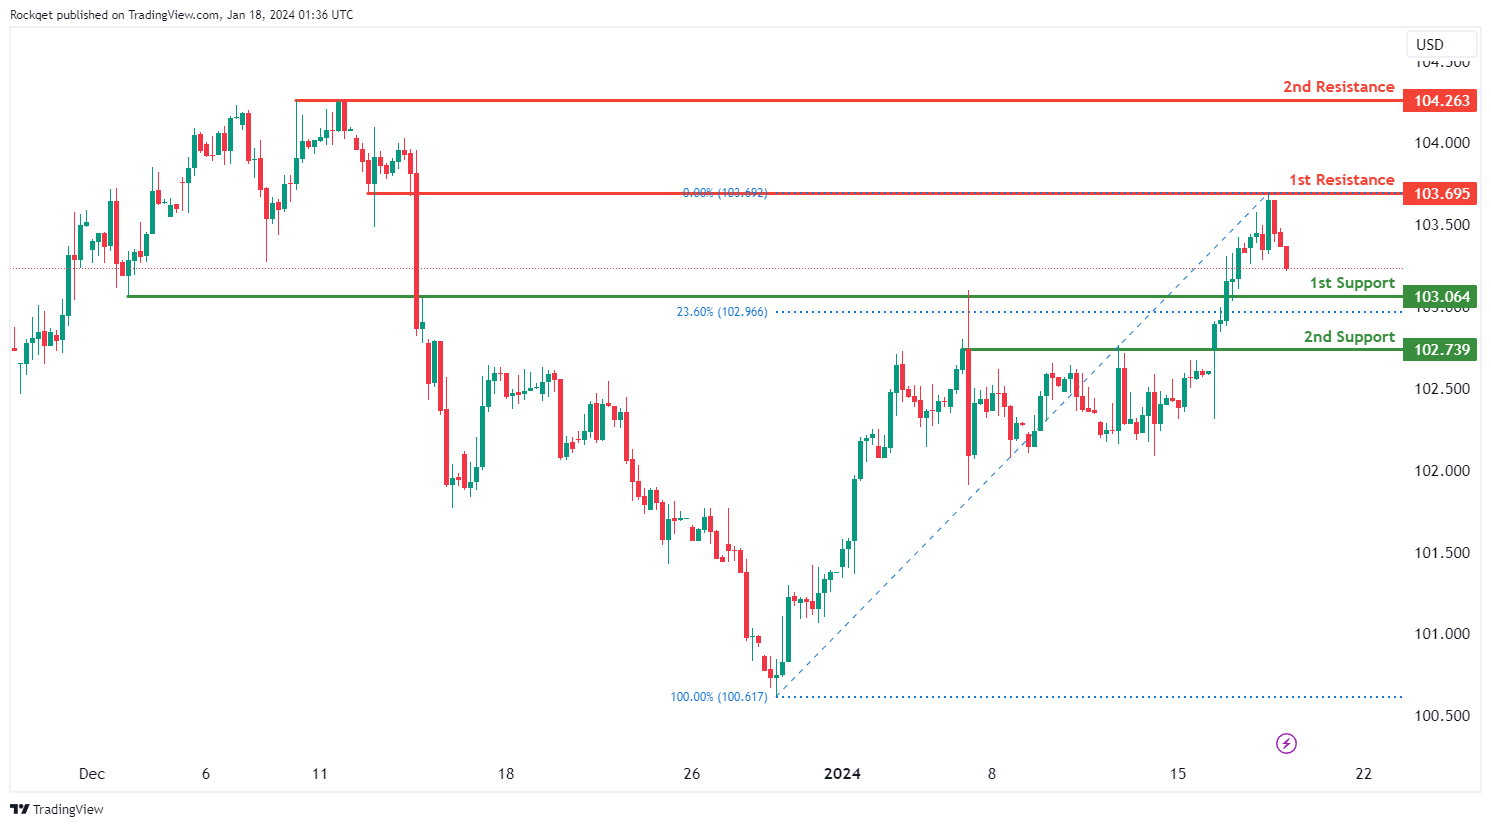
The DXY (US Dollar Index) chart currently exhibits an overall bullish momentum. However, there is a potential scenario for price to drop towards the 1st support before resuming the uptrend.
The 1st support level at 103.06 is identified as an overlap support that aligns close to the 23.60% Fibonacci retracement level. Further below, the 2nd support level at 102.73 is also marked as an overlap support, further reinforcing its importance as a key support level.
To the upside, the 1st resistance level at 103.69 is identified as an overlap resistance. Higher up, the 2nd resistance level at 104.26 is noted as a pullback resistance, further reinforcing its significance as a potential resistance zone.
EUR/USD:
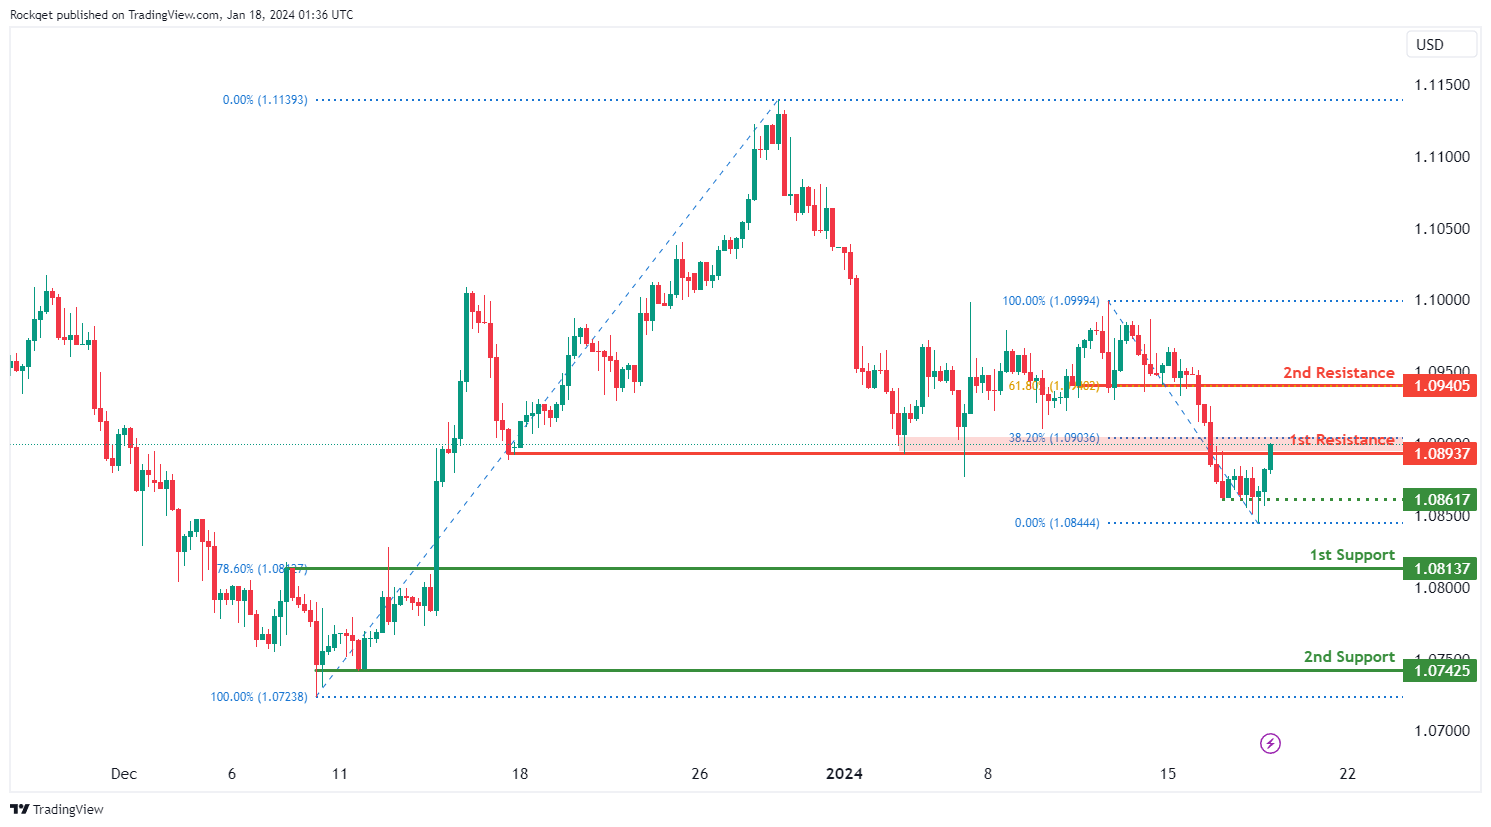
The EUR/USD chart currently exhibits an overall bearish momentum. However, there is a potential scenario for price to rise towards the 1st resistance before resuming the downtrend.
The 1st resistance level at 1.0893 is identified as a pullback resistance that aligns close to the 38.20% Fibonacci retracement level. Higher up, the 2nd resistance level at 1.0940 is also noted as a pullback resistance that aligns with the 61.80% Fibonacci retracement level, suggesting a potential barrier for further upside movement.
To the downside, the intermediate support level at 1.0861 is identified as a pullback support while the 1st support level at 1.0813 is also noted as a pullback support that aligns with the 78.60% Fibonacci retracement level. Further below, the 2nd support level at 1.0742 is marked as a swing-low support, further reinforcing its importance as a key support level.
EUR/JPY:
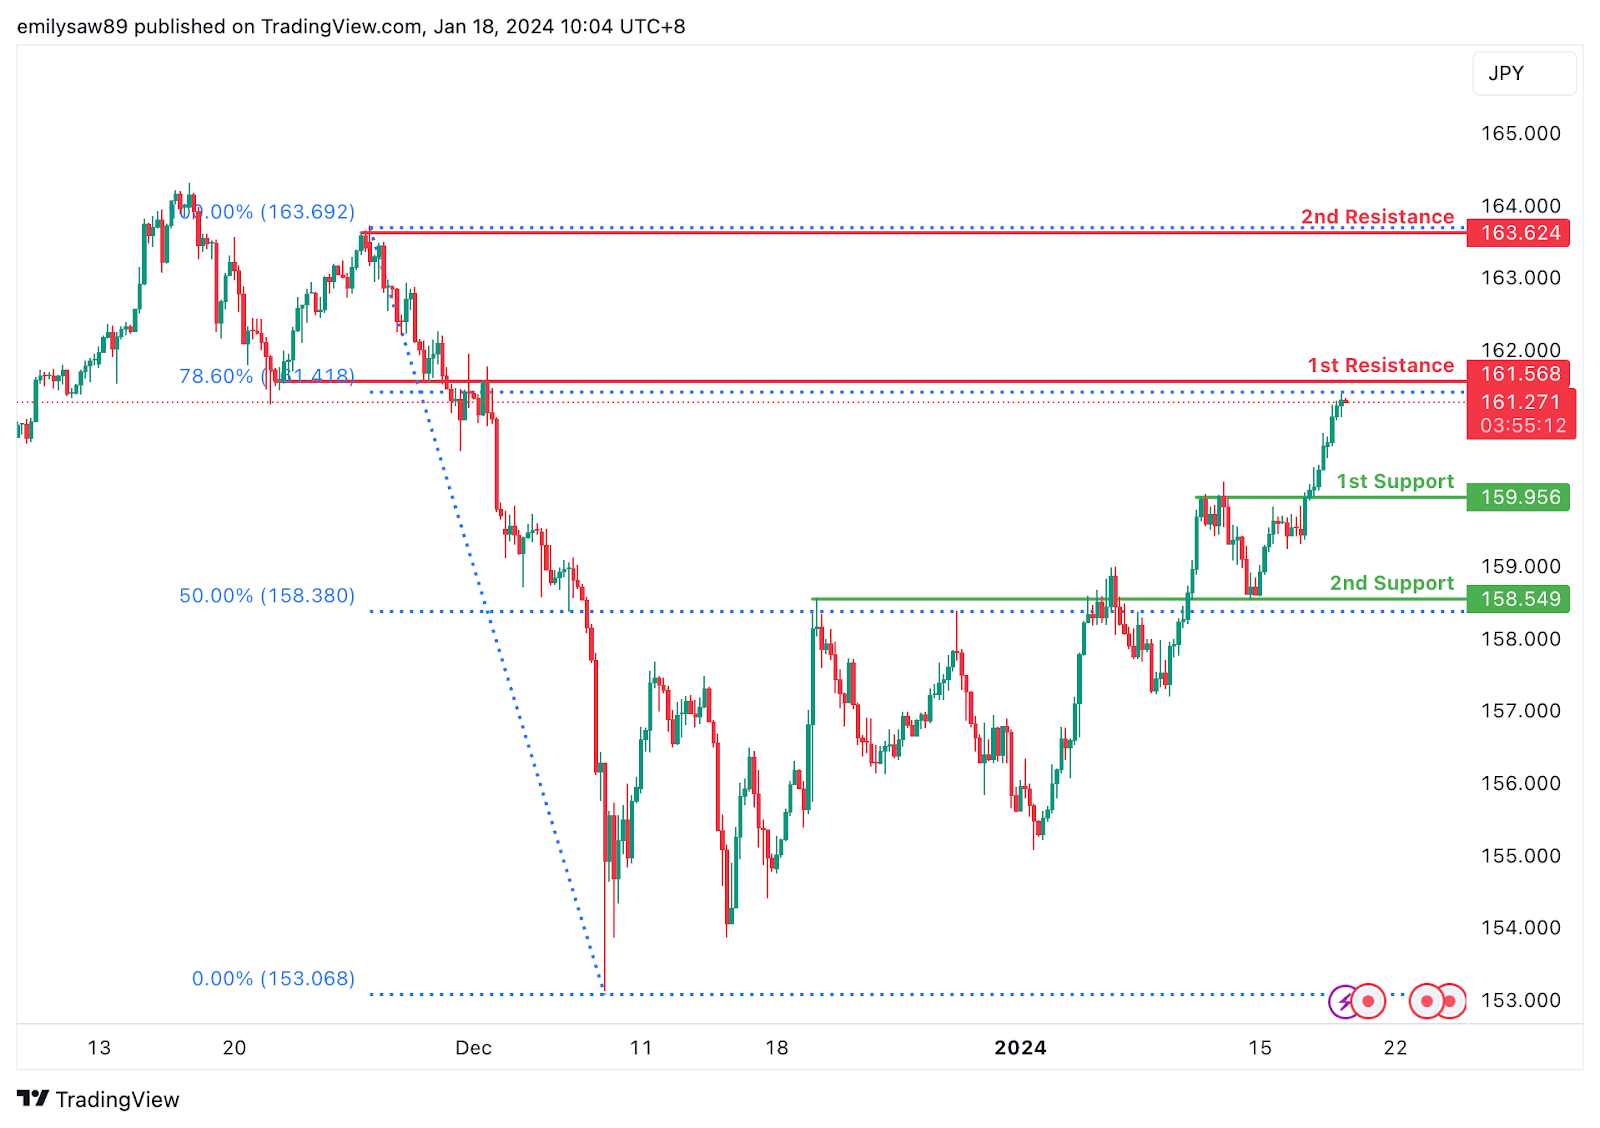
The EUR/JPY chart currently displays a bullish overall momentum, indicating a positive trend direction. There is a potential scenario where the price could make a bullish continuation towards the 1st resistance.
The 1st support at 159.96 is considered favourable as it is identified as a pullback support, suggesting historical significance as a level where buying interest has previously emerged. Additionally, the 2nd support at 158.55 is recognized as an overlap support, adding strength to the potential support zone.
On the resistance side, the 1st resistance at 161.57 is identified as an overlap resistance and aligns with the 78.60% Fibonacci Retracement. This confluence of technical factors adds strength to the potential resistance level. Furthermore, the 2nd resistance at 163.62 is acknowledged as a swing high resistance.
EUR/GBP:
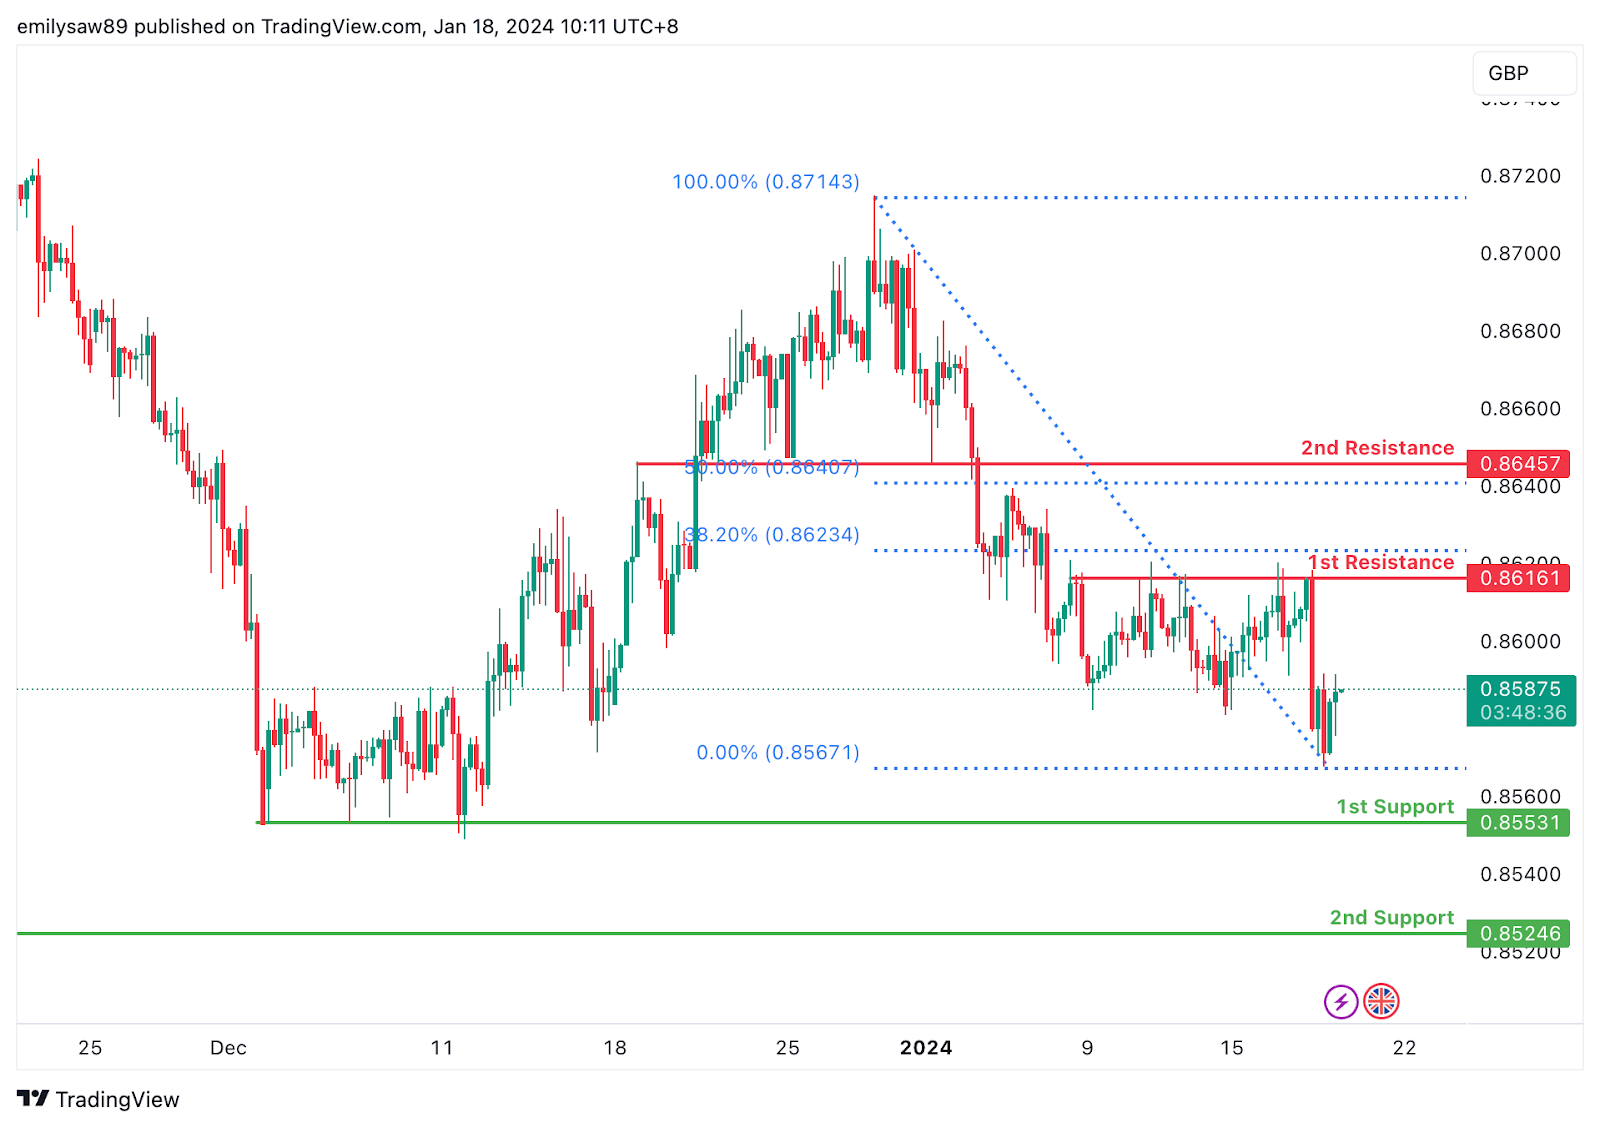
The EUR/GBP chart currently exhibits a weak bearish overall momentum, characterized by low confidence in the downward trend. Several factors contribute to this weak bearish momentum, and as a result, the price could potentially make a bearish continuation towards the 1st support.
The 1st support at 0.8553 is considered significant due to its identification as a multi-swing low support and coincides with the 78.60% Fibonacci Retracement, suggesting historical relevance as a level where buying interest has previously emerged. Additionally, the 2nd support at 0.8526 is recognized as a swing low support, providing additional strength to the potential support zone.
On the resistance side, the 1st resistance at 0.8616 is identified as a multi-swing high resistance and aligns with the 38.20% Fibonacci Retracement. This confluence of technical factors adds strength to the potential resistance level. Furthermore, the 2nd resistance at 0.8646 is acknowledged as an overlap resistance and corresponds to the 50% Fibonacci Retracement.
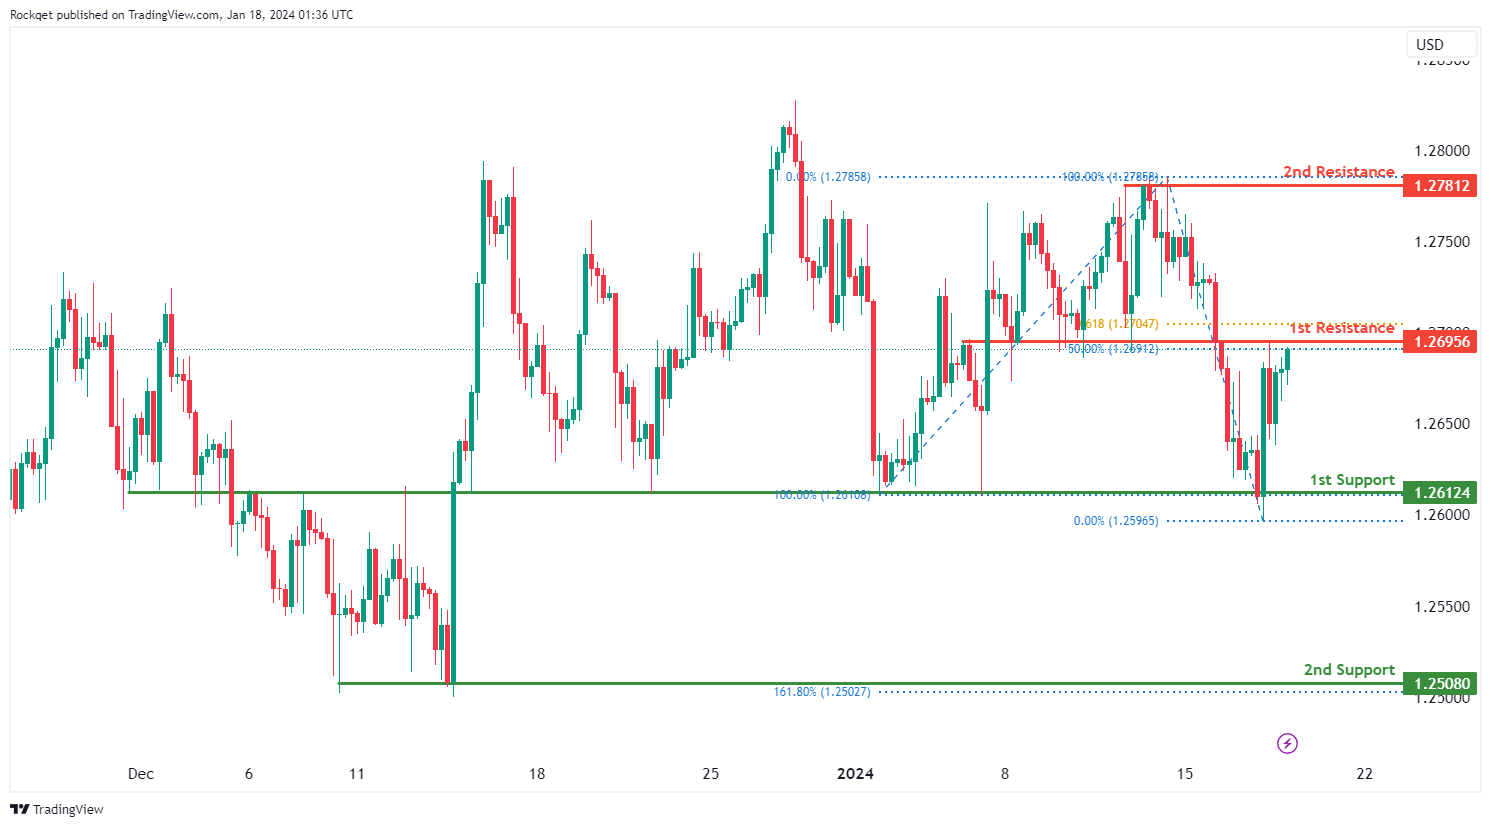
GBP/USD:
The GBP/USD chart currently exhibits an overall bearish momentum. However, there is a potential scenario for price to rise towards the 1st resistance before resuming the downtrend.
The 1st resistance level at 1.2695 is identified as an overlap resistance that aligns with a confluence of Fibonacci levels i.e. the 50.00% retracement and the 61.80% projection. Higher up, the 2nd resistance level at 1.2781 is noted as a swing-high resistance, suggesting a potential barrier for further upside movement.
To the downside, the 1st support level at 1.2612 is identified as an overlap support. Further below, the 2nd support level at 1.2508 is marked as a swing-low support that aligns with the 161.80% Fibonacci extension level, further reinforcing its importance as a key support level.
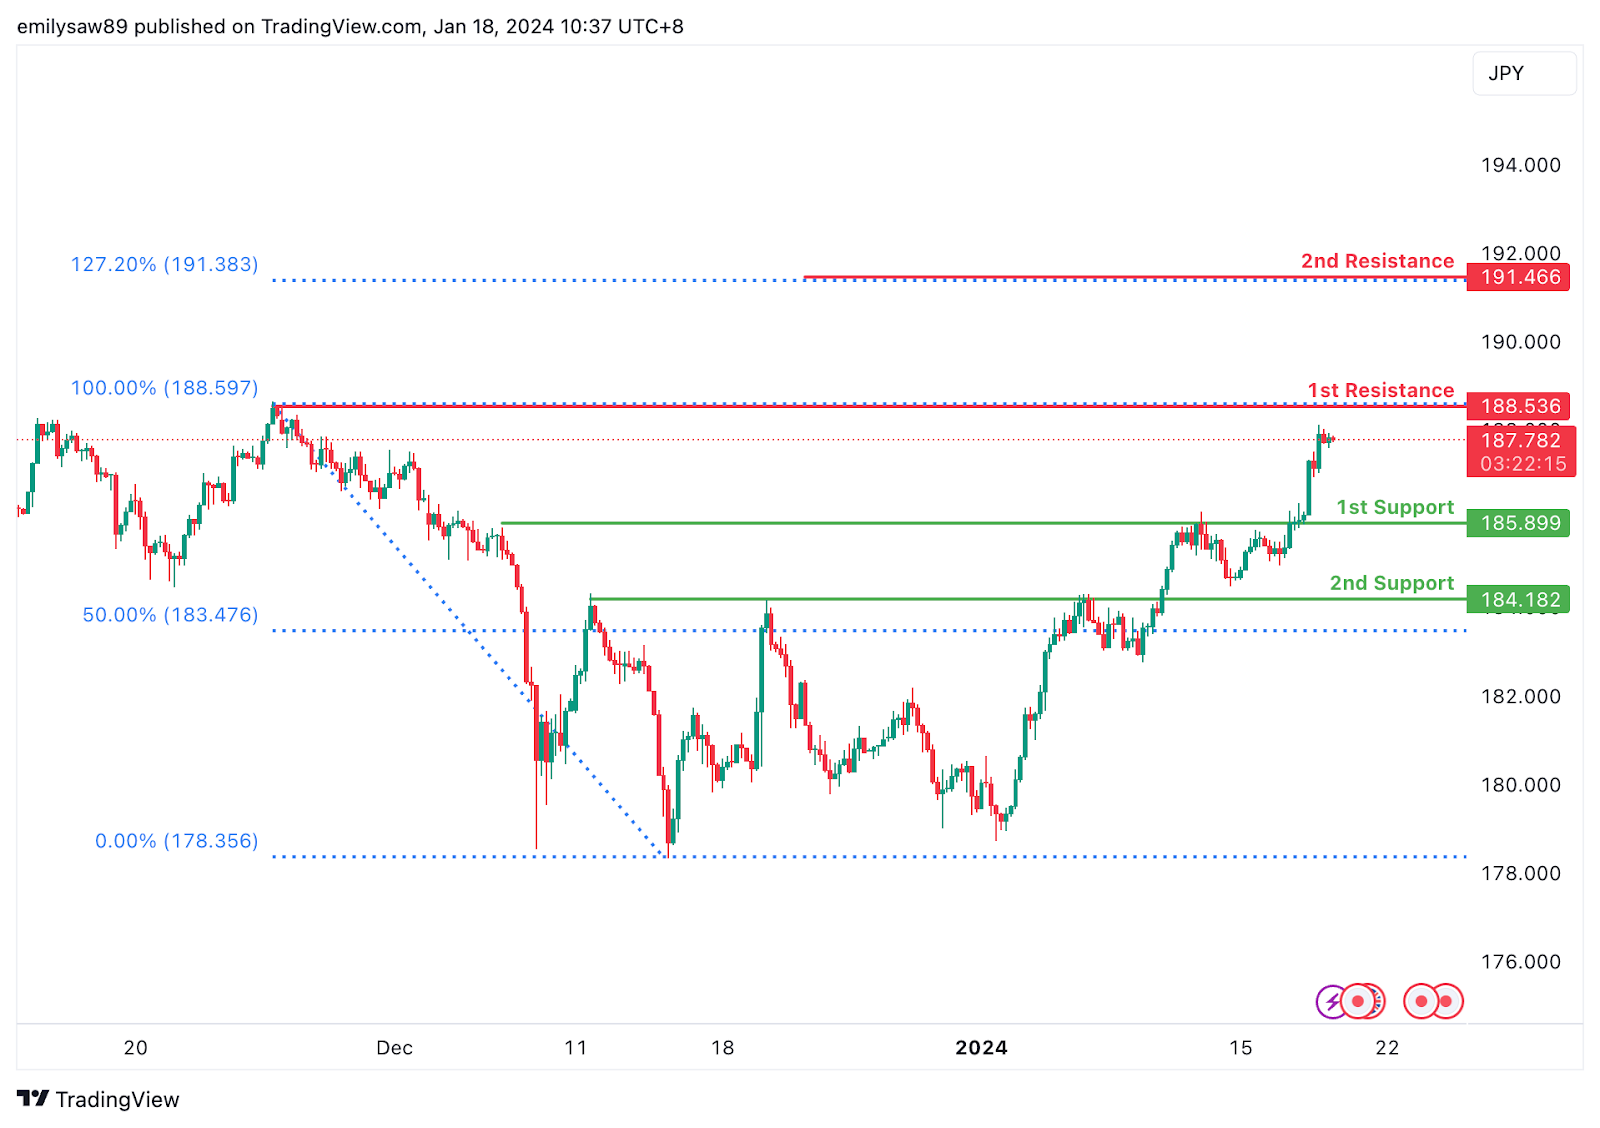
GBP/JPY:
The GBP/JPY chart currently displays a bullish overall momentum, indicating a positive trend direction. The potential price movement suggests a bullish continuation towards the 1st resistance level.
The 1st support at 185.90 is considered favorable as it aligns with pullback support, indicating a historical level where buying interest has previously emerged. Additionally, the 2nd support at 184.18 is identified as pullback support and coincides with the 50% Fibonacci Retracement, providing additional strength to the support zone.
On the resistance side, the 1st resistance at 188.54 is recognized as a swing high resistance, signifying a historical level where selling pressure may emerge. Furthermore, the 2nd resistance at 191.47 is notable for the presence of the 127.20% Fibonacci Extension, adding significance to this potential resistance level.
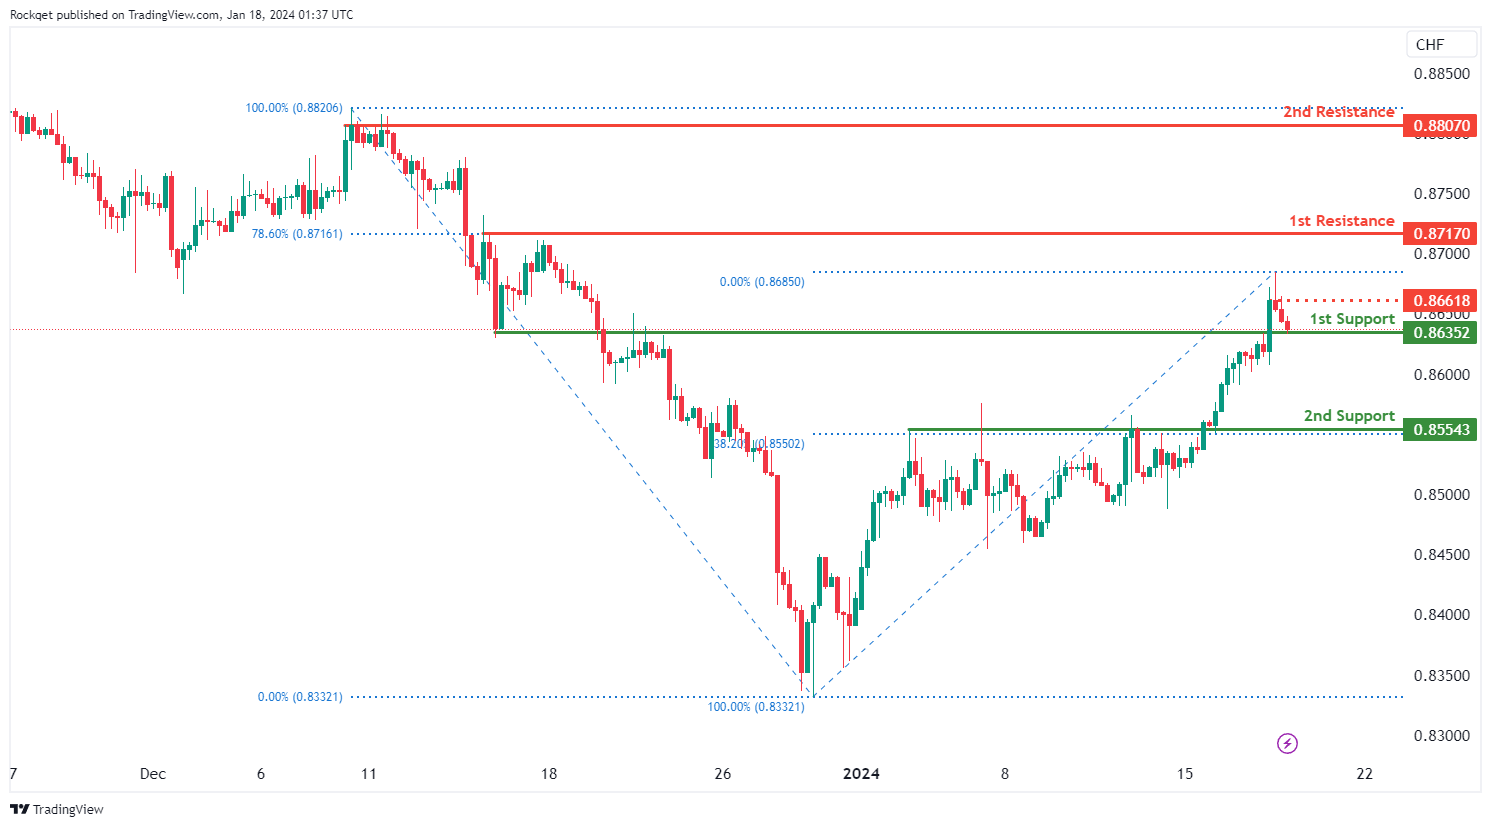
USD/CHF:
The USD/CHF chart currently exhibits an overall bullish momentum. However, there is a potential scenario for price to drop towards the 1st support before resuming the uptrend.
The 1st support level at 0.8635 is identified as an overlap support. Further below, the 2nd support level at 0.8554 is marked as a pullback support that aligns with the 38.20% Fibonacci retracement level, further reinforcing its importance as a key support level.
To the upside, the intermediate resistance level at 0.8661 is identified as a pullback resistance while the 1st resistance level at 0.8717 is also marked as a pullback resistance that aligns with the 78.60% Fibonacci retracement level. Higher up, the 2nd resistance level at 0.8807 is also noted as a pullback resistance, further reinforcing its significance as a potential resistance zone.
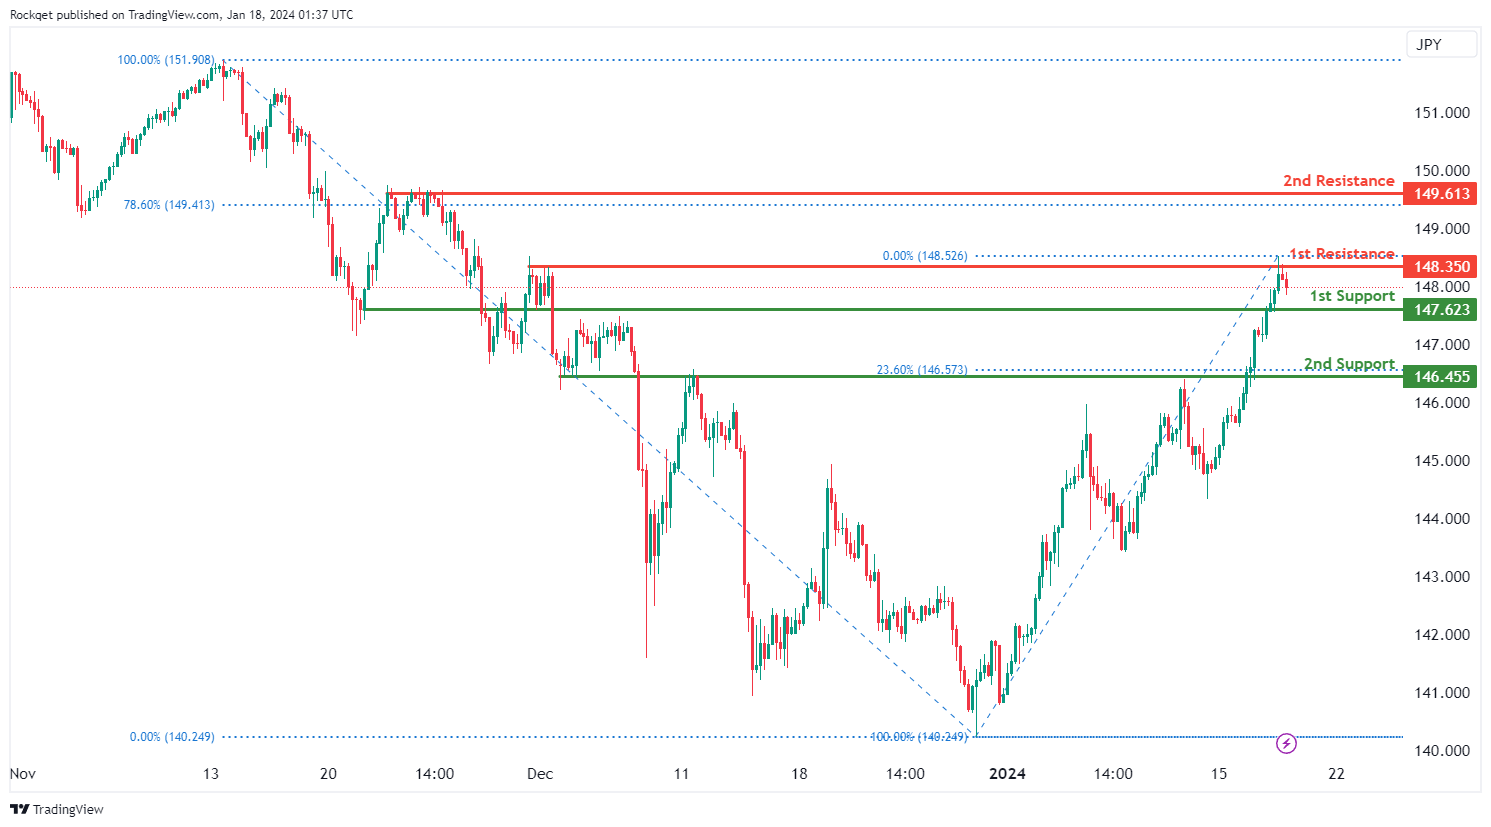
USD/JPY:
The USD/JPY chart currently exhibits an overall bullish momentum. However, there is a potential scenario for price to drop towards the 1st support before resuming the uptrend.
The 1st support level at 147.62 is identified as an overlap support. Further below, the 2nd support level at 146.45 is also marked as an overlap support that aligns with the 23.60% Fibonacci retracement level, further reinforcing its importance as a key support level.
To the upside, the 1st resistance level at 148.35 is identified as a pullback resistance. Higher up, the 2nd resistance level at 149.61 is also noted as a pullback resistance that aligns close to the 78.60% Fibonacci retracement level, further reinforcing its significance as a potential resistance zone.
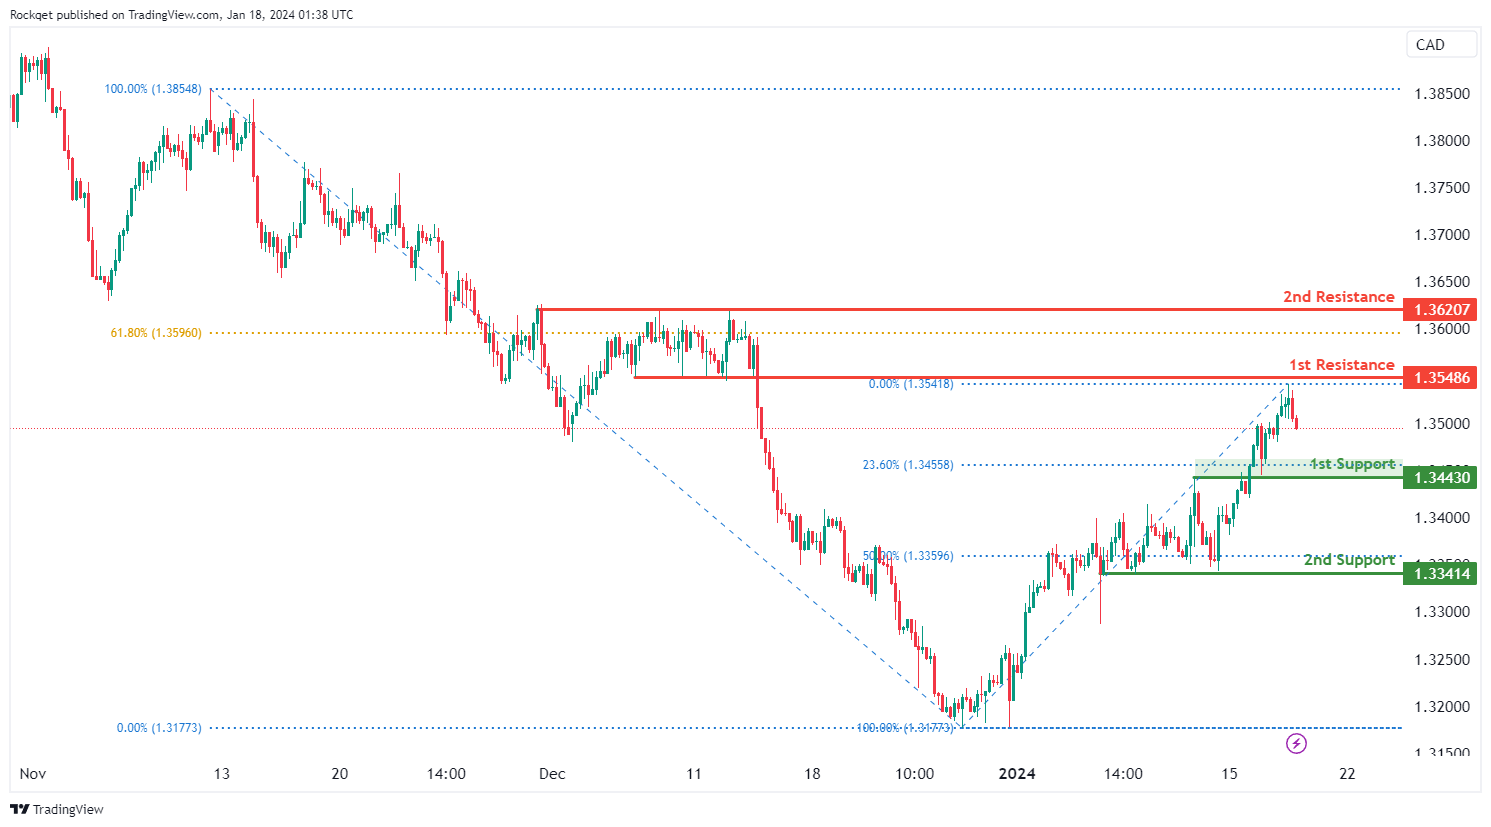
USD/CAD:
The USD/CAD chart currently exhibits an overall bullish momentum. However, there is a potential scenario for price to drop towards the 1st support before resuming the uptrend.
The 1st support level at 1.3443 is identified as an overlap support that aligns close to the 23.60% Fibonacci retracement level. Further below, the 2nd support level at 1.3341 is marked as a pullback support that aligns close to the 50.00% Fibonacci retracement level, further reinforcing its importance as a key support level.
To the upside, the 1st resistance level at 1.3548 is identified as a pullback resistance. Higher up, the 2nd resistance level at 1.3620 is also noted as a pullback resistance that aligns close to the 61.80% Fibonacci retracement level, further reinforcing its significance as a potential resistance zone.
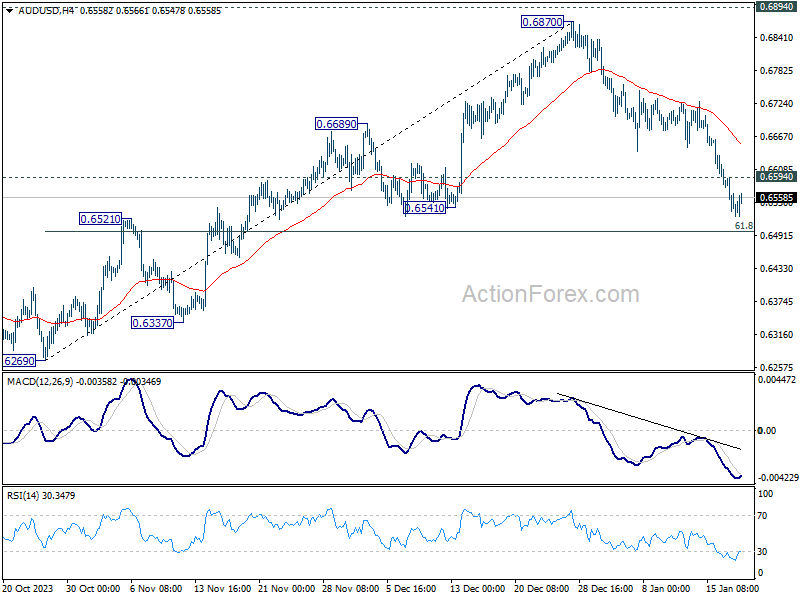
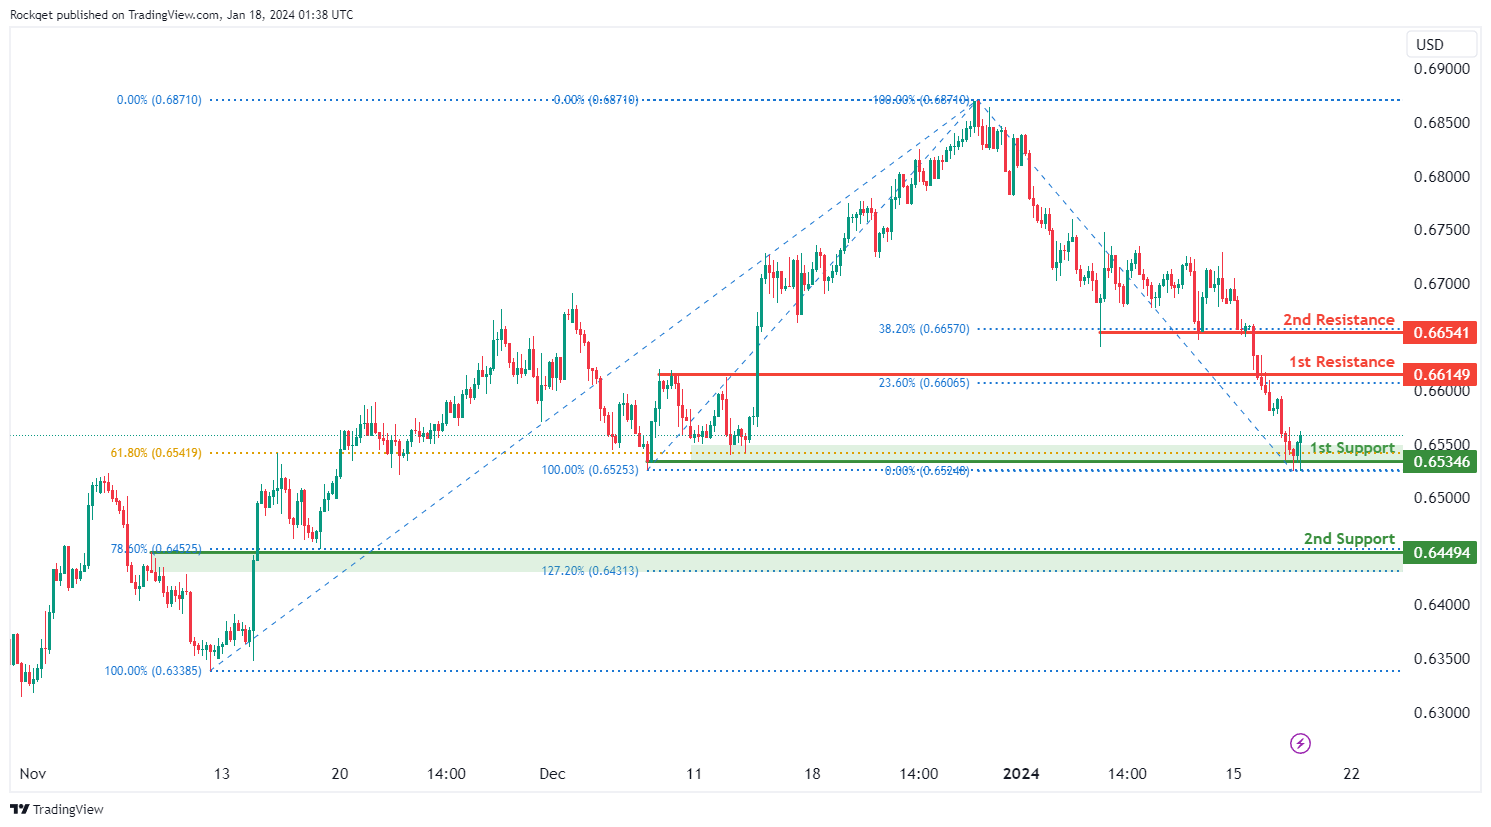
AUD/USD:
The AUD/USD chart currently exhibits an overall bearish momentum. However, there is a potential scenario for price to rise towards the 1st resistance before resuming the downtrend.
The 1st resistance level at 0.6614 is identified as a pullback resistance that aligns with the 23.60% Fibonacci retracement level. Higher up, the 2nd resistance level at 0.6654 is also noted as a pullback resistance that aligns with the 38.20% Fibonacci retracement level, suggesting a potential barrier for further upside movement.
To the downside, the 1st support level at 0.6534 is identified as a pullback support that aligns with the 61.80% Fibonacci retracement level. Further below, the 2nd support level at 0.6449 is marked as an overlap support that aligns with a confluence of Fibonacci levels i.e. the 78.60% retracement and the 127.20% extension, further reinforcing its importance as a key support level.
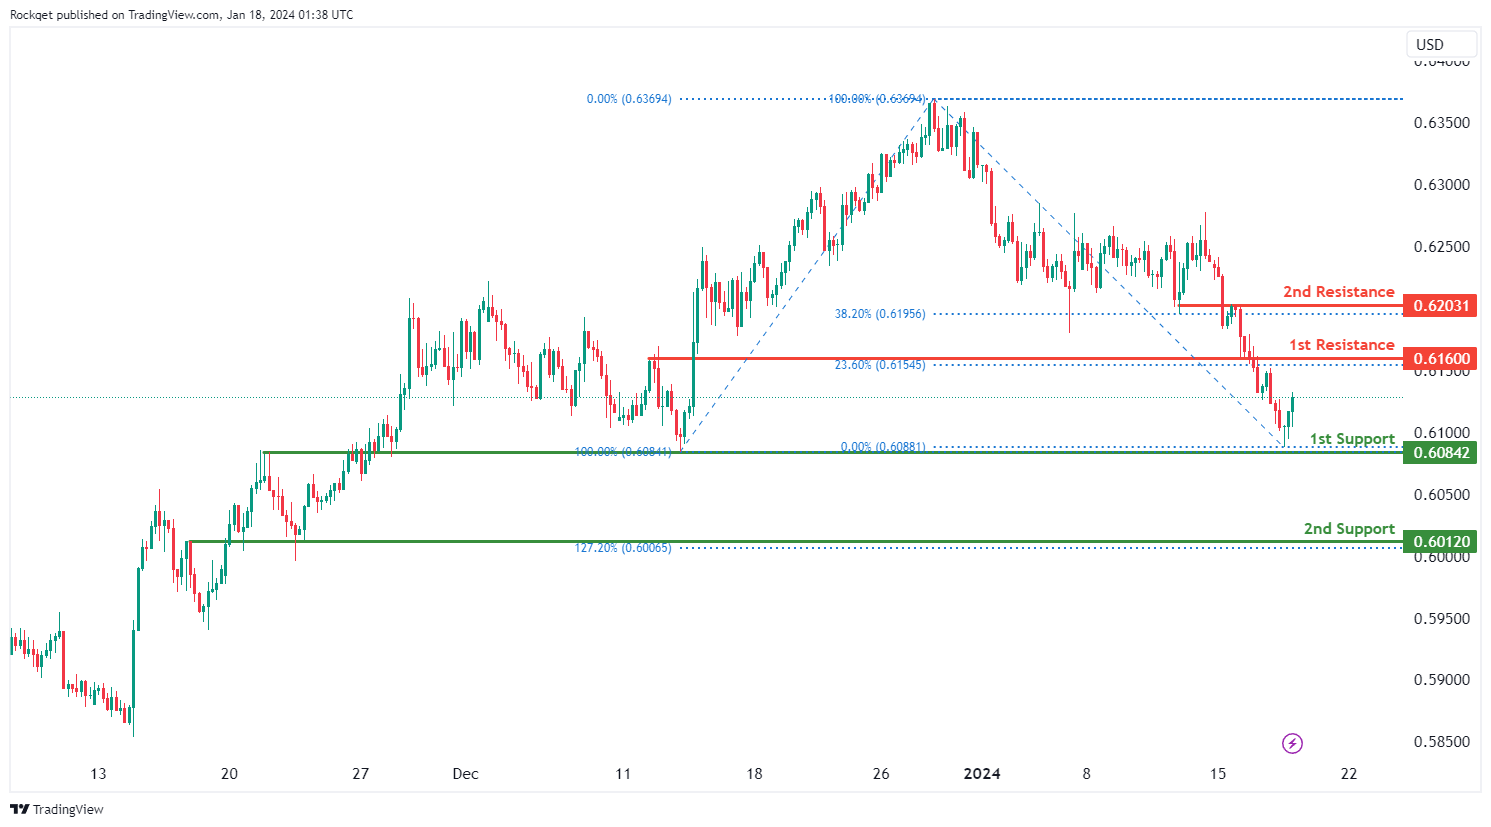
NZD/USD
The NZD/USD chart currently exhibits an overall bearish momentum. However, there is a potential scenario for price to rise towards the 1st resistance before resuming the downtrend.
The 1st resistance level at 0.6160 is identified as a pullback resistance that aligns with the 23.60% Fibonacci retracement level. Higher up, the 2nd resistance level at 0.6203 is noted as an overlap resistance that aligns with the 38.20% Fibonacci retracement level, suggesting a potential barrier for further upside movement.
To the downside, the 1st support level at 0.6084 is identified as an overlap support. Further below, the 2nd support level at 0.6012 is also marked as an overlap support that aligns with the 127.20% Fibonacci extension level, further reinforcing its importance as a key support level.
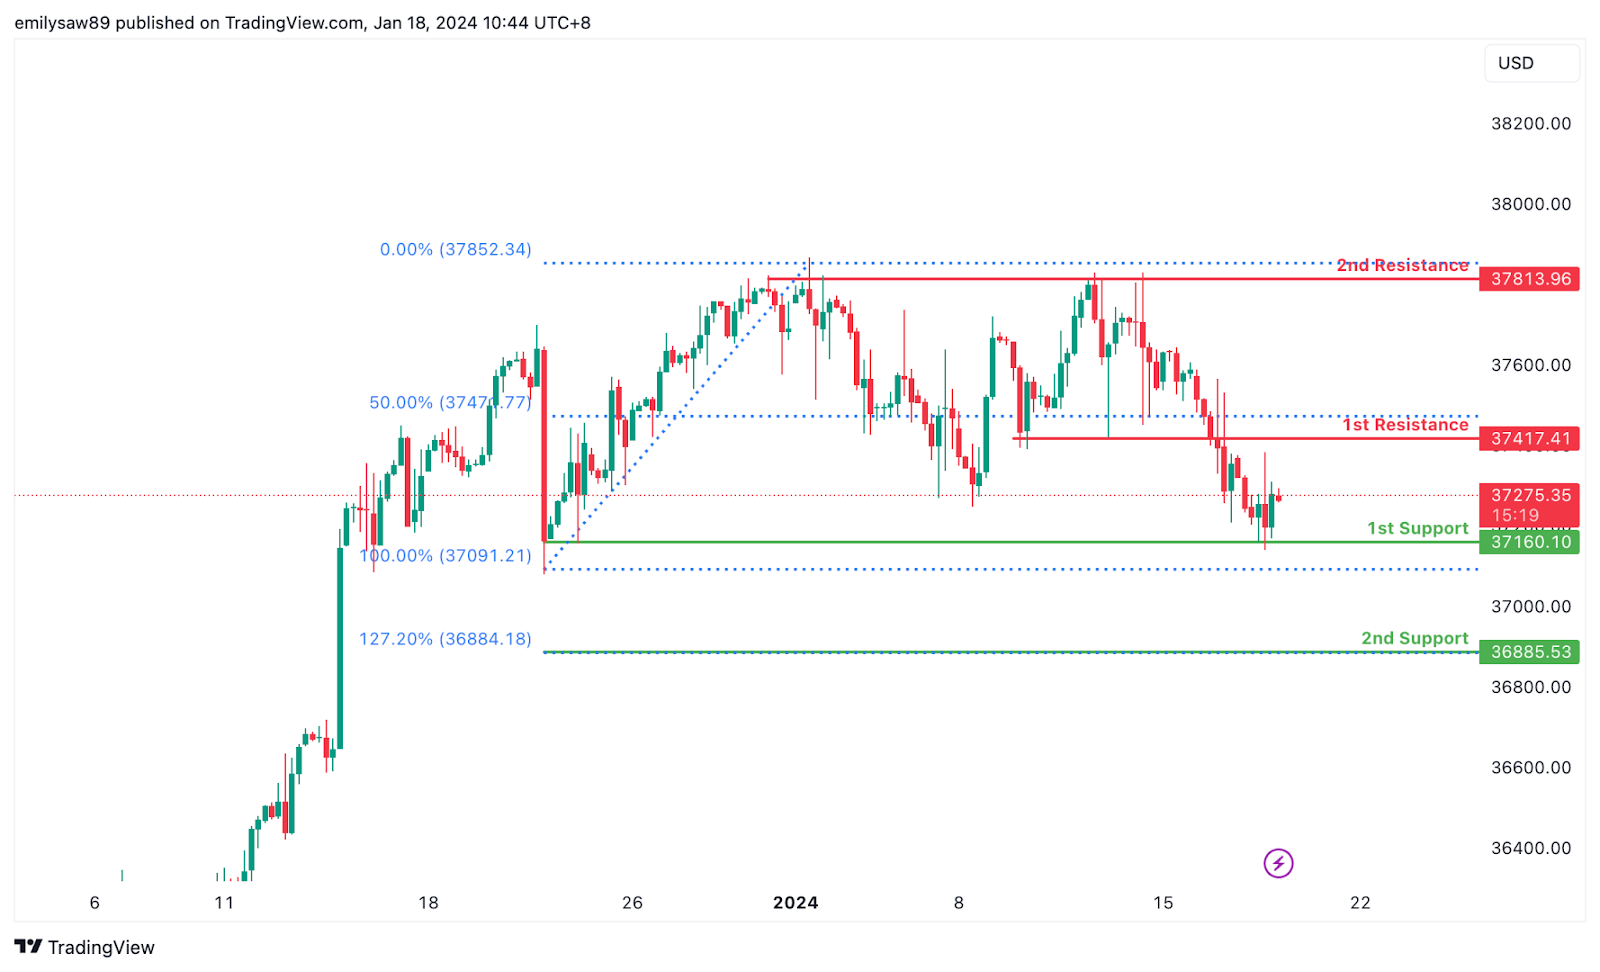
DJ30:
The DJ30 chart currently indicates a neutral overall momentum, suggesting a lack of a clear trend direction. The potential price movement suggests that the price could fluctuate between the 1st resistance and 1st support levels.
The 1st support at 37160.10 is considered favourable as it aligns with multi-swing low support, indicating a historical level where buying interest has previously emerged. Additionally, the 2nd support at 36885.53 is recognized for the presence of the 127.20% Fibonacci Extension, adding an extra layer of significance to this support level.
On the resistance side, the 1st resistance at 37417.41 is identified as an overlap resistance and coincides with the 50% Fibonacci Retracement, providing potential resistance to upward price movement. Furthermore, the 2nd resistance at 37813.96 is notable for being a multi-swing high resistance, suggesting a historical level where selling pressure may emerge.
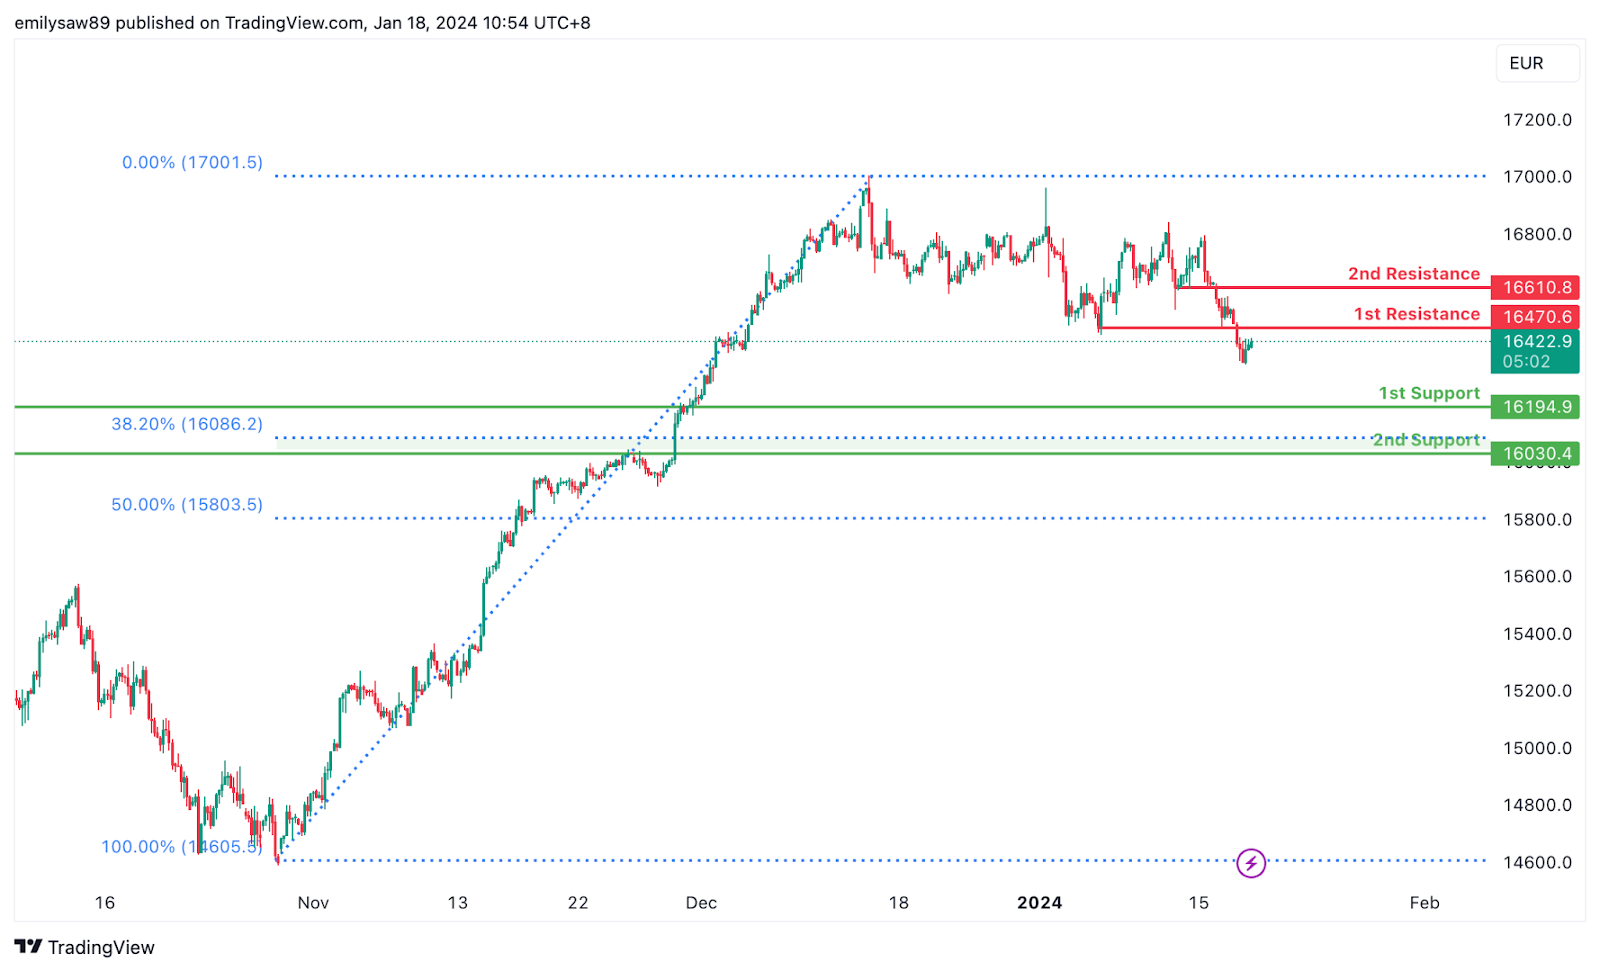
GER40:
The GER40 chart currently displays a weak bullish overall momentum with low confidence, suggesting a tentative upward direction. Several factors contribute to this weak bullish momentum, indicating that the price could potentially make a bullish continuation towards the 1st resistance.
The 1st support at 16194.90 is considered favourable as it aligns with pullback support, indicating a historical level where buying interest has previously emerged. Additionally, the 2nd support at 16030.40 is recognized for being a pullback support and coincides with the 38.20% Fibonacci Retracement, adding confluence to its potential as a support level.
On the resistance side, the 1st resistance at 16470.60 is identified as an overlap resistance, suggesting a historical level where selling pressure may emerge. Furthermore, the 2nd resistance at 16610.80 is notable for being a pullback resistance, indicating a potential level where the upward momentum might face resistance.
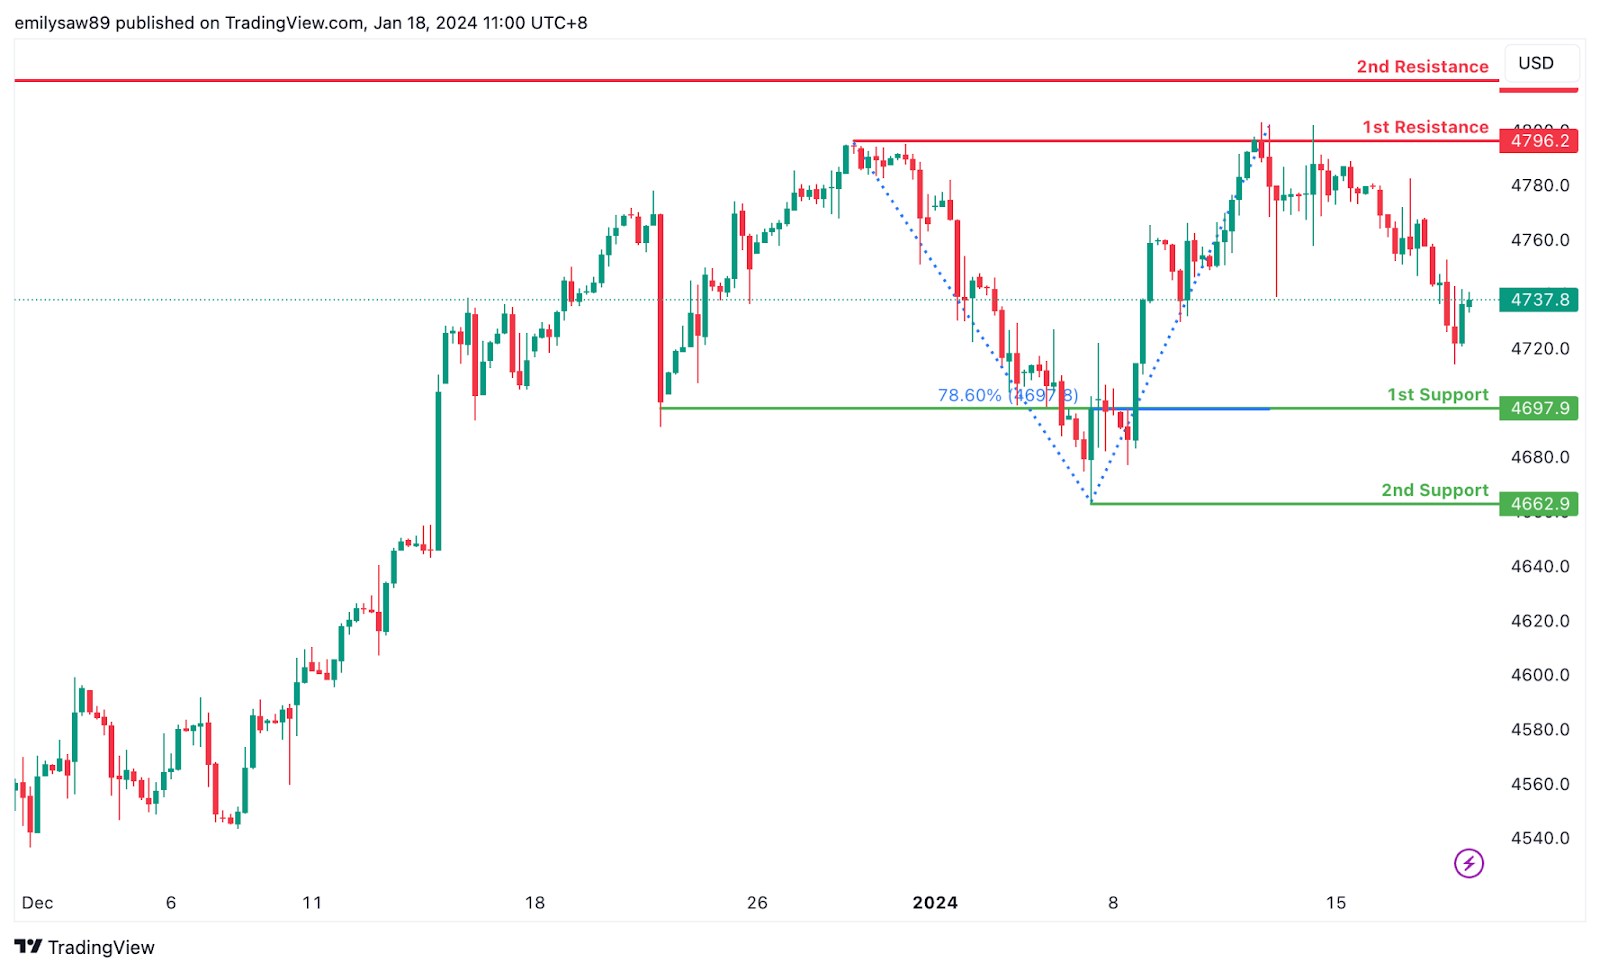
US500:
The US500 chart is currently experiencing a bearish overall momentum, with several factors contributing to this downward trend. As a result, the price could potentially continue its bearish movement towards the 1st support.
The 1st support at 4697.9 is considered advantageous as it is identified as an overlap support and coincides with the 78.60% Fibonacci Projection. This level suggests historical significance and may act as a strong support zone. Additionally, the 2nd support at 4662.9 is recognized as a swing low support, further reinforcing the potential support level.
On the resistance side, the 1st resistance at 4796.2 is noted for being a multi-swing high resistance, indicating a historical level where selling pressure has been significant. Furthermore, the intermediate resistance at 4818.4 is highlighted as a swing high resistance, adding strength to the potential resistance zone.
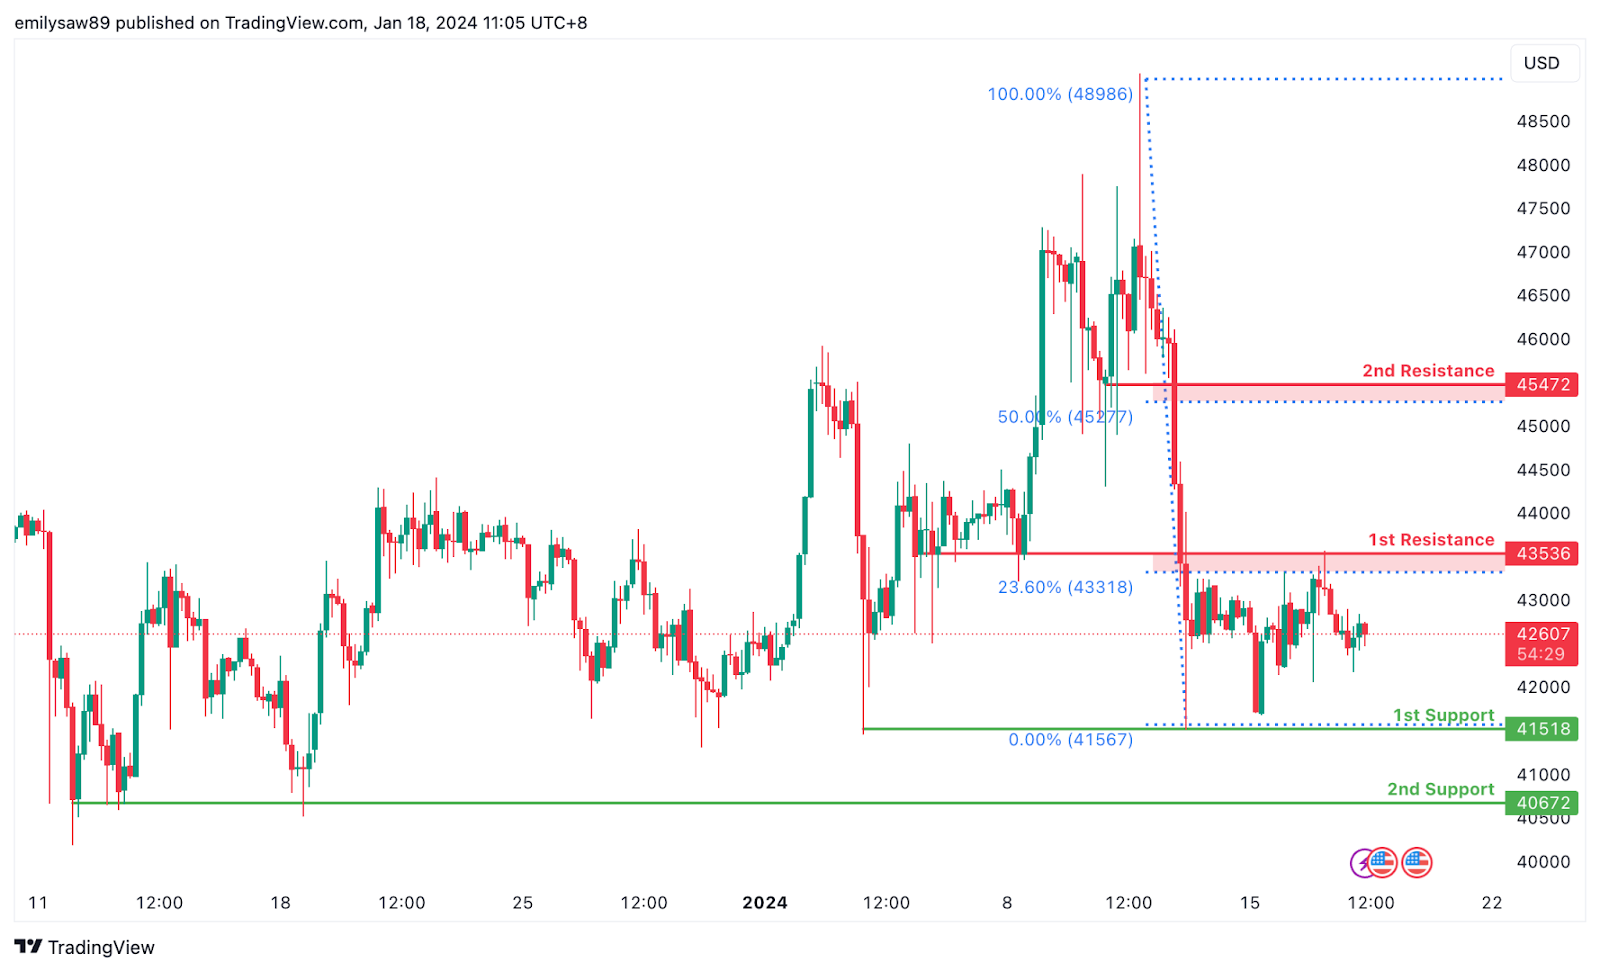
BTC/USD:
The BTC/USD chart is currently exhibiting a neutral overall momentum, suggesting a lack of a clear trend direction. In such a scenario, the price could potentially make fluctuations between the 1st resistance and 1st support levels.
The 1st support at 41518 is considered advantageous due to its identification as a multi-swing low support. This level has historical significance, indicating a point where buying interest has emerged in the past. Additionally, the 2nd support at 40672 is recognized as another multi-swing low support, providing additional strength to the support zone.
On the resistance side, the 1st resistance at 43536 is identified as an overlap resistance and coincides with the 23.60% Fibonacci Retracement. This confluence of technical factors adds strength to the potential resistance level. Furthermore, the 2nd resistance at 45472 is acknowledged as a pullback resistance and aligns with the 50% Fibonacci Retracement.
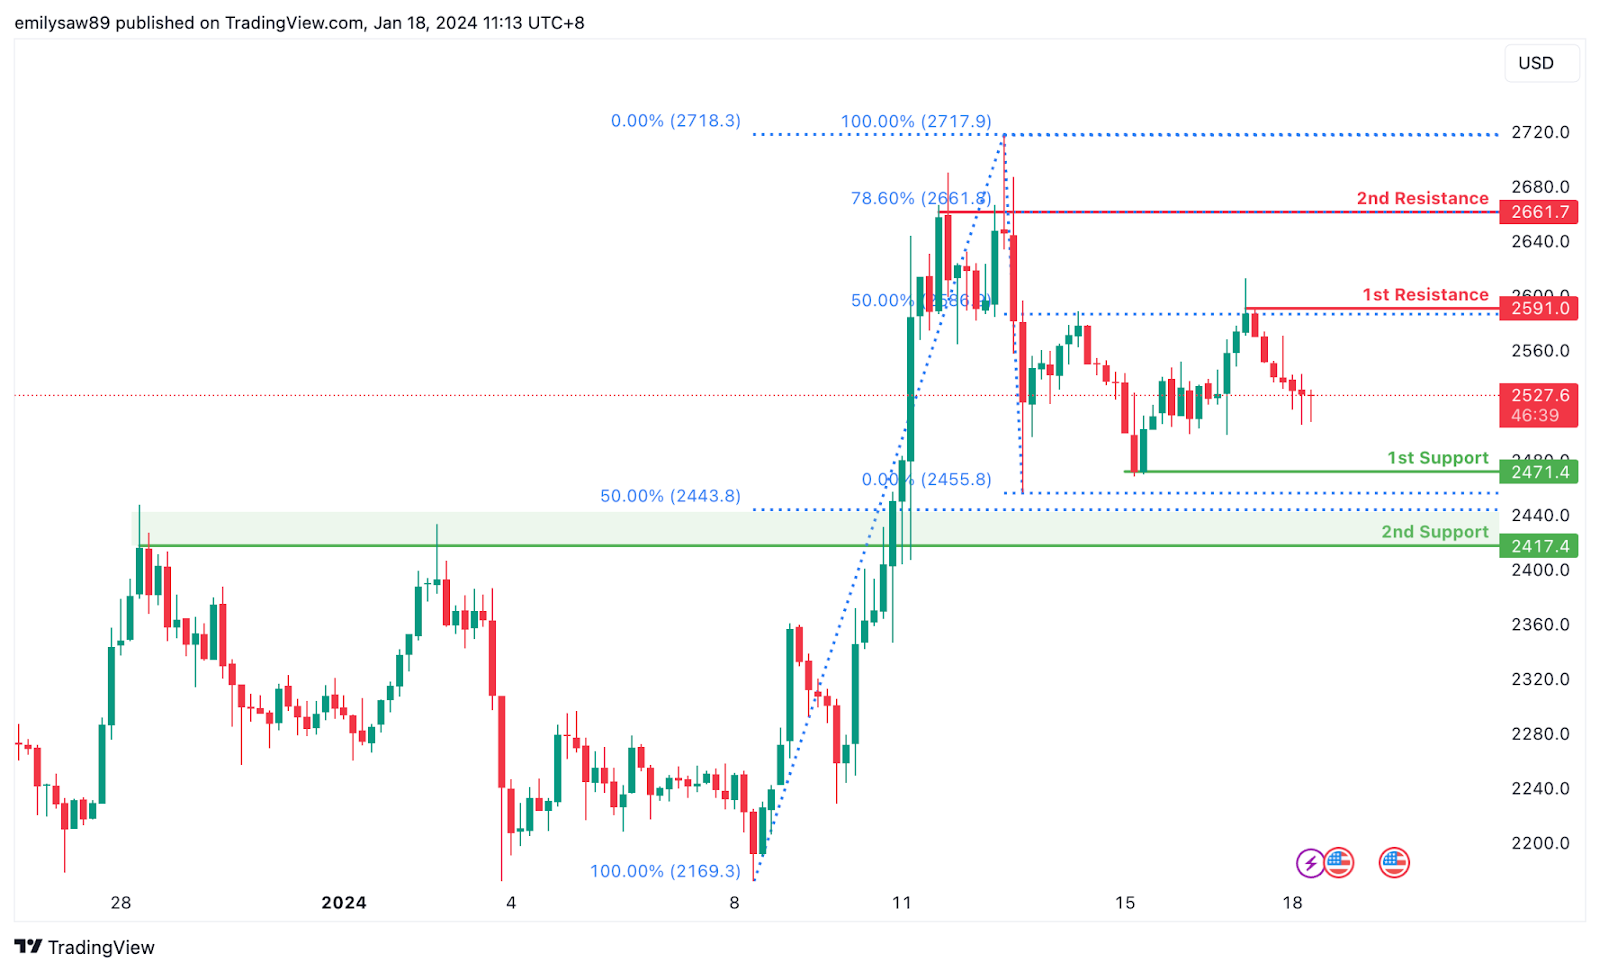
ETH/USD:
The ETH/USD chart is currently experiencing a bearish overall momentum, indicating a downward trend in the price movement. In this context, there is a potential scenario where the price could continue its bearish trend towards the 1st support level.
The 1st support at 2471.40 is considered favorable due to its identification as a pullback support. This level suggests historical significance, indicating a point where buying interest has previously emerged. Additionally, the 2nd support at 2417.40 is recognized as another pullback support and coincides with the 50% Fibonacci Retracement, adding confluence to its potential as a support level.
On the resistance side, the 1st resistance at 2591.00 is identified as a swing high resistance. This level represents a point where selling pressure has historically been observed. Furthermore, the 2nd resistance at 2661.70 is acknowledged as a multi-swing high resistance and aligns with the 78.60% Fibonacci Retracement, adding strength to the potential resistance level.
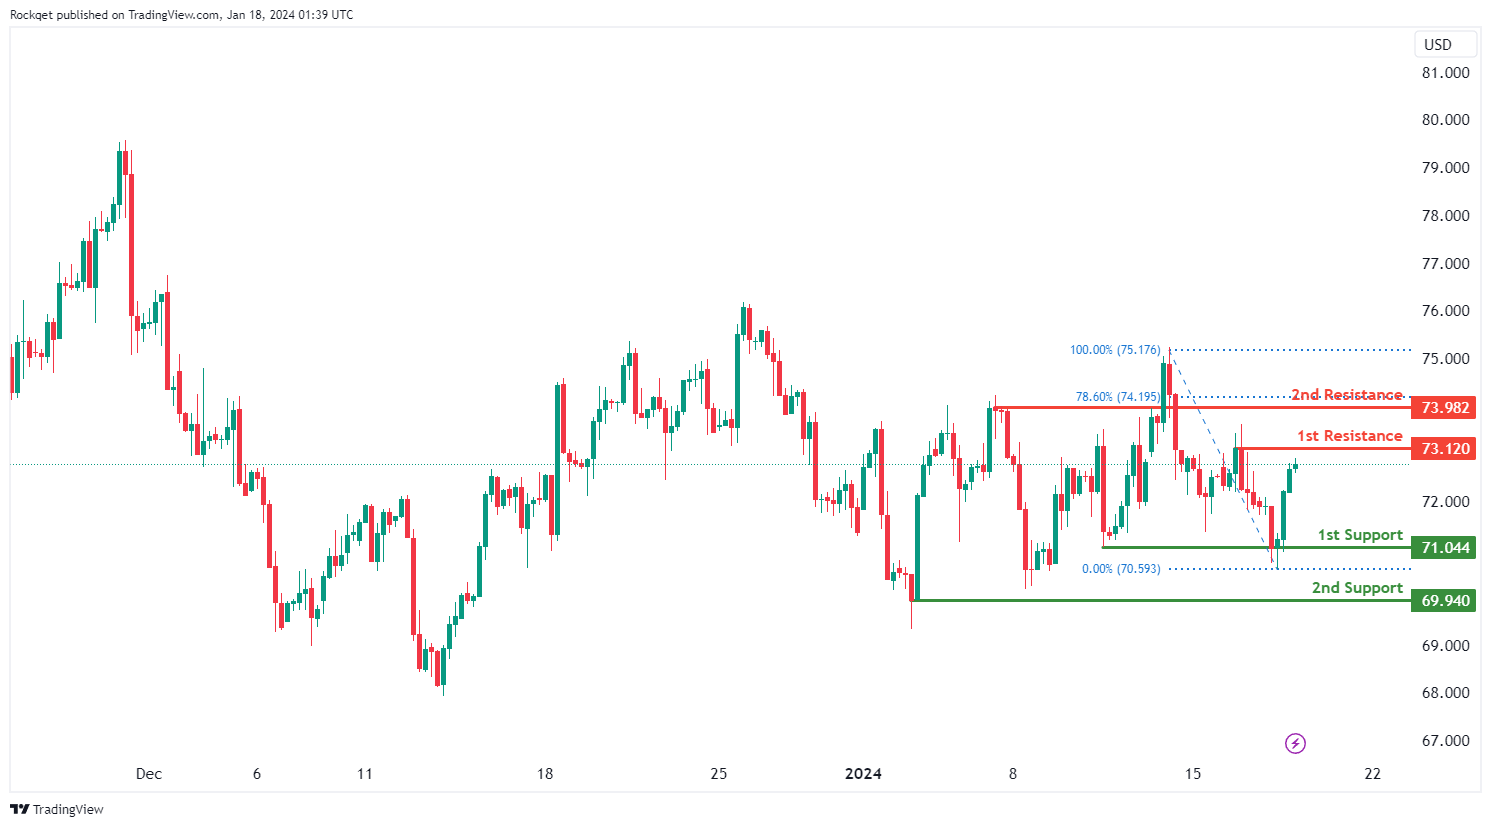
WTI/USD:
The WTI (West Texas Intermediate) chart currently exhibits a neutral bias, indicating a potential for price to fluctuate between the 1st resistance and the 1st support.
The 1st resistance level at 73.12 is identified as a pullback resistance. Higher up, the 2nd resistance level at 73.98 is also noted as a pullback resistance that aligns close to the 78.60% Fibonacci retracement level, suggesting a potential barrier for further upside movement.
To the downside, the 1st support level at 71.04 is identified as a pullback support. Further below, the 2nd support level at 69.94 is marked as a swing-low support, further reinforcing its importance as a key support level.
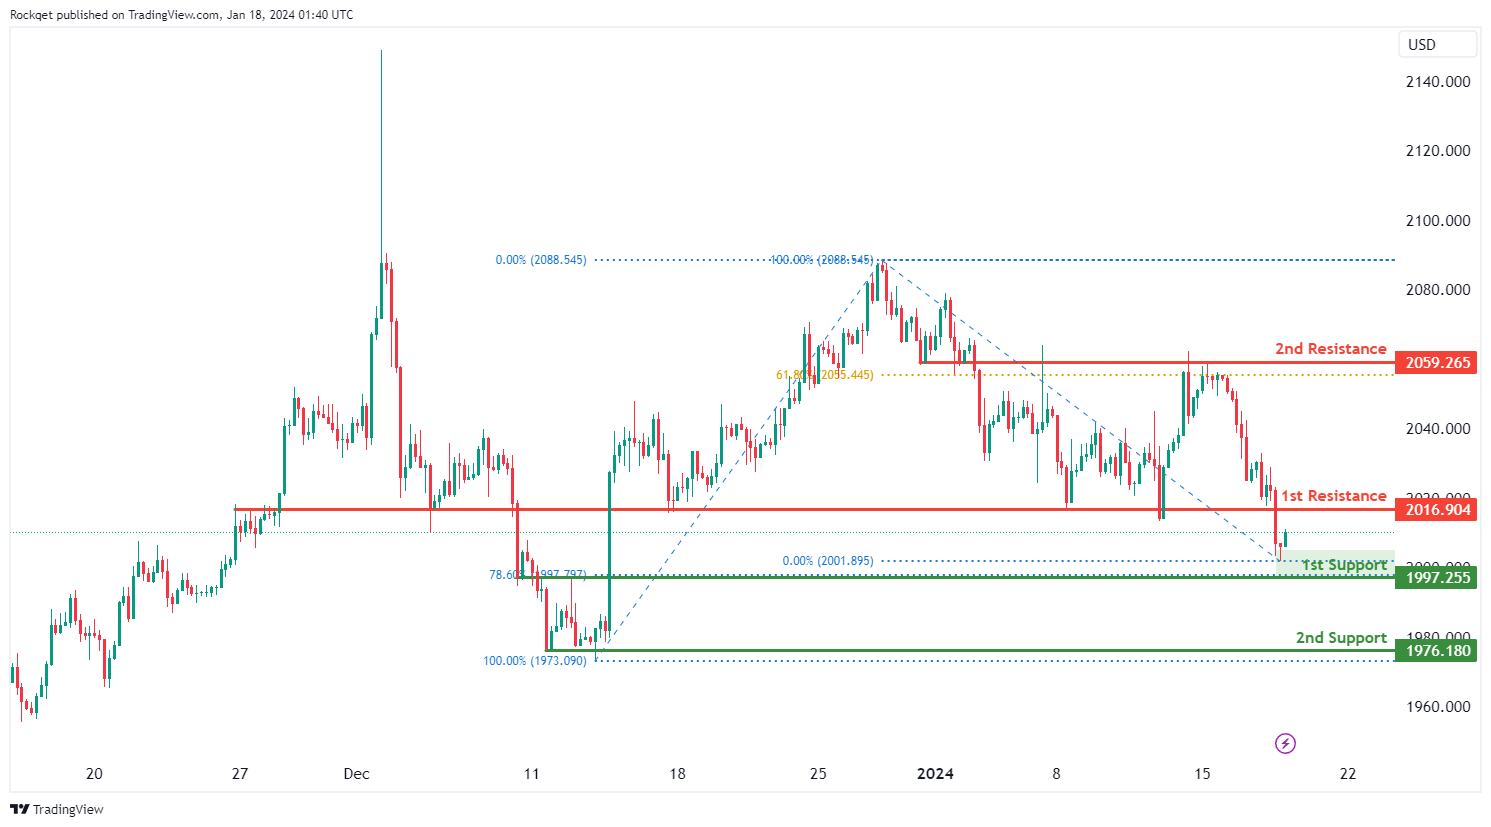
XAU/USD (GOLD):
The XAU/USD (Gold) chart currently exhibits an overall bearish momentum. However, there is a potential scenario for price to rise towards the 1st resistance before resuming the downtrend.
The 1st resistance level at 2,016.90 is identified as an overlap resistance. Higher up, the 2nd resistance level at 2,059.26 is also marked as an overlap resistance that aligns with the 61.80% Fibonacci retracement level, indicating a significant potential resistance point.
On the support side, the 1st support level at 1,997.25 is identified as an overlap support that aligns with the 78.60% Fibonacci retracement level. Further below, the 2nd support level at 1,976.18 is categorized as a swing-low support, further reinforcing its significance as a potential support zone.
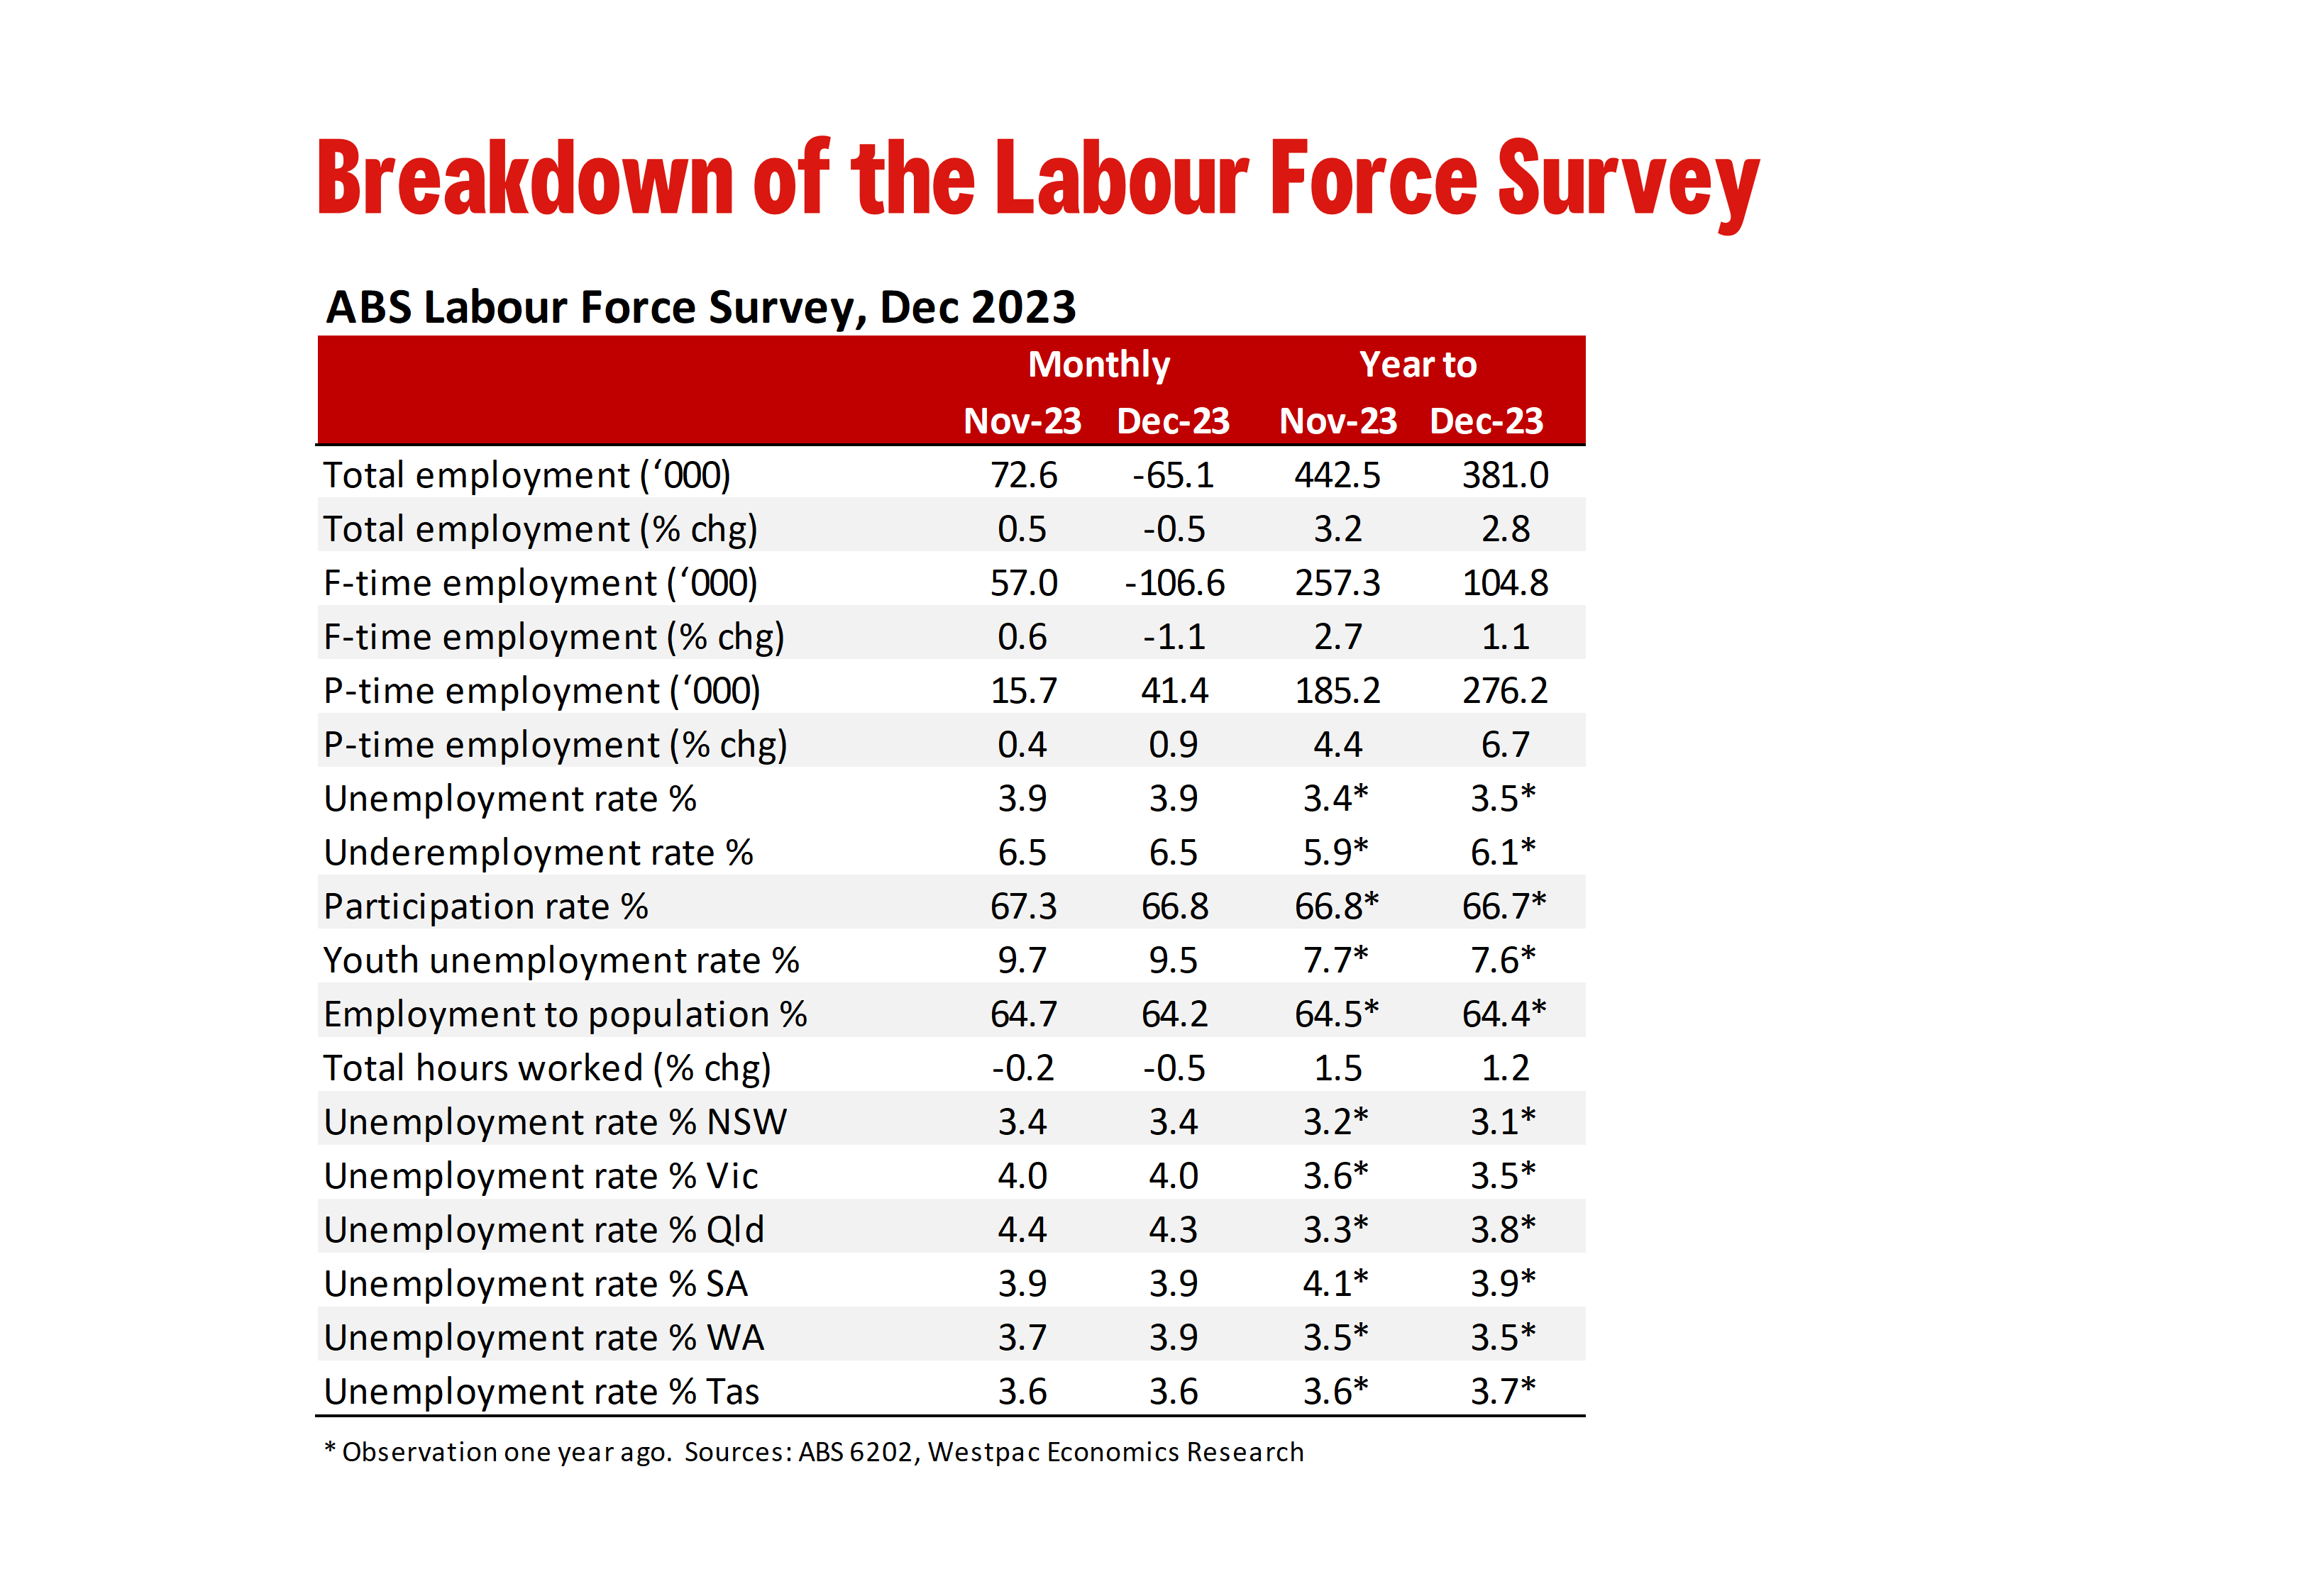
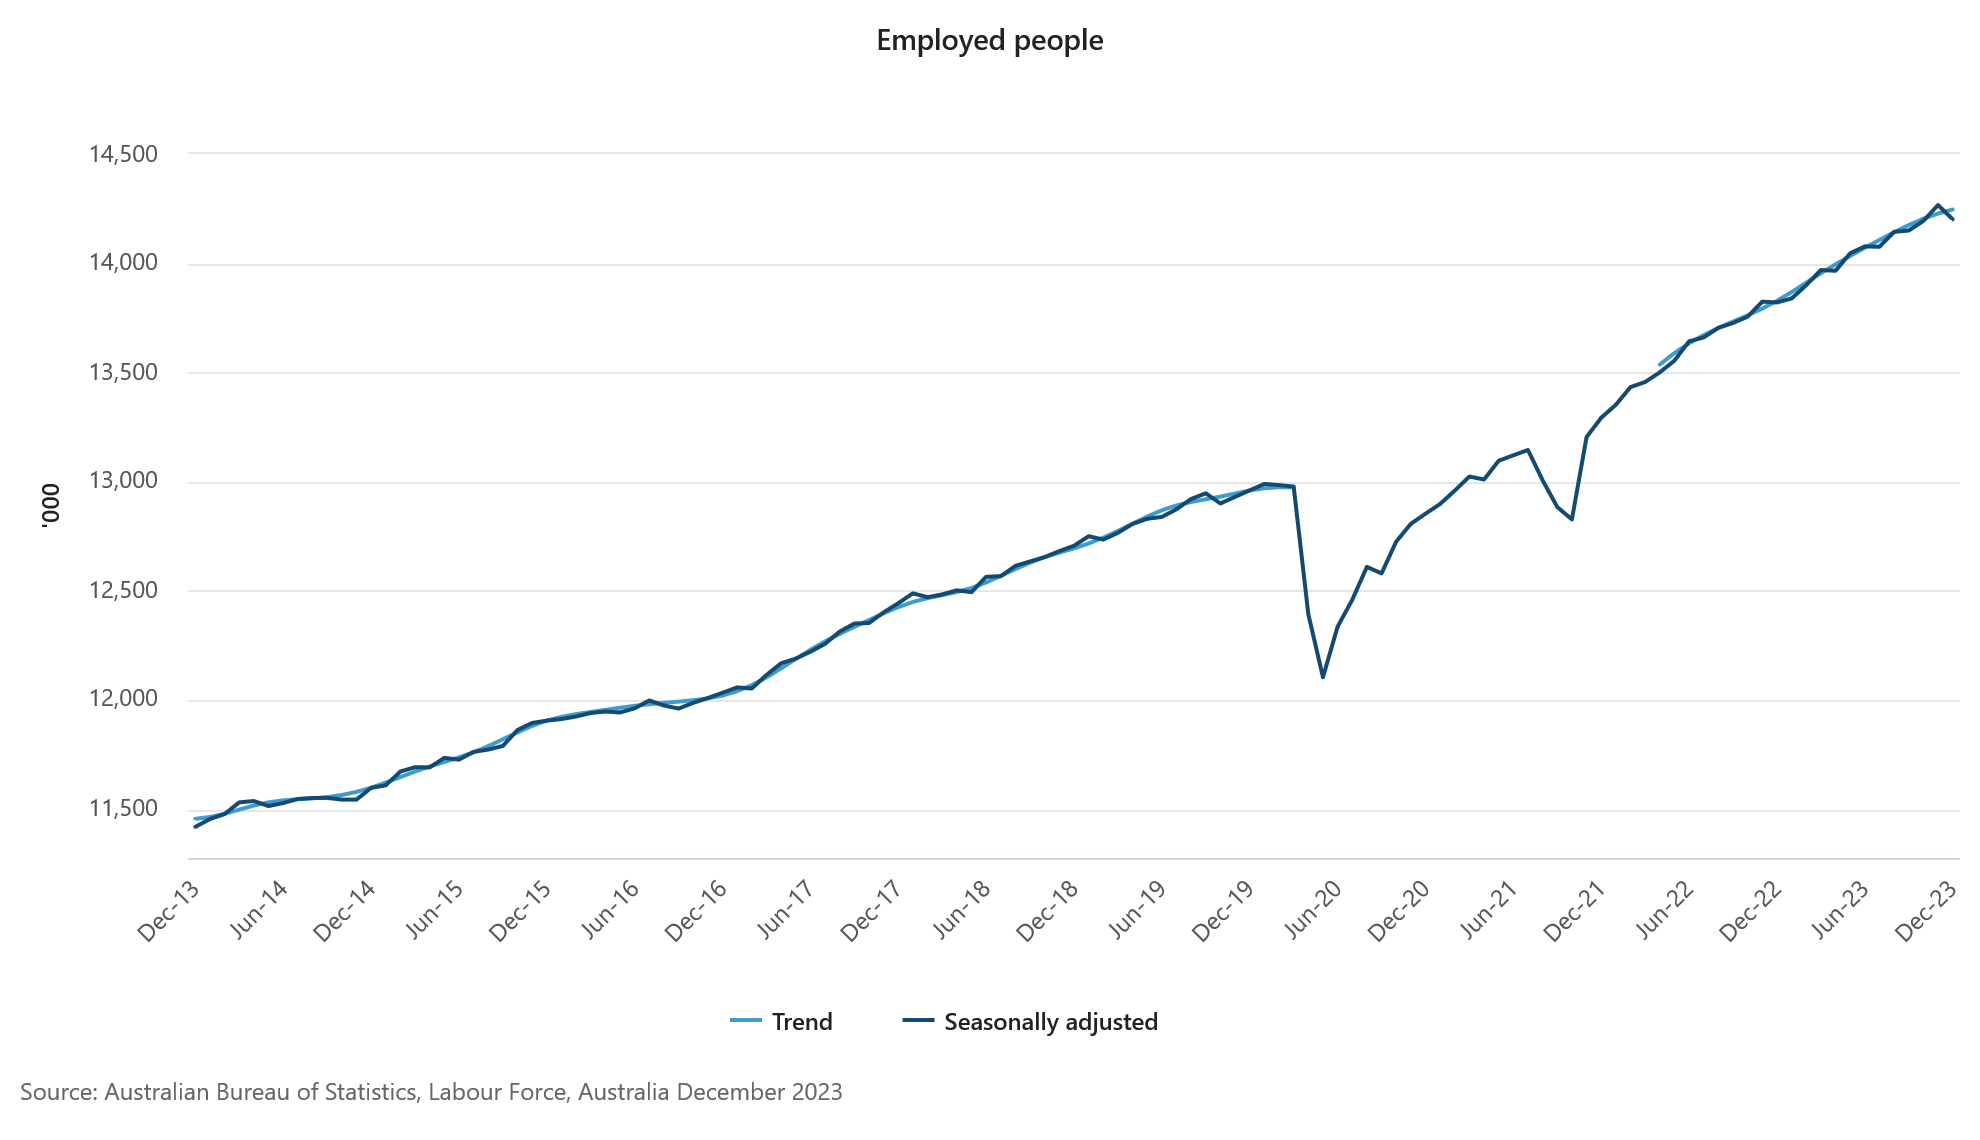
Australia December Labour Force: Soft Finish to the Year
Employment: –65.1k (from +72.6k). Unemployment Rate: 3.9% (unchanged). Participation Rate: 66.8% (from 67.3%).
December's labour force figures featured another surprise with regards to employment growth, this time to the downside, collapsing –65.1k (–0.5%) in the month. That compares to Westpac's forecast of +35k and a softer market consensus of +15k. The number of people employed full time declined by -106.6k – largest monthly fall on record outside of the COVID-19 period. Part time employment partly offset this fall, increasing by 41.4k.
In their media release, the ABS noted that "The strength in employment in October and November and the fall in December, reflected changes in the timing of employment growth in the last few months of 2023, compared with earlier years."
The ABS points to shifts in seasonal patterns as an important driver of recent results for employment. A possible explanation for this may be the growing importance of Black Friday Sales in Australia. This has likely meant that employers are hiring extra staff in October and November, instead of December.
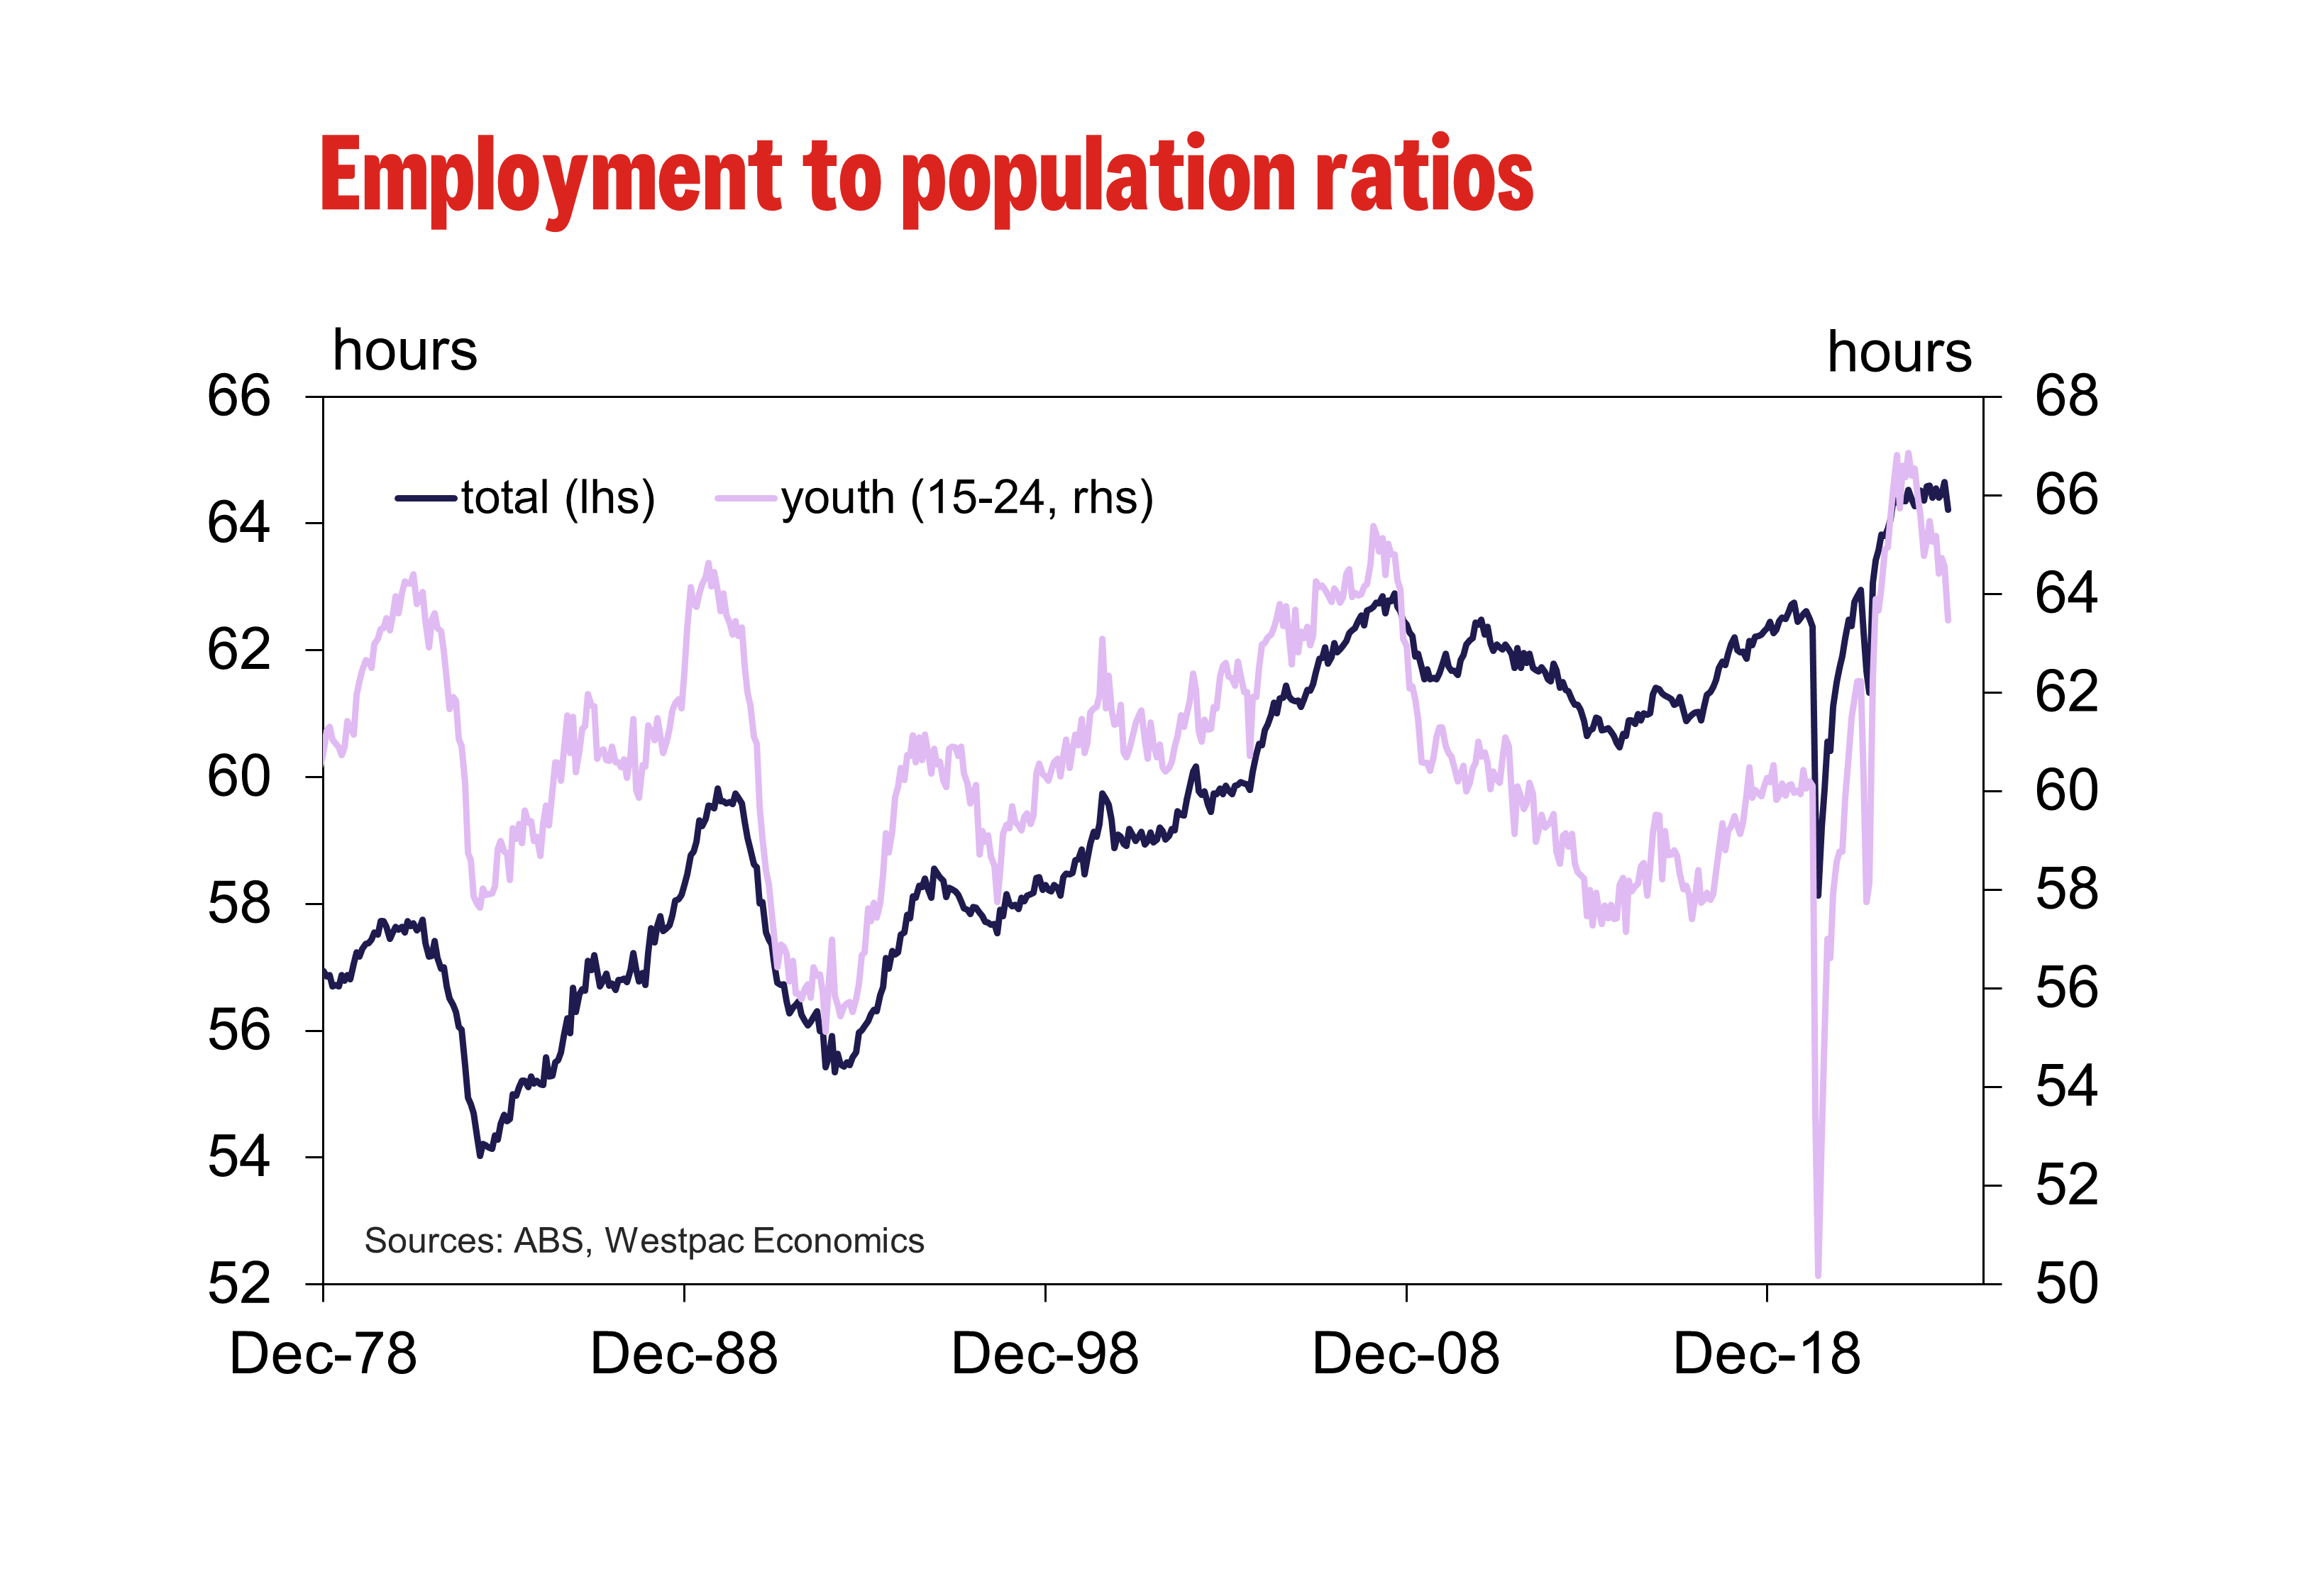
In line with the large fall in employment, the employment-to-population ratio also corrected, from an upwardly revised record high 64.7% in October to 64.2% in November, the lowest since May 2022. Similarly, the labour force participation rate moved sharply lower, from an upwardly revised record high of 67.3% in October to 66.8% in November to be broadly in line with the rate seen in September.
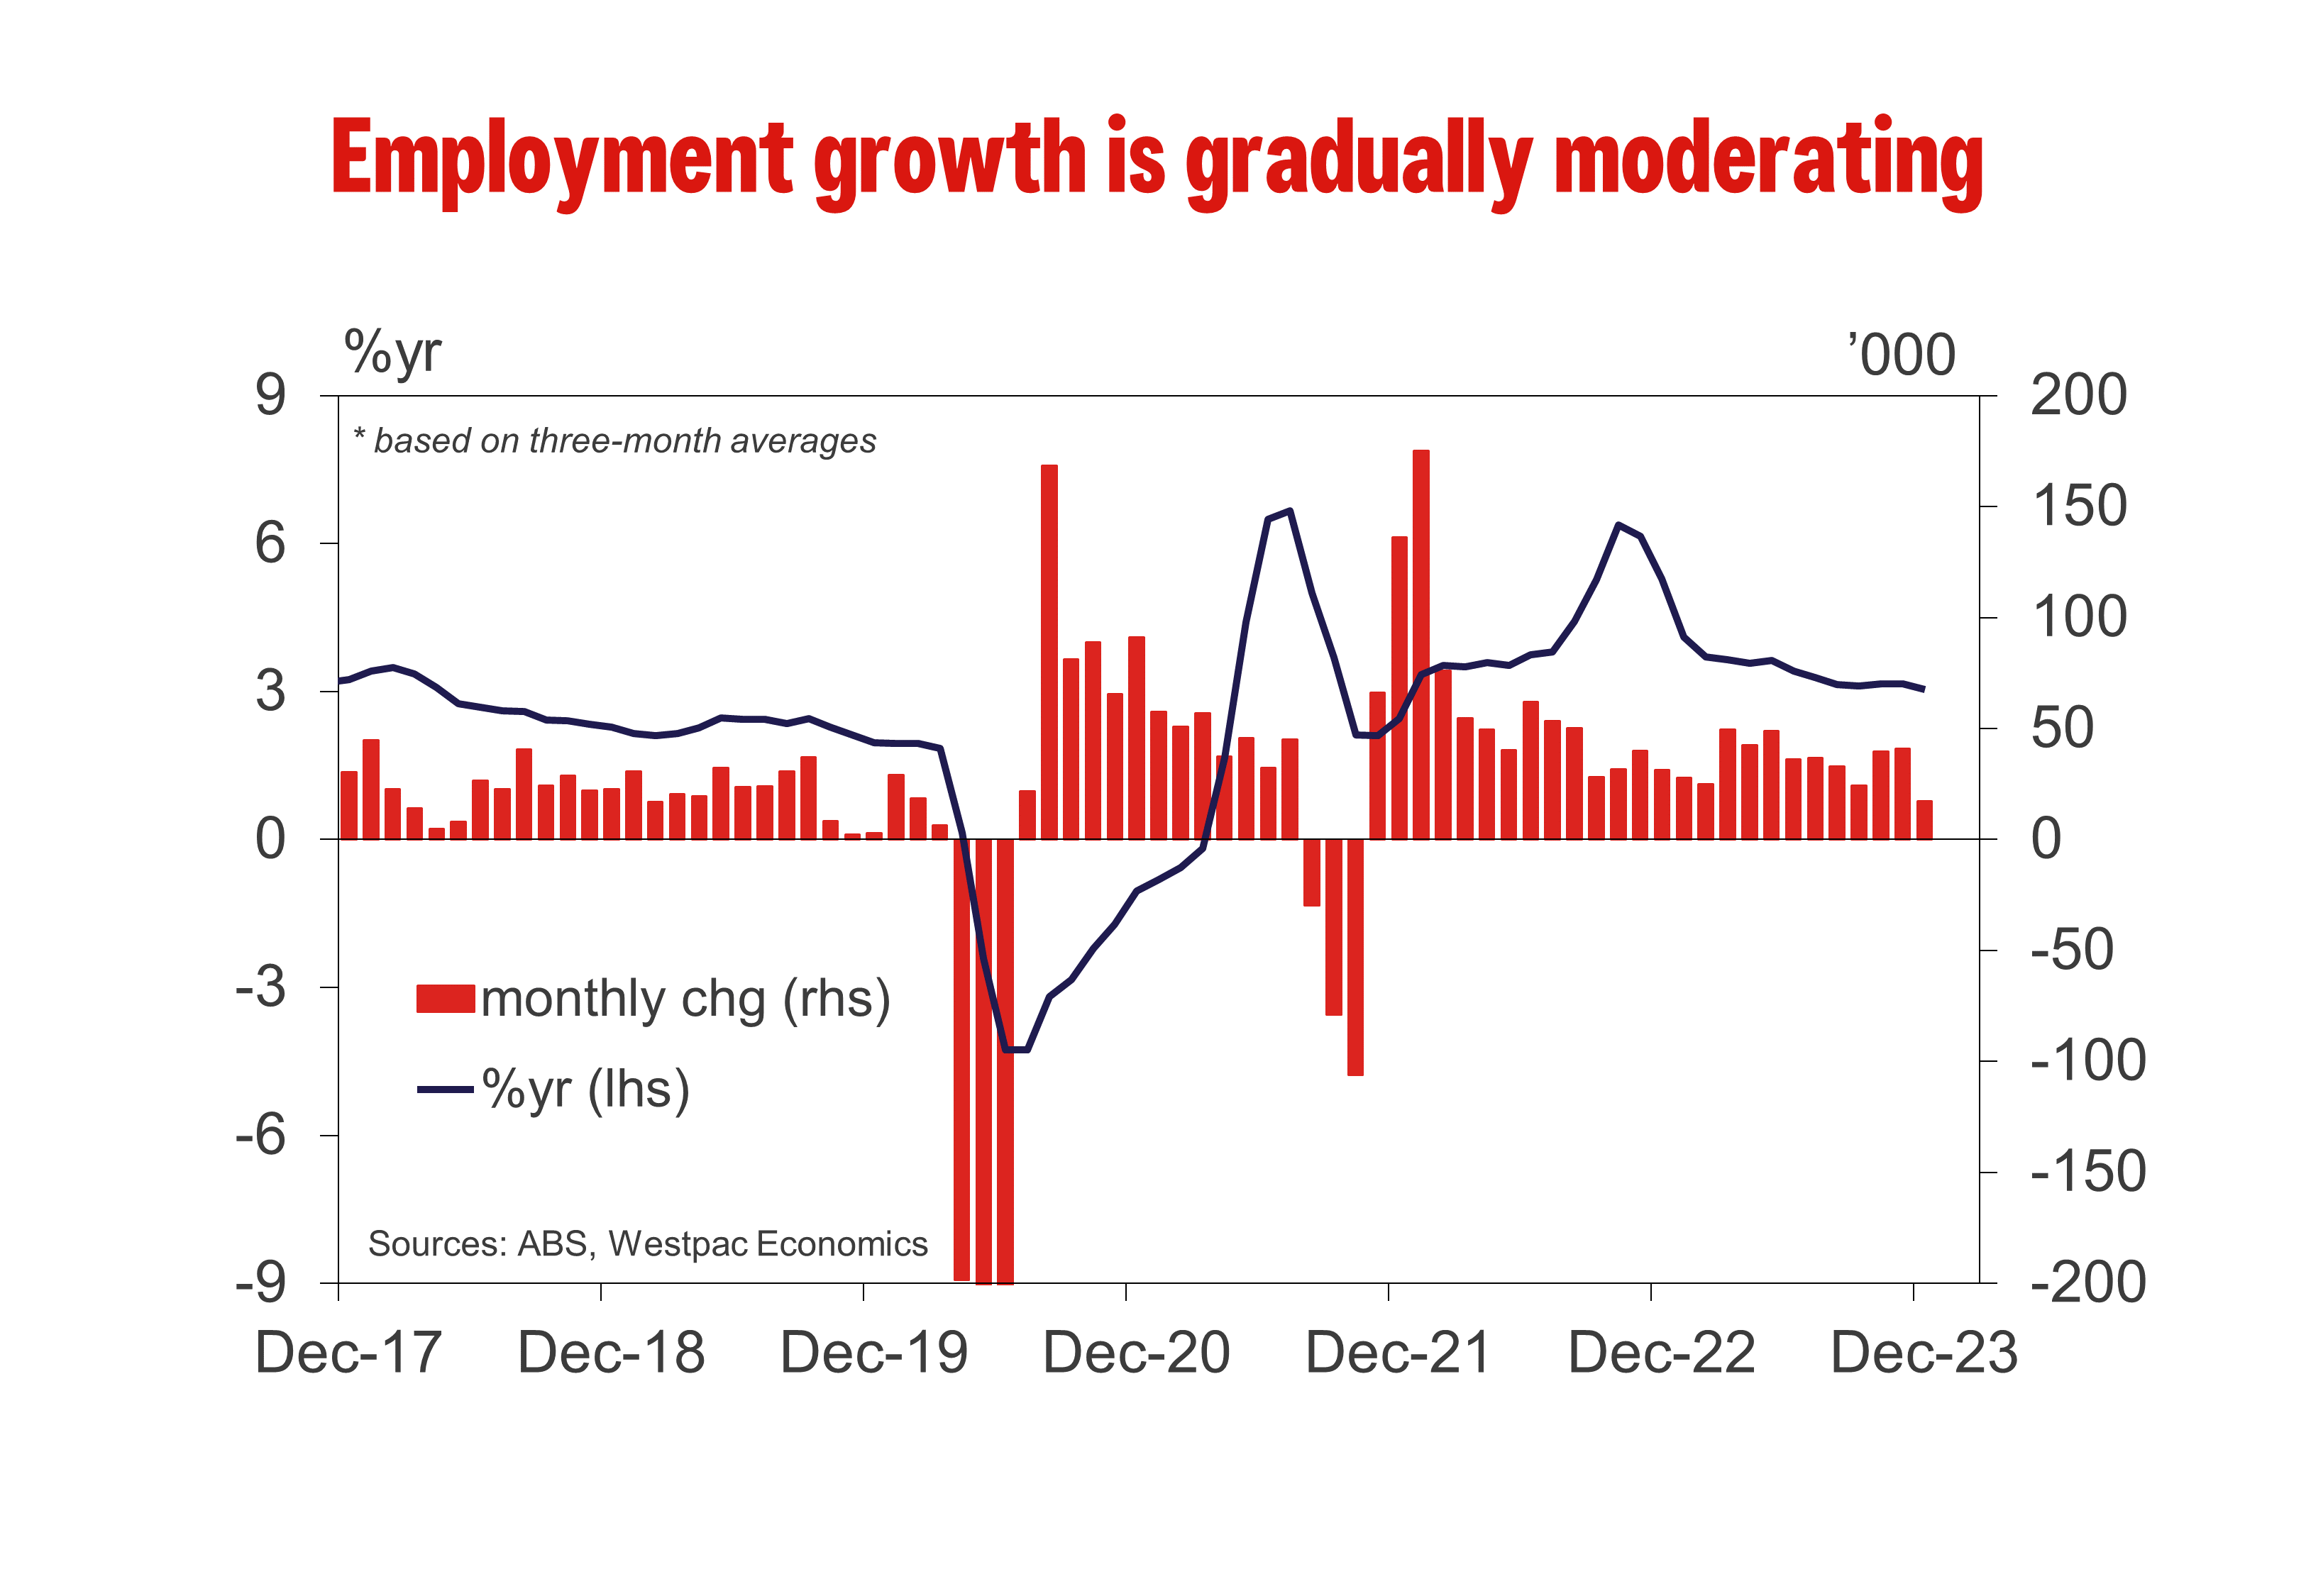
Looking through the monthly volatility though, employment growth has been tracking a monthly pace of 0.7% on a three-month rolling basis since September - lower than the pace of 0.9% recorded over the three months to June. This is consistent with a gradual slowing in employment growth and an unemployment rate that has begun to drift upwards into year-end.
The broader picture is of a labour market that is in transition, as softness begins to emerge after a period of historic tightness. Volatility aside, individuals are participating in the labour market at record rates amidst the trifecta of household income pressures – elevated inflation, sharply higher interest rates and an increasing tax burden.
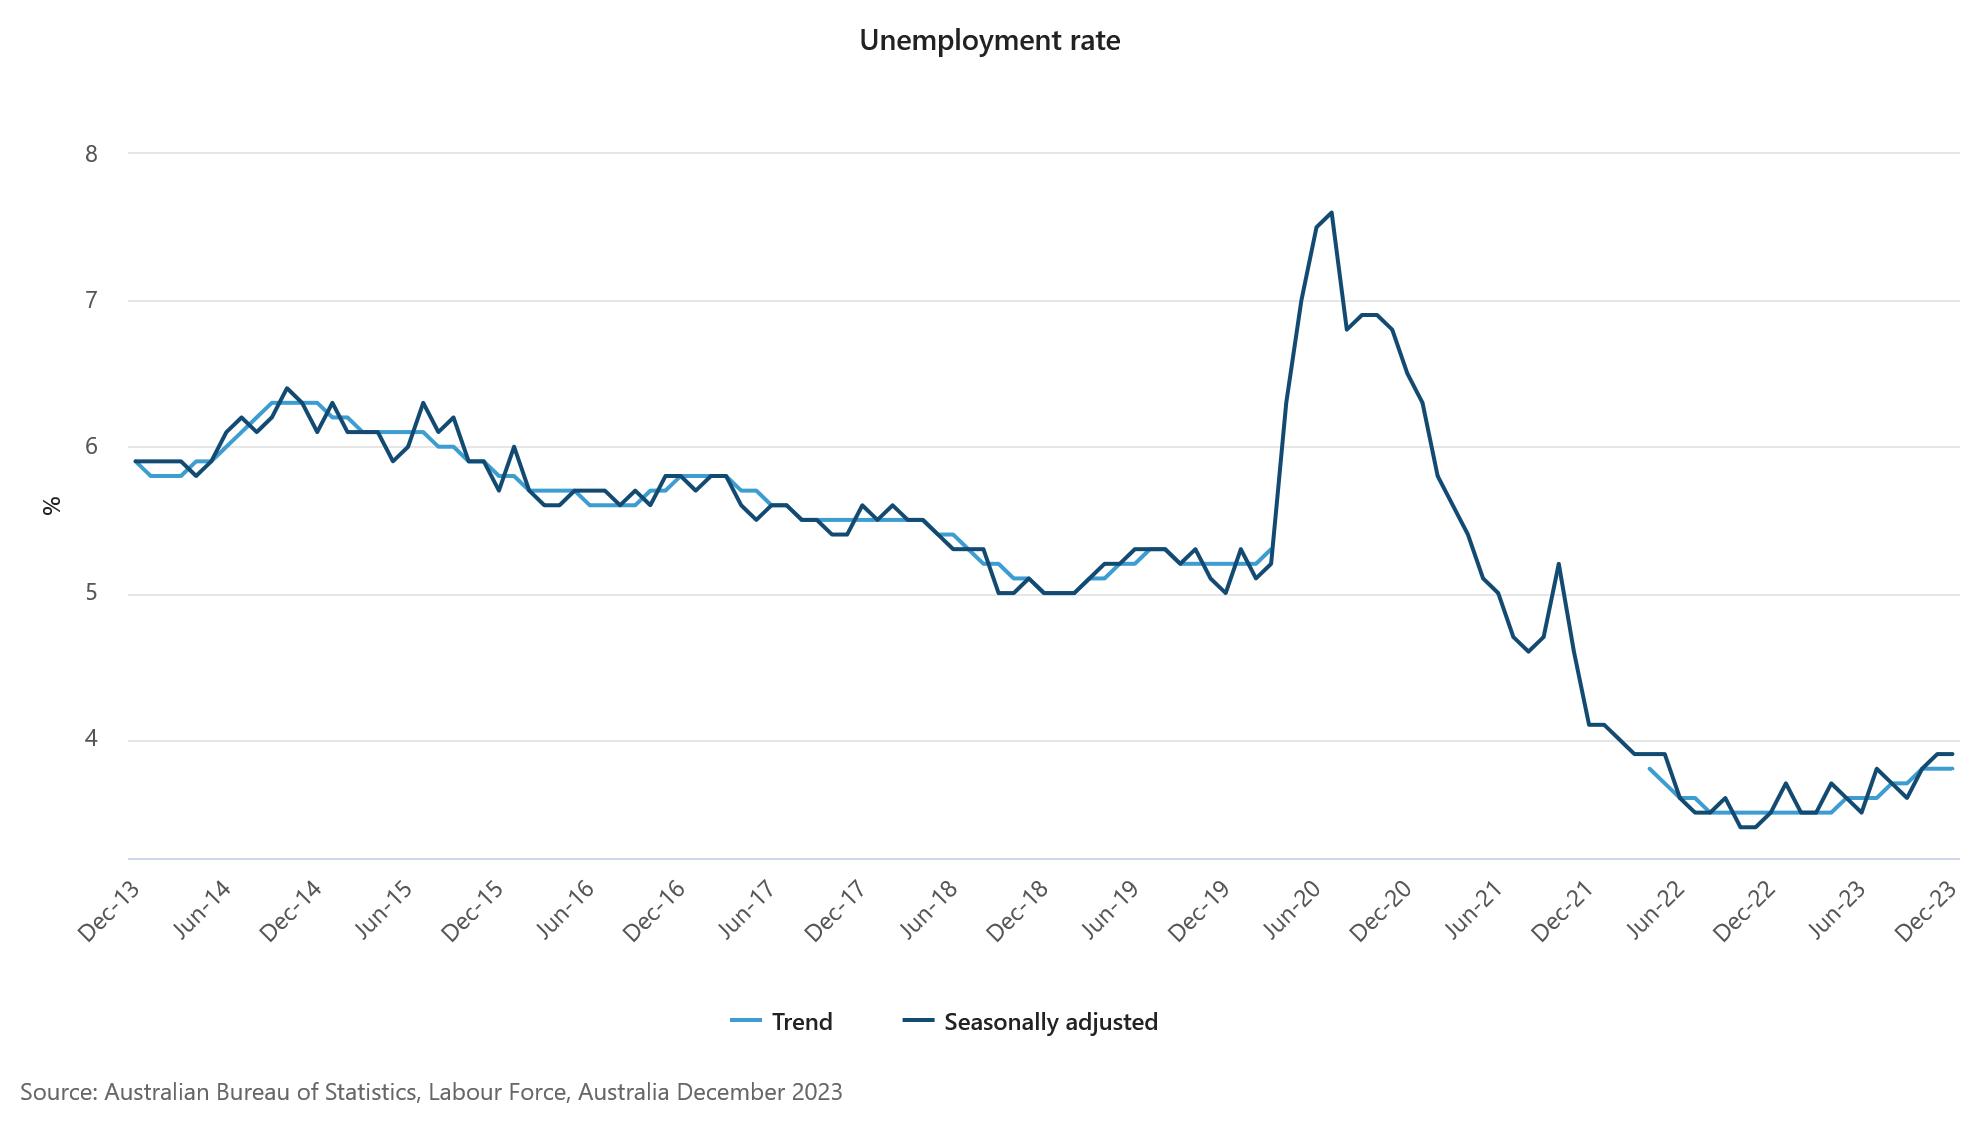
Unemployment Rate
There was little-change to the number of unemployed persons (–0.8k) in November despite the decline in employment (–65.1k). This implied a contraction in the size of the labour force (–66.0k), reflecting that many individuals decided to "exit" the labour force in the month. That resulted in the unemployment rate holding flat at 3.9% in December.
While the unemployment rate has been clearly trending higher over the last six months, it remains very low versus history, speaking to a tight labour market that is gradually easing. So far in this cycle, increases in the unemployment rate were largely a consequence of labour demand not being able to absorb all of the increase in labour supply, as opposed to an increase in layoffs and job losses. We expect that to broadly remain the case, with employment growth slowing as labour demand and supply come back into balance, seeing the unemployment rate continue to drift upwards.
Hours Worked
The number of hours worked declined by 0.5% over the month of December but was 1.2% higher than a year ago. There were particularly large monthly falls in Victoria (-0.9%), South Australia (-1.0%), and Tasmania (-0.8%).
The number of hours worked rebounded strongly as the economy opened from COVID-19 induced lockdowns. Employers responded to strong demand and emerging skill shortages by squeezing as many hours as possible from their workforce. This saw the share of full-time employment (those working 35hrs/wk or more) increase to be around 70.3% in March 2023.
As demand softened and skill shortages eased, the share of full-time employment has trended down. In December 2023, it was 68.9%, around 1.2 percentage points lower than a year ago, and trending toward the pre pandemic average of around 68.5%.
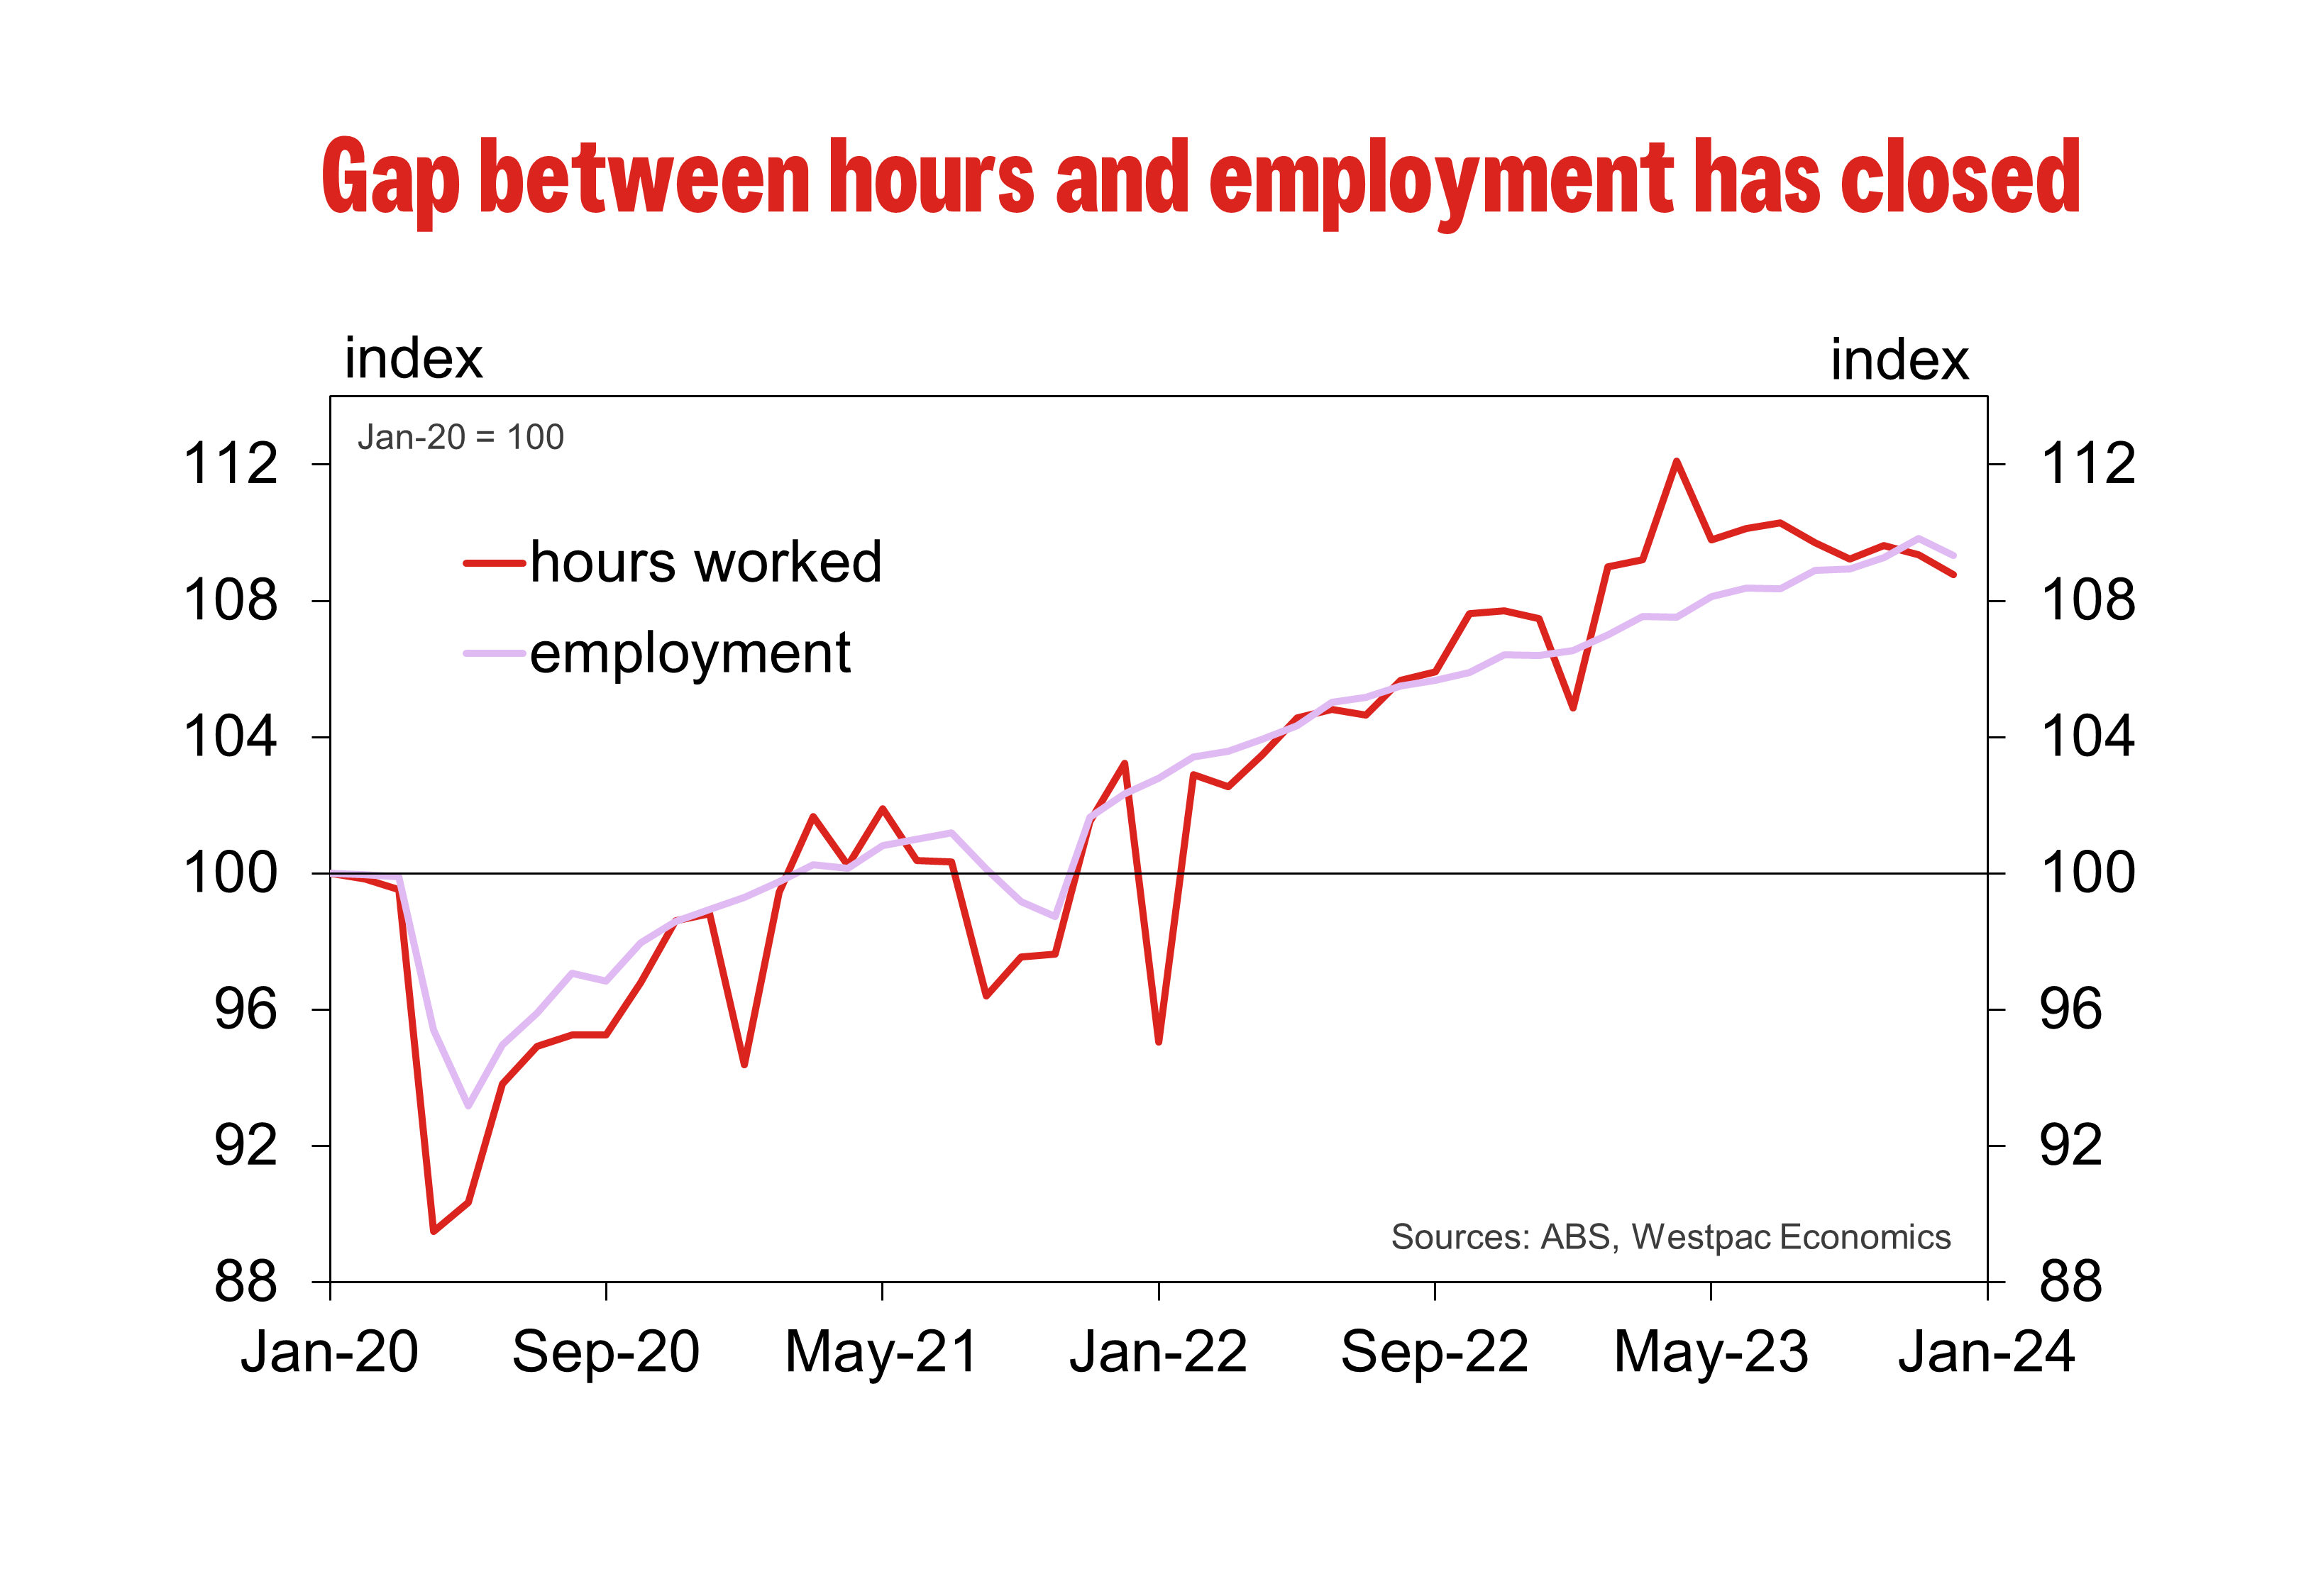
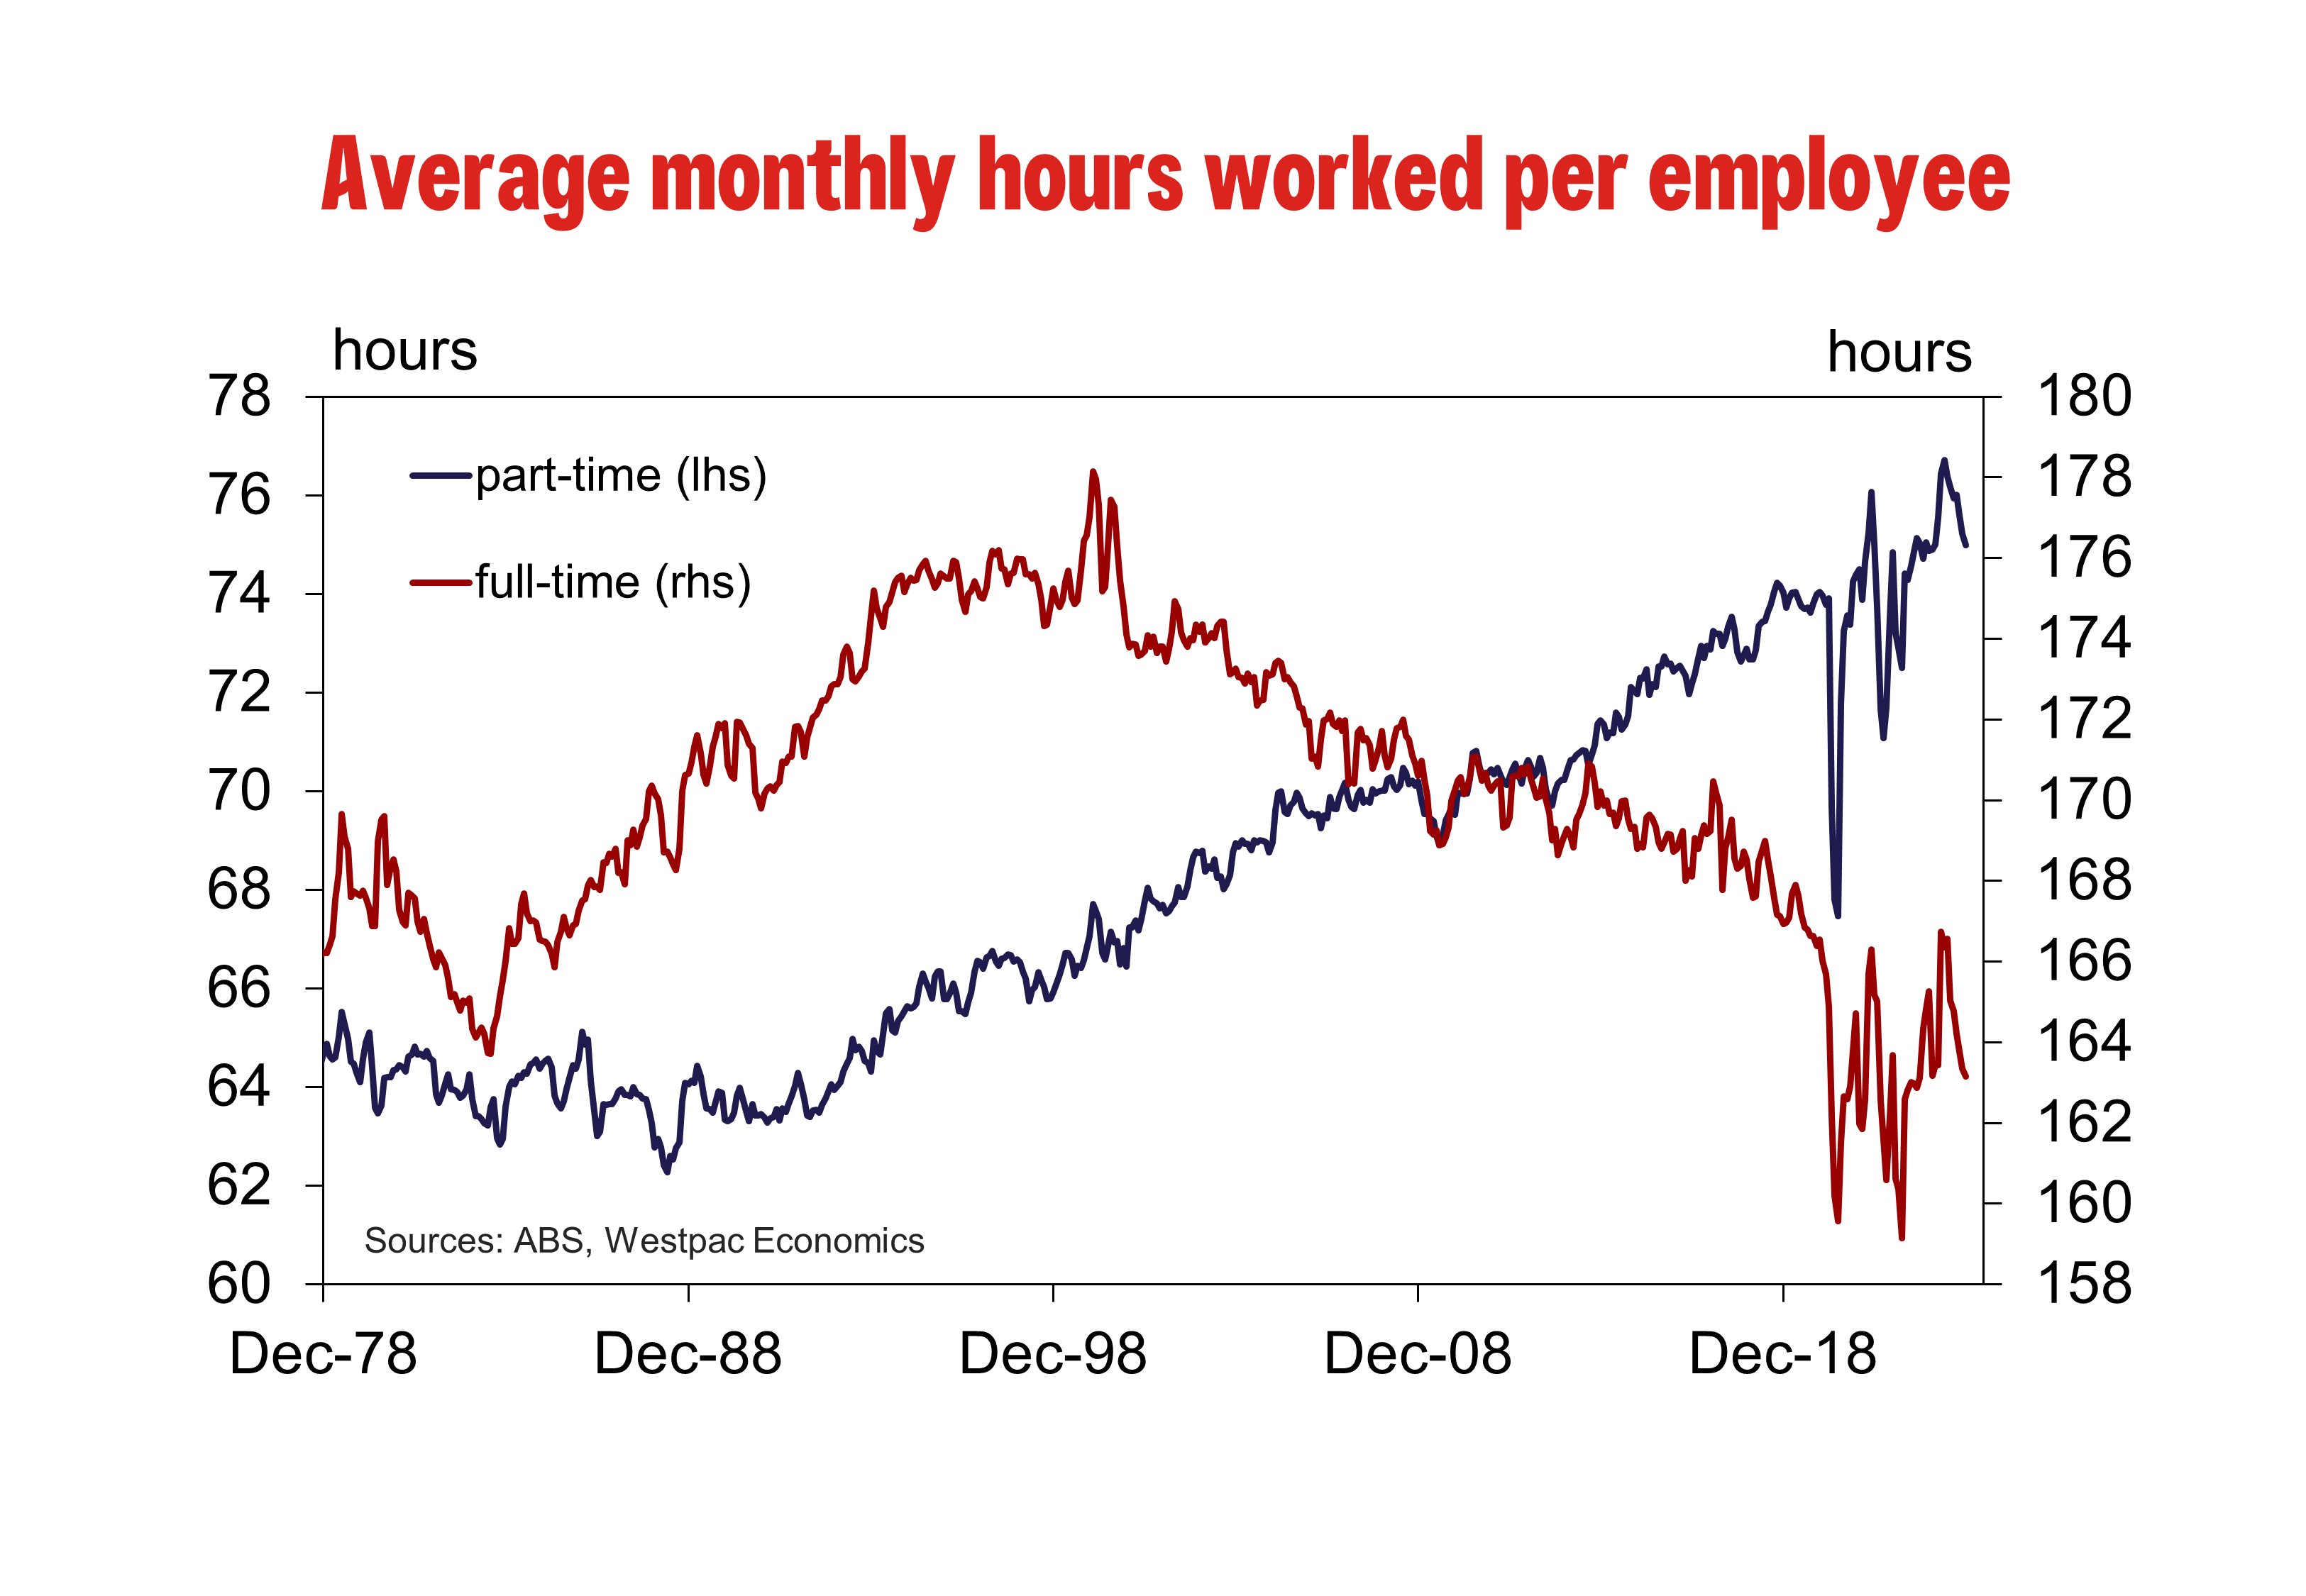
This has seen growth in the number of people employed catch up to, and now exceed, growth in the number of hours worked. It has also meant that there has been a fall in average hours worked, which is consistent with the rise in underemployment as more Australians indicate that they would like to work more hours. Average hours worked per employee fell 0.5% in the month and 1.8% in annual terms.
As the supply side of the economy continues to adjust from the COVID-19 shock and demand slows on the back of tighter macroeconomic policy, employers are likely to pull back on demand for labour. Given how tight the labour market has been during this cycle, employers are understandably wary of letting people go. Instead, they are likely to make this adjustment through demanding fewer hours of their employees.
Other Labour Market Measures
The underemployment rate, which measures the share of employed workers who are willing and able to work more hours, held flat at 6.5% in December. Underemployment has been trending upwards since before the unemployment rate started to do so. It is currently in line with the rate observed in August, which was the highest rate of underemployment since February 2022.
The underutilisation rate, which combines the unemployment and underemployment rates, also remained, at 10.4%.
The youth unemployment rate, which measures the share of unemployed workers between the ages of 15 and 24, fell from 9.7% in November to 9.5% in December. That said, the employment-to-population ratio for this segment has corrected sharply over the course of the year, from 66.5% in January to 63.5% in December. Being a highly elastic group to changes in labour demand, this provides another signal that softness in labour demand is emerging.
Outlook
Labour market conditions have clearly softened. While shifting seasonality has blurred the signal from the seasonally adjusted data, the underlying trend is clear: demand is slowing, while potential labour supply continues to grow. We are seeing labour demand slow when it comes to growth in employment, but more clearly through the number of hours worked.
As labour demand slows and labour supply increases, we expect employers to continue to adjust the number of hours worked. This has been quite stark when it comes to the share of full-time employment, which has fallen by around 1.2 percentage points compared with a year ago.
The cooling underway in the labour market is expected to continue as we move into 2024. A key risk here is how quickly economic growth is likely to slow. At this stage, we expect the slowing in the economy to be gradual.
But downside risks to growth cannot be ruled out. To date, the labour market has been a safety blanket for households experiencing intense cost of living pressures – the strong labour market has meant unemployed members of households could pick up a job, or employed members could pick up a second job or additional hours. Without this safety blanket, households may be forced to tighten their belts even further.
Bitcoin Price Turns Red And Could Revisit $40K
Key Highlights
- Bitcoin price trimmed most gains after the spot ETF approval.
- BTC traded below a key bullish trend line with support at $44,500 on the 4-hour chart.
- The price could extend losses if it stays below the $44,000 resistance zone.
- Ethereum is performing better and might aim for a move toward $2,750.
Bitcoin Price Technical Analysis
Bitcoin price peaked near the $49,000 level after the spot ETF approval by the SEC. BTC started a steady decline and traded below the $45,000 support zone.
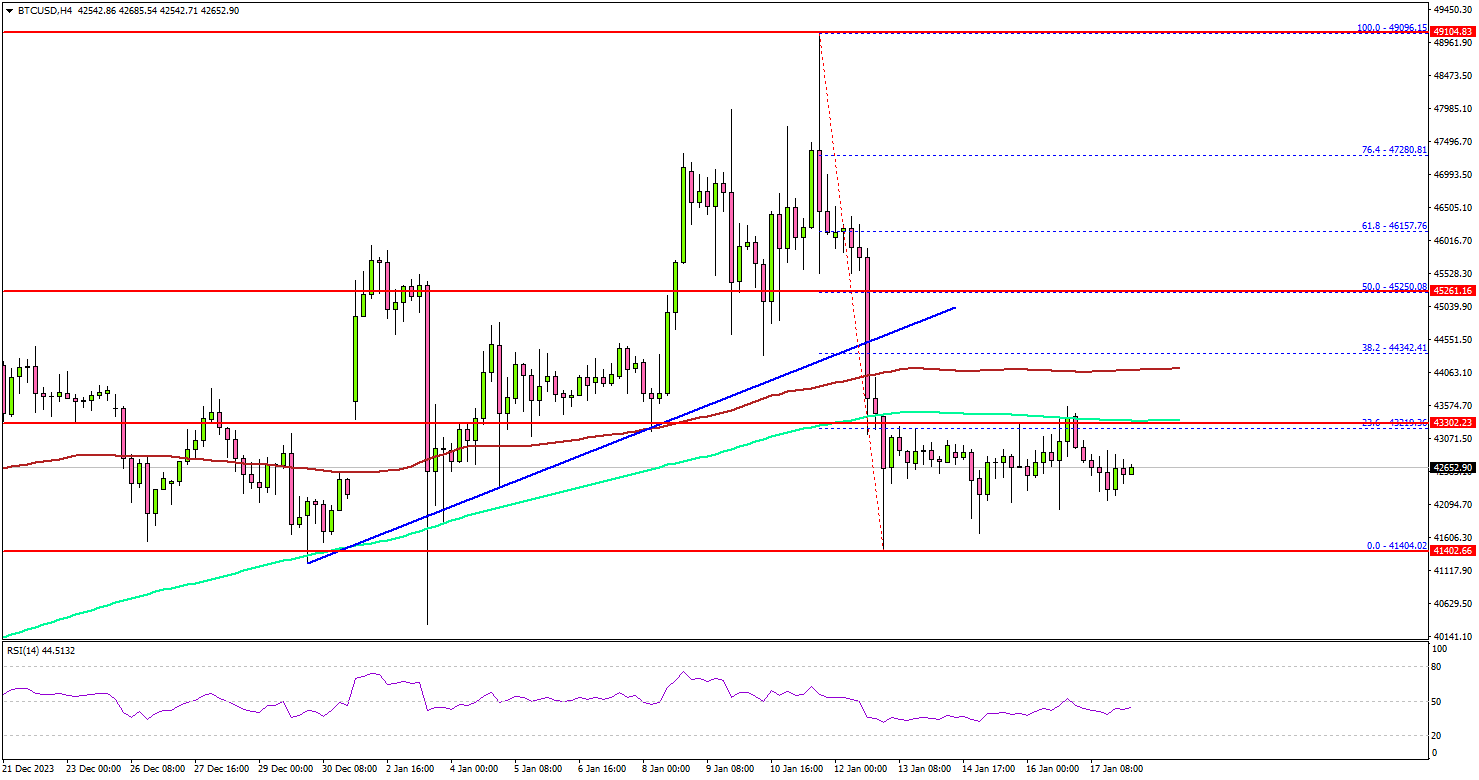
Looking at the 4-hour chart, the price traded below a key bullish trend line with support at $44,500. There was a close below the $44,000 level, the 100 simple moving average (red, 4 hours), and the 200 simple moving average (green, 4 hours).
Finally, it tested the $41,400 zone and started a consolidation phase. If there is a fresh increase, Bitcoin could face resistance near $43,800 or the 23.6% Fib retracement level of the downward move from the $49,096 swing high to the $41,404 low.
The next resistance is near $44,000. A successful close above the $44,000 level might start a decent increase. In the stated case, the price may perhaps rise toward the 50% Fib retracement level of the downward move from the $49,096 swing high to the $41,404 low at $45,250.
If not, the price might continue to move down. Immediate support is near the $41,400 level. The next major support is $40,500. Any more losses might send the price toward the $40,000 level.
Economic Releases
- US Initial Jobless Claims - Forecast 207K, versus 202K previous.
Japan’s core machinery orders decline -4.9% mom in Nov
Japan's core private-sector machinery orders fell notably by -4.9% mom in November, significantly below expectation of -0.8% mom. This decline marks the first downturn in three months and points to a potential slowdown in business investment. On a year-on-year basis, core machinery orders decreased -4.0% yoy, falling short of the anticipated 0.2% yoy increase.
The Japanese government has maintained its assessment that machinery orders have "stalled" for 13 consecutive months. This continued stagnation in machinery orders is particularly concerning as they are often regarded as a leading indicator of capital spending over the next six to nine months. The implication is that businesses might be exercising caution in their investment decisions, possibly due to uncertainty in the economic outlook or other external factors impacting their spending plans.
Breaking down the orders by sector, manufacturing industry saw substantial reduction in orders, with -7.8% mom drop. Service sector also recorded a slip in orders, down -0.4% mom.
Australia’s employment drops by 65.1K in Dec, following two months of robust growth
Australia had an unexpected contraction in employment in December, with a decrease of -65.1k jobs, significantly deviating from expectation of 15.4k. This decline was marked by a substantial drop in full-time employment by -106.6k, which was only partially offset by 41.4k increase in part-time jobs.
Despite this downturn in job creation, unemployment rate remained steady at 3.9%, aligning with expectations. Participation rate declined -0.4% to 66.8%. Additionally, there was -0.5% mom decrease in the total monthly hours worked.
David Taylor, ABS head of labour statistics, noted combined strong growth of 117k in October and November, and the fall in large contraction in December, "reflected changes in the timing of employment growth in the last few months of 2023, compared with earlier years."
Over the past twelve months, employment grew an average of 32k. Also, both the unemployment and underemployment rates remained relatively low and the participation rate and employment-to-population ratio relatively high. Taylor noted that suggests "the labour market remains tight."
Fed’s Beige Book: Widespread signs of slowing job market
Fed's Beige Book noted a majority of the 12 Districts observed "little to no change in economic activity". Of the districts that reported varying trends, three experienced "modest growth", while one district encountered a "moderate decline".
The Beige Book also noted positive consumer activity during the holiday season. Most districts met retail expectations, with three districts exceeding them.
In terms of employment, the report presents a mixed picture. Seven districts reported "little or no net change" in employment levels, while four districts experienced "modest to moderate" job growth. Importantly, "nearly all districts" cited signs of a "cooling labor market", signaling a potential shift or slowdown in hiring and employment growth across the country.
Price dynamics also varied among the districts. Six districts noted "slight or modest price increases", and two reported "moderate increases". Five districts observed that the rate of price increases had "subsided" somewhat compared to the previous period. Three other districts did not report any significant change in price pressures.
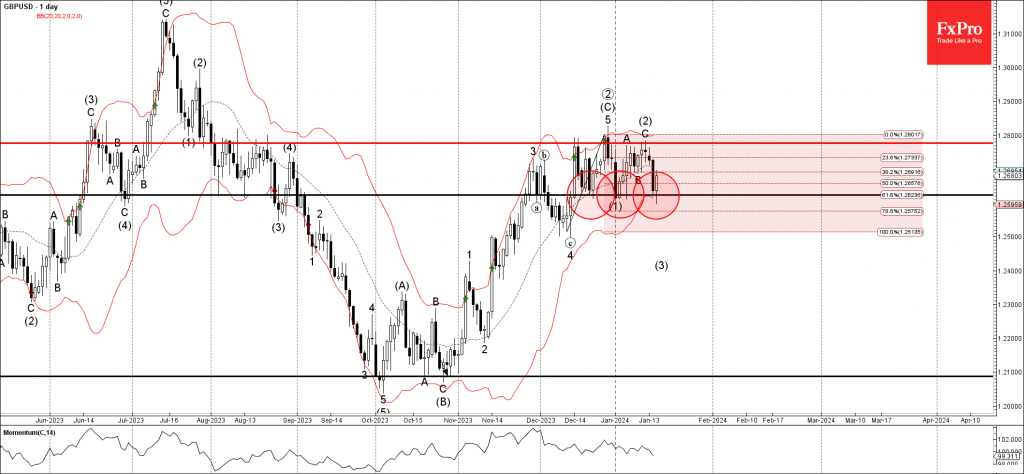
GBPUSD Wave Analysis
- GBPUSD reversed from support level 1.2620
- Likely to rise to resistance level 1.2775
GBPUSD currency pair recently reversed up from the key support level 1.2620 (which has been repeatedly reversing the price from the middle of December).
The support level 1.2620 was strengthened by the lower daily Bollinger Band and by the 61.8% Fibonacci correction of the previous upward impulse 5 from December.
Given the strength of the support level 1.2620, GBPUSD can be expected to rise further to the next resistance level 1.2775 (which stopped the previous waves (C), A and (2)).
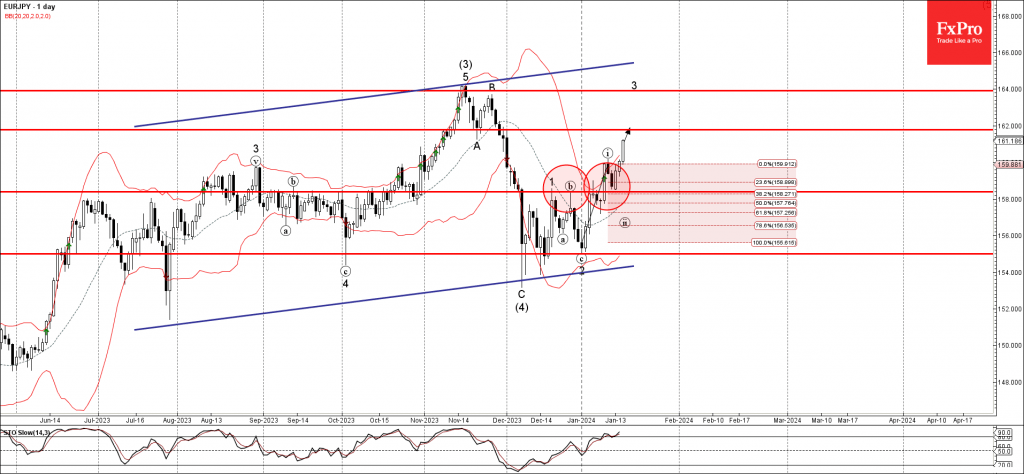
EURJPY Wave Analysis
- EURJPY reversed from key support level 158.40
- Likely to rise to resistance level 162.00
EURJPY currency pair recently reversed up from the key support level 158.40 (former resistance from last month, acting as the support after it was broken).
The support level 158.40 was strengthened by the 38.2% Fibonacci correction of the previous sharp upward impulse from December.
Given the strong daily uptrend and widespread euro optimism, EURJPY can be expected to rise further to the next resistance level 162.00.