
Sample Category Title
USD/JPY Daily Outlook
Daily Pivots: (S1) 144.78; (P) 145.31; (R1) 146.29; More...
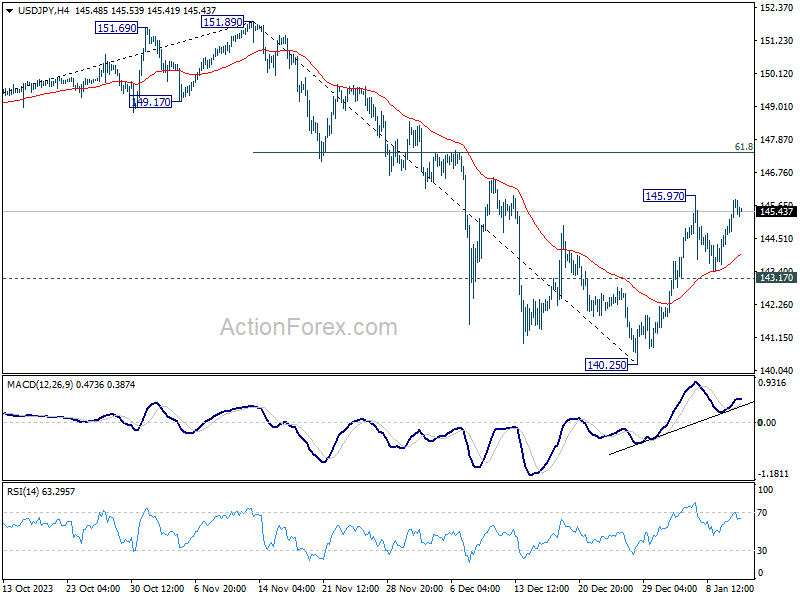
Range trading continues in USD/JPY below 145.97 and intraday bias remains neutral. On the upside, above 145.97 will resume the rebound from 140.25. But upside should be limited by 61.8% retracement of 151.89 to 140.25 at 147.44. On the downside, below 143.17 minor support will turn bias back to the downside for retesting 140.25 low.
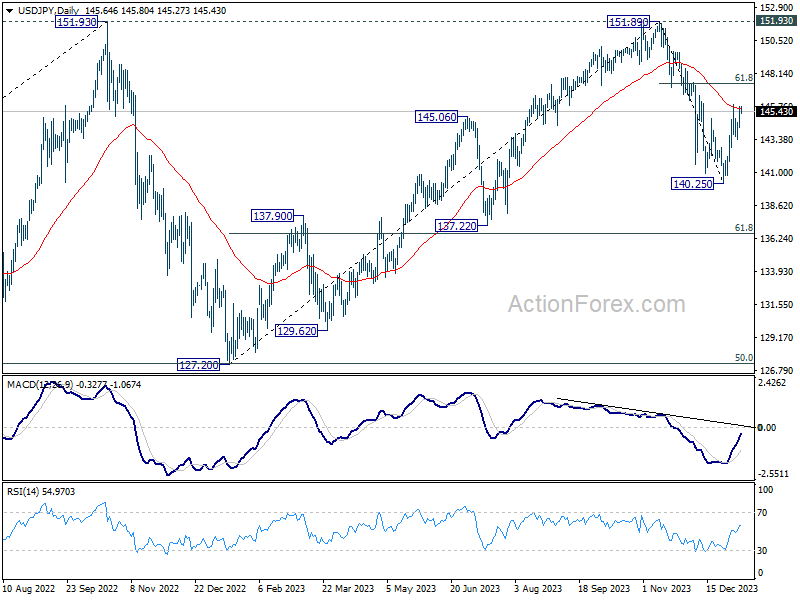
In the bigger picture, for now, fall from 151.89 is still seen as the third leg of the corrective pattern from 151.89. Another decline through 140.25 will target 61.8% retracement of 127.20 to 151.89 at 136.63. Sustained break there will pave the way to 127.20 support (2022 low). However, firm break of 147.44 fibonacci resistance will dampen this view and bring retest of 151.89 instead.
USD/CHF Daily Outlook
Daily Pivots: (S1) 0.8498; (P) 0.8518; (R1) 0.8528; More....
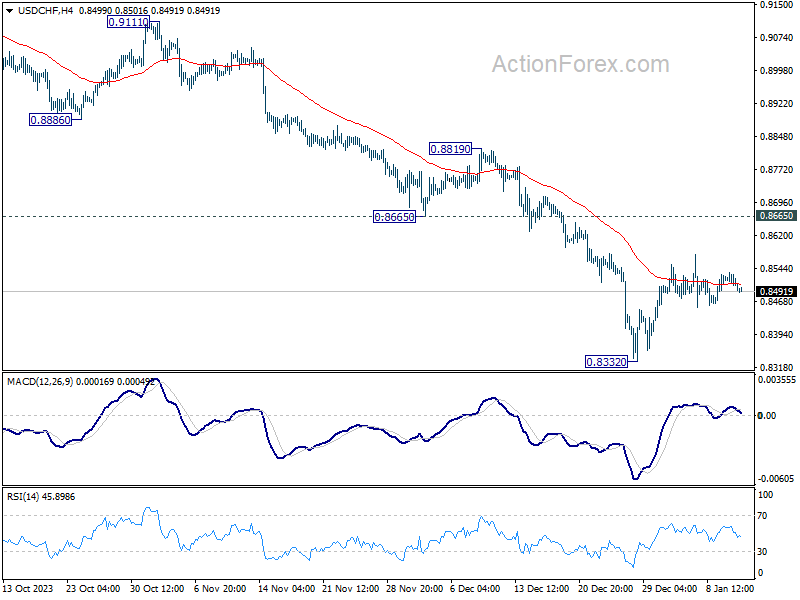
USD/CHF is still extending the consolidation from 0.8332 and intraday bias remains neutral. Stronger recovery cannot be ruled out. But outlook will stay bearish as long as 0.8665 support turned resistance holds. On the downside, break of 0.8332 will resume larger fall from 0.9243 to 0.8257 projection level.
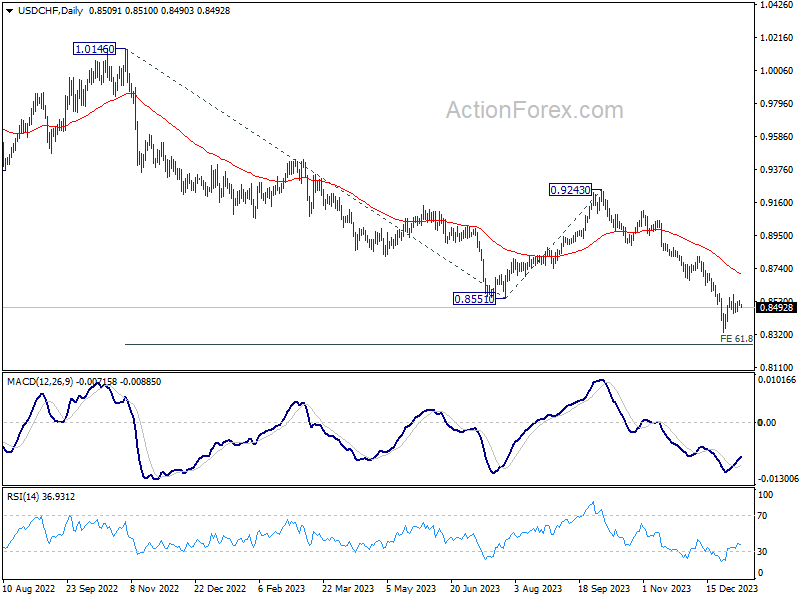
In the bigger picture, the down trend from 1.0146 (2022 high) is in progress. Next target is 61.8% retracement of 1.0146 to 0.8551 from 0.9243 at 0.8257. Sustained break there could prompt downside acceleration to 100% projection at 0.7648. This will now remain the favored case as long as 0.8819 resistance holds.
GBP/USD Daily Outlook
Daily Pivots: (S1) 1.2704; (P) 1.2724; (R1) 1.2762; More...
Intraday bias in GBP/USD remains neutral as range trading is still in progress. On the upside, decisive break of 1.2826 high will resume whole rally from 1.2036. Nevertheless, break of 1.2611 will bring deeper correction to 1.2499 support instead.
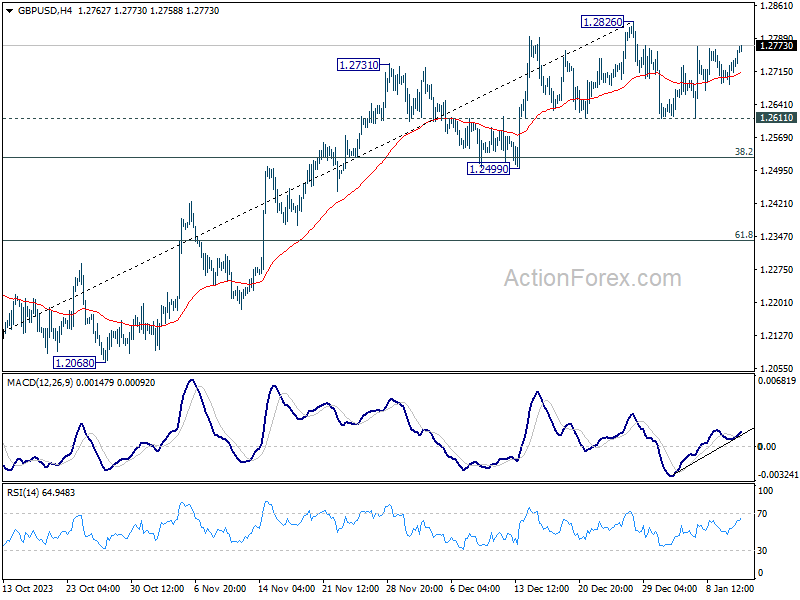
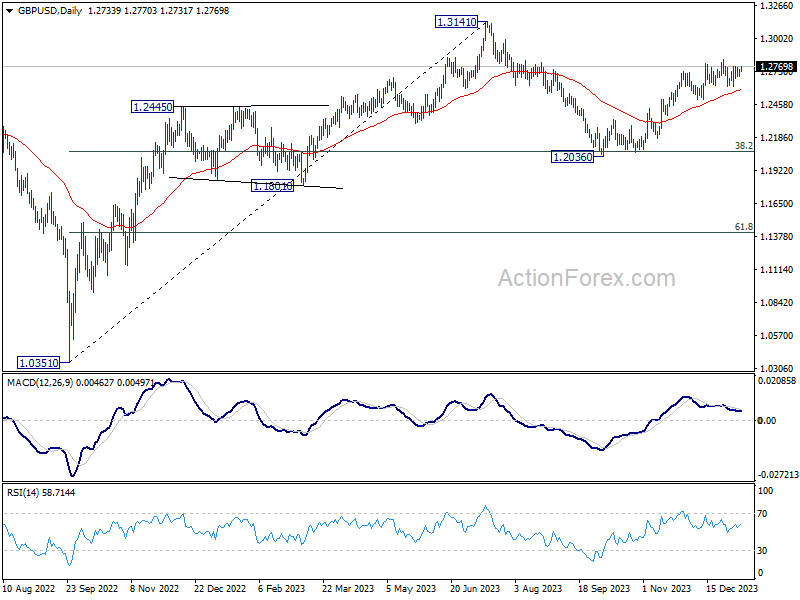
In the bigger picture, price actions from 1.3141 medium term top are seen as a corrective pattern to up trend from 1.0351 (2022 low). Rise from 1.2036 is seen as the second leg that's in progress. Upside should be limited by 1.3141 to bring the third leg of the pattern. Meanwhile, break of 1.2499 support will argue that the third leg has already started for 38.2% retracement of 1.0351 (2022 low) to 1.3141 at 1.2075 again.
EUR/USD Daily Outlook
Daily Pivots: (S1) 1.0939; (P) 1.0957; (R1) 1.0990; More...
EUR/USD recovers mildly overnight and stays firm in Asian session. Nevertheless, it's still capped below 1.0997 minor resistance. Intraday bias stays neutral at this point. On the downside break of 1.0876 will resume the fall from 1.1138 short term top to 1.0722 support next. However, break of 1.0997 will turn bias back to the upside for retesting 1.1138 high instead.
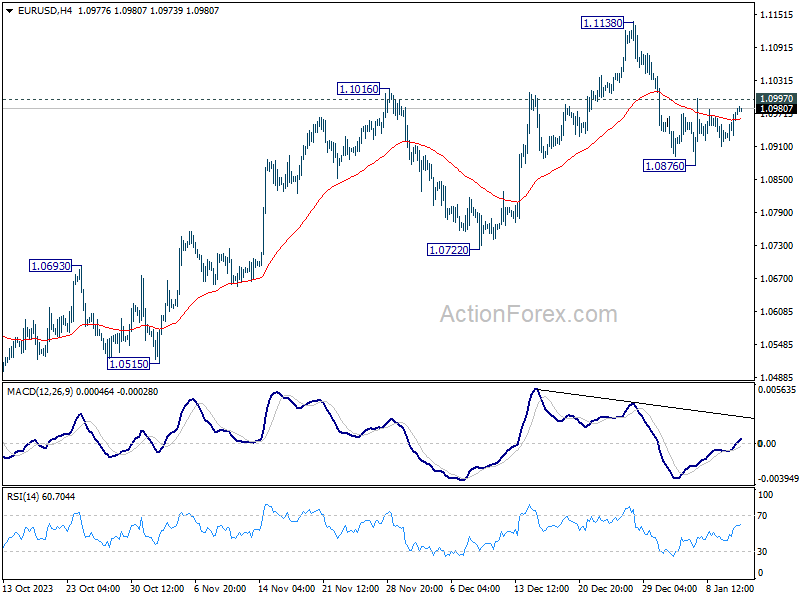
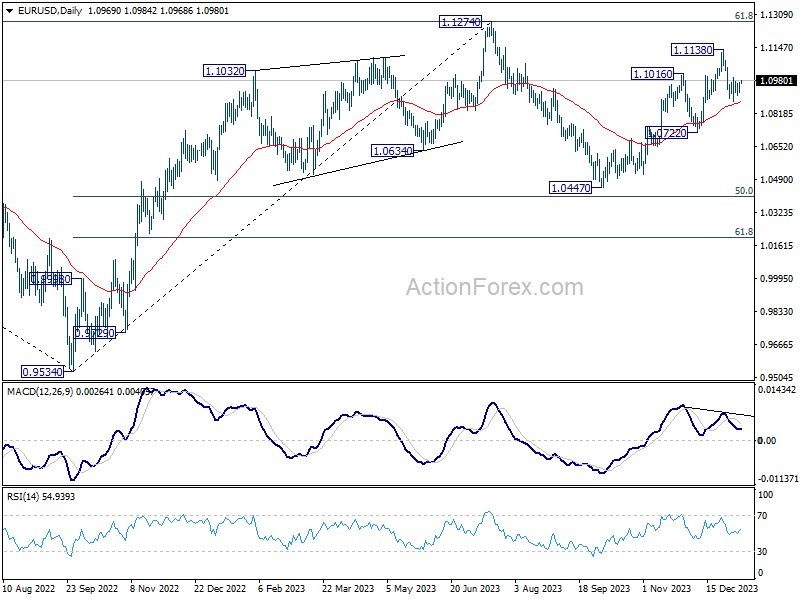
In the bigger picture, price actions from 1.1274 are viewed as a corrective pattern to rise from 0.9534 (2022 low). Rise from 1.0447 is seen as the second leg. While further rally could cannot be ruled out, upside should be limited by 1.1274 to bring the third leg of the pattern. Meanwhile, sustained break of 1.0722 support will argue that the third leg has already started for 1.0447 and below.
Dollar Softens as Market Anticipates US Inflation Data, Assessing Rate Cut Prospects
Dollar saw notable decline against most major currencies, maintaining its softer tone in the Asian trading session today, with the exception of its performance against Yen. This selloff amidst a backdrop of improving risk sentiment, reflected by the uptick in major US stock indexes. Investors' attention is now squarely focused on the forthcoming release of US inflation data for December, which is poised to significantly influence market expectations and monetary policy forecasts.
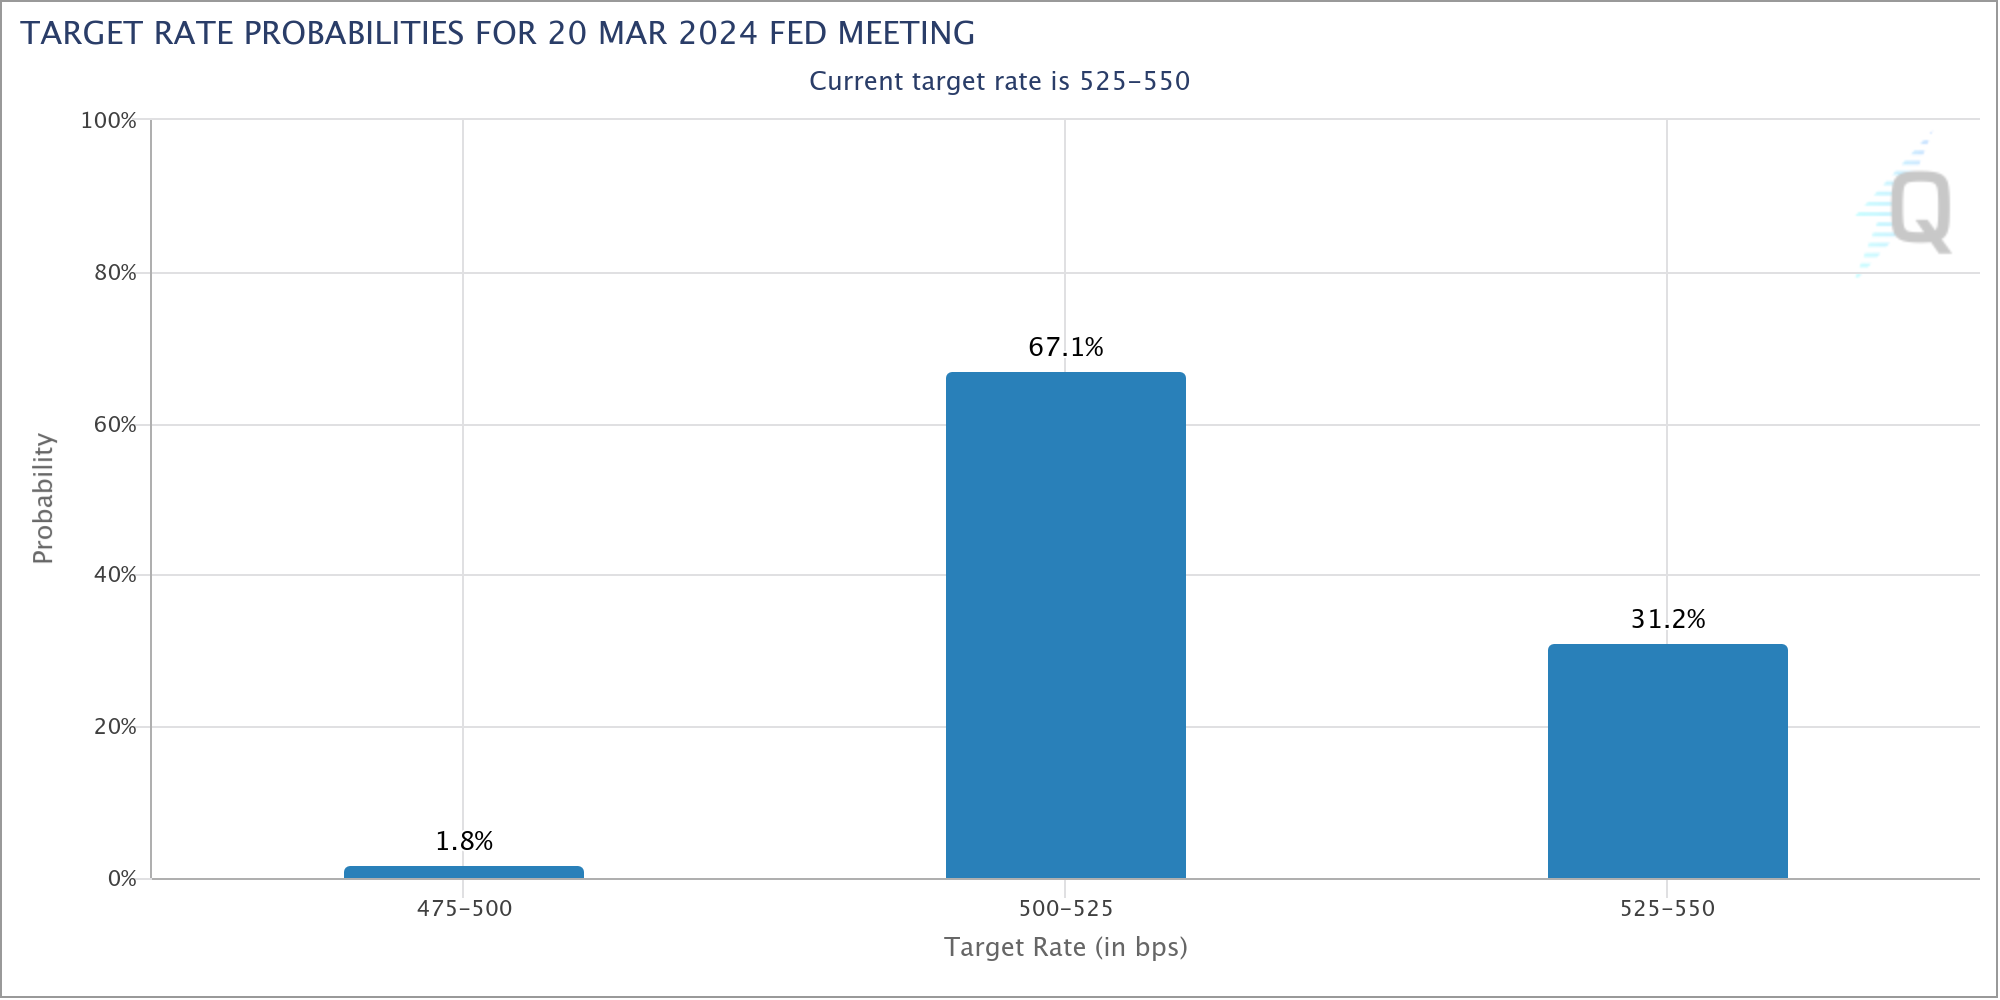
US headline CPI is expected to show a marginal increase in from 3.1% to 3.2%. More critically, the core CPI, is anticipated to demonstrate further deceleration from 4% to 3.8%. Investors and analysts will parse through these numbers to gauge when Fed might initiate a cycle of rate cuts. Recent market movements suggest a slight pullback in expectations for early rate reductions. Current projections from Fed funds futures are indicating just under 70% likelihood of a 25 bps rate cut in March. However, this sentiment remains fluid and subject to change, especially if CPI data diverges from forecasts.
In the broader currency market, Yen continues its streak as the weakest performer of the week, with Dollar and Canadian Dollar following suit. Conversely, British Pound has emerged as a front-runner, exhibiting considerable strength, closely trailed by Euro. Australian and New Zealand Dollars are also showing signs of resilience, though they are yet to demonstrate robust momentum. Swiss Franc finds itself in a neutral position, exhibiting mixed performance.
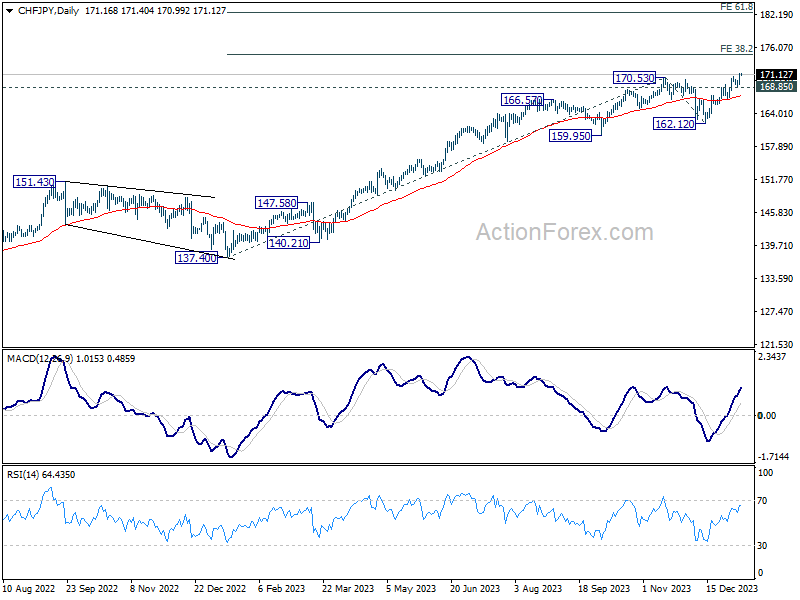
Technically, CHF/JPY's up trend continued this week, with another rally yesterday following broad-based weakness in Yen. Further rally is now expected as long as 168.85 support holds. Next target is 38.2% projection of 137.40 to 170.53 from 162.12 at 174.77. Firm break there could prompt upside acceleration to 61.8% projection at 182.59.
In Asia, Nikkei closed up 1.84%, making another 3-decade high. Hong Kong HSI is up 1.98%. China Shanghai SSE is up 0.43%. Singapore Strait Times is up 0.61%. Japan 10-year JGB yield is up 0.0202 at 0.607. Overnight, DOW rose 0.45%. S&P 500 rose 0.57%. NASDAQ rose 0.75%. 10-year yield rose 0.011 to 4.030.
Fed's Williams on inflation progress: Our work is not done
New York Fed President John Williams acknowledged the "meaningful progress" made in balancing the economy and "bringing inflation down." But he also emphasized that the Fed's is far from over with the assertion. "Our work is not done" he said in a speech overnight.
Williams highlighted the need for continued restrictive stance in monetary policy "for some time". He added, "it will only be appropriate to dial back the degree of policy restraint when we are confident that inflation is moving toward 2% on a sustained basis."
Addressing the economic outlook, Williams described it as "highly uncertain" and stressed that Fed's policy decisions will be made on a meeting-by-meeting basis. These decisions will be grounded in "the totality of the incoming data, the evolving outlook, and the balance of risks."
Williams refrained from predicting when a rate cut might occur, stating, "I'm not making a prediction." However, he also noted that the Fed is currently in a "good place" to assimilate incoming data and deliberate on future policy moves.
ECB's de Cos warns of policy transmission strength and economic uncertainty
ECB Governing Council member Pablo Hernandez de Cos highlighted the surprising strength of monetary policy transmission and cautioned that this could lead to lower growth. Despite the current economic downturn, de Cos emphasized the need for ECB to remain vigilant to avoid the pitfalls of "insufficient tightening" and "unnecessarily harming activity and employment."
De Cos described the current state of economic activity in Europe as showing "clear weakness," with expectations of only a gradual increase in dynamism. He also highlighted that "risks to economic growth remain skewed to the downside," pointing to geopolitical developments as a key factor.
Additionally, de Cos was surprised by the strength of the monetary policy's impact, saying, "The transmission of monetary policy has been surprising us for its strength, which, if extended in the coming years, would translate into lower growth."
Looking forward, de Cos emphasized the need for careful monitoring of various developments that could influence inflation and, consequently, ECB's monetary policy actions. He asserted, "We'll have to pay attention in the coming months to different developments that may condition the trajectory of inflation and, therefore, our monetary policy action."
BoJ Regional Report: Mixed economic recovery and varied wage hike plans
BoJ's latest Regional Economic Report noted that all nine regions have experienced an uptick in their economies, albeit with variations in pace and extent. This improvement is happening despite challenges posed by the global economic slowdown and domestic price increases. The report categorizes the regional economies as either picking up, recovering moderately, or steadily improving.
Notably, Tokai and Kyushu-Okinawa regions received upgrades in their economic assessments. Kinki region, on the other hand, was downgraded, noted for showing "some weakness in part."
Regarding wages, BoJ report highlights a divergence in approaches among firms. It acknowledges that "some big firms have already announced plans to hike wages this year at or above the pace of last year," suggesting a proactive response to inflation and economic recovery.
However, the situation is not uniform across all business sizes. The report points out that "many firms have yet to firm up their plans on the pace of wage hikes." This uncertainty is particularly pronounced among small and medium-sized enterprises, which remain cautious about increasing wages due to profit constraints.
OECD calls for BoJ rate hike and flexible YCC
OECD has suggested that BoJ should consider implementing a gradual rise in short-term interest rates and introduce more flexibility into its Yield Curve Control policy. This recommendation comes at a time when Japan appears to be at a crucial economic juncture, with inflation trends potentially stabilizing around BoJ's 2% target, a goal set in 2013 but not consistently achieved since then.
In its report, OECD stated, "Japan is at a turning point, with inflation more likely to settle durably around the 2% inflation target than at any time since its inception." To adapt to this changing economic landscape, OECD advised that "greater flexibility in the conduct of yield curve control and a gradual modest increase in the short-term policy interest rate are warranted." This advice is predicated on projections of sustained inflation and evolving wage dynamics in Japan.
However, OECD also issued a cautionary note regarding the uncertainty surrounding Japan's inflation outlook, which it described as "exceptionally large." This uncertainty presents a significant challenge for BoJ as it navigates toward its inflation target. OECD emphasized the delicate balance BoJ must maintain, stating, "The key challenge facing the BoJ is how to durably achieve its inflation target without significantly overshooting."
Looking ahead
ECB's monthly economic bulletin and Italy industrial production will be released in European session. Later in the day, US CPI will take center stage while jobless claims will be published too.
EUR/USD Daily Outlook
Daily Pivots: (S1) 1.0939; (P) 1.0957; (R1) 1.0990; More...
EUR/USD recovers mildly overnight and stays firm in Asian session. Nevertheless, it's still capped below 1.0997 minor resistance. Intraday bias stays neutral at this point. On the downside break of 1.0876 will resume the fall from 1.1138 short term top to 1.0722 support next. However, break of 1.0997 will turn bias back to the upside for retesting 1.1138 high instead.
In the bigger picture, price actions from 1.1274 are viewed as a corrective pattern to rise from 0.9534 (2022 low). Rise from 1.0447 is seen as the second leg. While further rally could cannot be ruled out, upside should be limited by 1.1274 to bring the third leg of the pattern. Meanwhile, sustained break of 1.0722 support will argue that the third leg has already started for 1.0447 and below.
Economic Indicators Update
| GMT | Ccy | Events | Actual | Forecast | Previous | Revised |
|---|---|---|---|---|---|---|
| 21:45 | NZD | Building Permits M/M Nov | -10.60% | 8.70% | 8.50% | |
| 00:30 | AUD | Trade Balance (AUD) Dec | 11.44B | 7.50B | 7.13B | 7.66B |
| 05:00 | JPY | Leading Economic Index Nov P | 107.7 | 107.9 | 108.9 | |
| 09:00 | EUR | ECB Economic Bulletin | ||||
| 13:30 | USD | Initial Jobless Claims (Jan 5) | 215K | 202K | ||
| 13:30 | USD | CPI M/M Dec | 0.20% | 0.10% | ||
| 13:30 | USD | CPI Y/Y Dec | 3.20% | 3.10% | ||
| 13:30 | USD | CPI Core M/M Dec | 0.20% | 0.30% | ||
| 13:30 | USD | CPI Core Y/Y Dec | 3.80% | 4.00% | ||
| 15:30 | USD | Natural Gas Storage | -120B | -14B |
BoJ Regional Report: Mixed economic recovery and varied wage hike plans
BoJ's latest Regional Economic Report noted that all nine regions have experienced an uptick in their economies, albeit with variations in pace and extent. This improvement is happening despite challenges posed by the global economic slowdown and domestic price increases. The report categorizes the regional economies as either picking up, recovering moderately, or steadily improving.
Notably, Tokai and Kyushu-Okinawa regions received upgrades in their economic assessments. Kinki region, on the other hand, was downgraded, noted for showing "some weakness in part."
Regarding wages, BoJ report highlights a divergence in approaches among firms. It acknowledges that "some big firms have already announced plans to hike wages this year at or above the pace of last year," suggesting a proactive response to inflation and economic recovery.
However, the situation is not uniform across all business sizes. The report points out that "many firms have yet to firm up their plans on the pace of wage hikes." This uncertainty is particularly pronounced among small and medium-sized enterprises, which remain cautious about increasing wages due to profit constraints.
Technical Outlook and Review
DXY:
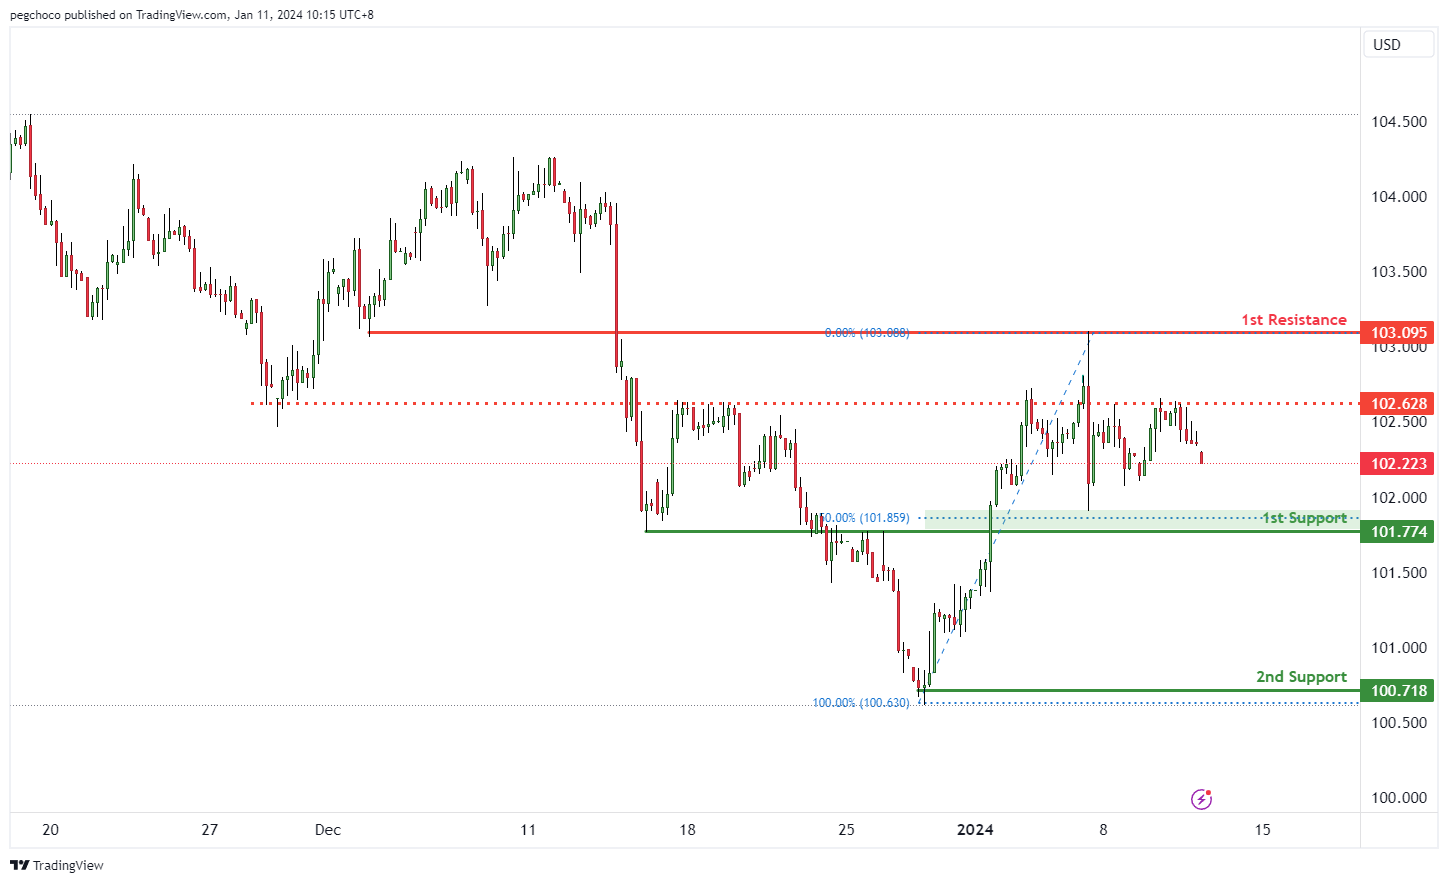
The DXY chart currently exhibits a bearish overall momentum, indicating a weakened US Dollar. In this scenario, there’s potential for a bearish continuation towards the 1st support level.
The 1st support at 101.77 is significant for several reasons. It is categorized as an overlap support and coincides with the 50% Fibonacci Retracement level, making it a strong potential support zone. This level may serve as a point where buying interest could potentially emerge, providing temporary support for the DXY.
The 2nd support at 100.71 is identified as a swing low support, further reinforcing its significance as a potential support area.
On the resistance side, the 1st resistance at 103.09 is marked as an overlap resistance, indicating a potential barrier where selling interest could intensify.
Intermediate resistance at 102.62 is also categorized as an overlap resistance, further supporting the idea of potential resistance in the short term.
EUR/USD:
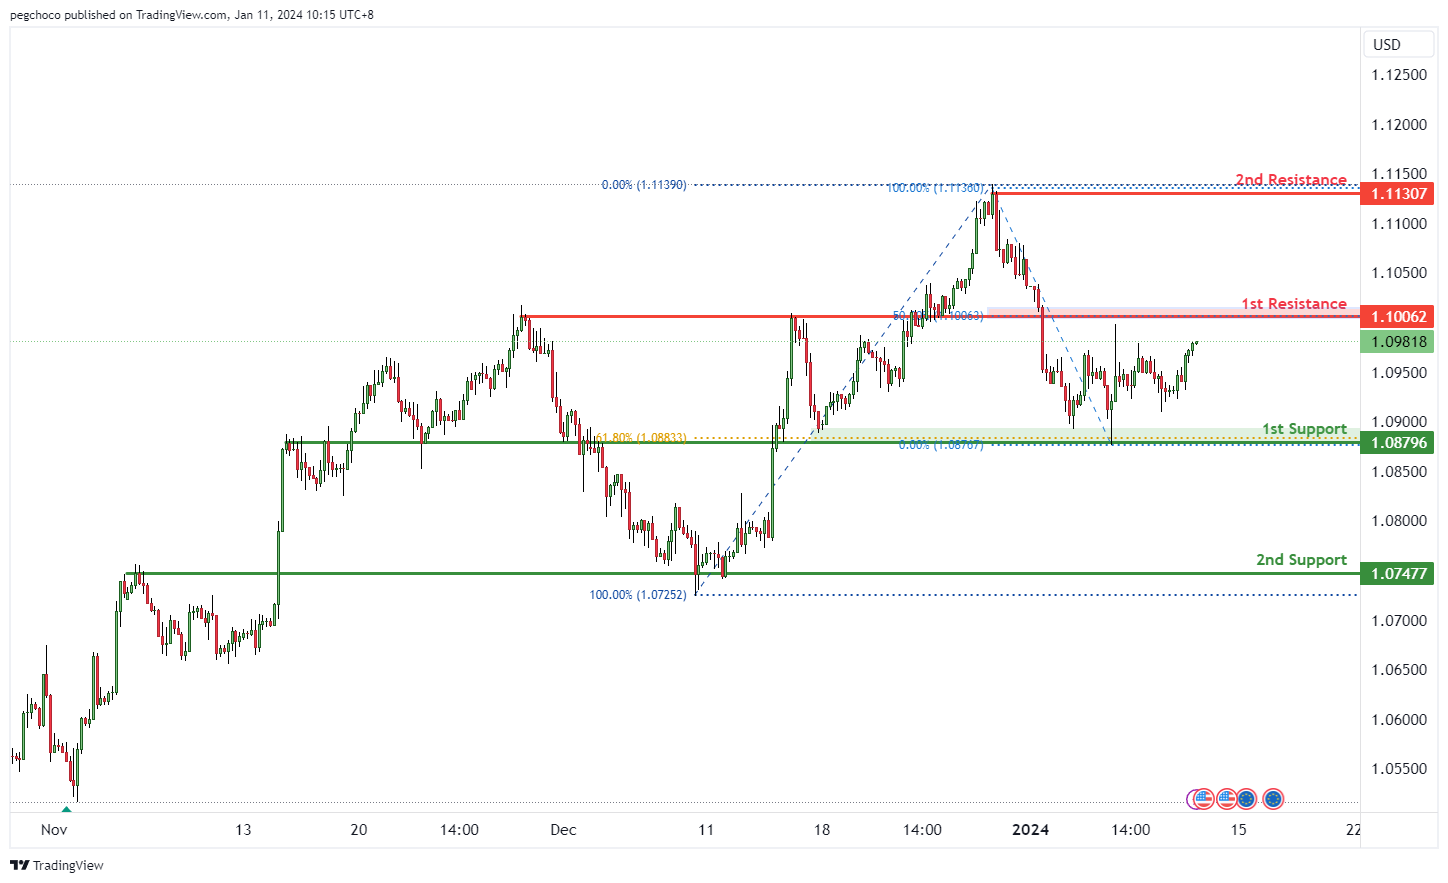
The EUR/USD chart currently has a bullish overall momentum, indicating strength in the Euro relative to the US Dollar.
In the short term, there’s potential for a bullish continuation towards the 1st resistance level.
The 1st support at 1.0879 is significant for several reasons. It is an overlap support, and it also aligns with the 61.80% Fibonacci Retracement level.
The 2nd support at 1.0747 is identified as an overlap support, further reinforcing its significance as a potential support area.
On the resistance side, the 1st resistance at 1.1006 is categorized as an overlap resistance.
The 2nd resistance at 1.1130 is considered a swing high resistance, often marking points of reversal or resistance in price movement.
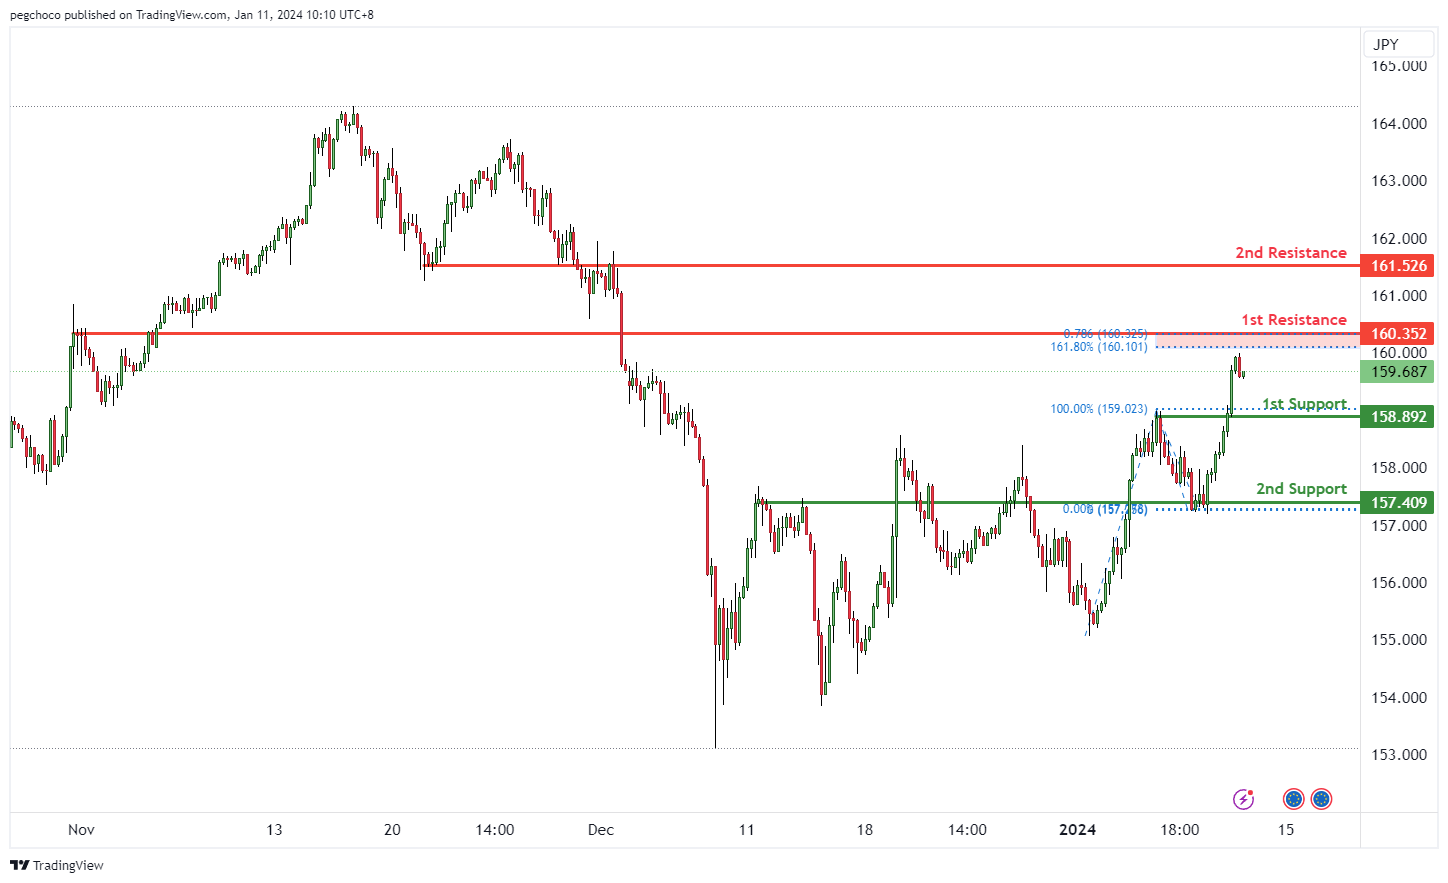
EUR/JPY:
The EUR/JPY chart currently displays a bearish overall momentum, indicating weakness in the Euro compared to the Japanese Yen. This momentum suggests the potential for a bearish reaction off the 1st resistance level.
The 1st support at 158.89 is considered a pullback support, and it coincides with the 50% Fibonacci Retracement level. This confluence of factors makes it a noteworthy level where selling pressure may ease, offering temporary support for EUR/JPY.
The 2nd support at 157.40 is identified as an overlap support, underscoring its significance as a potential area where buyers could step in.
On the resistance side, the 1st resistance at 169.35 is classified as a pullback resistance, indicating a level where the price may encounter selling interest or potential reversal.
The 2nd resistance at 161.52 is characterized as an overlap resistance, adding to its importance as a potential barrier to the price’s upward movement.
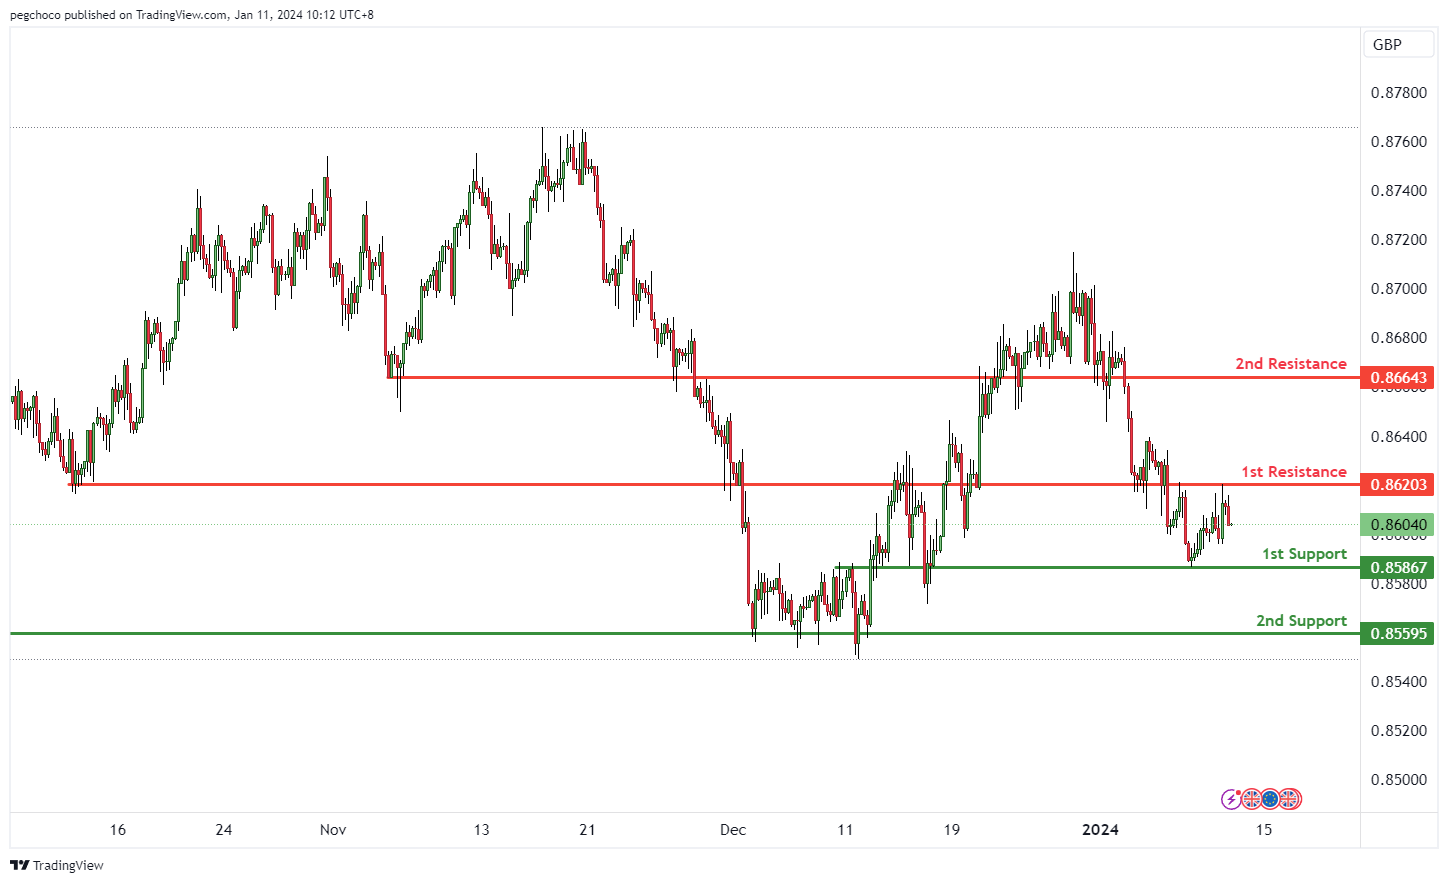
EUR/GBP:
The EUR/GBP chart is currently showing a bearish overall momentum, indicating a preference for the British Pound over the Euro. This momentum suggests the potential for a bearish continuation towards the 1st support level.
The 1st support at 0.8586 is classified as an overlap support, signifying its significance as a potential level where buying interest may emerge, providing temporary support for EUR/GBP.
The 2nd support at 0.8559 is characterized as multi-swing low support, further reinforcing its importance as a potential support zone.
On the resistance side, the 1st resistance at 0.8620 is identified as an overlap resistance, suggesting a level where selling pressure or a potential reversal may occur.
The 2nd resistance at 0.8664 is categorized as a pullback resistance, underscoring its significance as a potential barrier to the price’s upward movement.
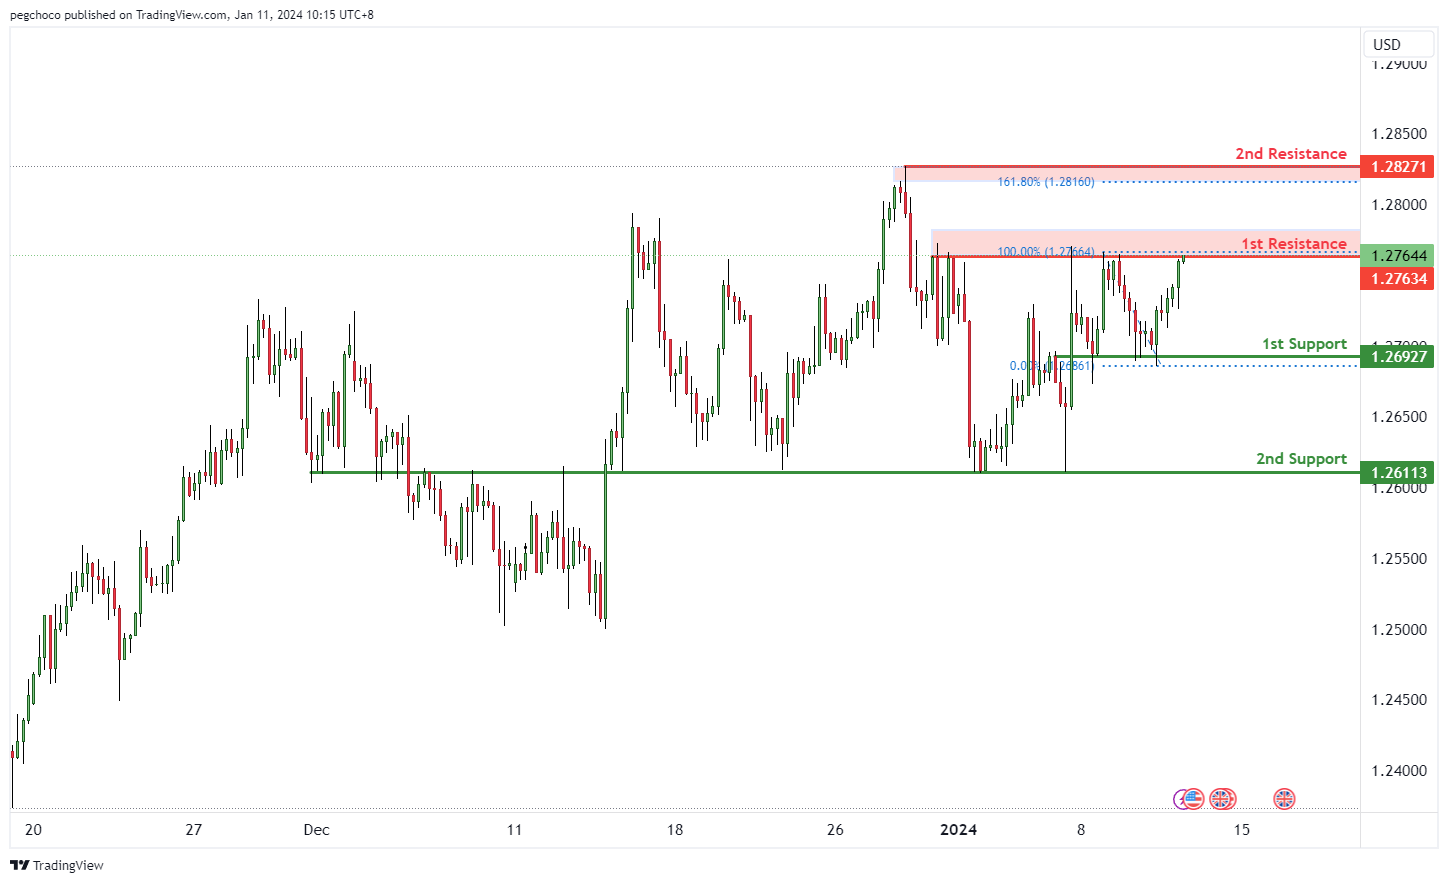
GBP/USD:
The GBP/USD chart currently has a bullish overall momentum, suggesting that the British Pound is stronger compared to the US Dollar.
In the short term, there’s potential for the price to drop further to the 1st support level before bouncing from there and rising to the 1st resistance.
The 1st support at 1.2692 is considered a significant level as it is an overlap support.
The 2nd support at 1.2611 is also identified as an overlap support, reinforcing its significance as a potential support zone.
On the resistance side, the 1st resistance at 1.2763 is categorized as a multi-swing high resistance, which often represents a strong barrier where selling interest may emerge.
The 2nd resistance at 1.2827 is noted as a swing high resistance, further indicating a potential point of reversal or resistance in price movement.
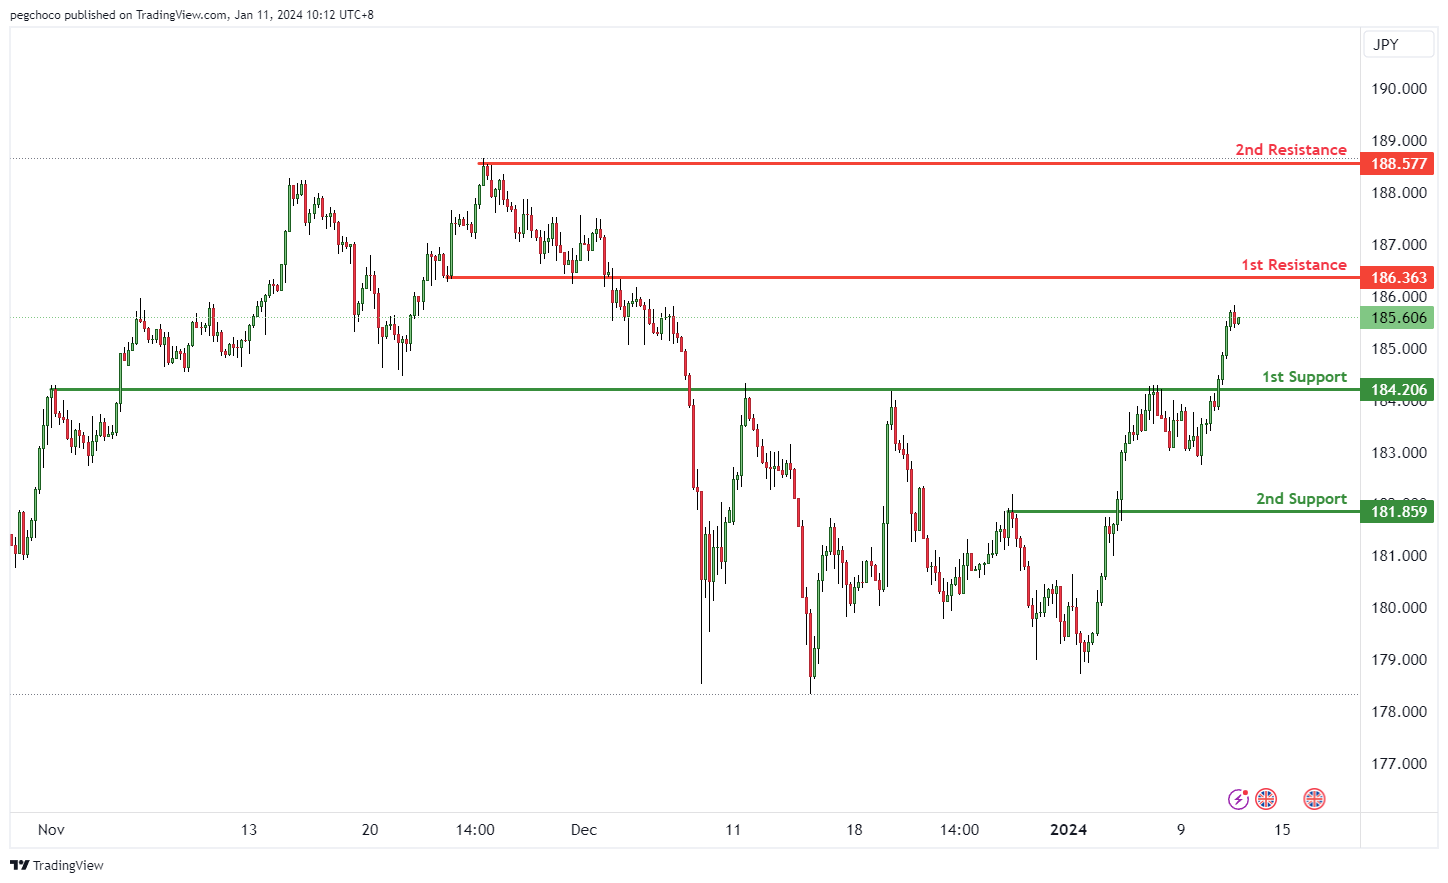
GBP/JPY:
The GBP/JPY (British Pound/Japanese Yen) chart currently demonstrates a bullish overall momentum, suggesting that the British Pound is displaying strength relative to the Japanese Yen.
Traders should be aware of the potential for a bullish continuation towards the 1st resistance level in this market.
The 1st support at 184.20 is considered significant as it aligns with a pullback support level, indicating a potential area where buyers might step in and provide temporary support for the GBP/JPY pair.
A 2nd support level at 181.85 is also identified as a pullback support, further reinforcing its significance as a potential support area.
On the resistance side, the 1st resistance at 186.36 is categorized as an overlap resistance, which could act as a barrier to upward price movement.
The 2nd resistance at 188.57 is described as a swing high resistance, making it another potential area of resistance for the GBP/JPY pair.
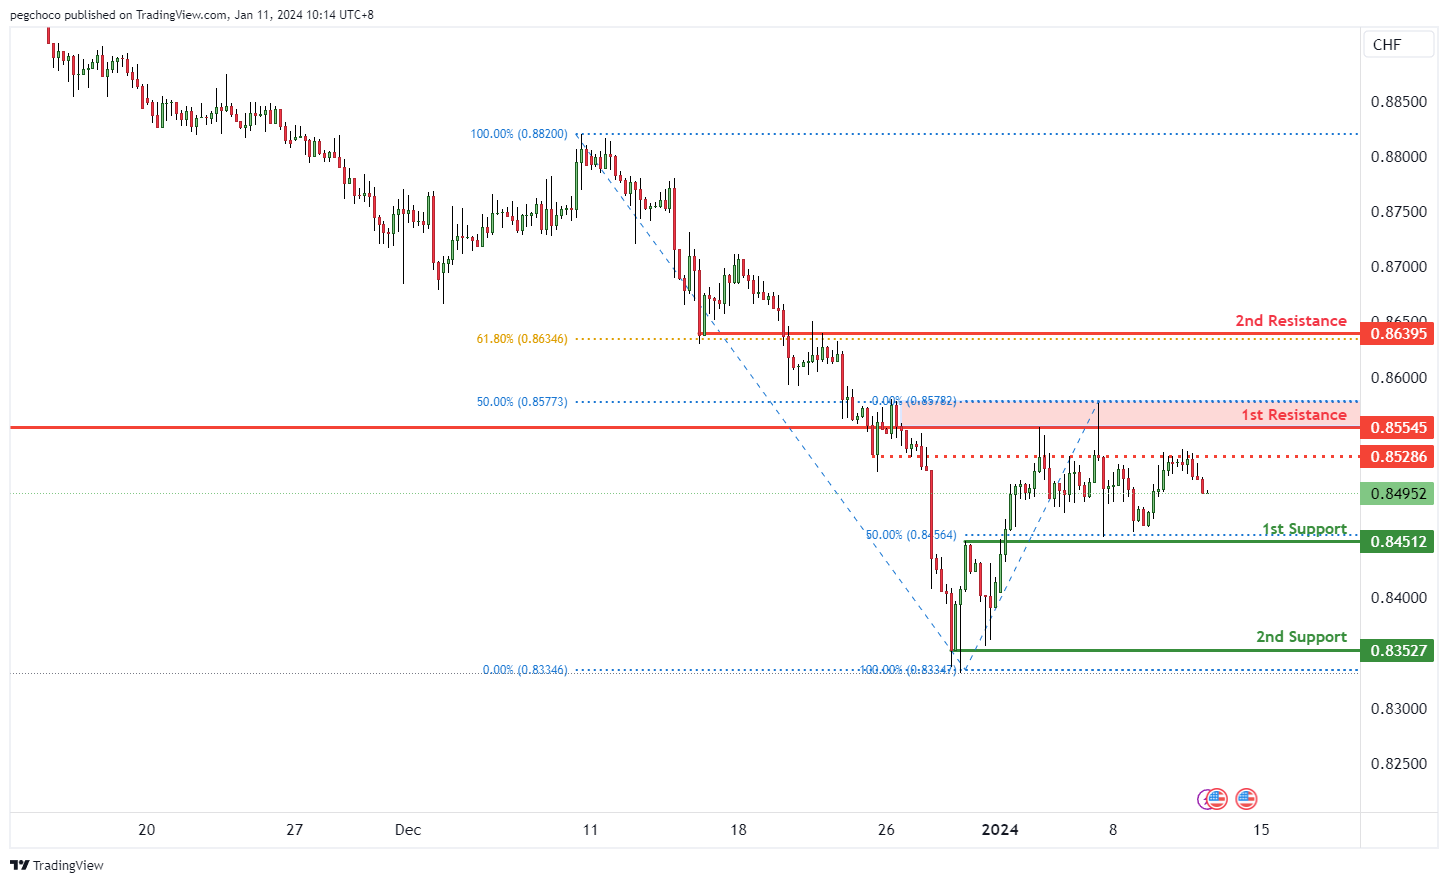
USD/CHF:
The USD/CHF chart currently shows a bearish overall momentum, indicating that the US Dollar is weaker compared to the Swiss Franc.
Price is likely to continue its bearish movement towards the 1st support level.
The 1st support at 0.8451 is significant for several reasons. It is an overlap support and aligns with the 50% Fibonacci Retracement level. This confluence of factors makes it a strong potential support zone, where buying interest may emerge, providing temporary support for the USD/CHF pair.
The 2nd support at 0.8352 is identified as a multi-swing low support, further reinforcing its significance as a potential support area.
On the resistance side, the 1st resistance at 0.8554 is categorized as an overlap resistance, and it coincides with the 50% Fibonacci Retracement level.
The 2nd resistance at 0.8639 is also an overlap resistance and aligns with the 61.80% Fibonacci Retracement level.
An intermediate resistance level at 0.8528 is noted as an overlap resistance as well.
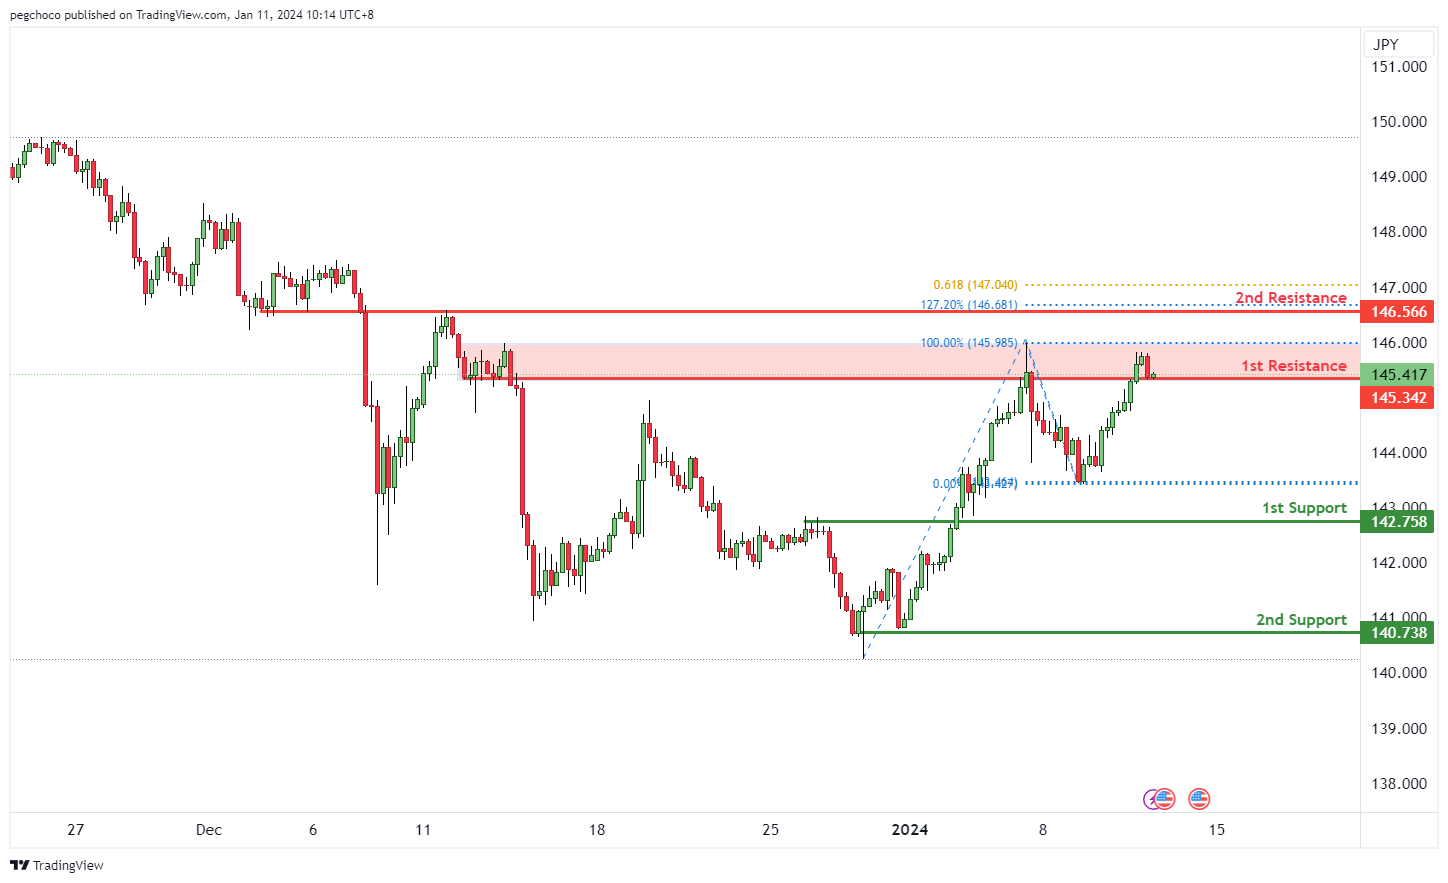
USD/JPY:
The USD/JPY chart is currently displaying a bearish overall momentum, indicating that the US Dollar is weaker relative to the Japanese Yen.
Price is expected to continue its bearish movement towards the 1st support level.
The 1st support at 142.75 is considered significant as it aligns with a pullback support level. This level may attract buying interest, potentially providing temporary support for the USD/JPY pair.
The 2nd support at 140.73 is a multi-swing low support, further strengthening its significance as a potential support area.
On the resistance side, the 1st resistance at 145.34 is categorized as a swing high resistance, often acting as a barrier to upward price movement.
The 2nd resistance at 146.56 is identified as an overlap resistance and coincides with the 127.20% Fibonacci Extension level, making it a potentially strong resistance level.
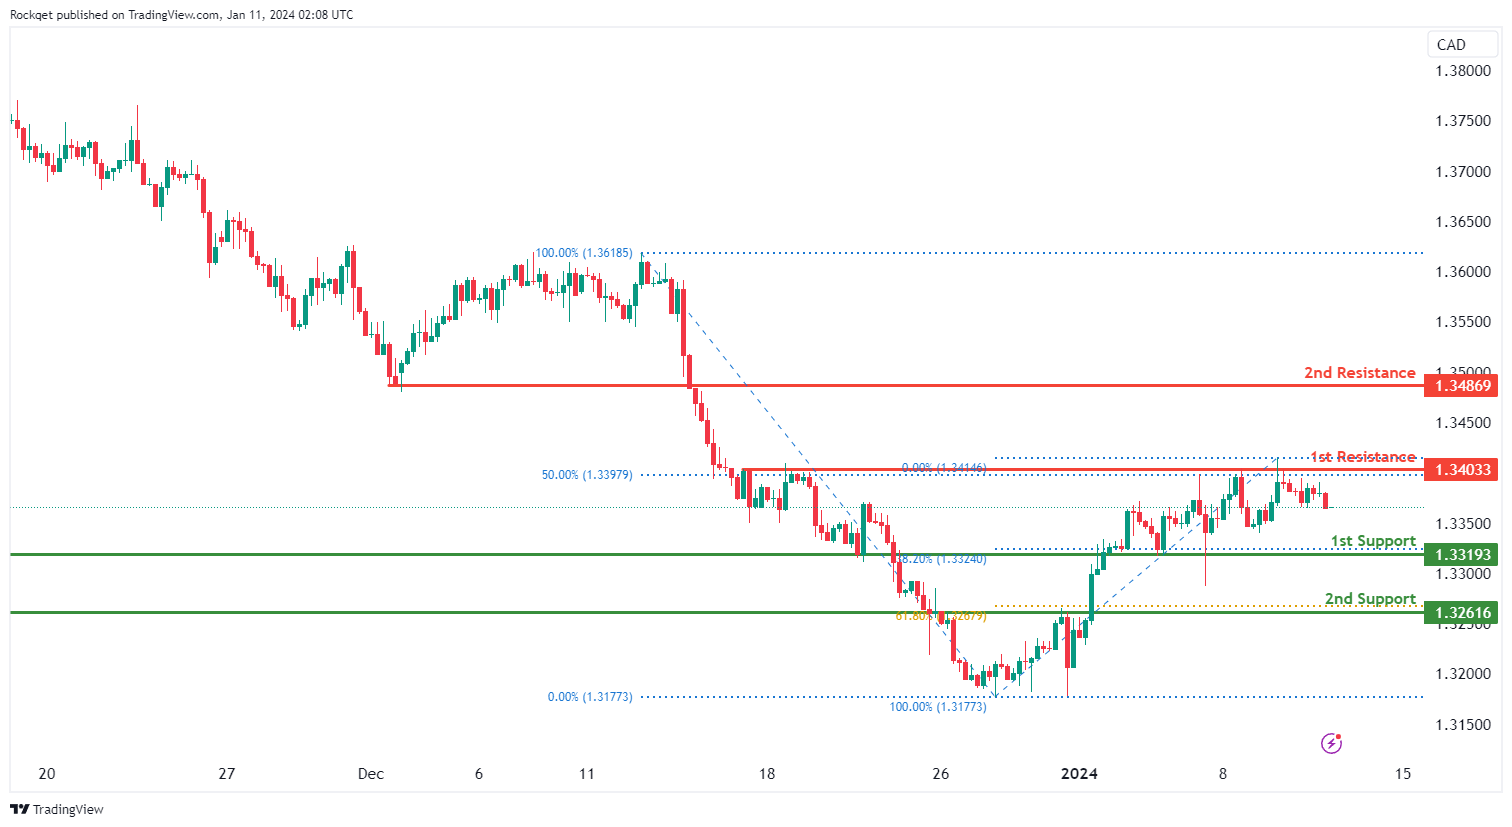
USD/CAD:
The USD/CAD chart currently exhibits an overall bullish momentum. However, there is a potential scenario for price to make a bearish drop towards the 1st support.
The 1st support level at 1.3319 is identified as a pullback support that aligns with the 38.20% Fibonacci retracement level. Further below, the 2nd support level at 1.3261 is marked as an overlap support that aligns with the 61.80% Fibonacci retracement level, further reinforcing its importance as a key support level.
To the upside, the 1st resistance level at 1.3403 is identified as a pullback resistance that aligns with the 50.00% Fibonacci retracement level. Higher up, the 2nd resistance level at 1.3486 is also noted as a pullback resistance, further reinforcing its significance as a potential resistance zone.
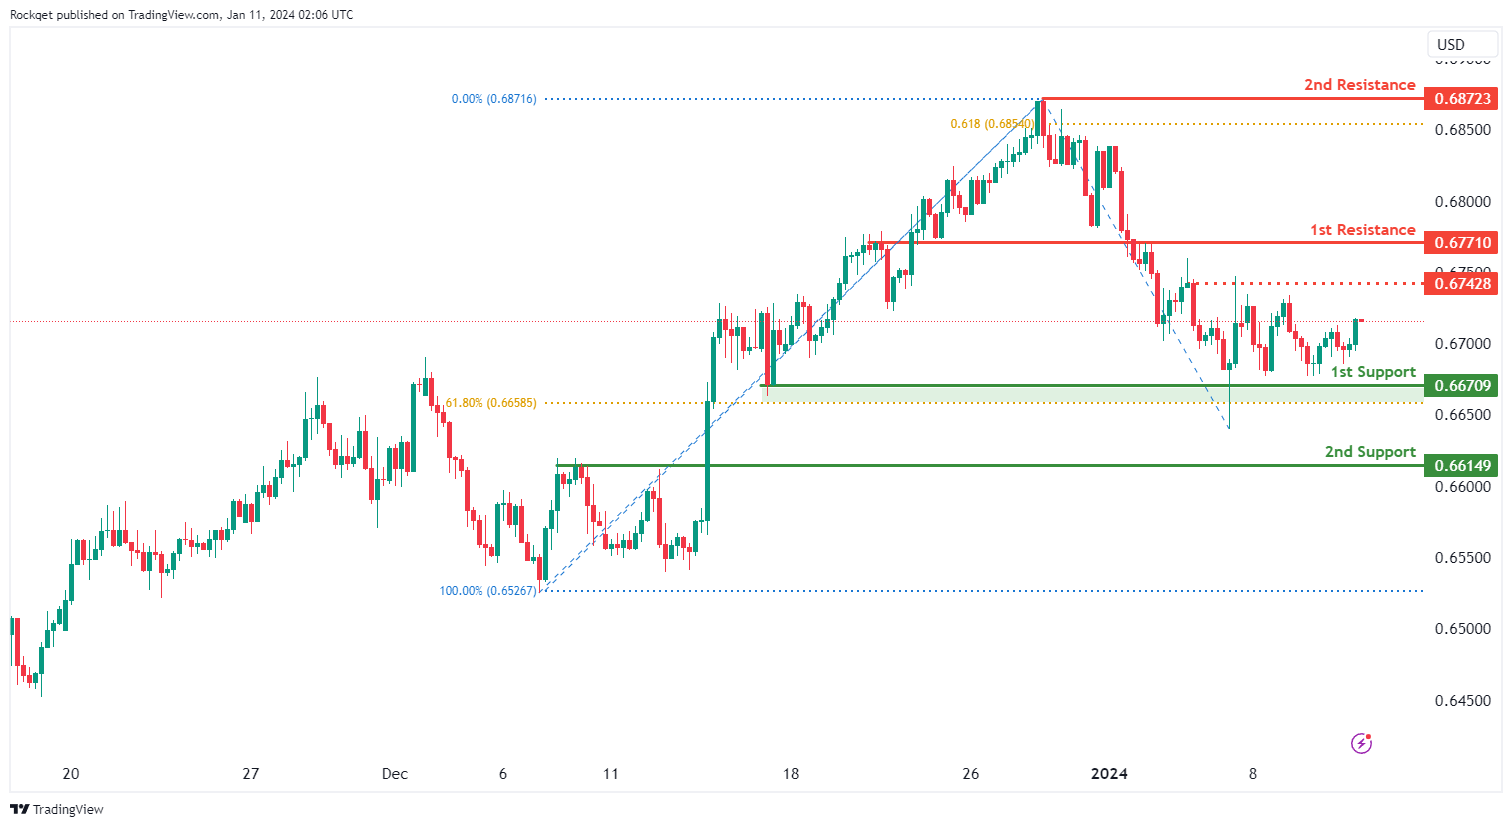
AUD/USD:
The AUD/USD chart currently exhibits a neutral bias. However, there is a potential scenario for price to make a bullish rise towards the 1st resistance should it break above the intermediate resistance.
The intermediate resistance level at 0.6742 is identified as a pullback resistance while the 1st resistance level at 0.6771 is identified as an overlap resistance. Higher up, the 2nd resistance level at 0.6872 is noted as a swing-high resistance that aligns close to the 61.80% Fibonacci projection level, suggesting a potential barrier for further upside movement.
To the downside, the 1st support level at 0.6670 is identified as a pullback support that aligns close to the 61.80% Fibonacci retracement level. Further below, the 2nd support level at 0.6614 is also marked as an pullback support, further reinforcing its importance as a key support level.
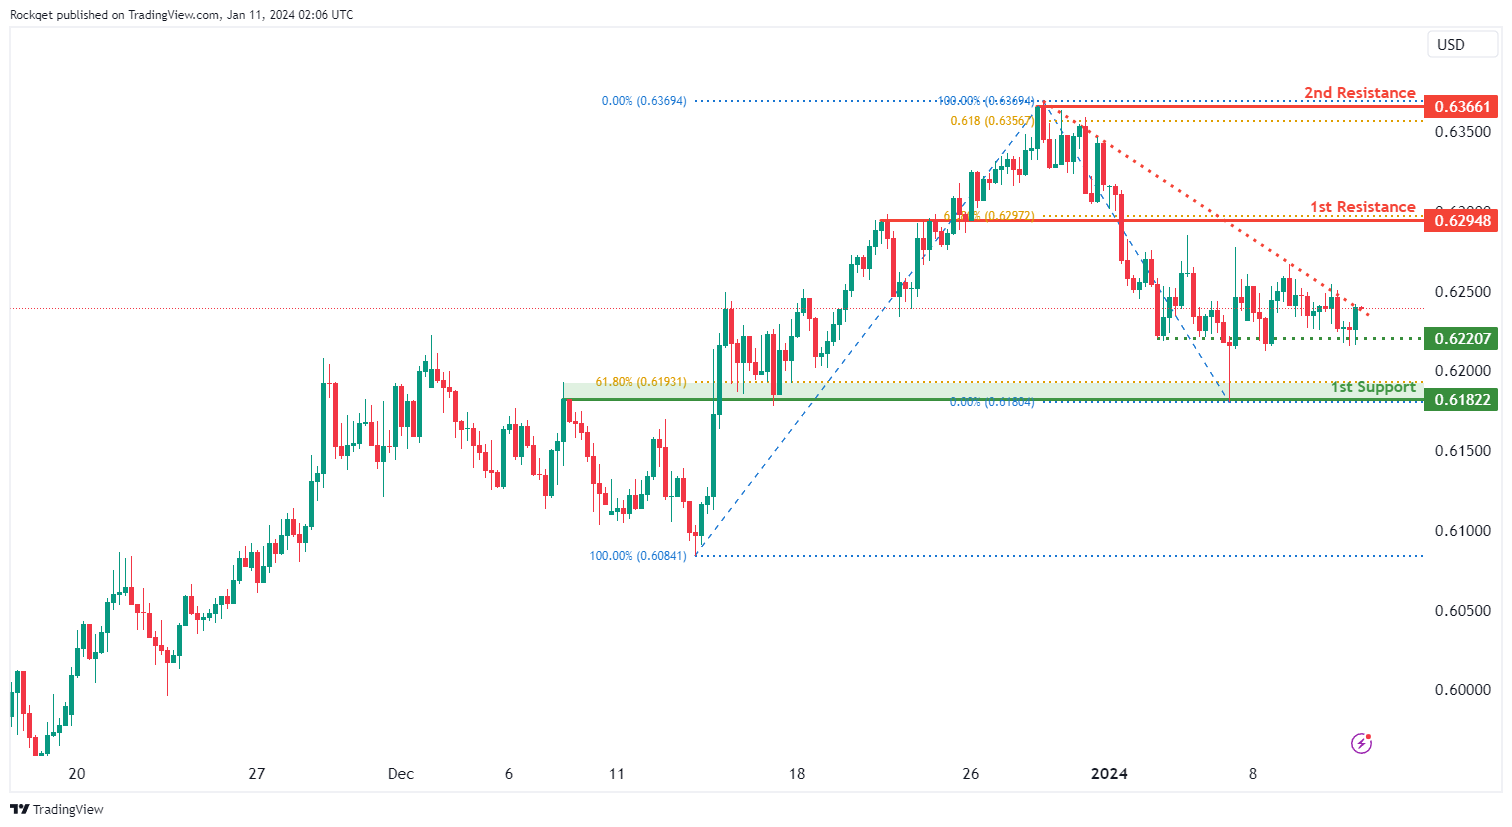
NZD/USD
The NZD/USD chart currently exhibits a neutral bias. However, there is a potential scenario for price to make a bullish rise towards the 1st resistance should it break above the descending trendline.
The 1st resistance level at 0.6294 is identified as an overlap resistance that aligns with the 61.80% Fibonacci retracement level. Higher up, the 2nd resistance level at 0.6366 is noted as a swing-high resistance that aligns close to the 61.80% Fibonacci projection level, suggesting a potential barrier for further upside movement.
To the downside, the intermediate support level at 0.6220 is identified as a pullback support. Further below, the 1st support level at 0.6182 is marked as an overlap support that aligns close to the 61.80% Fibonacci retracement level, further reinforcing its importance as a key support level.
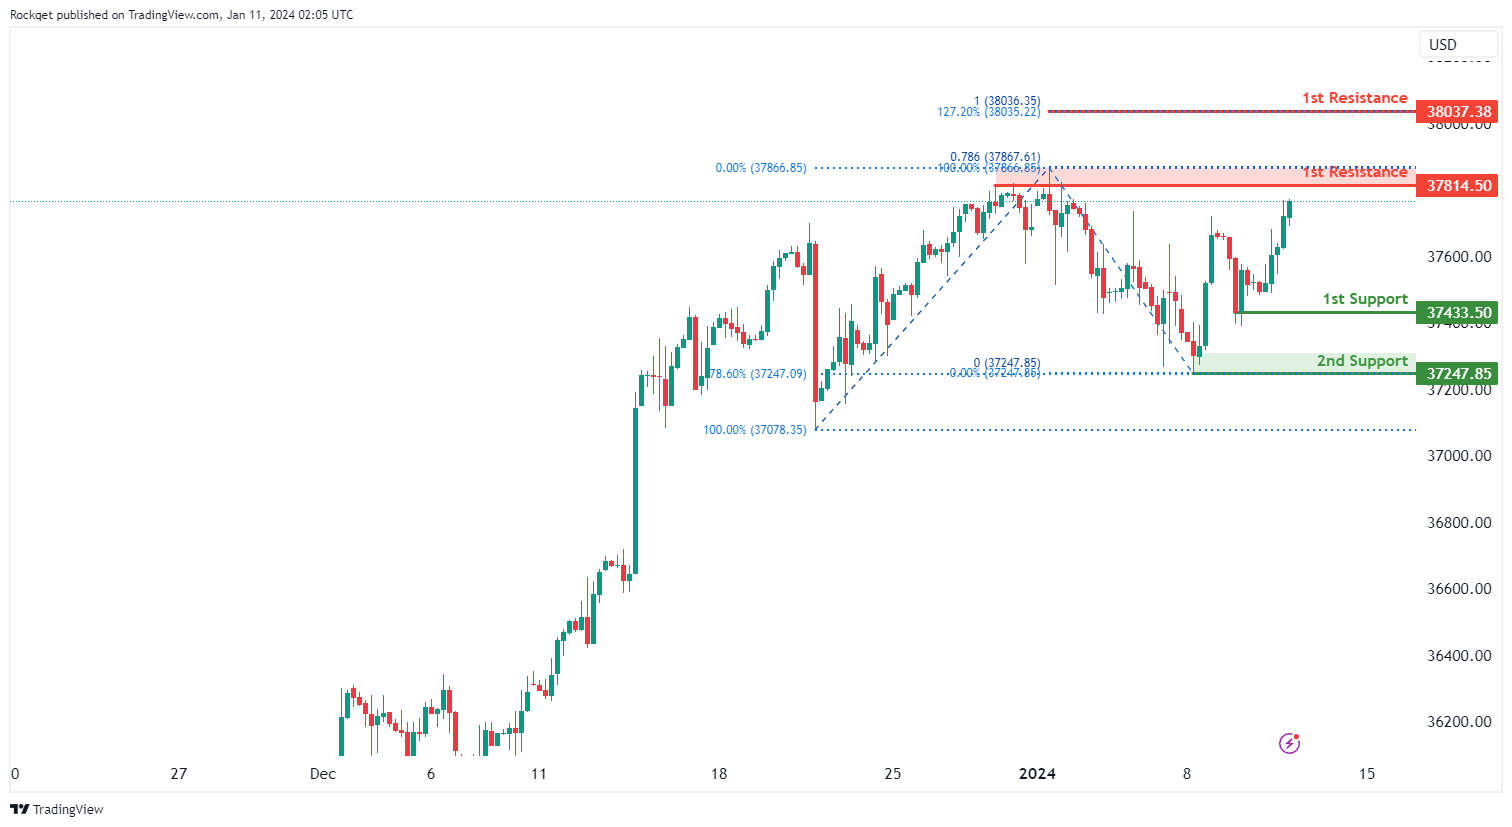
DJ30:
The DJ30 chart currently displays an overall bullish momentum. In this context, there is a potential scenario for price to make a bullish continuation towards the 1st resistance.
The 1st resistance level at 37,814.50 is identified as a pullback resistance that aligns close to the 78.60% Fibonacci projection level. Higher up, the 2nd resistance level at 38,037.38 is recognized as a resistance that aligns with a confluence of Fibonacci levels i.e. the 127.20% extension and the 100.00% projection, adding significance to this potential resistance level.
On the support side, the 1st support level at 37,433.50 is identified as a pullback support. Further below, the 2nd support level at 37,247.85 is also recognized as a pullback support that aligns with the 78.60% Fibonacci retracement level, further adding to its potential as a key support zone.
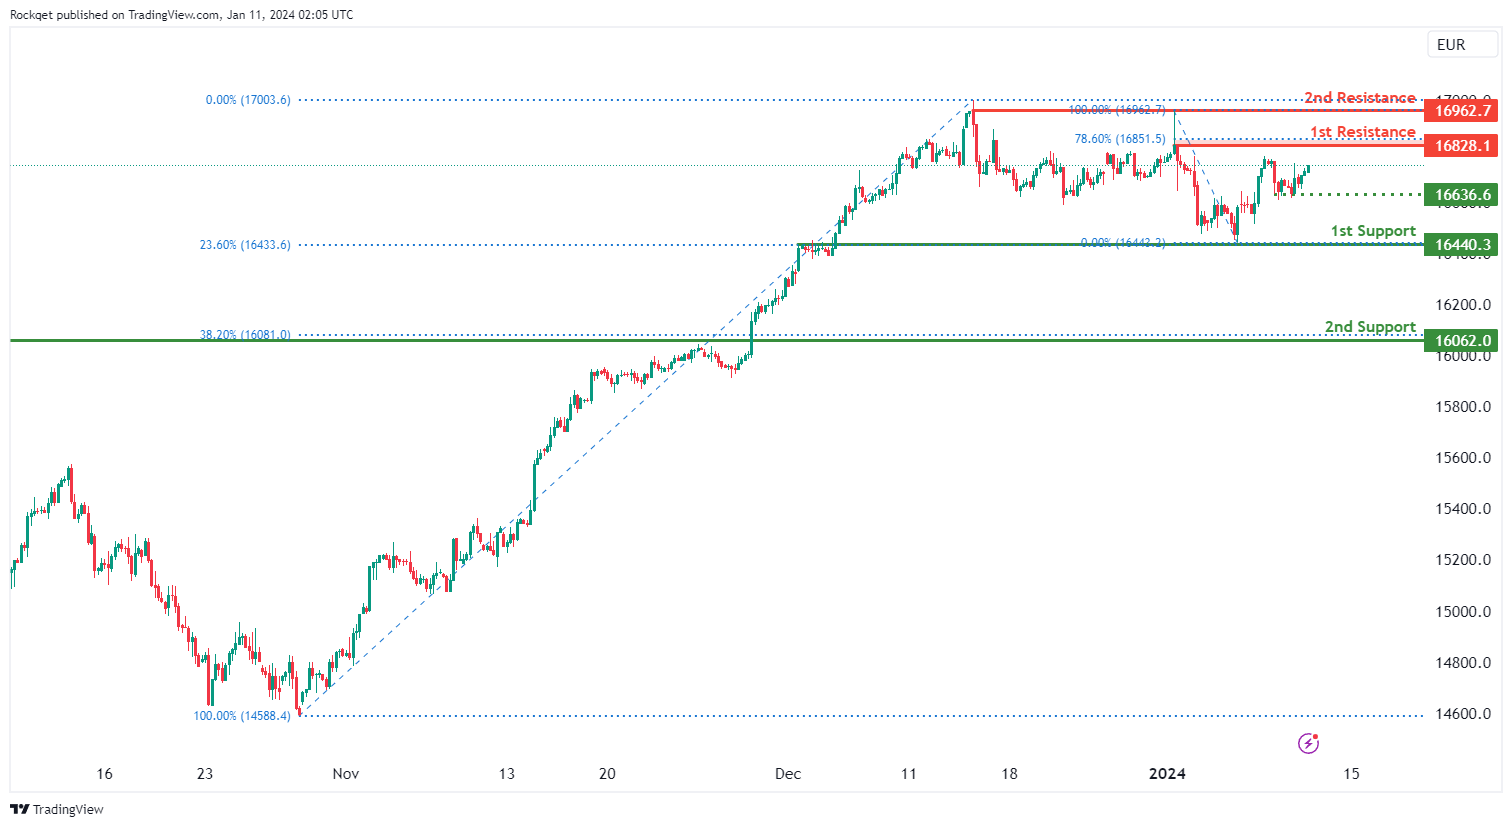
GER40:
The GER40 chart currently displays an overall bullish momentum. In this context, there is a potential scenario for price to make a bullish continuation towards the 1st resistance.
The 1st resistance level at 16,828.10 is identified as a pullback resistance that coincides with the 78.60% Fibonacci retracement level. Higher up, the 2nd resistance level at 16,962.70 is also noted as a pullback resistance, further reinforcing its potential as a barrier to upward movement.
On the support side, the intermediate support level at 16,636.60 is recognized as a pull back support while the 1st support level at 16,440.30 is identified as an overlap support that aligns with the 23.60% Fibonacci retracement level. The 2nd support level at 16,062.00 is recognized as a pullback support that aligns with the 38.20% Fibonacci retracement level, adding to its potential significance as a level of historical importance.
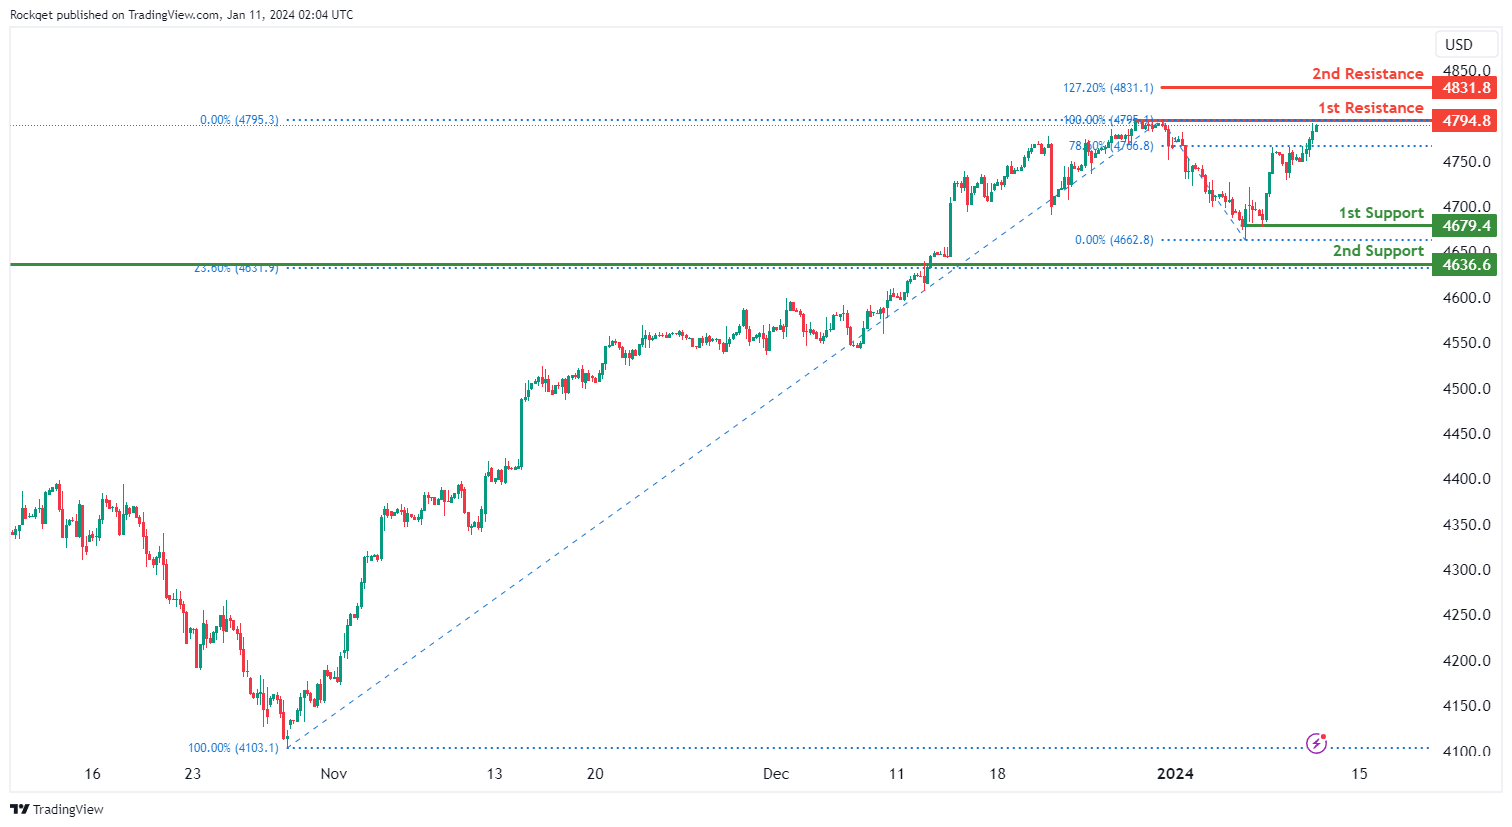
US500:
The US500 chart currently displays an overall bullish momentum. In this context, there is a potential for price to make a bullish continuation towards the 1st resistance.
The 1st resistance level at 4,794.80 is identified as a pullback resistance. Higher up, the 2nd resistance level at 4,831.80 is identified as a resistance that aligns with the 127.20% Fibonacci extension level.
On the support side, the 1st support level at 4,679.40 is identified as a pullback support. Further below, the 2nd support level at 4,636.60 is also recognized as a pullback support that aligns with the 23.60% Fibonacci retracement level, adding to its potential as a support level.
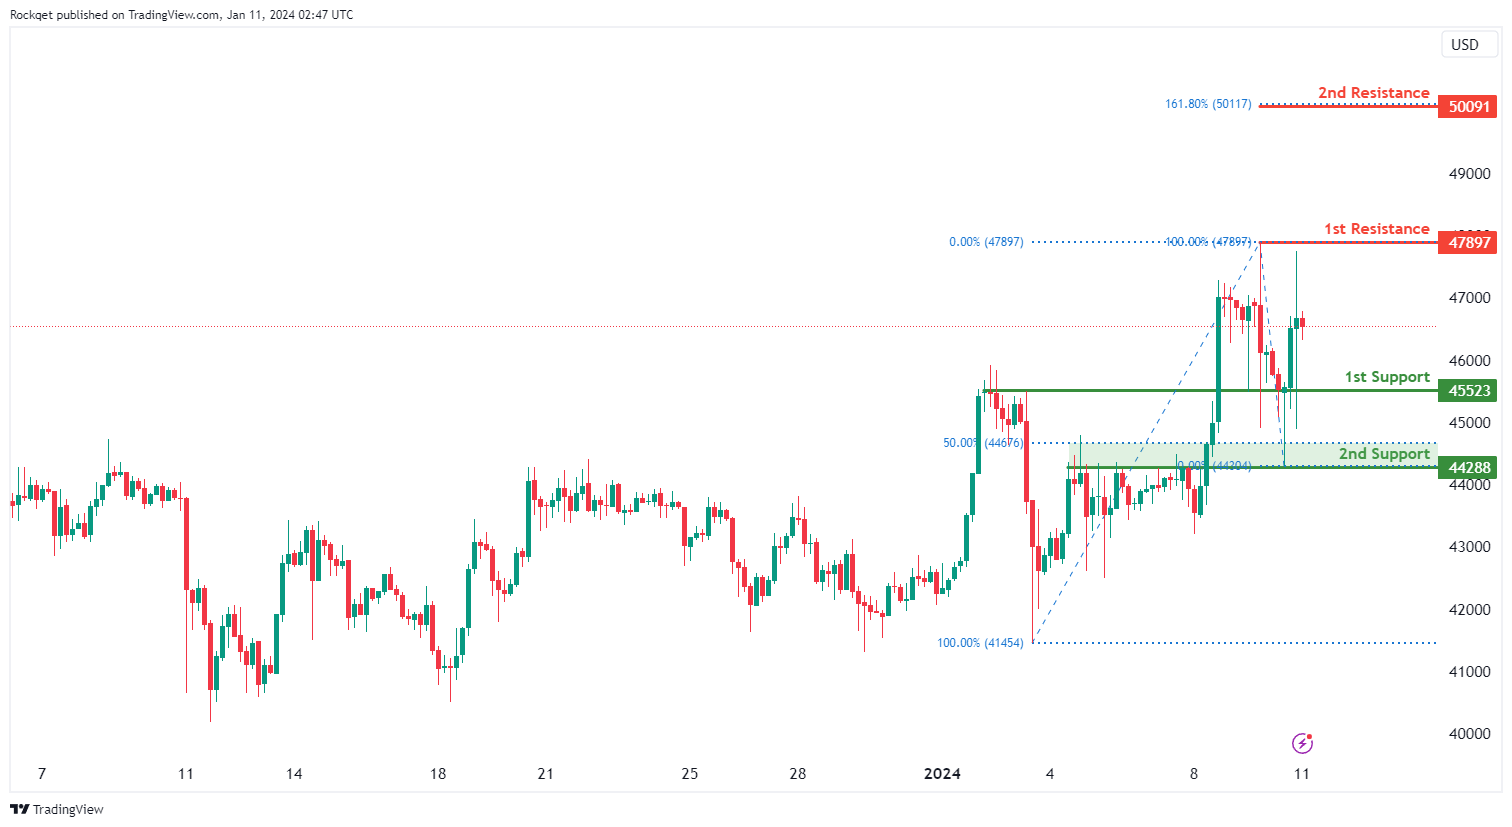
BTC/USD:
The BTC/USD chart currently exhibits a neutral bias, indicating a potential for price to fluctuate between the 1st resistance and the 1st support.
The 1st support level at 45,523 is identified as an overlap support. Further below, the 2nd support level at 44,288 is also recognized as an overlap support that aligns close to the 50.00% Fibonacci retracement level, adding to its potential as a key support.
On the resistance side, the 1st resistance level at 47,897 is identified as a pullback resistance. Higher up, the 2nd resistance level at 50,091 is recognized as a resistance that aligns with the 161.80% Fibonacci extension level, suggesting a level where selling interest could materialize.
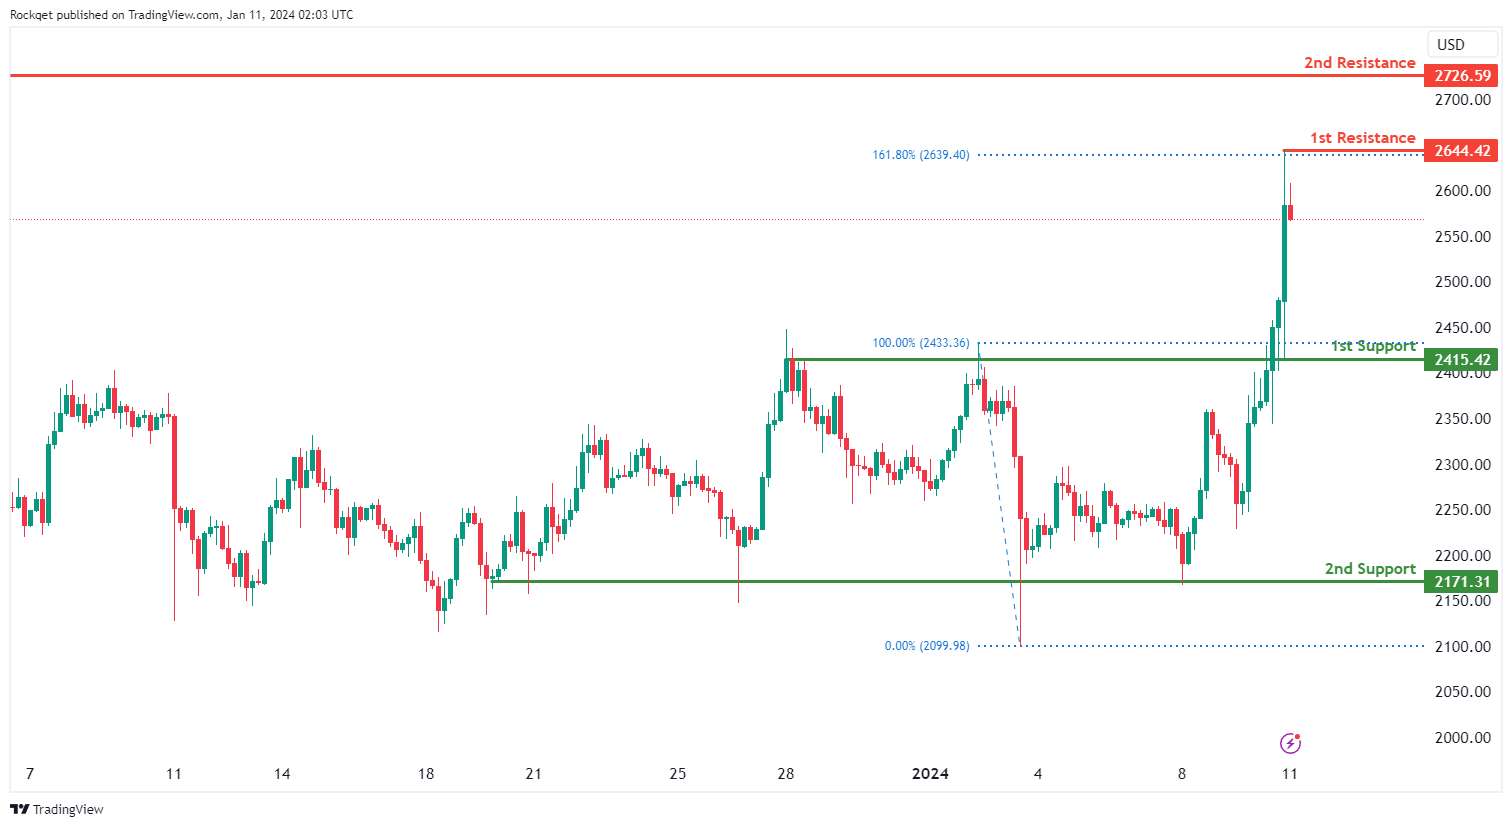
ETH/USD:
The ETH/USD chart currently exhibits an overall bullish momentum. However, there is a potential scenario for price to fall towards the 1st support.
The 1st support level at 2,415.42 is identified as a pullback support. Further below, the 2nd support level at 2,171.31 is recognized as a multi-swing-low support, adding to its potential as a key support.
On the resistance side, the 1st resistance level at 2,644.42 is identified as a pullback resistance that aligns with the 161.80% Fibonacci extension level. Higher up, the 2nd resistance level at 2,726.59 is recognized as a pullback resistance, suggesting a potential barrier for further upside movement.
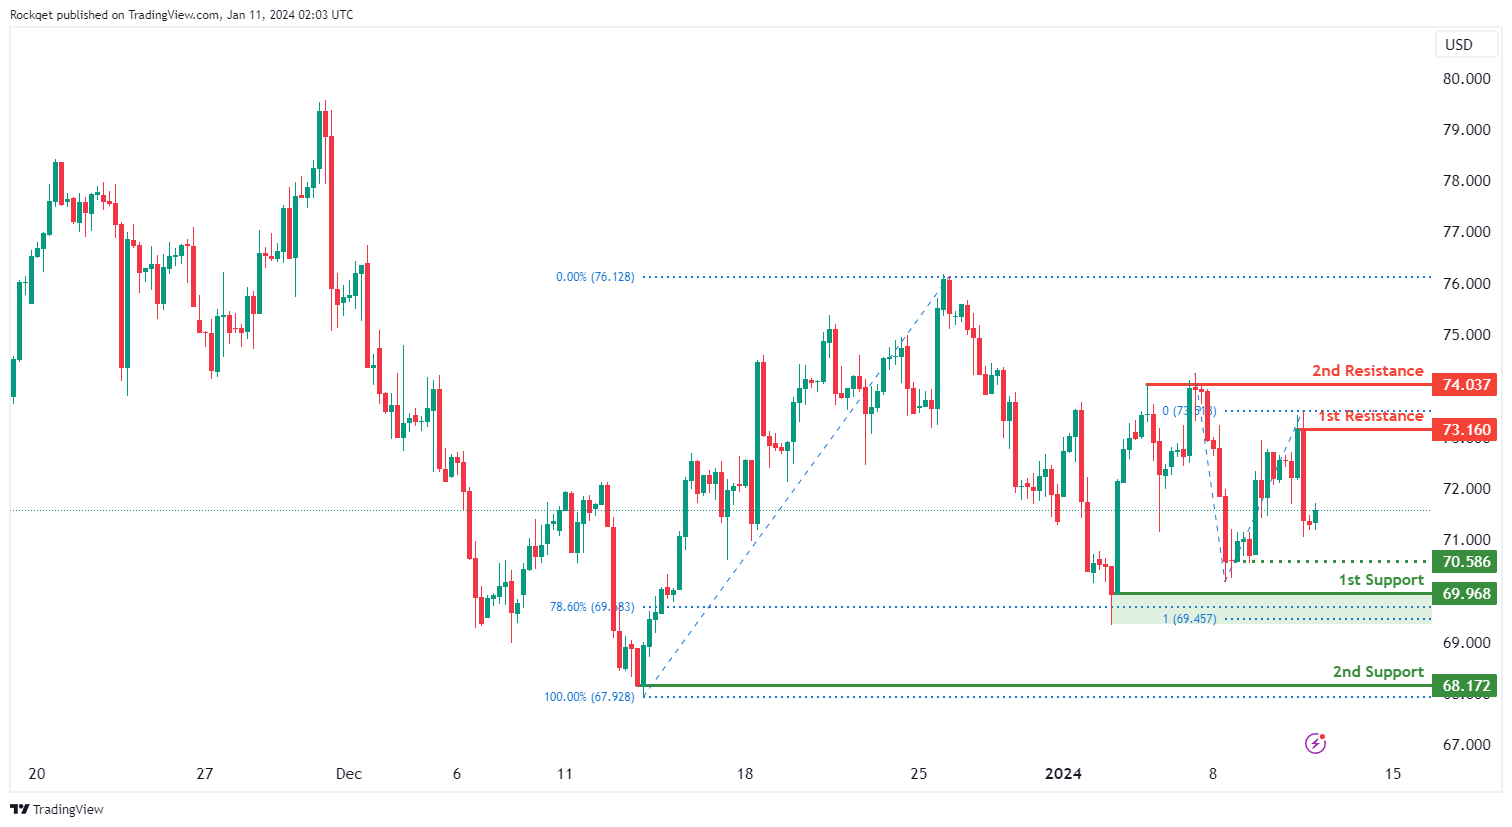
WTI/USD:
The WTI (West Texas Intermediate) chart currently exhibits a neutral bias, indicating a potential for price to fluctuate between the 1st resistance and the 1st support.
The 1st resistance level at 73.16 is identified as a pullback resistance. Higher up, the 2nd resistance level at 74.03 is also noted as a pullback resistance, suggesting a potential barrier for further upside movement.
To the downside, the intermediate support level at 70.58 is identified as a pullback support while the 1st support level at 69.96 is noted as a swing-low support that aligns close to a confluence of Fibonacci levels i.e. the 78.60% retracement and the 100.00% projection. Further below, the 2nd support level at 68.17 is also marked as a swing-low support, further reinforcing its importance as a key support level.
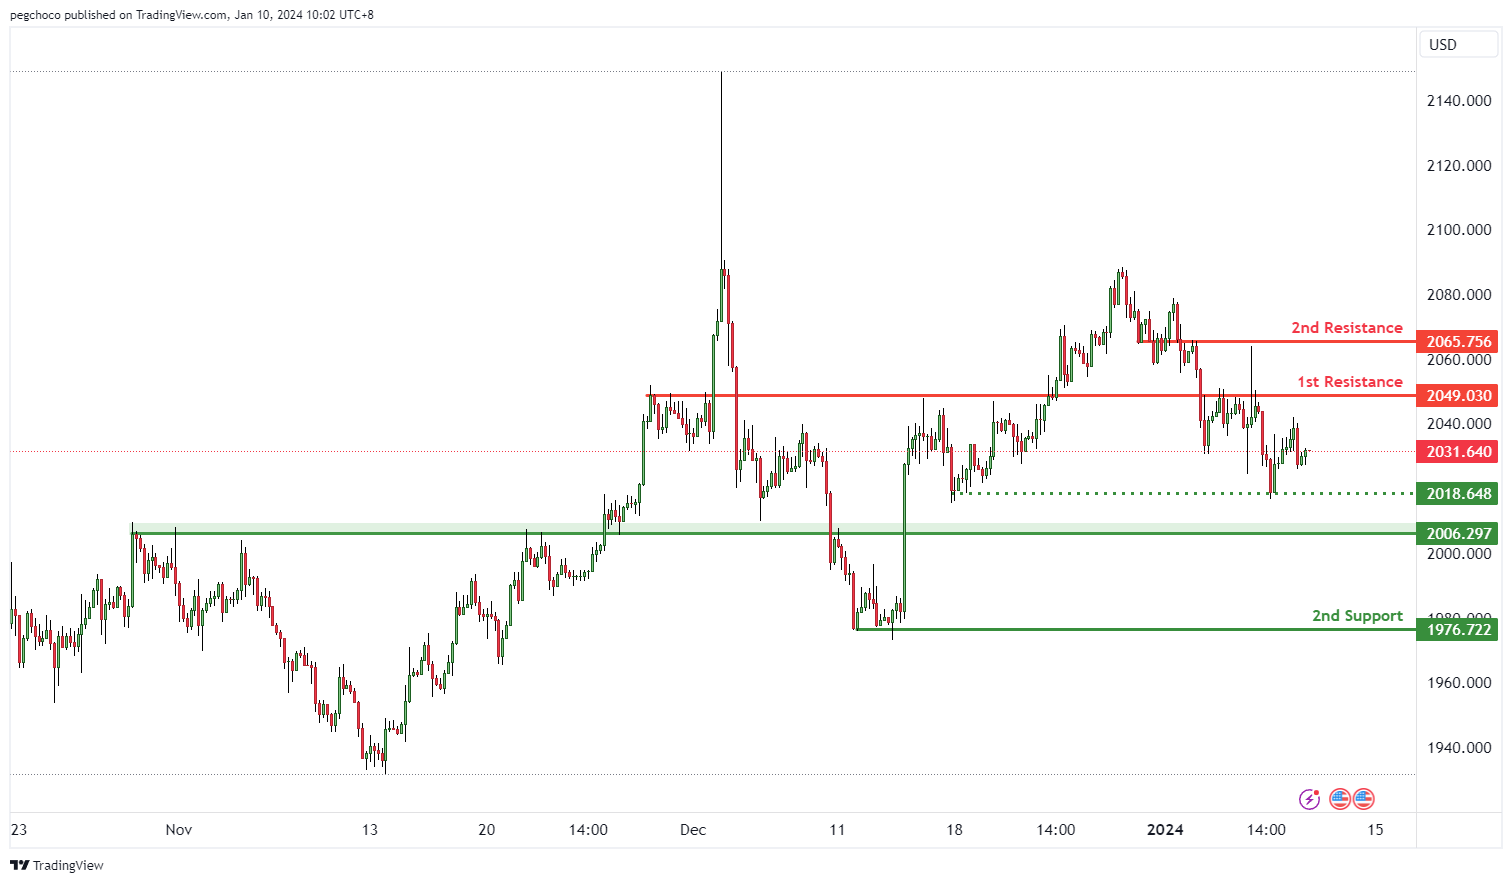
XAU/USD (GOLD):
The XAU/USD (Gold/US Dollar) chart currently exhibits a bullish overall momentum, indicating that Gold is showing strength relative to the US Dollar.
Price is anticipated to continue its bullish movement towards the 1st resistance level.
The 1st support at 2006.29 is considered significant as it aligns with a pullback support level. This level may act as a potential area for buyers to step in and provide temporary support for the XAU/USD pair.
An intermediate support level at 2017.00 is also noteworthy, as it aligns with a multi-swing low support, adding to its significance.
On the resistance side, the 1st resistance at 2049.03 is categorized as an overlap resistance, which can serve as a barrier to upward price movement.
The 2nd resistance at 2065.75 is identified as another overlap resistance, indicating a potential area of resistance for the XAU/USD pair.
An intermediate resistance level at 2038.44 is also present, further reinforcing the potential resistance zone.
OECD calls for BoJ rate hike and flexible YCC
OECD has suggested that BoJ should consider implementing a gradual rise in short-term interest rates and introduce more flexibility into its Yield Curve Control policy. This recommendation comes at a time when Japan appears to be at a crucial economic juncture, with inflation trends potentially stabilizing around BOJ's 2% target, a goal set in 2013 but not consistently achieved since then.
In its report, OECD stated, "Japan is at a turning point, with inflation more likely to settle durably around the 2% inflation target than at any time since its inception." To adapt to this changing economic landscape, OECD advised that "greater flexibility in the conduct of yield curve control and a gradual modest increase in the short-term policy interest rate are warranted." This advice is predicated on projections of sustained inflation and evolving wage dynamics in Japan.
However, OECD also issued a cautionary note regarding the uncertainty surrounding Japan's inflation outlook, which it described as "exceptionally large." This uncertainty presents a significant challenge for BOJ as it navigates toward its inflation target. OECD emphasized the delicate balance BOJ must maintain, stating, "The key challenge facing the BOJ is how to durably achieve its inflation target without significantly overshooting."
ECB’s de Cos warns of policy transmission strength and economic uncertainty
ECB Governing Council member Pablo Hernandez de Cos highlighted the surprising strength of monetary policy transmission and cautioned that this could lead to lower growth. Despite the current economic downturn, de Cos emphasized the need for ECB to remain vigilant to avoid the pitfalls of "insufficient tightening" and "unnecessarily harming activity and employment."
De Cos described the current state of economic activity in Europe as showing "clear weakness," with expectations of only a gradual increase in dynamism. He also highlighted that "risks to economic growth remain skewed to the downside," pointing to geopolitical developments as a key factor.
Additionally, de Cos was surprised by the strength of the monetary policy's impact, saying, "The transmission of monetary policy has been surprising us for its strength, which, if extended in the coming years, would translate into lower growth."
Looking forward, de Cos emphasized the need for careful monitoring of various developments that could influence inflation and, consequently, ECB's monetary policy actions. He asserted, "We'll have to pay attention in the coming months to different developments that may condition the trajectory of inflation and, therefore, our monetary policy action."
Fed’s Williams on inflation progress: Our work is not done
New York Fed President John Williams acknowledged the "meaningful progress" made in balancing the economy and "bringing inflation down." But he also emphasized that the Fed's is far from over with the assertion. "Our work is not done" he said in a speech overnight.
Williams highlighted the need for continued restrictive stance in monetary policy "for some time". He added, "it will only be appropriate to dial back the degree of policy restraint when we are confident that inflation is moving toward 2% on a sustained basis."
Addressing the economic outlook, Williams described it as "highly uncertain" and stressed that Fed's policy decisions will be made on a meeting-by-meeting basis. These decisions will be grounded in "the totality of the incoming data, the evolving outlook, and the balance of risks."
Williams refrained from predicting when a rate cut might occur, stating, "I'm not making a prediction." However, he also noted that the Fed is currently in a "good place" to assimilate incoming data and deliberate on future policy moves.