
Sample Category Title
USD/JPY Mid-Day Outlook
Daily Pivots: (S1) 143.73; (P) 144.17; (R1) 144.93; More...
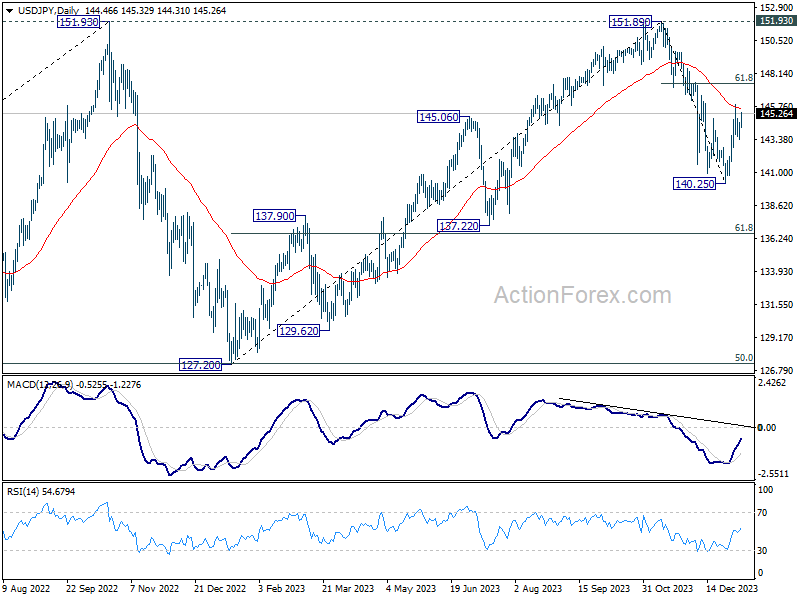
Intraday bias in USD/JPY remains neutral as range trading continues. On the upside, above 145.97 will resume the rebound from 140.25. But upside should be limited by 61.8% retracement of 151.89 to 140.25 at 147.44. On the downside, below 143.17 minor support will turn bias back to the downside for retesting 140.25 low.
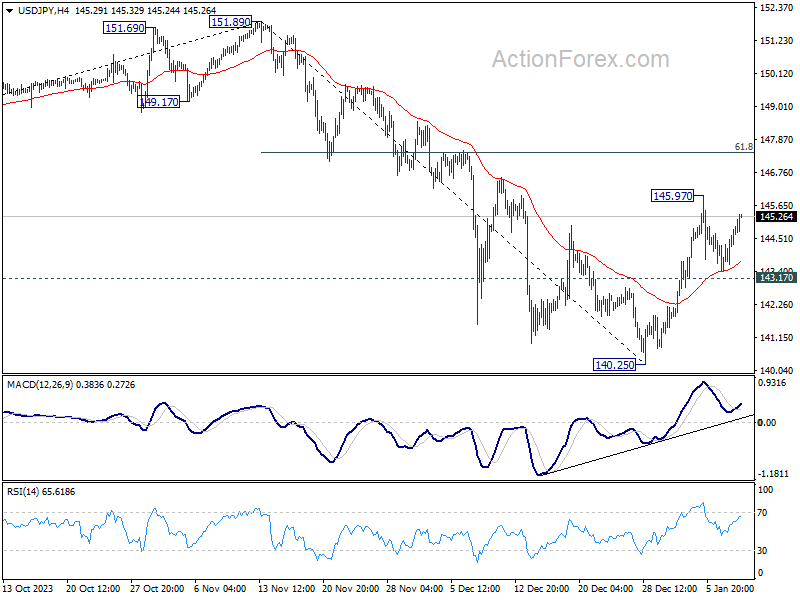
In the bigger picture, for now, fall from 151.89 is still seen as the third leg of the corrective pattern from 151.89. Another decline through 140.25 will target 61.8% retracement of 127.20 to 151.89 at 136.63. Sustained break there will pave the way to 127.20 support (2022 low). However, firm break of 147.44 fibonacci resistance will dampen this view and bring retest of 151.89 instead.
EUR/JPY Mid-Day Outlook
Daily Pivots: (S1) 157.42; (P) 157.73; (R1) 158.24; More...
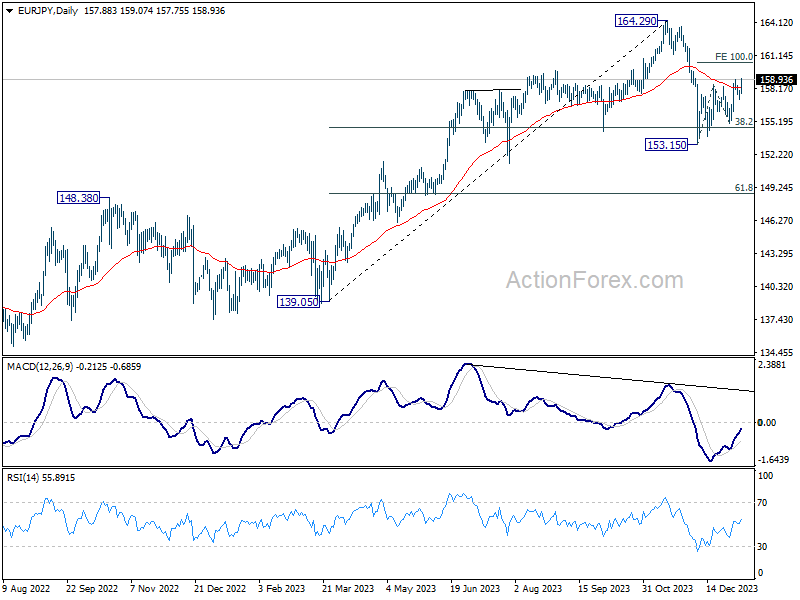
EUR/JPY's rebound from 153.15 is resuming by breaking 158.97 resistance. Intraday bias is back on the upside. Next target is 100% projection of 153.15 to 158.55 from 155.06 at 160.46. For now, further rise will remain in favor as long as 157.19 support holds, in case of retreat.
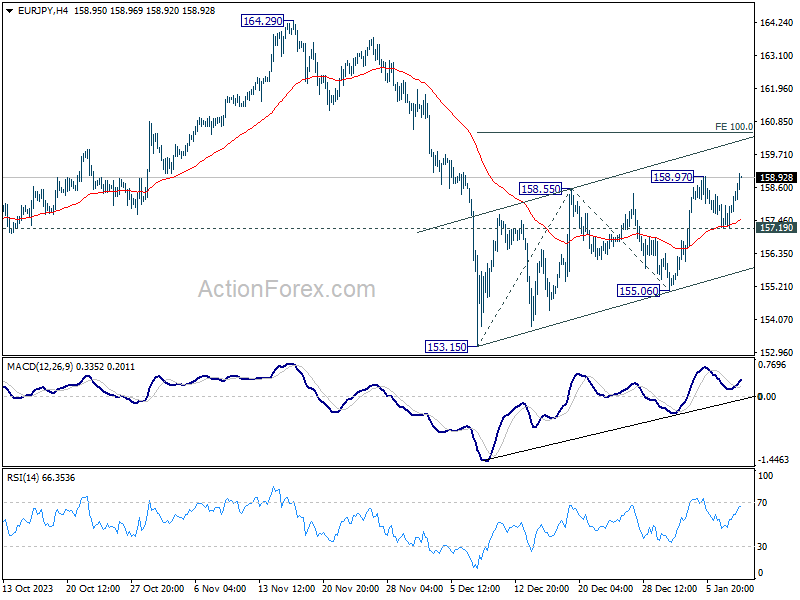
In the bigger picture, price actions from 164.29 medium term top are tentatively seen as a correction to rise from 139.05 for now. As long as 148.48 resistance turned support holds (2022 high), larger up trend from 114.42 (2020 low) could still resume through 164.29 at a later stage.
GBP/JPY Mid-Day Outlook
Daily Pivots: (S1) 182.94; (P) 183.45; (R1) 184.15; More...
GBP/JPY's strong rally today confirms resumption of rise from 178.32. More importantly, the decisive break of 184.15 resistance indicates that correction from 188.63 has completed already. Intraday bias is back on the upside for retesting 188.63 next. On the downside, break of 182.73 support is needed to indicate completion of the rebound. Otherwise, further rally will remain in favor in case of retreat.
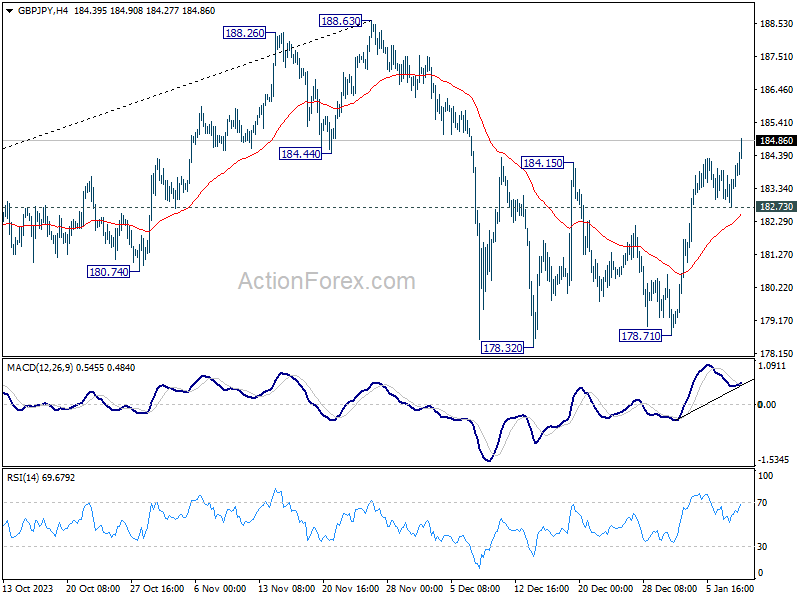
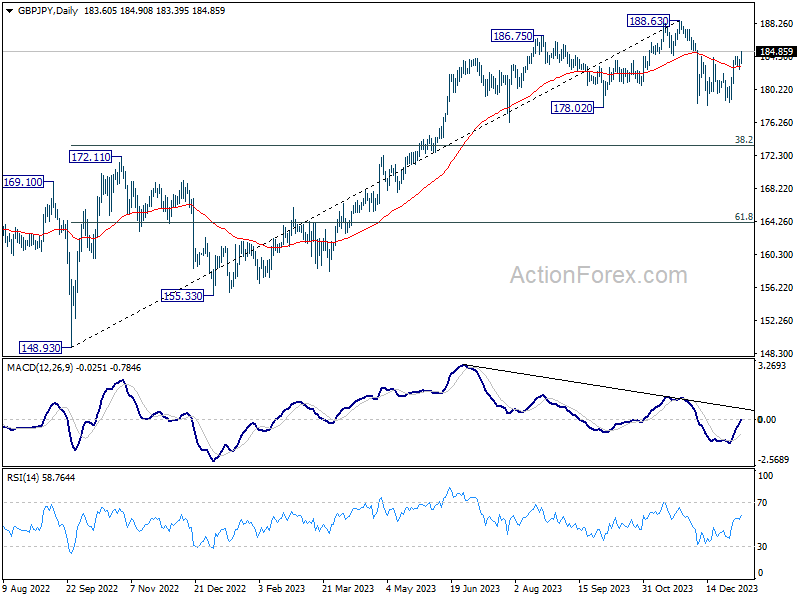
In the bigger picture, price actions from 188.63 medium term top are seen as a correction to the up trend from 148.93 (2022 low) only. As long as 172.11 resistance turned support holds, larger up trend from 123.94 (2020 low) is still in favor to resume through 188.63 at a later stage.
Yen’s Selloff Persists in Sluggish Market, Dollar Mixed
Japanese Yen continues its decline in today's subdued trading environment. This selloff gained momentum following the release of disappointing wages growth data, which has tempered expectations for an imminent monetary policy adjustment by BoJ in January. Despite this, April is still considered a more probable time for interest rate hike, heavily dependent on the outcomes of the upcoming Spring wage negotiations. BoJ Governor Kazuo Ueda has underscored the importance of widespread wage increases across businesses of all sizes as a critical factor in the central bank's decision-making process. There is still significant progress to be made before the central bank can shift its policy direction.
Meanwhile, Australian Dollar emerges as the strongest performer of the day, although its gains are relatively modest, surpassing yesterday's highs against Yen and Swiss Franc only. This suggests that the current strength of Aussie is just a temporary phase within near-term market consolidations, subject to change at any moment. Euro and British Pound are following as the next strongest currencies, while New Zealand Dollar and Swiss Franc are weaker, with Yen being the worst. Dollar and Canadian are showing mixed performances.
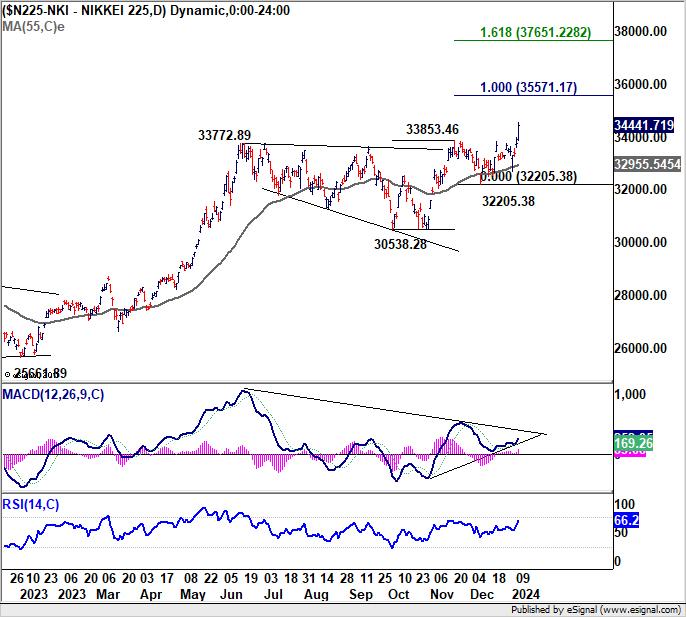
Technically, Nikkei's strong break of 33853.46 resistance this week confirms resumption of long term up trend. Current rally should target 100% projection of 30538.28 to 33853.46 from 32205.38 at 35571.17. Decisive break there could prompt upside acceleration to 161.8% projection at 37651.22 next. Market reactions to today's wages data suggest that investors might continue to bolster Japanese stocks if they perceive a reduced likelihood of BoJ interest rate hike in the near term.
In Europe, at the time of writing, FTSE is down -0.23%. DAX is up 0.02%. CAC is down -0.08%. Germany 10-year yield s down -0.014 at 2.174. UK 10-year yield is down -0.0138 at 3.767. Earlier in Asia, Japan 10-year yield fell -0.0006 to 0.587. Nikkei rose 2.01%. Hong Kong HSI fell -0.57%. China Shanghai SSE fell -0.54%. Singapore Strait Times fell -0.56%.
ECB's de Guindos foresees slower disinflation and economic challenges in 2024
Luis de Guindos, Vice-President of ECB, in speech today, indicated that the "rapid pace of disinflation" observed in 2023 is likely to "slow down" in the coming year, with a "pause" early in the year, mirroring the pattern seen in December 2023.
De Guindos also pointed out that "soft indicators" suggest an economic "contraction" in December, hinting at the likelihood of a "technical recession" in the latter half of 2023. This downturn is expected to have broad impacts across various sectors, with "construction and manufacturing" being particularly hit. "Services" sector is also anticipated to "soften in the coming months as a result of weaker activity in the rest of the economy."
Regarding the ECB's monetary policy, de Guindos expressed that the "current level of interest rates," if maintained, would substantially aid in returning inflation to the ECB's target. He underscored that the "key ECB interest rates" remain the central instrument for monetary policy, emphasizing that future decisions will be "data-dependent," focusing on the "appropriate level and duration of restriction."
Japan's labor cash earnings rises only 0.2% yoy, real wages down for 20th month
Japan's labor market showed a notable slowdown in nominal cash earnings growth in November, increasing by only 0.2% yoy, which was significantly below market expectation of 1.5% yoy. This rate marks the slowest growth in nearly two years and represents a considerable decrease compared to 1.5% yoy growth in October.
A closer look at the components of earnings reveals mixed trends. Regular or base salaries saw modest increase of 1.2% yoy, slightly down from previous month's 1.3% yoy. Overtime pay, which had been declining, showed a positive shift with 0.9% yoy increase, marking the first rise in three months. However, special payments, such as bonuses, experienced a significant drop of -13.2% yoy.
More concerning that real wages fell sharply by -3.0% yoy in November, exceeding expectations of -2.0% yoy decline. This drop marks the 20th consecutive month of contraction.
Australia's monthly CPI eases to 4.3% yoy, lowest since Jan 2022
Australia's monthly CPI saw notable deceleration in November, dropping from 4.9% yoy to 4.3% yoy, which was below expectation of 4.5% yoy. This represents the lowest reading since January 2022, as easing of the inflationary pressures continued
CPI excluding volatile items and holiday travel also slowed from 5.1% yoy to 4.8% yoy. Additionally, Trimmed Mean CPI, which removes the most volatile components to provide a clearer picture of underlying inflation trends, decelerated from 5.3% yoy to 4.6% yoy.
The primary drivers of the annual increase in November were in housing , which witnessed a significant rise of 6.6. Food and non-alcoholic beverages also saw a notable increase of 4.6%, Insurance and financial services recorded an 8.8% increase, and Alcohol and tobacco category experienced a 6.4% rise.
GBP/JPY Mid-Day Outlook
Daily Pivots: (S1) 182.94; (P) 183.45; (R1) 184.15; More...
GBP/JPY's strong rally today confirms resumption of rise from 178.32. More importantly, the decisive break of 184.15 resistance indicates that correction from 188.63 has completed already. Intraday bias is back on the upside for retesting 188.63 next. On the downside, break of 182.73 support is needed to indicate completion of the rebound. Otherwise, further rally will remain in favor in case of retreat.
In the bigger picture, price actions from 188.63 medium term top are seen as a correction to the up trend from 148.93 (2022 low) only. As long as 172.11 resistance turned support holds, larger up trend from 123.94 (2020 low) is still in favor to resume through 188.63 at a later stage.
Economic Indicators Update
| GMT | Ccy | Events | Actual | Forecast | Previous | Revised |
|---|---|---|---|---|---|---|
| 23:30 | JPY | Labor Cash Earnings Y/Y Nov | 0.20% | 1.50% | 1.50% | |
| 00:30 | AUD | Monthly CPI Y/Y Nov | 4.30% | 4.50% | 4.90% | |
| 07:45 | EUR | France Industrial Output M/M Nov | 0.50% | 0.00% | -0.30% | |
| 15:00 | USD | Wholesale Inventories Nov F | -0.20% | -0.20% | ||
| 15:30 | USD | Crude Oil Inventories | -0.2M | -5.5M |
Australian Dollar Rises After CPI Falls
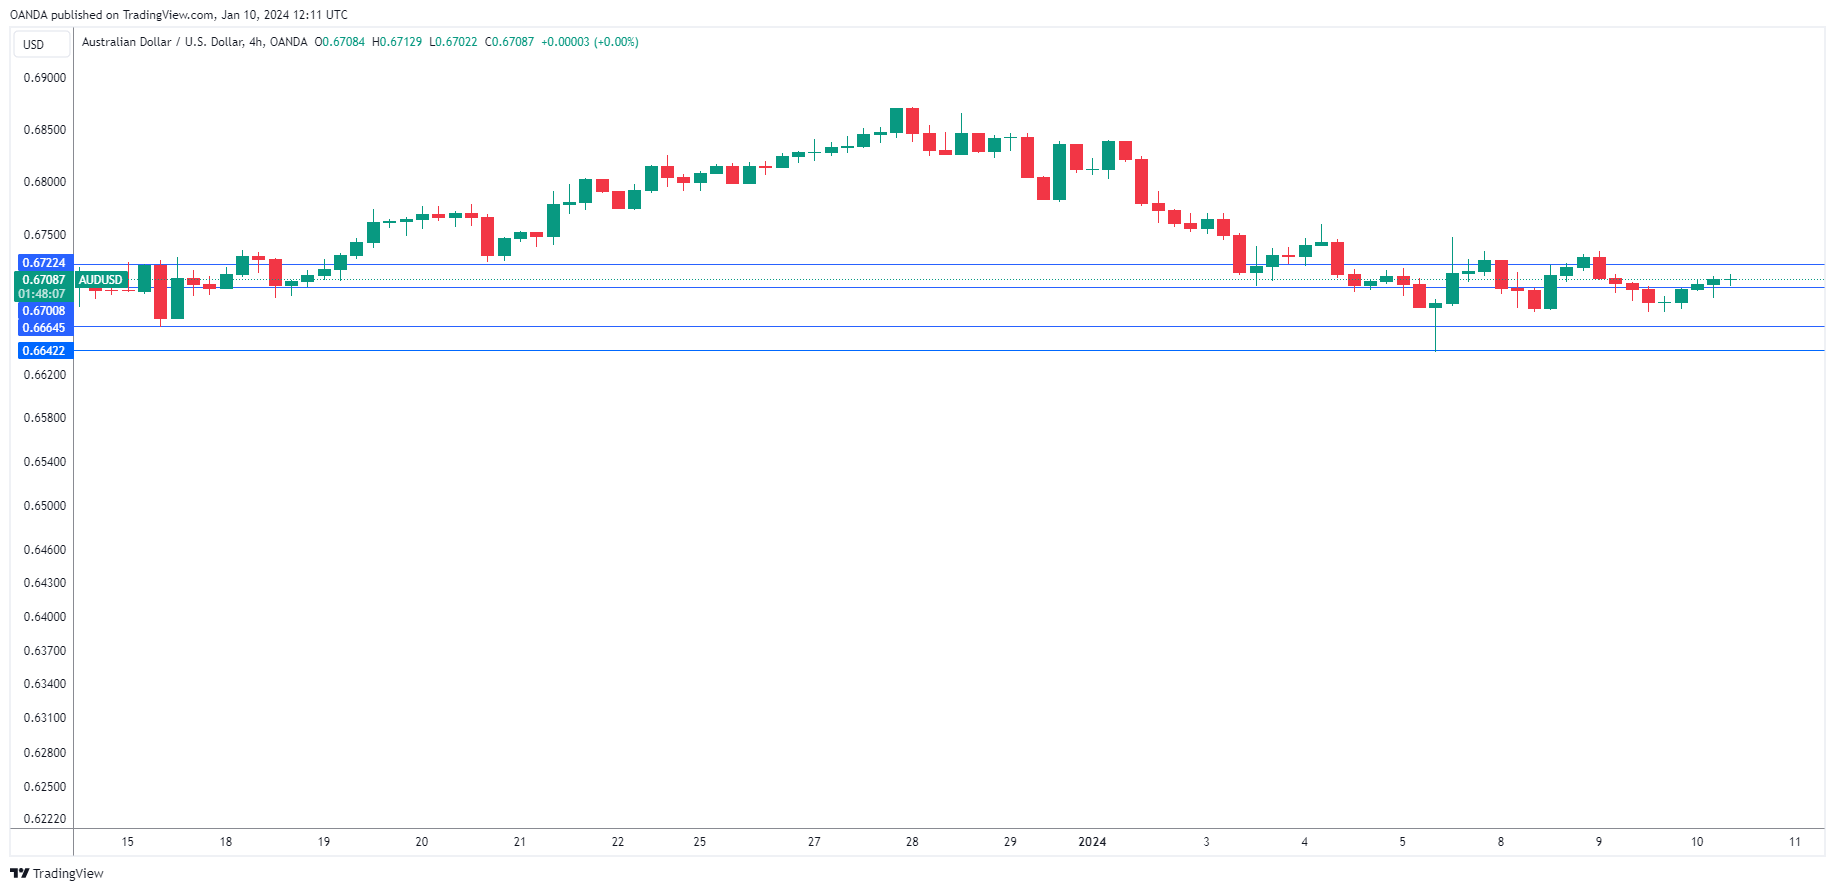
The Australian dollar has rebounded on Wednesday. In the European session, AUD/USD is trading at 0.6705, up 0.28%.
Australian CPI eases to 4.3%
Australia’s CPI for November rose 4.3% y/y, down considerably from 4.9% in October and just shy of the market estimate of 4.4%. This marked the lowest reading since January 2022. A key measure of core inflation, the trimmed mean, climbed 4.6% compared to 5.3% in November.
The data indicates that the battle against inflation is moving in the right direction but more work needs to be done to achieve the inflation target of 2%. The markets are confident that the Reserve Bank of Australia is done with its rate-tightening cycle. The RBA has raised rates only once since June and policy makers are hoping that inflation continues to drop without further rate increases.
The RBA doesn’t meet until February 6 and is widely expected to hold rates at 4.35%. Investors have priced in a quarter-point cut in September, but that could change if there are any surprises from the fourth-quarter inflation report which comes out on January 31. If inflation is lower than expected, it would put pressure on the RBA to start cutting rates, perhaps as early as June.
The Australian dollar sparkled in the last two months of 2023, jumping 7% against the US dollar. The Aussie has hit a rough patch in January, falling 1.5%. The US dollar has looked sharp against the major currencies early in 2024, despite the Fed acknowledging that it expects to lower rates this year. Last week’s nonfarm payroll report was stronger than expected, providing support for the Fed to maintain rates in restrictive territory until inflation falls closer to the 2% target. This stance was reiterated by Atlanta Fed President Bostic on Monday, who said he has a “natural bias to be tighter” and that he anticipated two rate cuts the end of the year, with an initial one in the third quarter.
AUD/USD Technical
- AUD/USD is testing resistance at 0.6700. Above, there is resistance at 0.6722
- There is support at 0.6664 and 0.6642
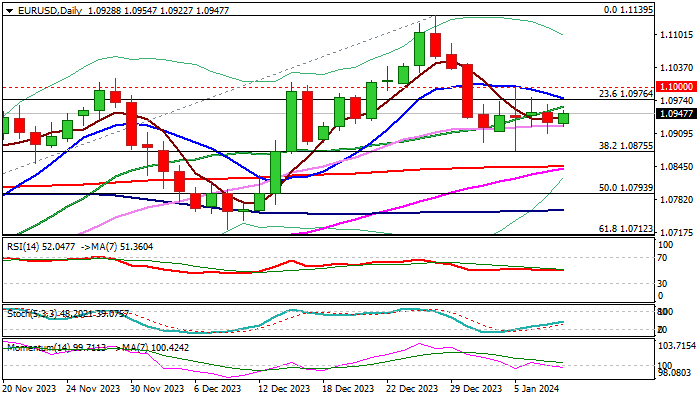
EUR/USD: Remains in Sideways Mode But Slight Bullish Bias Fueled by Thick Weekly Cloud
EURUSD remains in extended sideways mode and looking for direction signal after several attempts on both sides failed.
Conflicting daily indicators (MA’s in mixed setup / rising negative momentum / north-heading RSI) contribute to directionless action, though the picture remains bullishly aligned as thick weekly Ichimoku cloud continues to underpin, and weekly studies are positive.
Immediate downside risk is expected to be limited while the price action stays above pivotal supports at 1.0910/1.0875 (weekly cloud top / Fibo 38.2% of 1.0448/1.1139 / range floor) but sustained break above upper pivots at 1.0978 / 1.1000 (10DMA / psychological / range top) will be required to bring bulls fully in play and signal an end of corrective phase from 1.1139 (Dec 28 peak).
Res: 1.0978; 1.1000; 1.1045; 1.1084.
Sup: 1.0910; 1.0875; 1.0845; 1.0821.
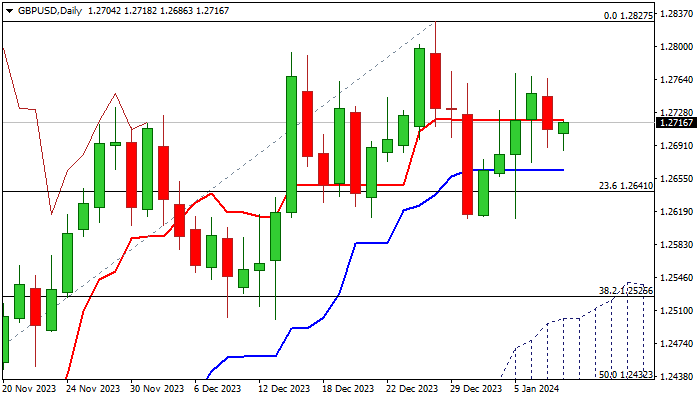
GBP/USD: Near-Term Action Lacks Clearer Direction Signal But Overall Still Bullishly Aligned
Cable is holding around 1.2700 mark in early Wednesday, following a triple upside rejection at 1.2770 zone.
Larger picture shows the pair trading below the middle of the range (1.2610/1.2827) which extends into fourth consecutive week and capped by 200WMA (1.2837).
Daily studies are mixed as MA’s remain bullishly aligned, but momentum is turning negative, lacking clearer direction signal.
Daily Tenkan-sen (1.2720) marks the first upper trigger, followed by pivots at 1.2770 zone, break of which to firm the structure and expose key barriers (range top / 200WMA).
First support lays at 1.2663 (daily Kijun-sen), guarding lower pivots at 1.2610/1.2598 (range floor / weekly cloud top).
BOE Governor Bailey’s speech to the Treasury Committee is the top event for sterling today, with focus on release of US inflation report on Thursday, which could provide stronger signals.
Res: 1.2720; 1.2770; 1.2793; 1.2827.
Sup: 1.2686; 1.2663; 1.2598; 1.2526.
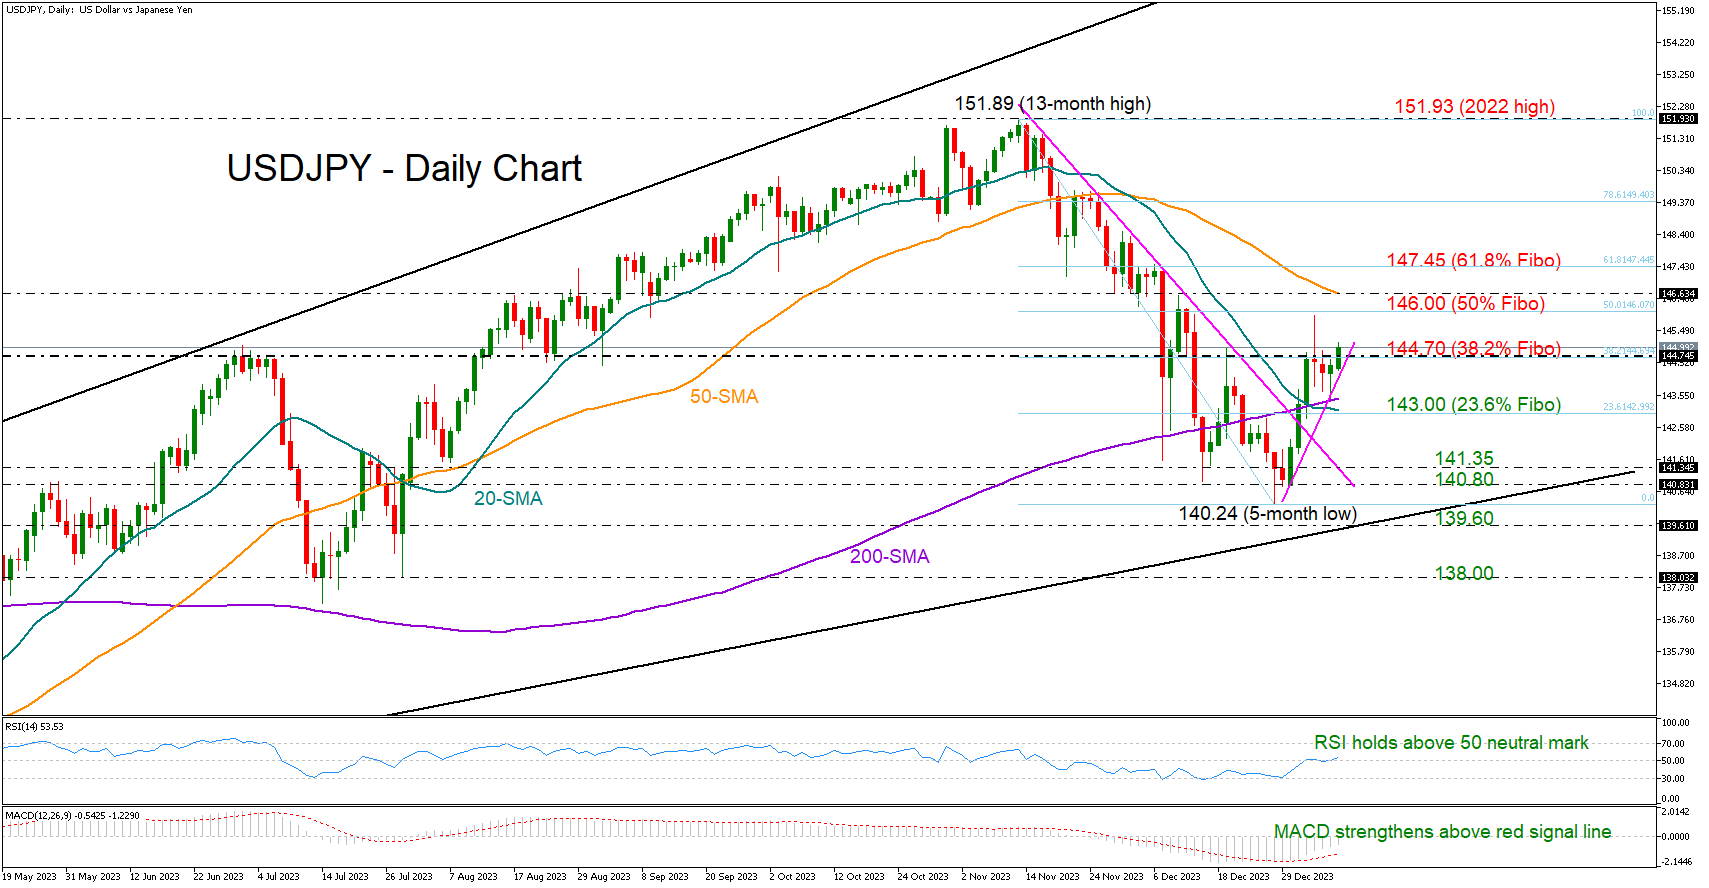
USDJPY Turns Up, But is the Rebound Sustainable?
- USDJPY aims for a bullish breakout ahead of Thursday’s US CPI data
- Momentum indicators are encouraging, but trend signals are still cautious
USDJPY found new buyers near its 20-day simple moving average (SMA) at 143.40 on Tuesday, drifting higher to close mildly positive on the day.
Upside pressures persisted early on Wednesday, bringing the important 144.70 region, which coincides with the 38.2% Fibonacci retracement of the previous downleg, back under examination. A durable move above that border could be the key for an extension towards the 146.00 round level and the 50-day SMA, while higher the door will open for the 61.8% Fibonacci mark of 147.45.
The upturn in the RSI and the MACD is a positive signal that buying confidence is improving. Yet, the negative risks have not faded yet as the pair is still struggling to overcome its 200-period SMA on the four-hour chart. Moreover, the bearish crossover between the 20- and 200-day SMAs and the narrowing gap between the 50- and 200-day SMAs could be an indication that the latest rebound may not be sustainable.
Hence, the 20- and 200-day SMAs will stay under the spotlight. Should the bears breach that floor, squeezing the price below the 143.00 number, they could revisit the broken resistance trendline from November’s highs around 141.35. If the previous downtrend resumes below 140.80, the next stop could be near the 2023 support trendline at 139.60.
In a nutshell, if the 144.70 area gives way, USDJPY could progress to higher levels in the coming sessions. Though, given the discouraging trend signals, buyers may need to see new higher highs in the market to raise their exposure.
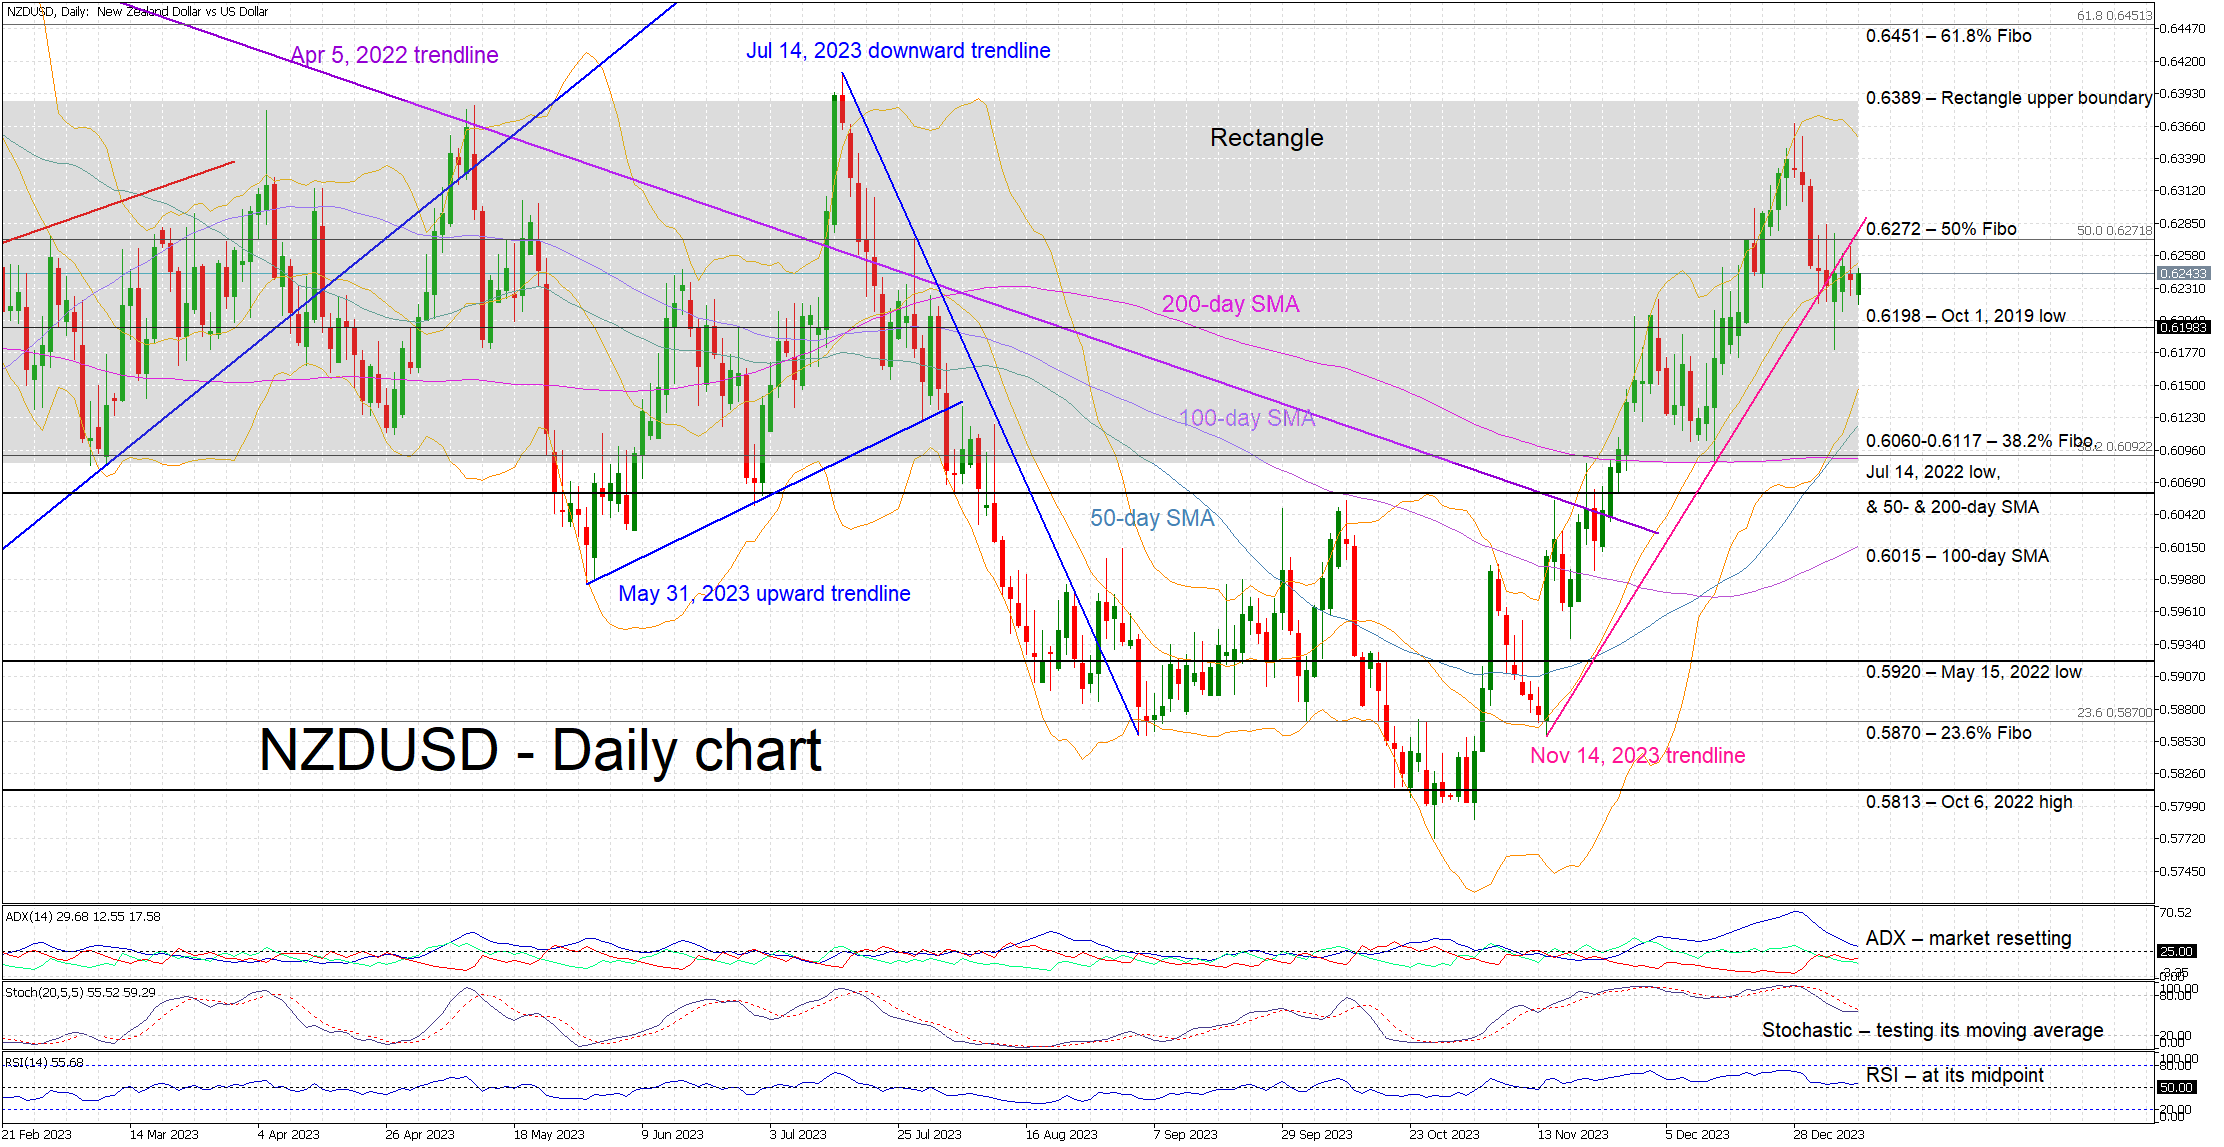
Is NZDUSD on the Brink of Another Decent Move?
- NZDUSD continues to trade sideways
- It is almost at the midpoint of its 2023 rectangle
- Momentum indicators are in waiting mode
NZDUSD is in the green today but it continues to range-trade. Market participants appear to be in waiting mode with the bears trying to engineer another correction in order to recoup part of the losses incurred during the October-December upleg. They have managed to keep NZDUSD below the November 14, 2023 trendline but they probably need stronger US data this week to push NZDUSD even lower.
The momentum indicators remain mostly on the sidelines. More specifically, the RSI is trading sideways at its midpoint. Similarly, the Average Directional Movement Index (ADX) is moving lower, almost in a vertical fashion, towards its 25-threshold and thus signaling the end of the recent bullish trend. More importantly, the stochastic oscillator is hovering close to its midpoint and apparently prepares to test the resistance set by its moving average. The outcome of this battle could send a strong signal for the direction of NZDUSD.
If the bulls remain hungry, they could try to lead NZDUSD above the November 14, 2023 trendline and the 50% Fibonacci retracement of the April 5, 2022 – October 13, 2022 downtrend at 0.6272. If successful, they could have a go at the rectangle’s upper boundary at 0.6389 with the next resistance point being only a tad higher at the 61.8% Fibonacci retracement of 0.6451.
On the flip side, the bears are trying to regain market control. They are probably keen to push NZDUSD below the October 1, 2019 low at 0.6198 and open the door to a more protracted correction. The next support area comes at the 0.6060-0.6117 range, which is defined by 38.2% Fibonacci retracement, the July 14, 2022 low and the 50- and 200-day simple moving averages (SMAs), and could probably be the first real test of the bears’ determination.
To sum up, NZDUSD trades sideways with the bears itching for a correction but currently lacking the support of the momentum indicators.
Nikkei 225: Major Bullish Breakout from 7-month Range With Further Potential Upside in Store
- Nikkei 225 rallied to a 34-year high & outperformed the major US benchmark US stock indices year-to-date.
- Domestic demand-oriented sectors are the outperformers in the current bullish movement seen in the Japanese stock market.
- The USD/JPY is now having a negative correlation with the Nikkei 225.
- The sustainability of the current bullish tone seen in the Nikkei 225 is largely more dependent on Japan’s inflation growth outlook.
The Nikkei 225 has indeed staged the bullish breakout from its 7-month range resistance at 33,770 in today’s Asian session (10 January) and rallied to a 34-year high at 34,440.
Overall, its current 2024 year-to-date return stands at +2.9% which has outperformed the major US benchmark stock indices; S&P 500 (-0.3%), Nasdaq 100 (-0.9%), Dow Jones Industrial Average (-0.4%), and Russell 2000 (-2.9%) over the first two trading weeks of 2024.
Weak direct correlation between USD/JPY & Nikkei 225
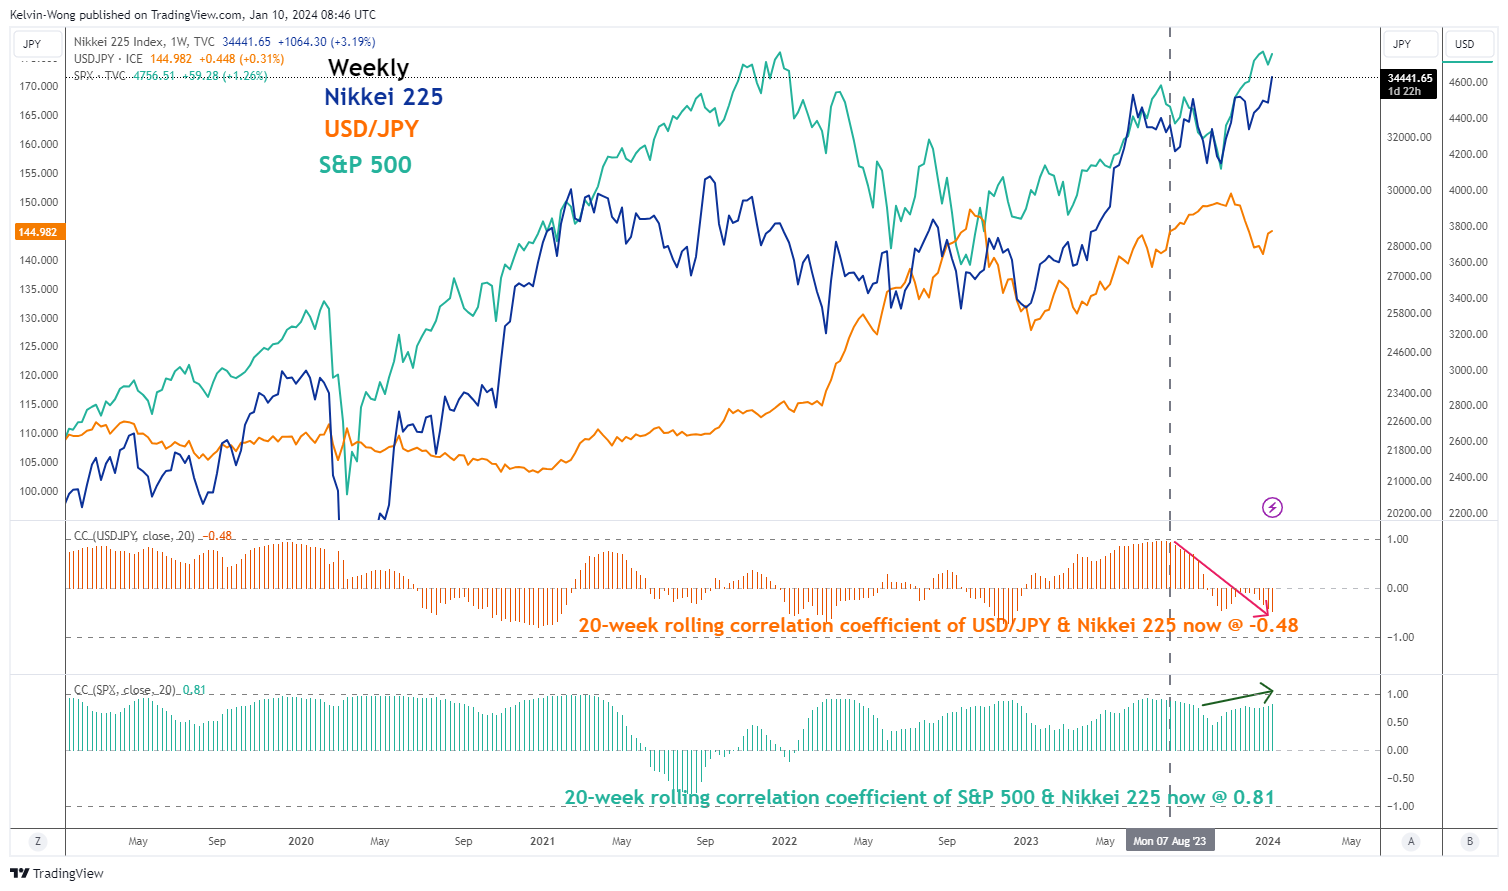
Fig 1: Long-term direct correlation analysis of USD/JPY & Nikkei 225 as of 10 Jan 2024 (Source: TradingView, click to enlarge chart)
So far since Q4 2023, the direct linkage of USD/JPY with Nikkei 225 has diminished and broken down which suggests that going forward, it is unlikely that a weaker JPY can boost investors’ sentiment in the Japanese stock market which it did in the past.
The 20-week rolling correlation coefficient of USD/JPY and Nikkei 225 has dropped to -0.48 as of 10 January 2024 at this time of the writing (see Fig 1).
An exit from a deflationary environment supports a further upmove in the Nikkei 225
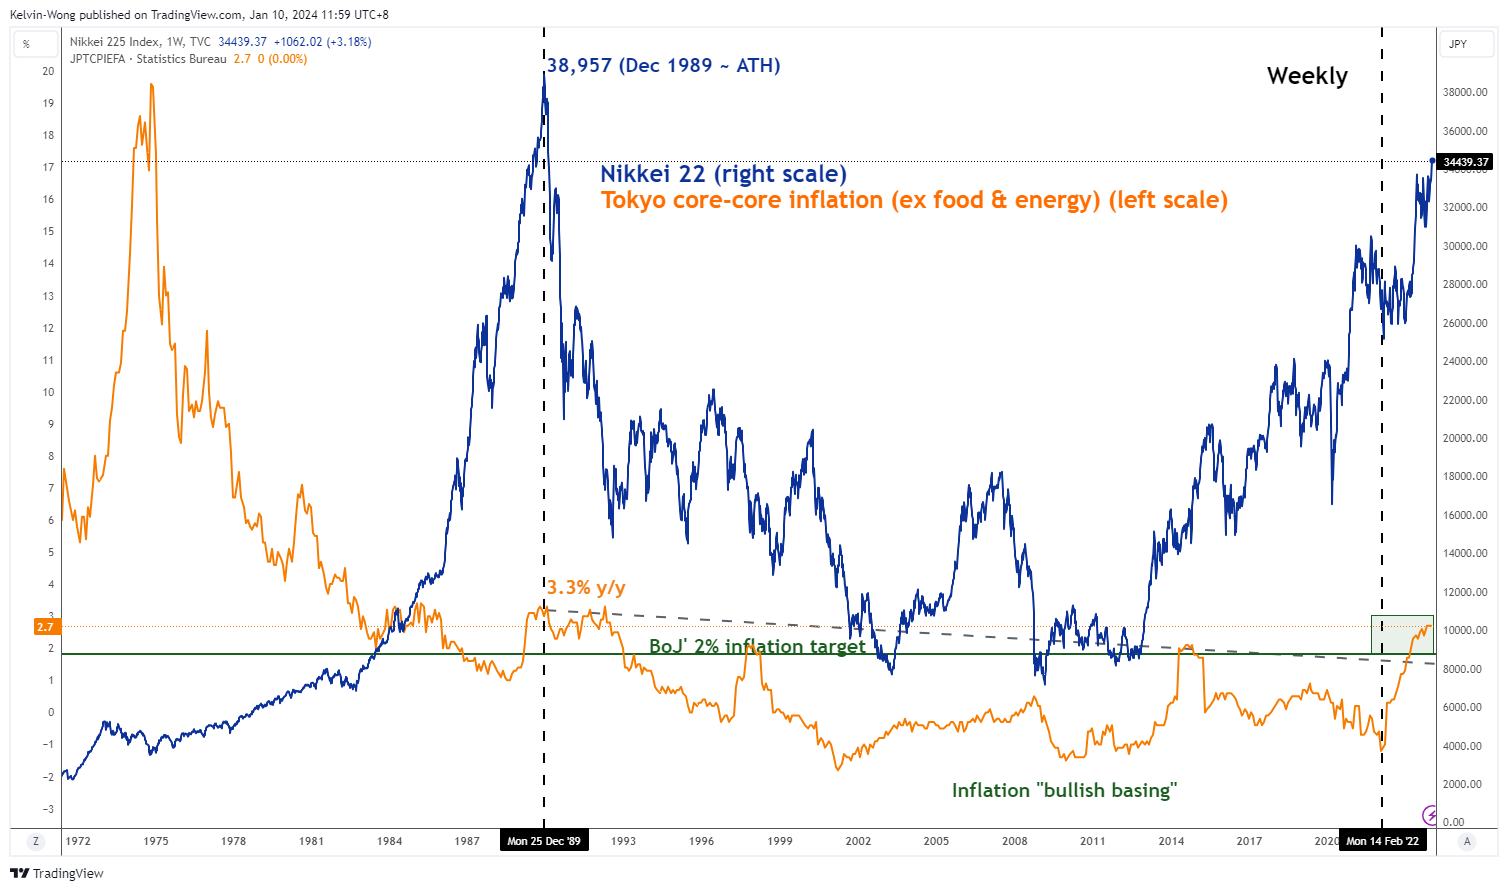
Fig 2: Trend movements of Tokyo core-core inflation with Nikkei 225 as of 10 Jan 2024 (Source: TradingView, click to enlarge chart)
Secondly, on closer inspection, the sustainability of the current bullish tone seen in the Nikkei 225 is largely more dependent on the inflation situation in Japan rather than a weaker JPY (more export-oriented). A clear path of an exit from a 20-year-plus deflationary environment is likely to lend support to another potential major uptrend phase in the Japanese stock market as consumers and business confidences resurface which in turn can see a significant increase in domestic demand.
Overlaying the leading Tokyo’s core-core inflation (excluding food and energy) trend with the Nikkei 225 (see Fig 2), the prior major uptrend of Nikkei 225 from February 2022 to June 2023 has moved in sync with an increase in the core-core inflation rate. The recent December 2023 reading of Tokyo’s core-core inflation has remained elevated at 2.7% year-on-year, unchanged from November; close to a 31-year high.
Outperformance of domestic demand-oriented sectors
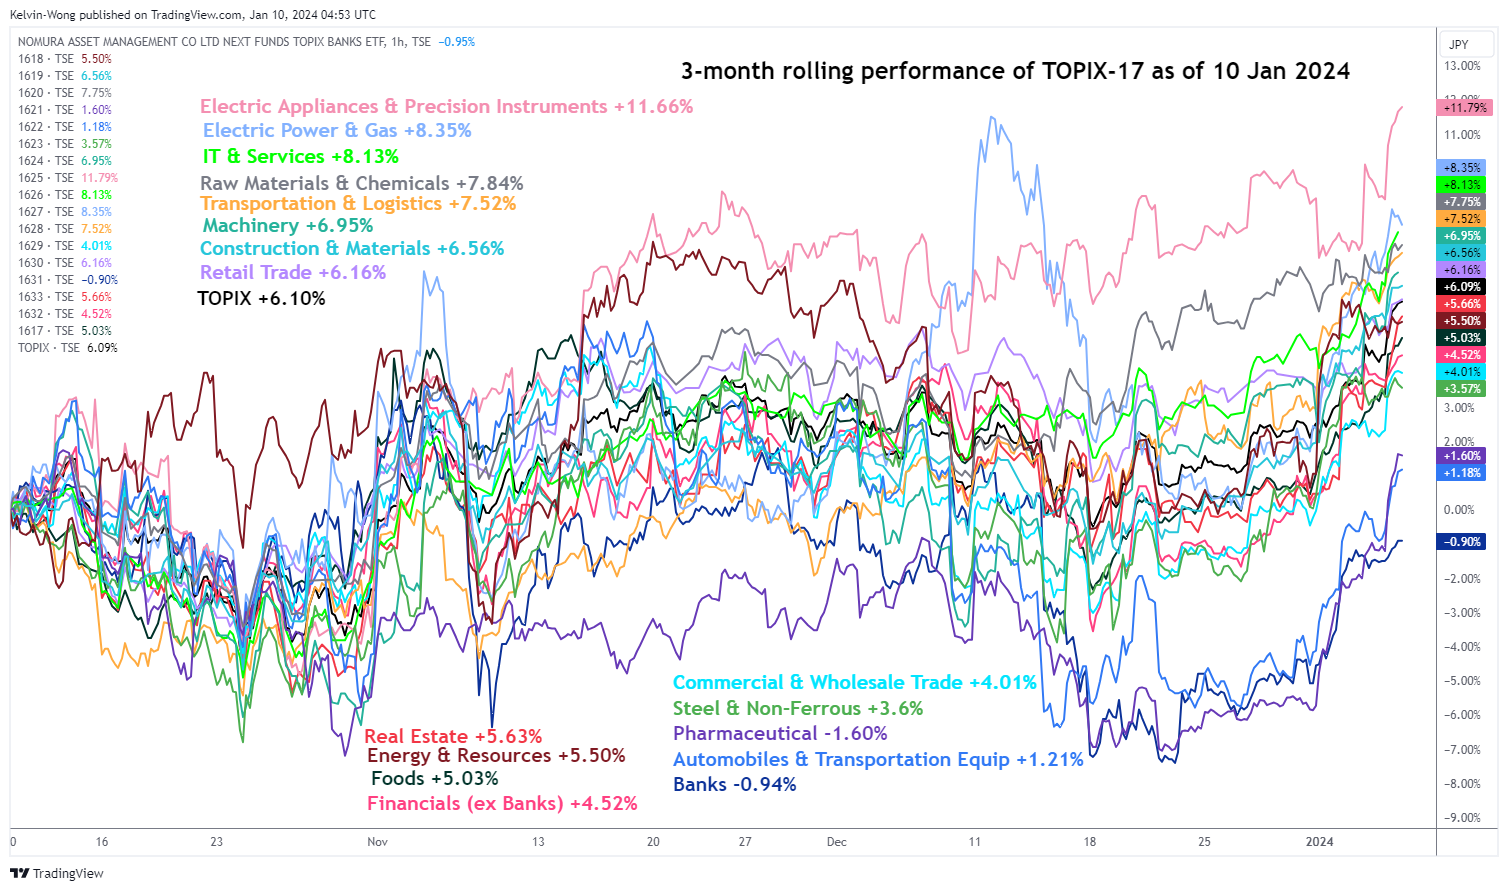
Fig 3: 3-month rolling performances of 17 TOPIX Sectors as of 10 Jan 2024 (Source: TradingView, click to enlarge chart)
From a medium-term sector rotation perspective (3-month rolling performance) among the 17 core TOPIX sectors, several domestic demand-oriented sectors such as IT & Services (+8.13%), Transportation & Logistics (+7.52%), Construction & Materials (+6.65%) outperformed the general market (TOPIX +6.10%). In contrast, sectors that tend to depend on a weaker JPY underperformed; Commercial & Wholesale Trade (+4%), and Automobiles & Transportation Equipment (+1.21%) (see Fig 3).
36,600 next major resistance to watch on Nikkei 225
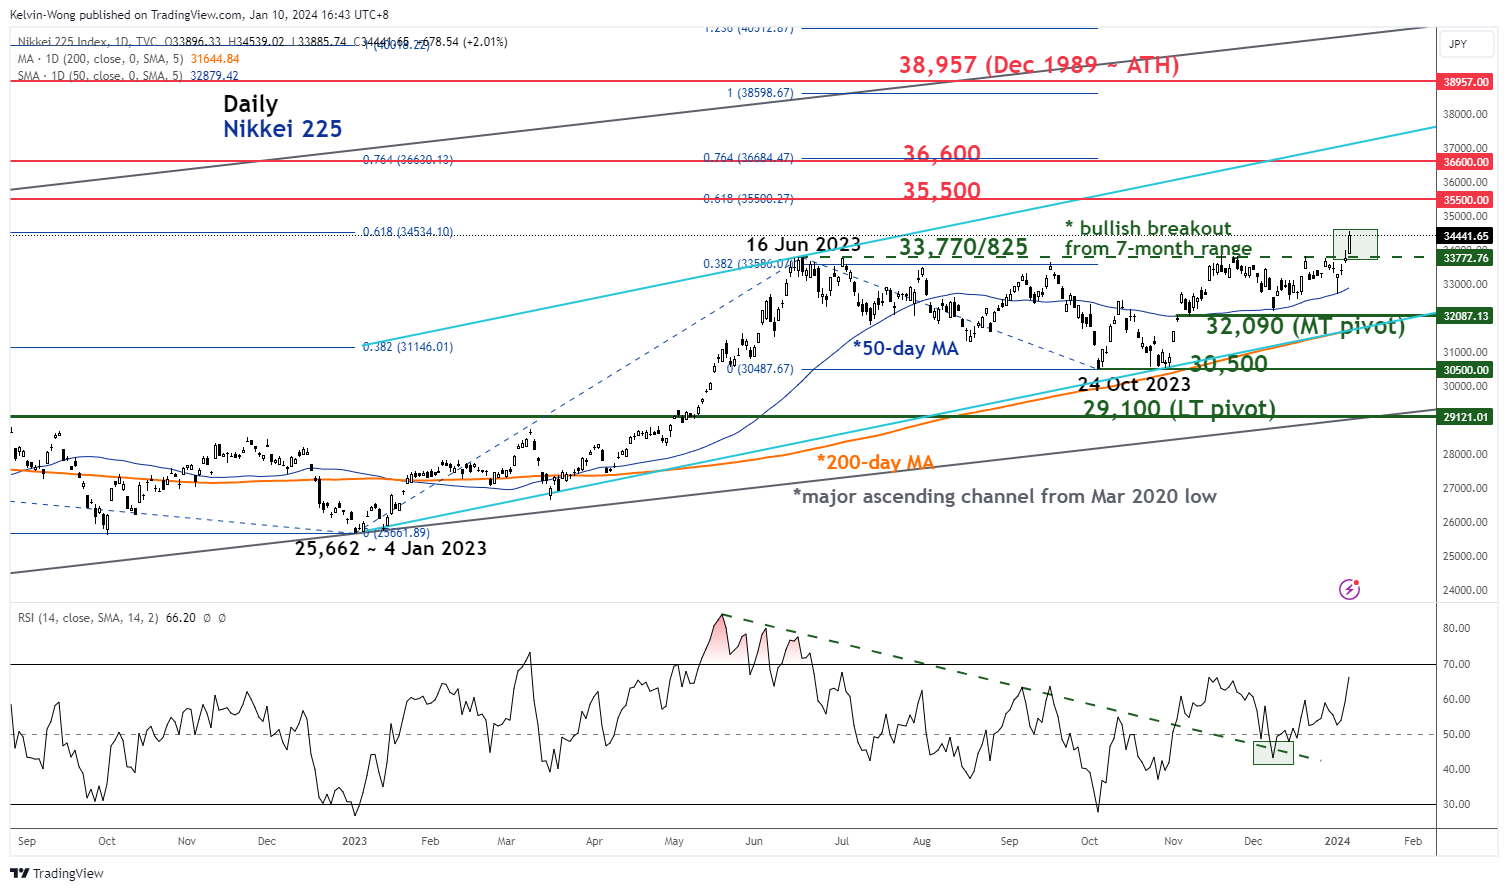
Fig 4: Nikkei 225 major & medium-term trends as of 10 Jan 2024 (Source: TradingView, click to enlarge chart)
In the lens of technical analysis, the Nikkei 225 is likely to have kickstarted a potential fresh major uptrend phase with its key medium-term pivotal support at 32,090 (the lower boundary of the ascending channel from 4 January 2023 low & upward sloping 200-day moving average).
The next major resistance stands at 36,600 which is defined by the upper boundary of the ascending channel and a cluster of Fibonacci extension levels.
In addition, the daily RSI momentum indicator has continued to exhibit bullish momentum conditions and has not reached an extreme overbought region (above 70 level).
On the other hand, failure to hold at 32,090 negates the bullish tone to expose the next medium-term support at 30,500 in the first step.