
Sample Category Title
Australia: Inflation Continues to Moderate in November
While dwelling and rents may still be of concern, the increase in household services prices was less than expected while many household goods are not measured in November, the month for the increasingly significant Black Friday/Cyber Monday sales.
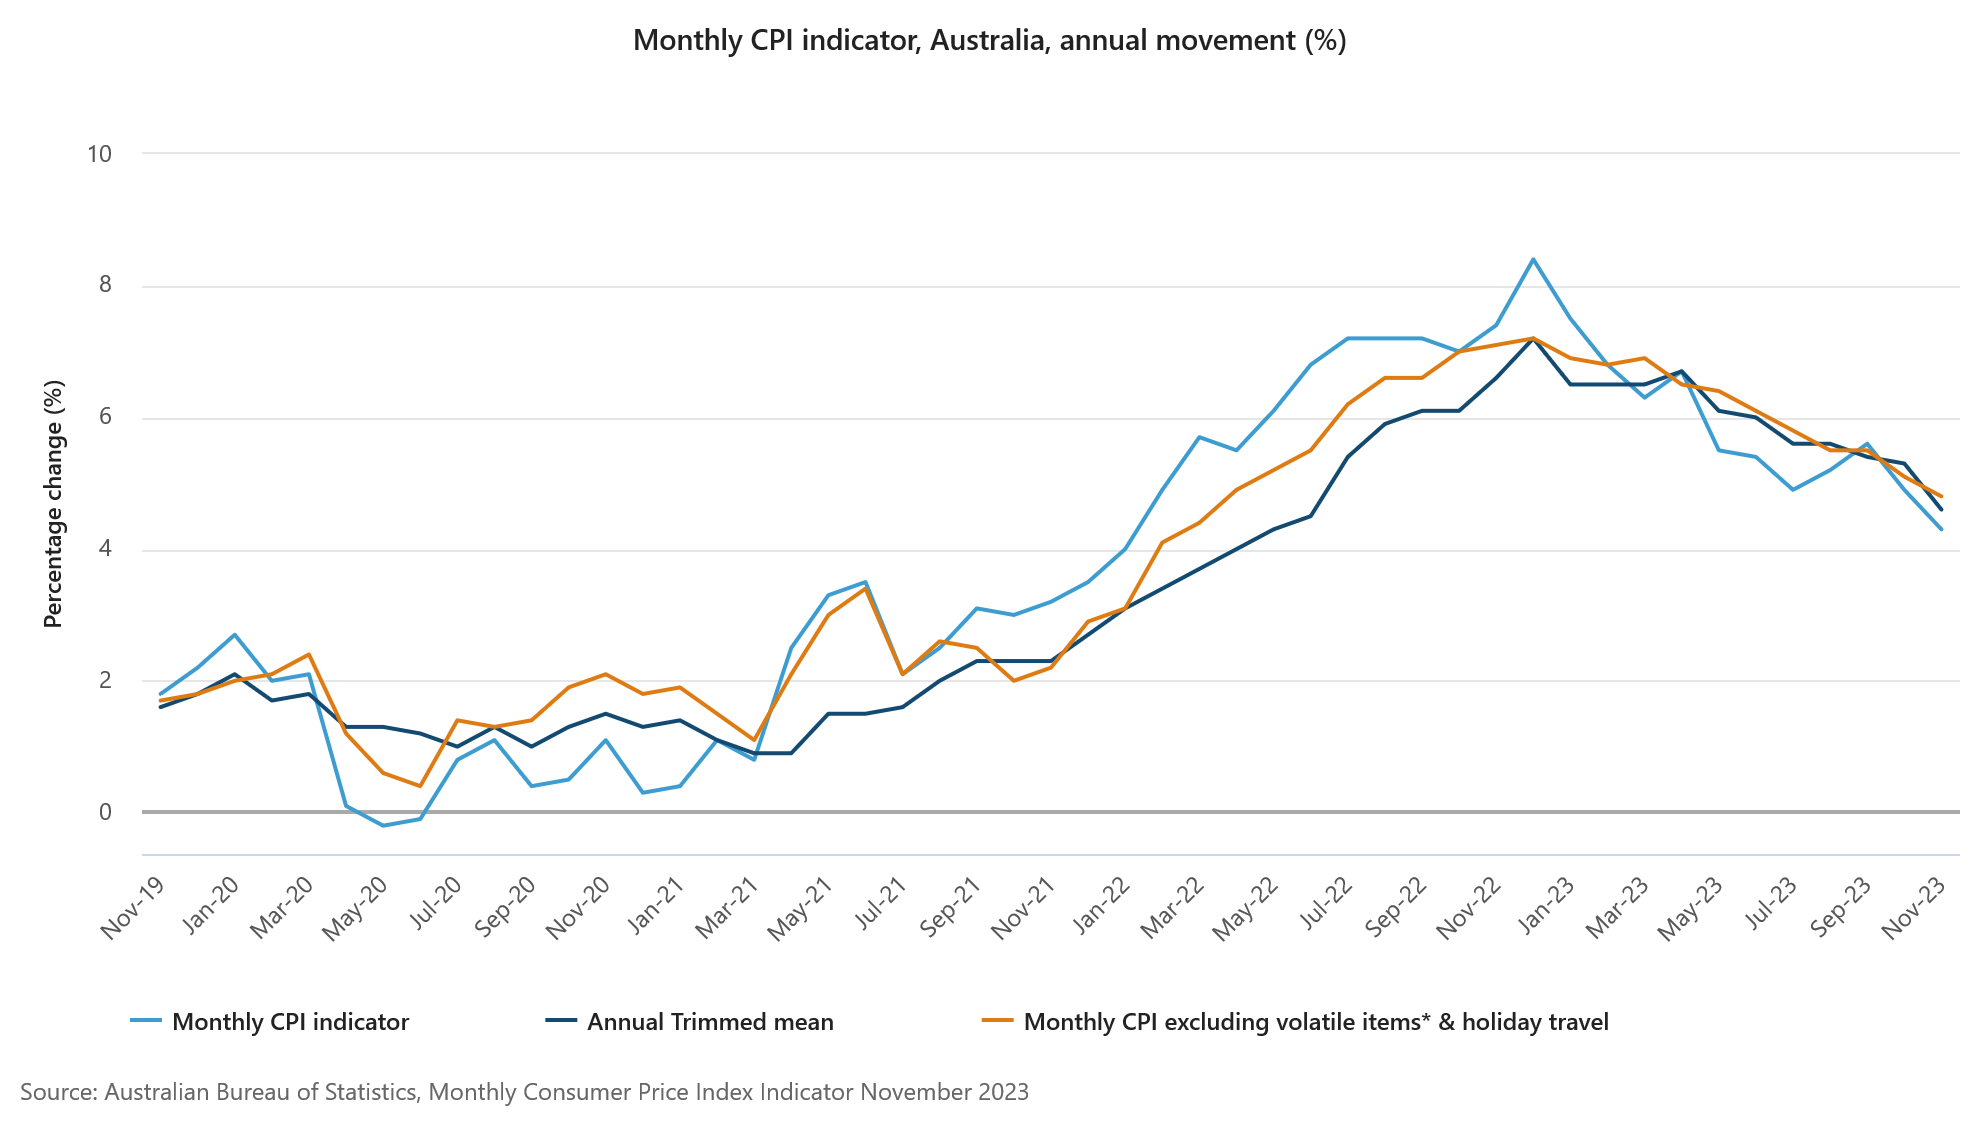
The Monthly CPI Indicator rose 4.3% in the year to November, down from 4.9%yr in October and a recent peak of 8.4%yr in December 2022. The November print was a touch softer than Westpac’s forecast and the market’s median forecast of 4.4%yr. At face value the November Monthly CPI Indicator suggests that if there are any risks to our current December quarter CPI forecast of 0.8%qtr it is very slightly to the downside.
As noted in our preview, the second month of the quarter provides us with an update for most of the quarterly surveys of household services. In this regard the overall tone for household services inflation was softer than expected outside the sizable jump in insurance premiums.
But the mid-month does not include many household goods which are surveyed in the first month of the quarter, so the November survey would have missed some of the price declines associated with the Black Friday/Cyber Monday sales.
To give you a feel for the impact of Black Friday sales, in 2022 garment prices rose 2.2% in October, fell 4.1% in November to then lifted 2.1% in December. So far this year garment prices rose 3.4% in October then fell 2.9% in November.
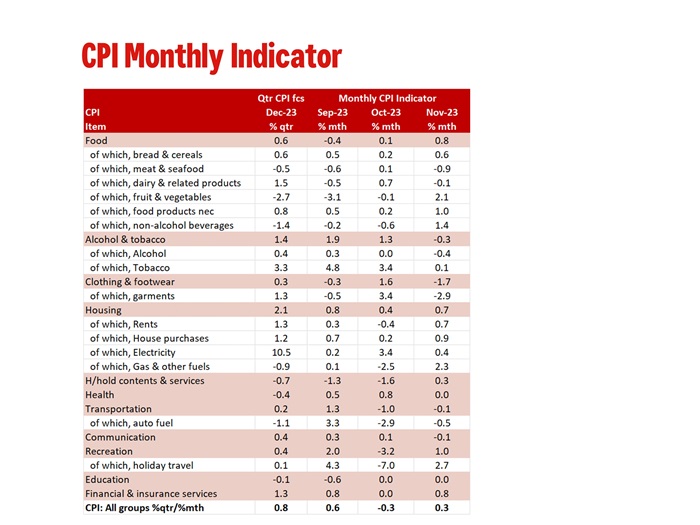
In the month, the Monthly CPI was up 0.3% compared to our forecast for 0.5% increase. The most significant surprises were.
- A 0.3% fall in alcohol & tobacco compared to a +0.1% forecast.
- A 1.7% fall in clothing & footwear led by a 2.9% fall in garments. The fall in garment prices would have been associated with the Black Friday sales. All other components of this group are surveyed in the first month of the quarter so their data misses the Black Friday sales. Had they been surveyed in November, the reported fall in clothing & footwear would have been larger.
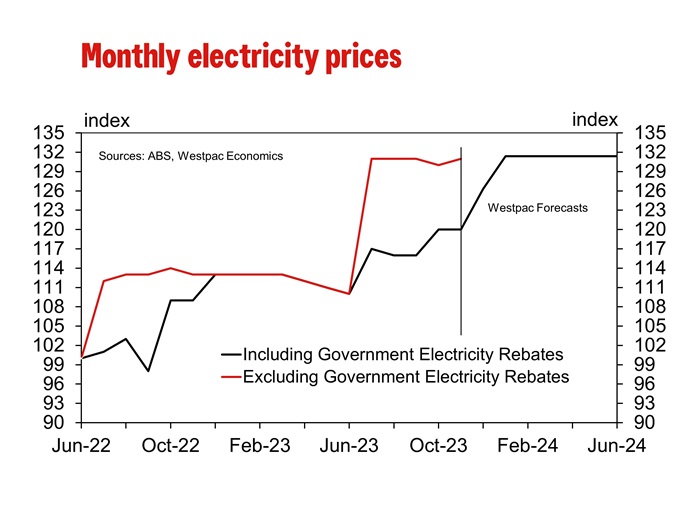
- Total housing costs rose close to expectations at 0.7%. However, the mix was a surprise. Rents rose as expected at 0.7% but dwelling prices were stronger than expected lifting 0.9% in the month, the strongest monthly increase in almost a year. Offsetting this, electricity prices rose just 0.4% (we expected a larger number due to the unwinding of government energy rebates as we did not account for the application further rebates). Gas & other fuels did jump 2.3% but this followed a 2.5% decline in October.
- Household contents & services were softer than anticipated lifting just 0.3% in the month. Outside of non-durable goods no household goods were survey this month missing the Black Friday sales. However, while hairdressing did lift 1.7% other household services prices rose just 0.5% holding back the increase in household services to just 0.7%.
- Recreation was also softer than expected at 1.0% in the month due to holiday travel, up 2.7% vs 5.1% forecast with a domestic travel lifting just 1.8% in the month following a 1.9% decline in October. In addition, other recreation, sport & culture fell 0.1% in the month with the quarterly surveys for equipment for sport & camping plus games, toys & hobbies picking up the Black Friday sales effect.
- Also, it is worth noting the 3.8% rise in insurance premiums. Insurance premiums are up 16.3% in the year. The ABS notes that higher reinsurance and natural disaster costs contributed to higher premiums for house, home contents and motor vehicle insurance.
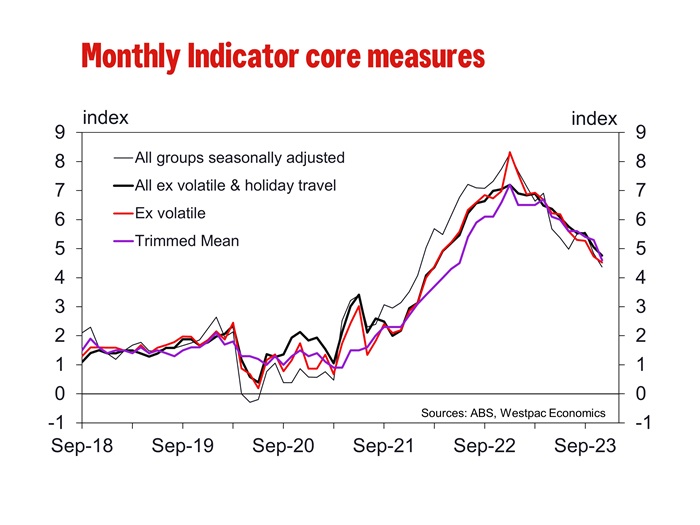
The Monthly Indicator Trimmed Mean printed 4.6%yr, down from 5.3%yr in October and well down from the recent peak of 7.2% in December 2022. The quarterly Trimmed Mean printed 5.2%yr in September and our current forecast for the December quarter is 4.4%yr. As you can see in the chart below all the monthly core annual inflation measures continued to soften in November.
We are reviewing the full data set for the Monthly CPI Indicator to see if there any implications for our December quarter CPI forecast for both headline and core inflation.
Technical Outlook and Review
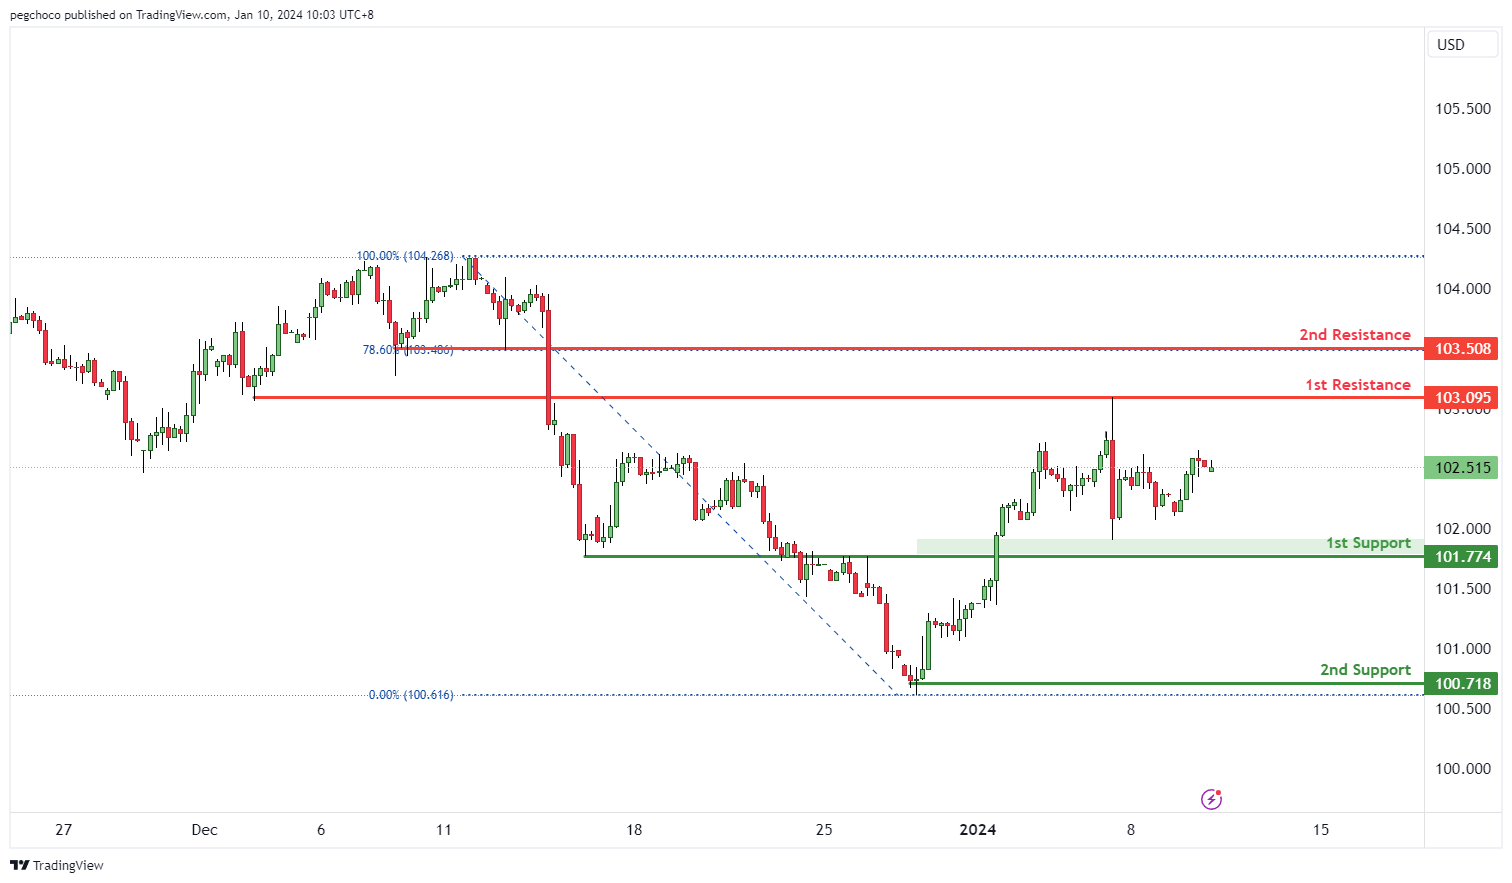
DXY:
The DXY (US Dollar Index) chart currently shows a neutral overall momentum, suggesting a lack of strong directional bias in the US Dollar. As a result, there is potential for price to fluctuate between the 1st support and 1st resistance levels.
The 1st support at 101.77 is considered significant as it aligns with an overlap support level. This level may act as a potential area where buying interest could emerge, providing temporary support to the DXY.
The 2nd support at 100.71 is identified as a swing low support, further reinforcing its significance as a potential support zone.
On the resistance side, the 1st resistance at 103.09 is categorized as an overlap resistance. This level may act as a substantial barrier where selling interest could intensify.
The 2nd resistance at 103.50 is noted as a pullback resistance and is also associated with the 78.60% Fibonacci Retracement level. This level could potentially serve as a strong resistance point.
EUR/USD:
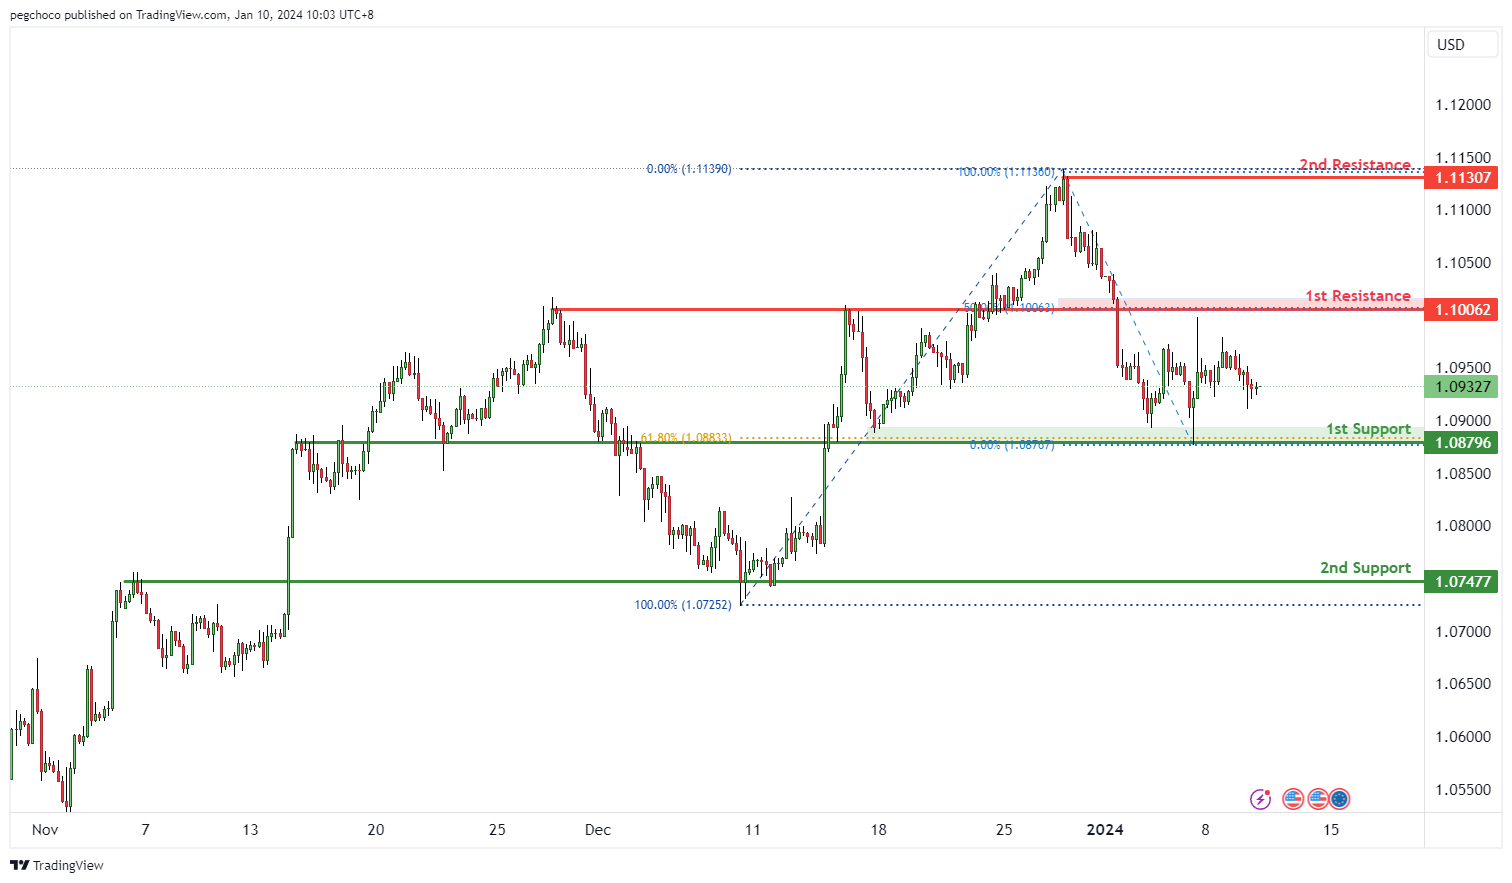
The EUR/USD chart currently exhibits a bullish overall momentum, indicating strength in the Euro relative to the US Dollar. However, the chart suggests a potential scenario where price could fluctuate between the 1st resistance and 1st support levels.
The 1st support at 1.0879 is significant for several reasons. It is identified as an overlap support and also coincides with the 61.80% Fibonacci Retracement level. This confluence of technical factors makes it a strong potential support zone, suggesting that buyers may step in at this level, providing temporary support for the EUR/USD pair.
The 2nd support at 1.0747 is also categorized as an overlap support, reinforcing its significance as a potential support area.
On the resistance side, the 1st resistance at 1.1006 is identified as an overlap resistance and is associated with the 50% Fibonacci Retracement level. This level may act as a substantial barrier where selling interest could intensify.
The 2nd resistance at 1.1130 is noted as a swing high resistance. Swing highs often mark points of reversal or resistance in price movement.
EUR/JPY:
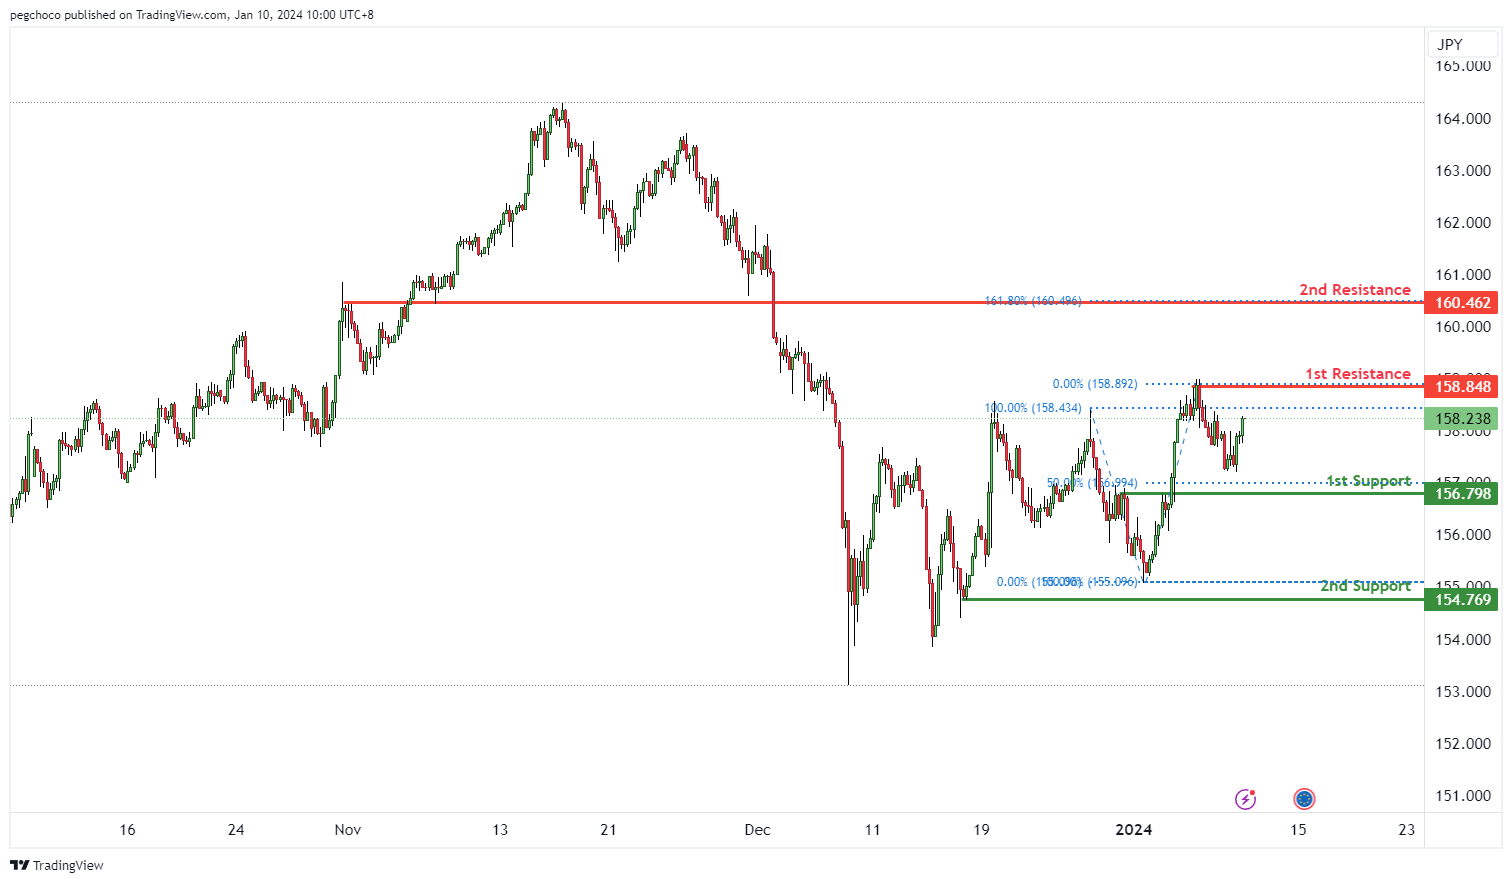
The EUR/JPY chart currently exhibits an overall bullish momentum. In this context, there is a potential scenario for price to make a bullish continuation towards the 1st resistance.
The 1st resistance level at 158.84 is categorized as a pullback resistance, indicating a level where selling interest could intensify. The 2nd resistance level at 160.46 is marked as an overlap resistance that is associated with the 161.80% Fibonacci extension level, further reinforcing its significance as a potential barrier for the price.
On the support side, the 1st support level at 156.79 is considered as a pullback support that aligns with the 50.00% Fibonacci retracement level. The 2nd support level at 154.76 is identified as a swing-low support, adding to its significance as a potential support area.
EUR/GBP:
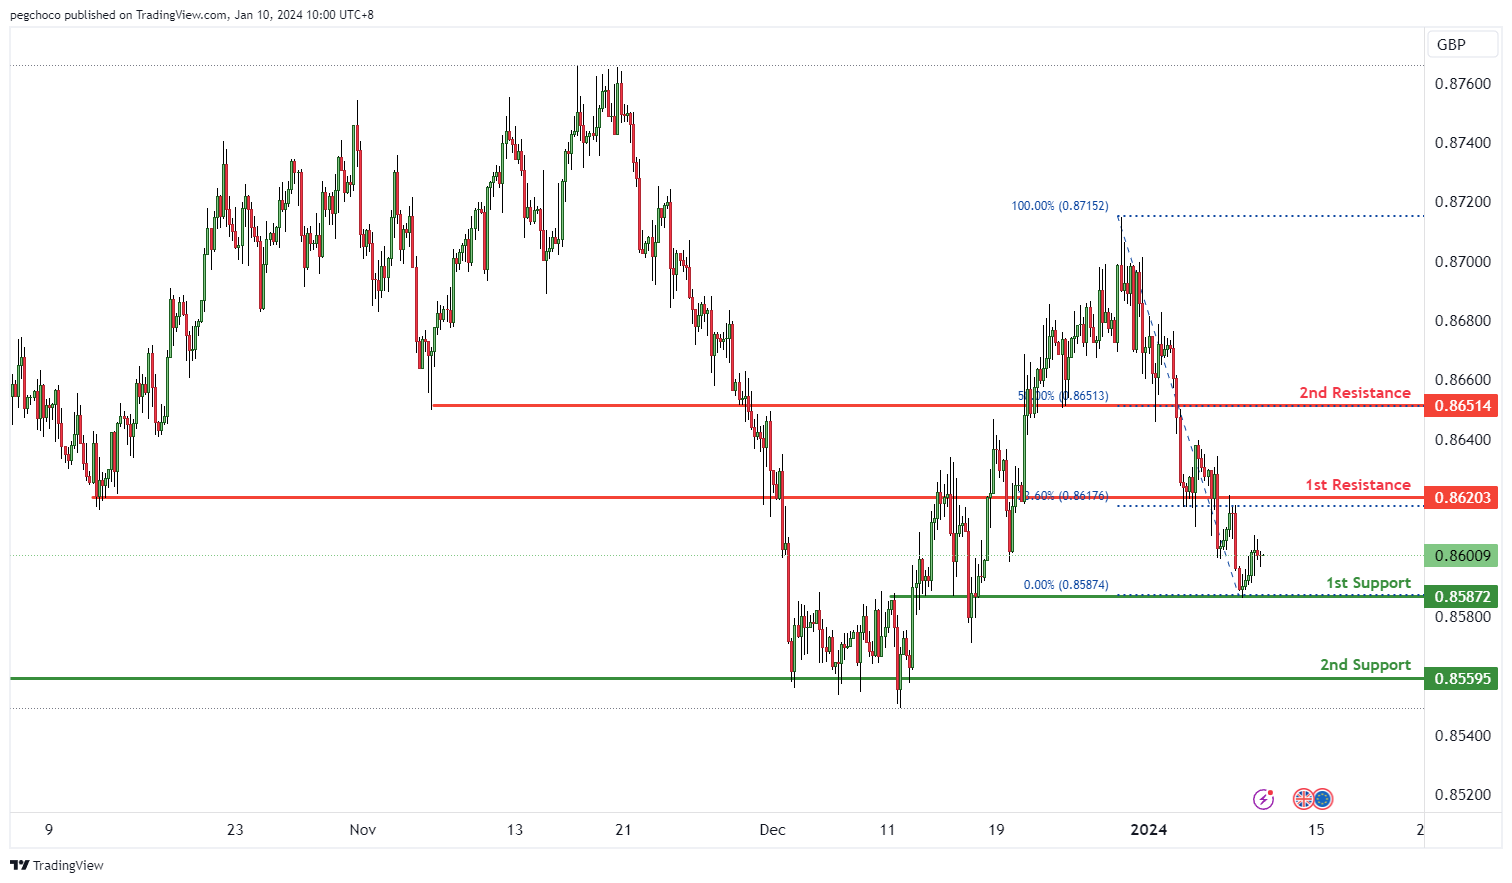
The EUR/GBP chart currently exhibits an overall bearish momentum. In this context, there is a potential scenario for price to make a bearish continuation towards the 1st support.
The 1st support level at 0.8587 is considered significant due to its characteristics as an overlap support. The 2nd support level at 0.8559 is identified as a multi-swing low support, further reinforcing its significance as a potential support zone.
On the resistance side, the 1st resistance level at 0.8620 is categorized as an overlap resistance that aligns with the 23.60% Fibonacci retracement level, making it a notable potential barrier where selling interest could intensify. The 2nd resistance level at 0.8651 is marked as a pullback resistance that is associated with the 50.00% Fibonacci retracement level, further reinforcing its significance as a potential resistance level.
GBP/USD:
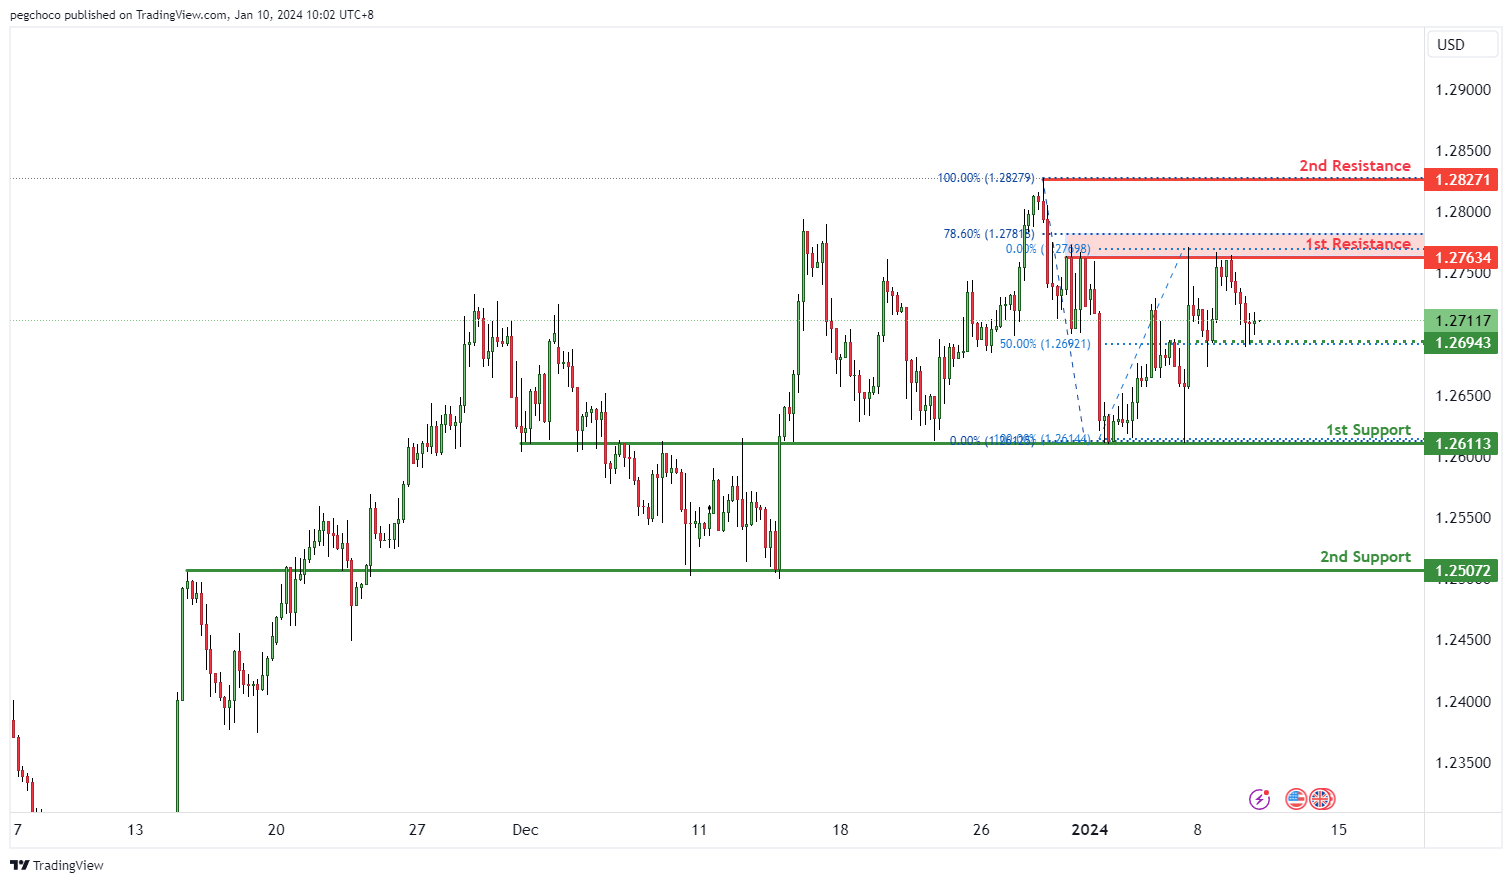
The GBP/USD chart currently demonstrates a bearish overall momentum, suggesting weakness in the British Pound compared to the US Dollar. This momentum indicates a potential scenario where price could continue its bearish movement towards the 1st support level.
The 1st support at 1.2611 is categorized as an overlap support. It is a significant level as it suggests a potential area where buying interest may emerge, providing temporary support for the GBP/USD pair.
The 2nd support at 1.2507 is also identified as an overlap support and reinforces its importance as a potential support zone. This level is further marked by the 50% Fibonacci Retracement, adding to its significance.
On the resistance side, the 1st resistance at 1.2763 is categorized as an overlap resistance, and it is associated with the 78.60% Fibonacci Retracement level. This level may act as a substantial barrier where selling interest could intensify.
The 2nd resistance at 1.2827 is noted as a swing high resistance. Swing highs often serve as points of reversal or resistance in price movement.
An intermediate support at 1.2694 is identified as an overlap support, and it coincides with the 50% Fibonacci Retracement level, further highlighting its importance.
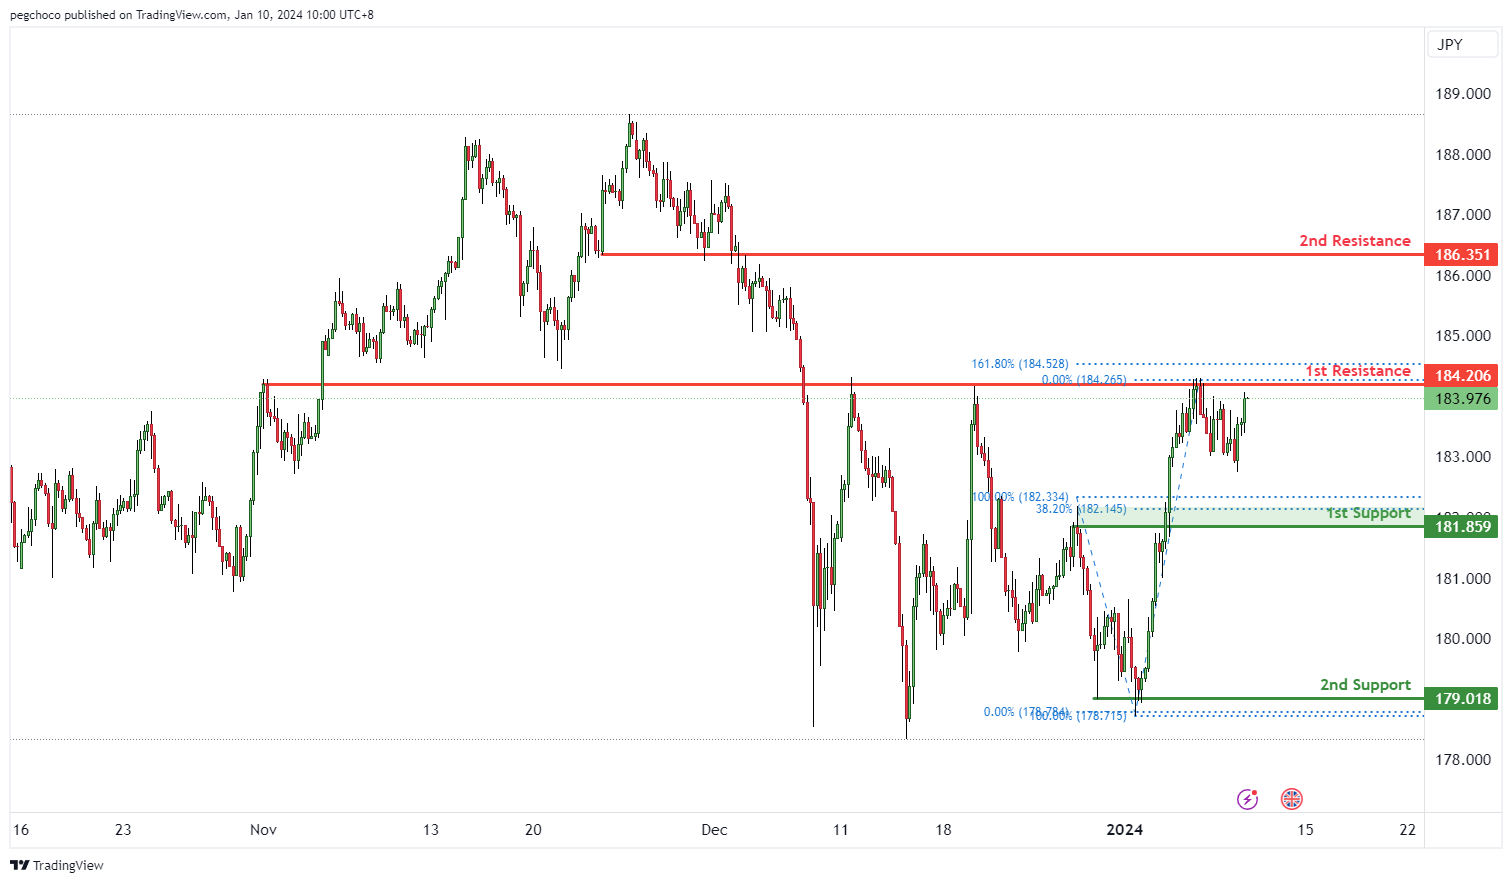
GBP/JPY:
The GBP/JPY chart currently exhibits an overall bullish momentum. In this context, there is a potential scenario for price to make a bullish continuation towards the 1st resistance.
The 1st resistance level at 184.20 is marked as an overlap resistance that aligns close to the 161.80% Fibonacci extension level. The 2nd resistance level at 186.35 is also identified as an overlap resistance, further reinforcing its significance as a potential resistance level.
On the support side, the 1st support level at 181.85 is categorized as a pullback support that aligns close to the 38.20% Fibonacci Retracement level, making it a notable potential support zone. The 2nd support level at 179.01 is identified as a swing-low support, further reinforcing its significance as a potential support area.
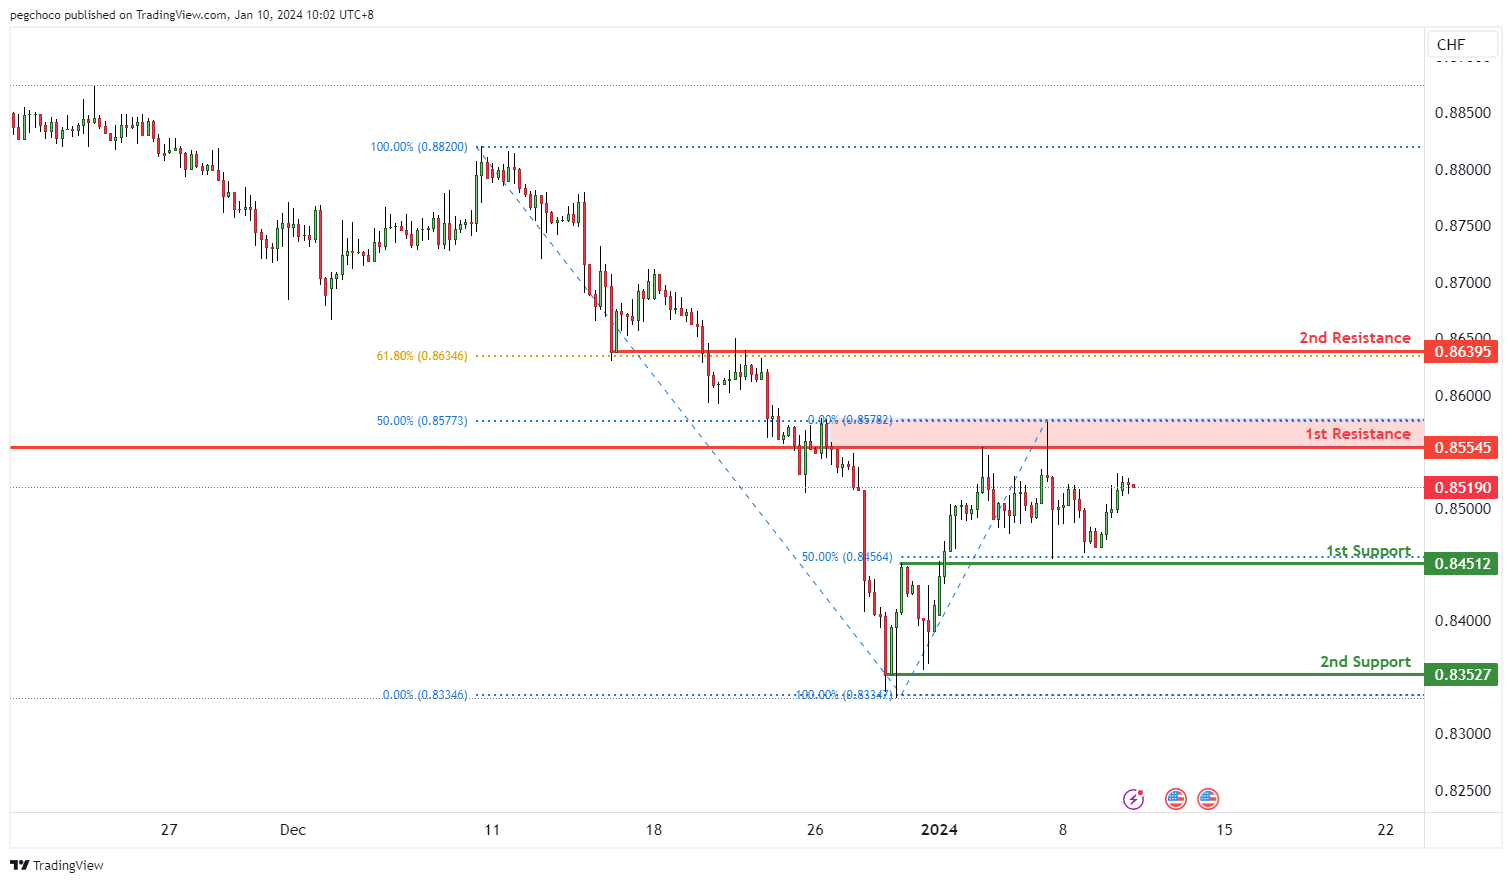
USD/CHF:
The USD/CHF chart currently exhibits a neutral overall momentum, indicating a lack of strong directional bias. In this scenario, price could potentially move within a range, fluctuating between the 1st resistance and 1st support levels.
The 1st support at 0.8451 is identified as an overlap support, and it aligns with the 50% Fibonacci Retracement level. This level is significant as it suggests a potential area where buying interest may emerge, providing temporary support for USD/CHF.
The 2nd support at 0.8352 is categorized as multi-swing low support, further reinforcing its significance as a potential support zone.
On the resistance side, the 1st resistance at 0.8554 is marked as an overlap resistance, coinciding with the 50% Fibonacci Retracement level. This level may act as a substantial barrier where selling interest could intensify.
The 2nd resistance at 0.8639 is also categorized as an overlap resistance and aligns with the 61.80% Fibonacci Retracement level, adding to its significance.
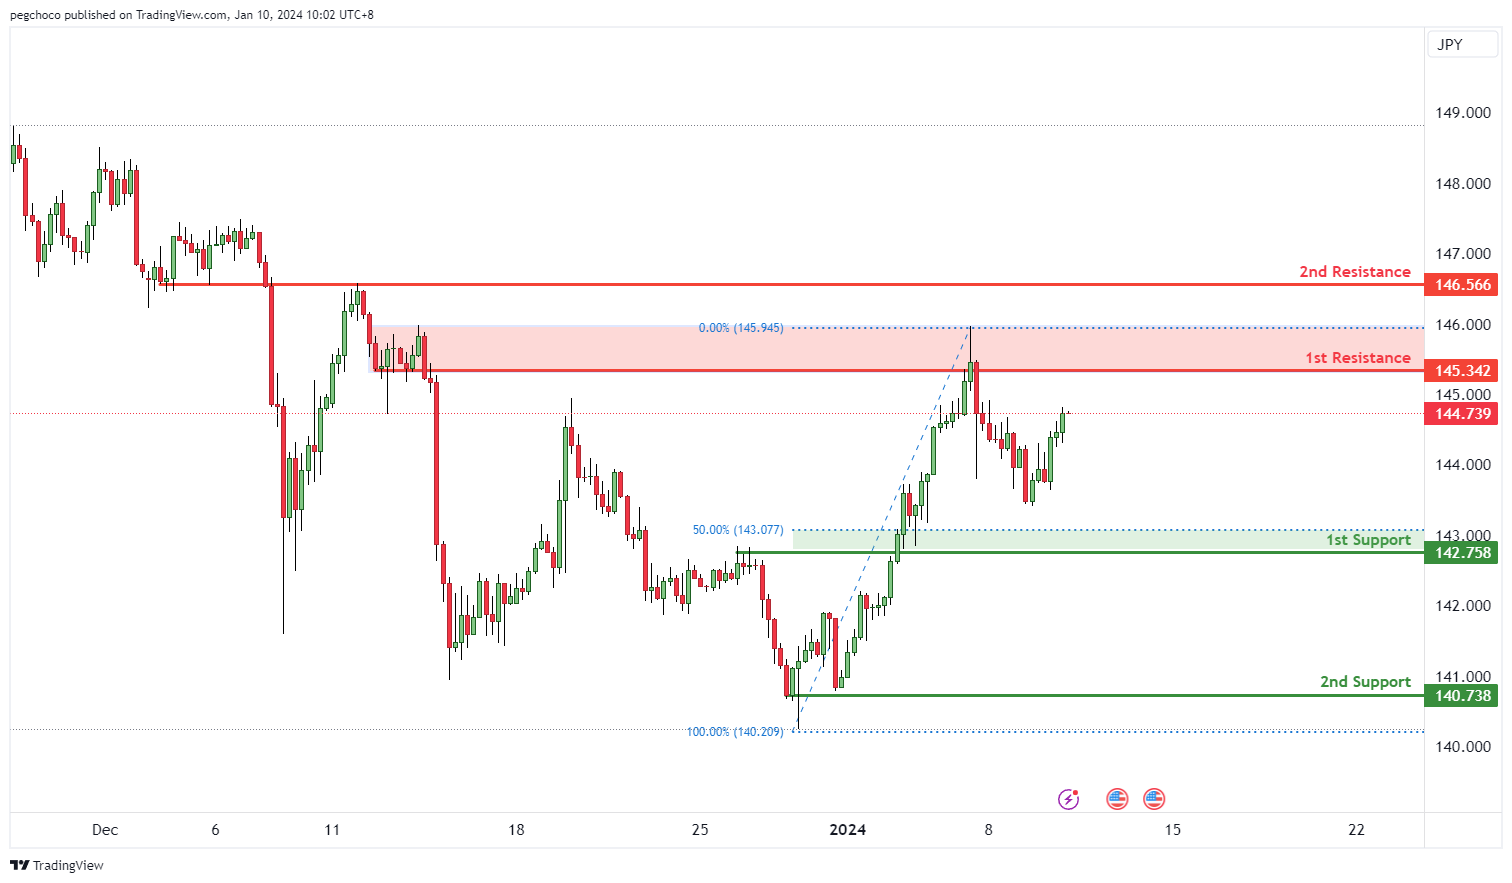
USD/JPY:
The USD/JPY chart currently exhibits a bullish overall momentum, suggesting strength in the US Dollar relative to the Japanese Yen. This momentum is supported by the potential for a bullish continuation towards the 1st resistance level.
The 1st support at 142.75 is identified as a pullback support and aligns with the 50% Fibonacci Retracement level. This level is significant as it suggests a potential area where buying interest may emerge, providing temporary support for USD/JPY.
The 2nd support at 140.73 is categorized as multi-swing low support, further reinforcing its significance as a potential support zone.
On the resistance side, the 1st resistance at 145.34 is marked as a swing high resistance. Swing highs often act as points of reversal or resistance in price movement.
The 2nd resistance at 146.56 is categorized as an overlap resistance, adding to its significance as a potential barrier for the price.
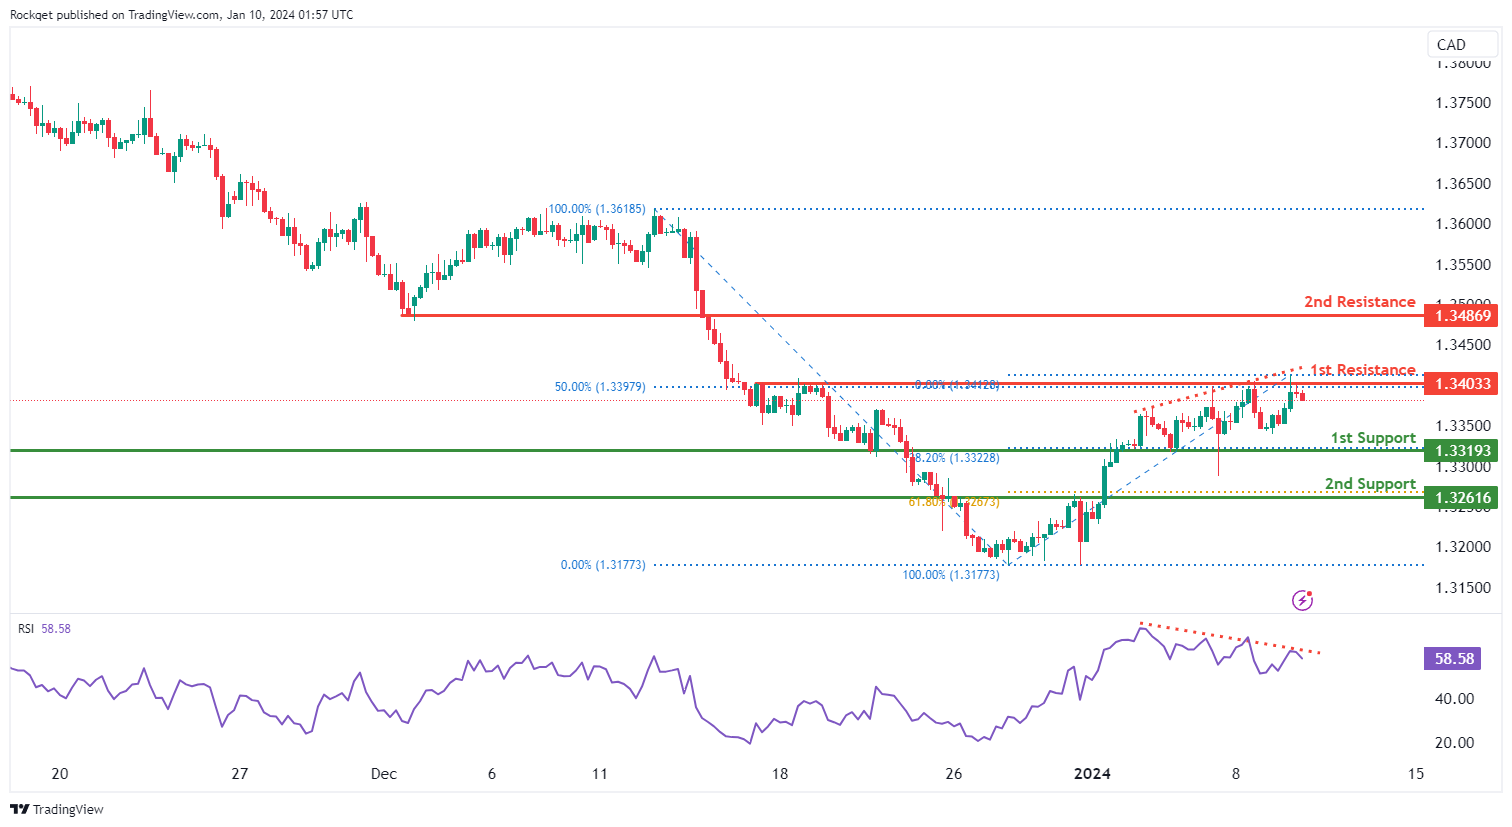
USD/CAD:
The USD/CAD chart currently exhibits an overall bullish momentum. However, the Relative Strength Indicator (RSI) is displaying a bearish divergence versus price, indicating a potential scenario for price to make a bearish reaction off the 1st resistance and drop towards the 1st support.
The 1st resistance level at 1.3403 is identified as a pullback resistance that aligns with the 50.00% Fibonacci retracement level. Higher up, the 2nd resistance level at 1.3486 is noted as a pullback resistance, further reinforcing its significance as a potential resistance zone.
To the downside, the 1st support level at 1.3319 is identified as a pullback support that aligns with the 38.20% Fibonacci retracement level. Further below, the 2nd support level at 1.3261 is marked as an overlap support that aligns with the 61.80% Fibonacci retracement level, further reinforcing its importance as a key support level.
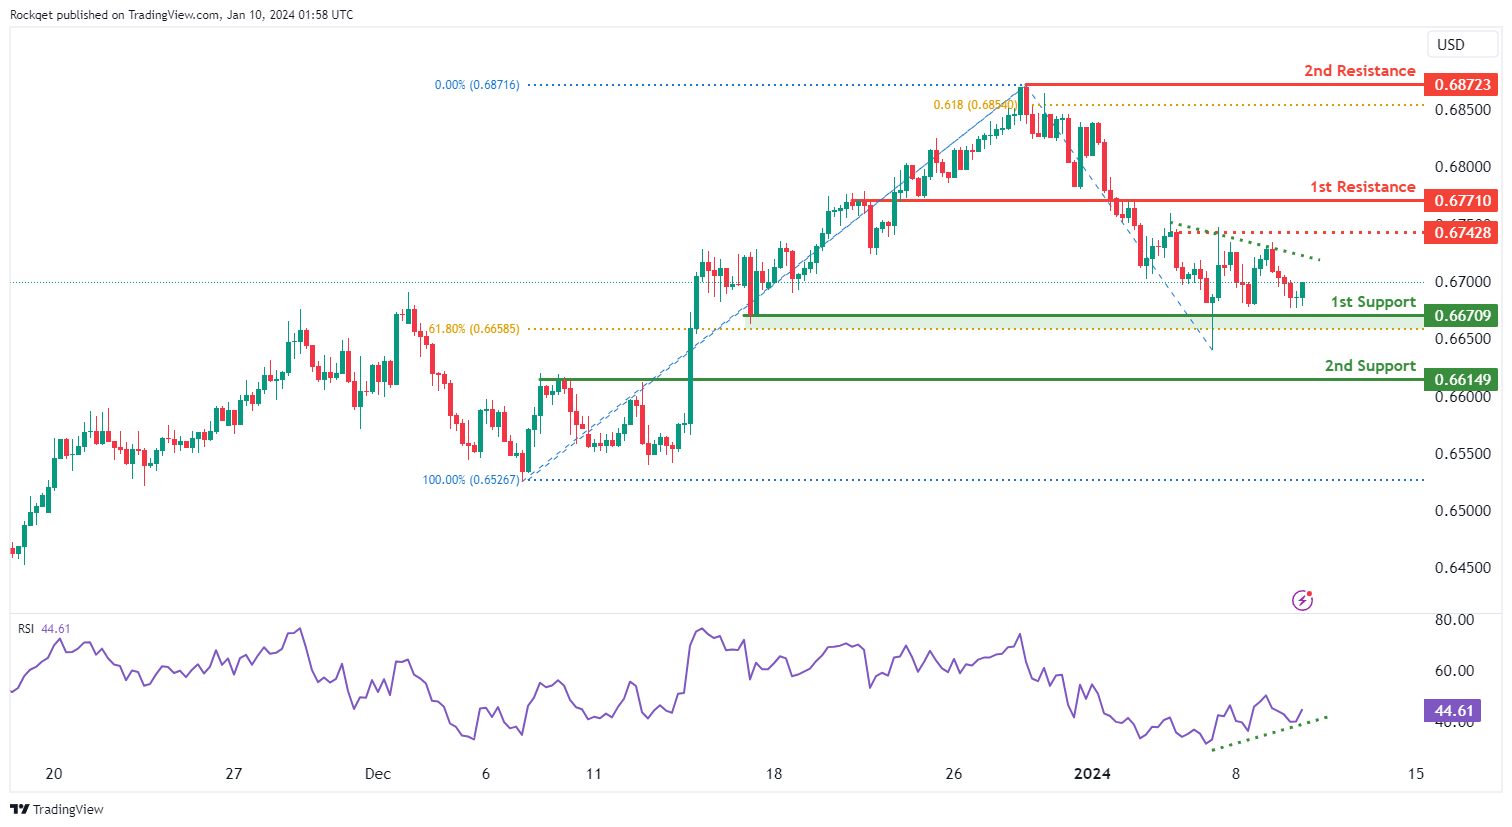
AUD/USD:
The AUD/USD chart currently exhibits an overall bearish momentum. However, the Relative Strength Indicator (RSI) is displaying a bullish divergence versus price, indicating a potential scenario for price to make a bullish rise towards the 1st resistance should it break above the intermediate resistance.
The intermediate resistance level at 0.6742 is identified as a pullback resistance while the 1st resistance level at 0.6771 is identified as an overlap resistance. Higher up, the 2nd resistance level at 0.6872 is noted as a swing-high resistance that aligns close to the 61.80% Fibonacci projection level, suggesting a potential barrier for further upside movement.
To the downside, the 1st support level at 0.6670 is identified as a pullback support that aligns close to the 61.80% Fibonacci retracement level. Further below, the 2nd support level at 0.6614 is also marked as an pullback support, further reinforcing its importance as a key support level.
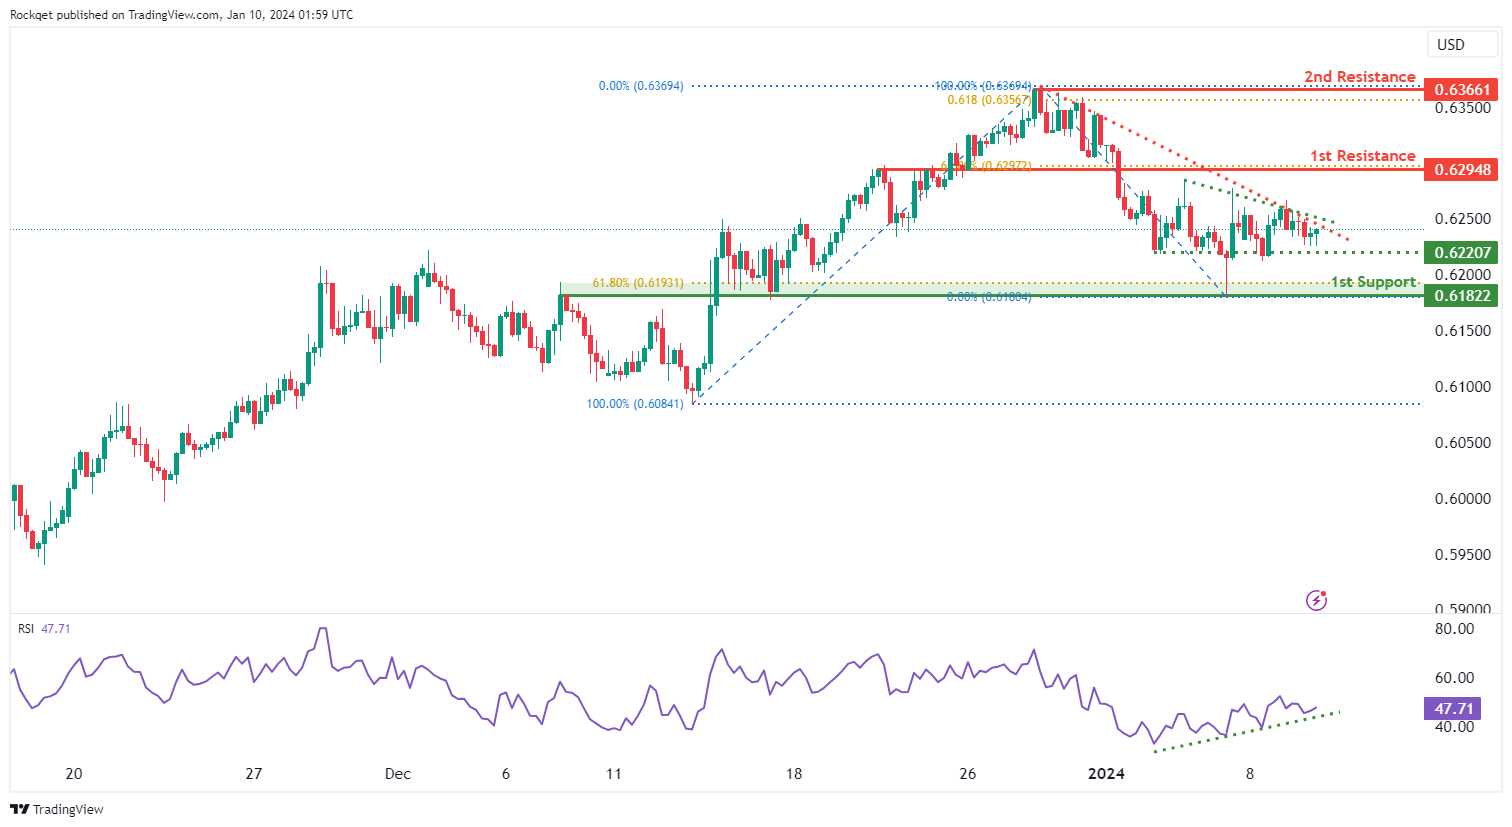
NZD/USD
The NZD/USD chart currently exhibits an overall bearish momentum. However, the Relative Strength Indicator (RSI) is displaying a bullish divergence versus price, indicating a potential scenario for price to make a bullish rise towards the 1st resistance should it break above the descending trendline.
The 1st resistance level at 0.6294 is identified as an overlap resistance that aligns with the 61.80% Fibonacci retracement level. Higher up, the 2nd resistance level at 0.6366 is noted as a swing-high resistance that aligns close to the 61.80% Fibonacci projection level, suggesting a potential barrier for further upside movement.
To the downside, the intermediate support level at 0.6220 is identified as a pullback support. Further below, the 1st support level at 0.6182 is marked as an overlap support that aligns close to the 61.80% Fibonacci retracement level, further reinforcing its importance as a key support level.
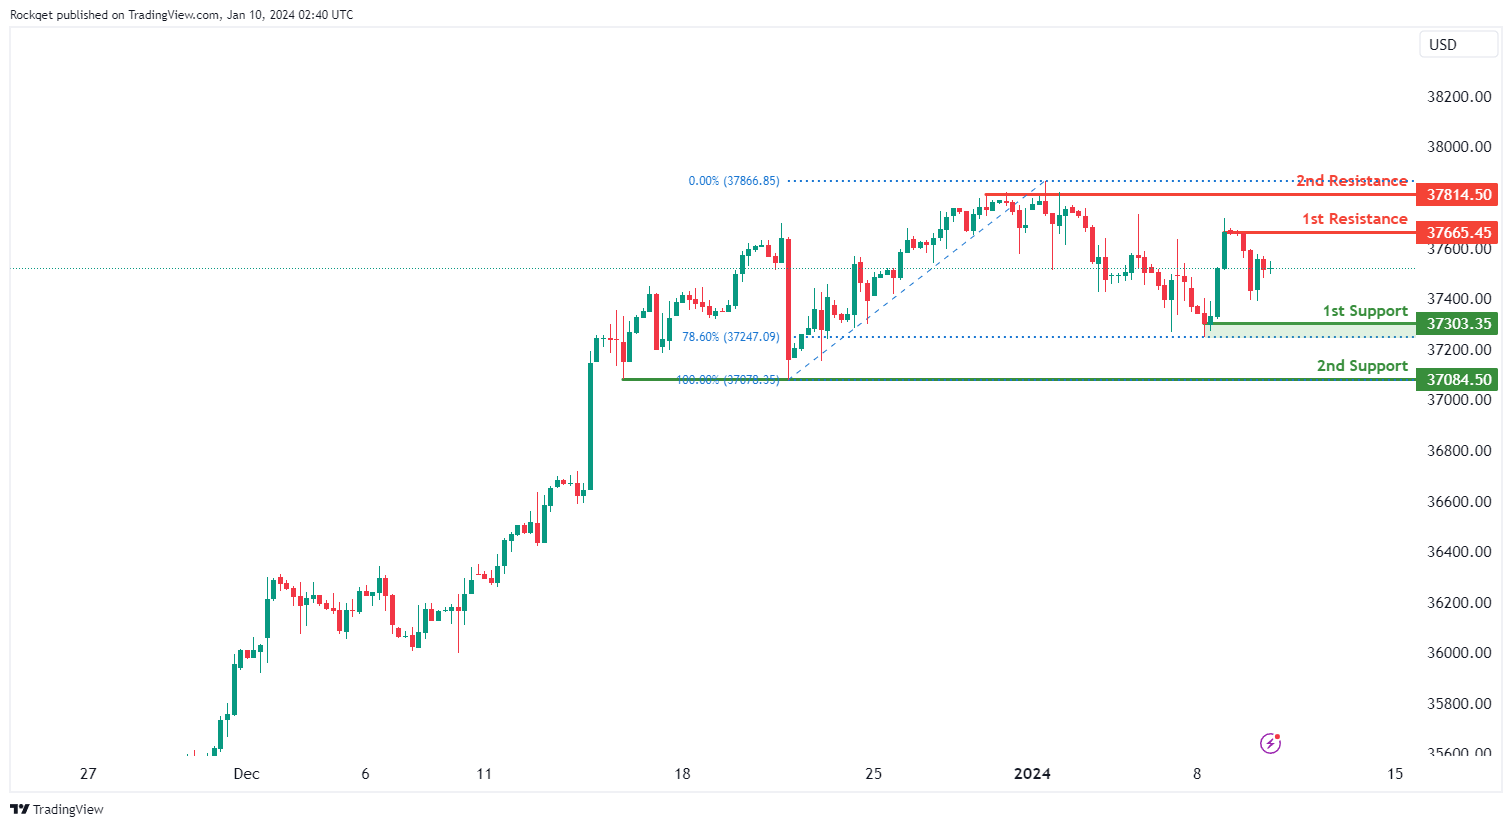
DJ30:
The DJ30 chart currently displays a neutral bias, indicating a potential for price to fluctuate between the 1st resistance and the 1st support.
The 1st support level at 37,303.35 is considered favourable as it is identified as a pullback support that aligns close to the 78.60% Fibonacci retracement level. The 2nd support level at 37,084.50 is also recognized as a pullback support, further adding to its potential as a support level during a price retracement.
On the resistance side, the 1st resistance level at 37,665.45 is identified as a pullback resistance, which may act as a barrier where selling interest could materialize. The 2nd resistance level at 37,814.50 is recognized as a pullback resistance, adding significance to this potential resistance level.
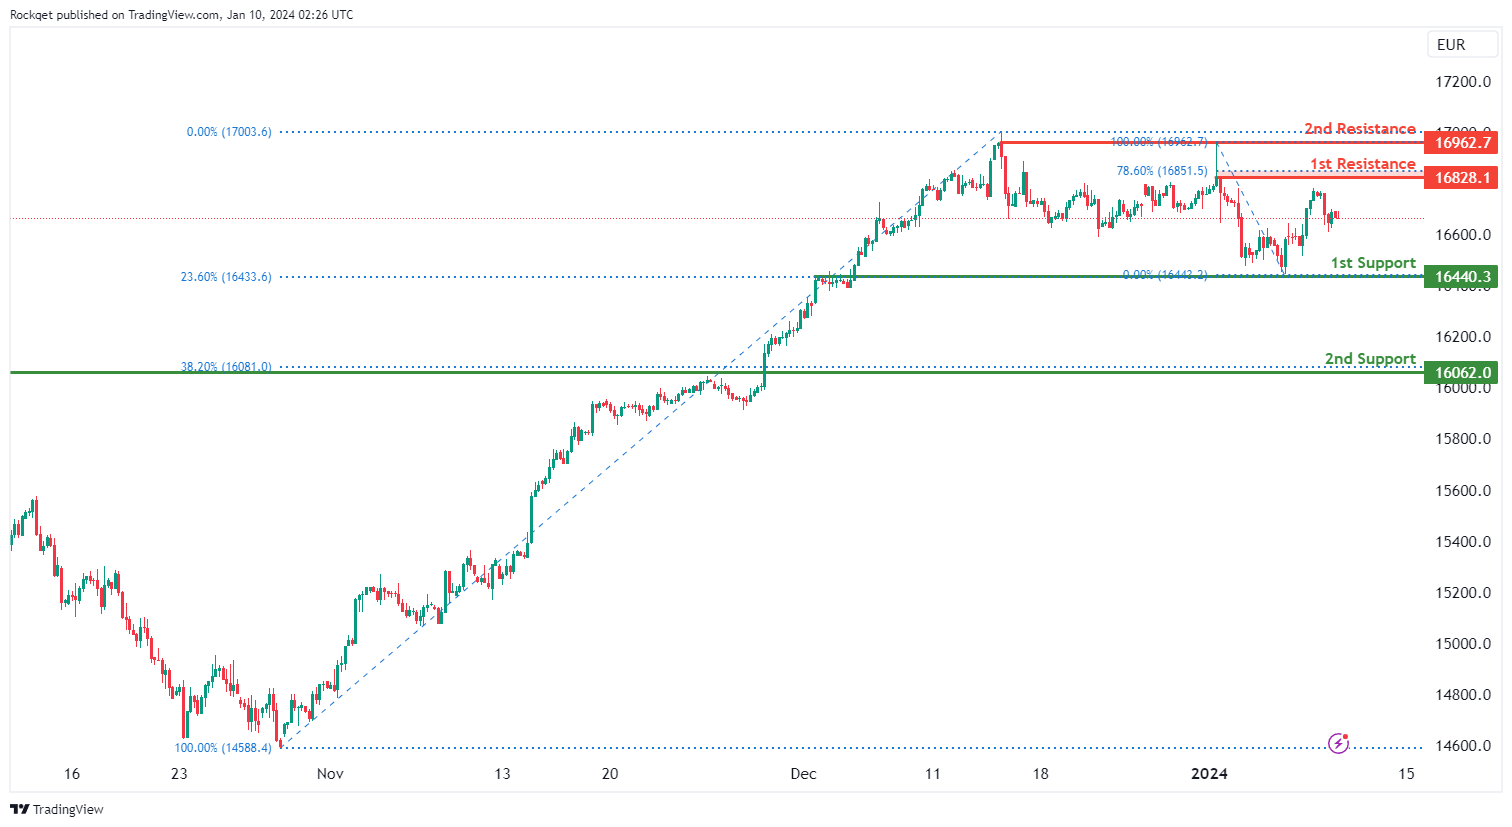
GER40:
The GER40 chart currently displays a neutral bias, indicating a potential for price to fluctuate between the 1st resistance and the 1st support.
The 1st support level at 16,440.30 is considered favourable as it is identified as an overlap support that aligns with the 23.60% Fibonacci retracement level. The 2nd support level at 16,062.00 is recognized as a pullback support that aligns with the 38.20% Fibonacci retracement level, adding to its potential significance as a level of historical importance.
On the resistance side, the 1st resistance level at 16,828.10 is identified as a pullback resistance that coincides with the 78.60% Fibonacci retracement level, suggesting a level where selling interest could materialize. The 2nd resistance level at 16,962.70 is also noteworthy for being a pullback resistance, further reinforcing its potential as a barrier to upward movement.
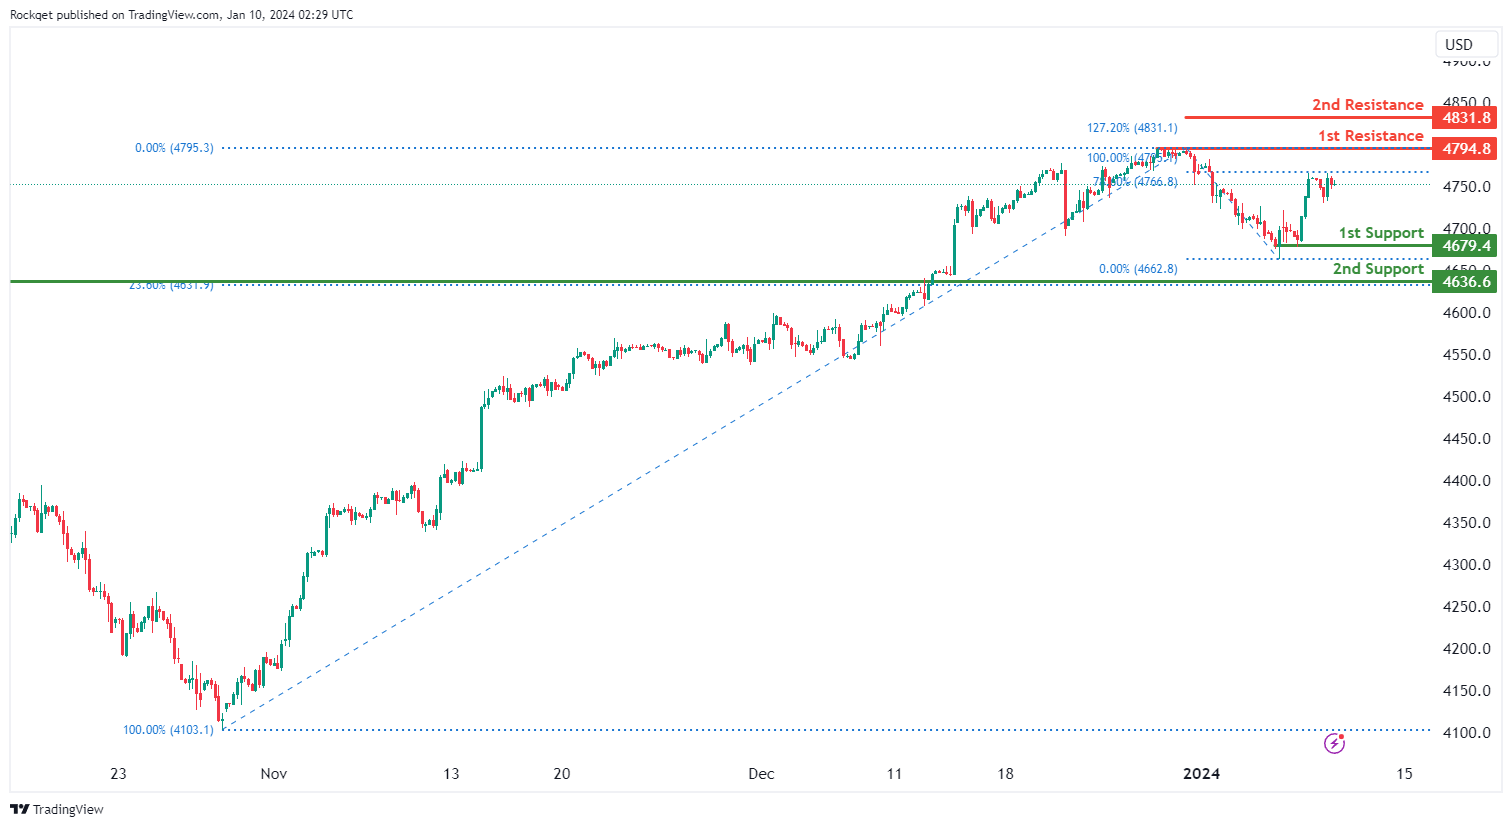
US500:
The US500 chart currently displays an overall bullish momentum. In this context, there is a potential for price to make a bullish continuation towards the 1st resistance.
The 1st resistance level at 4,794.80 is identified as a pullback resistance, suggesting a level where selling interest could materialize. The 2nd resistance level at 4,831.80 is identified as a resistance that aligns with the 127.20% Fibonacci extension level.
On the support side, the 1st support level at 4,679.40 is considered favourable due to its identification as a pullback support. The 2nd support level at 4,636.60 is also recognized as a pullback support that aligns with the 23.60% Fibonacci retracement level, adding to its potential as a support level.
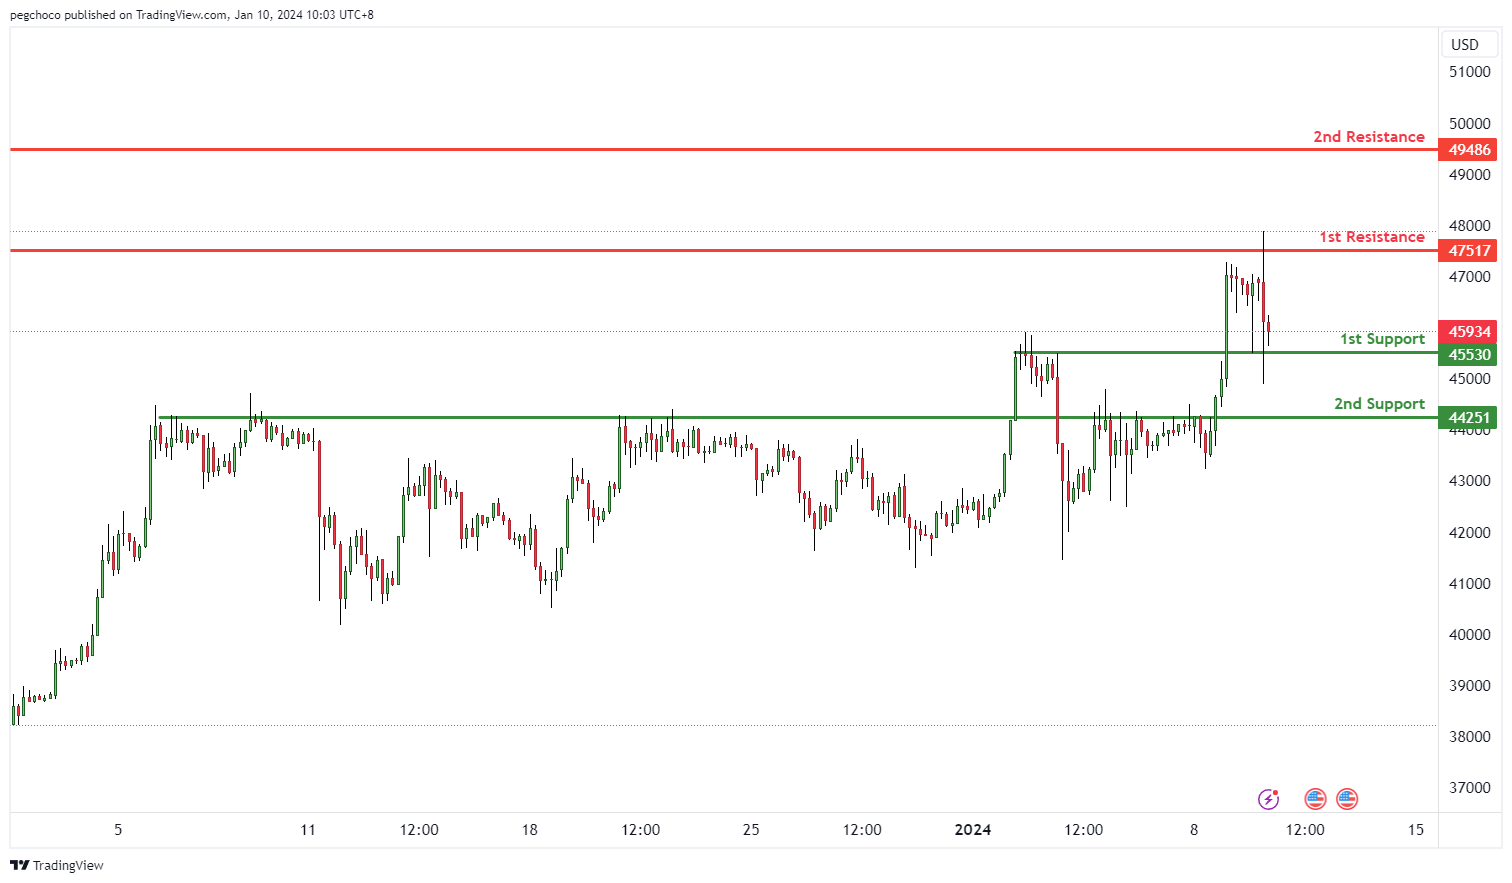
BTC/USD:
The BTC/USD chart currently exhibits a neutral bias, indicating a potential for price to fluctuate between the 1st resistance and the 1st support.
The 1st support level at 45,530 is considered favourable as it is identified as an overlap support, indicating historical significance as a level where buying interest has previously emerged. The 2nd support level at 44,251 is also recognized as an overlap support, adding to its potential as a support level.
On the resistance side, the 1st resistance level at 47,517 is identified as a multi-swing-high resistance while the 2nd resistance level at 49,486 is recognized as a swing-high resistance, suggesting a level where selling interest could materialize.
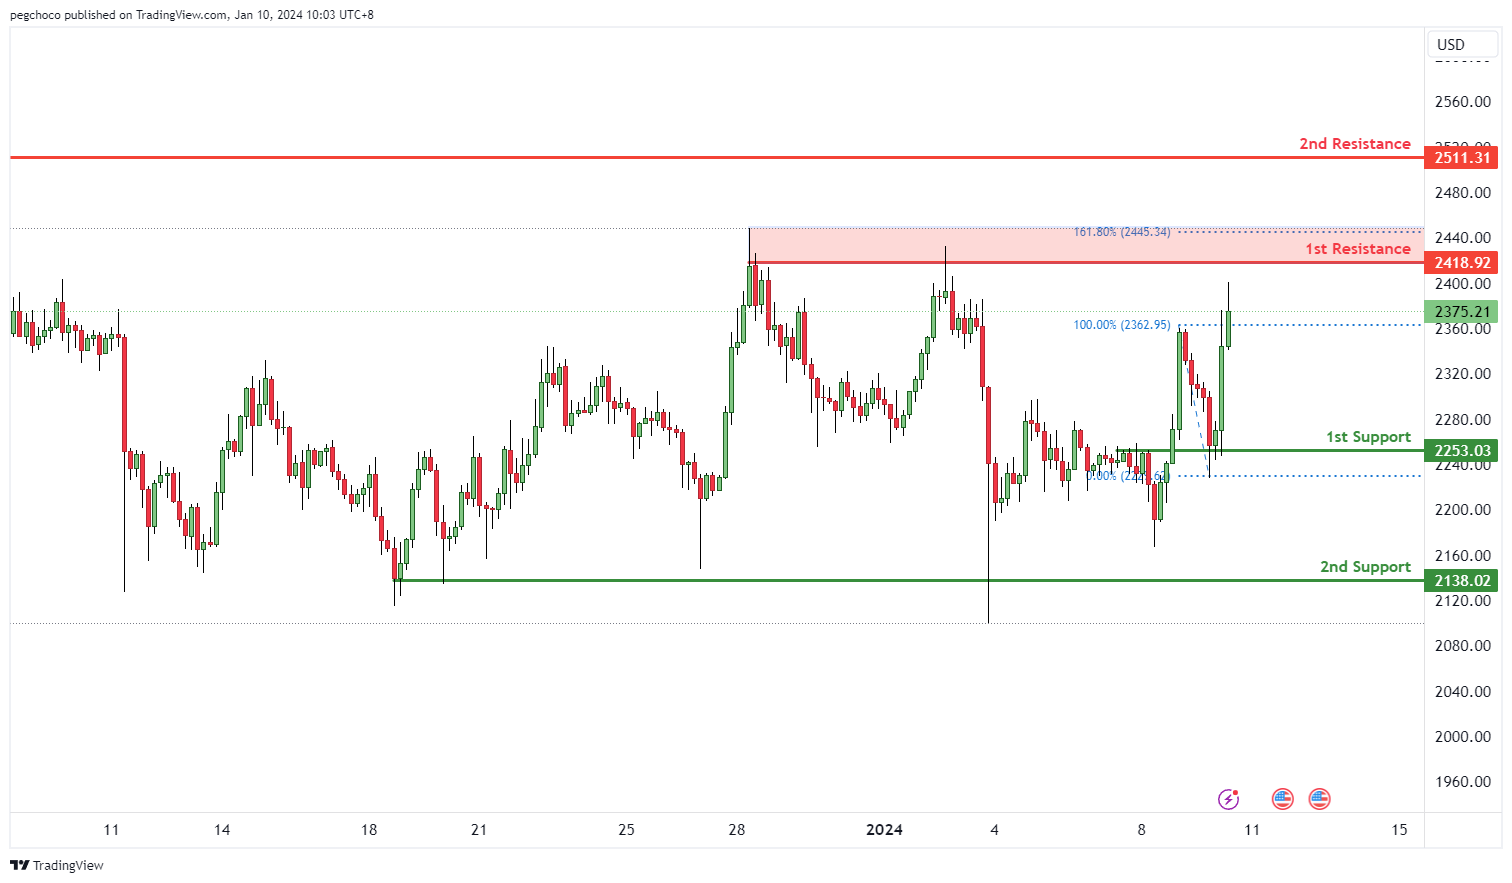
ETH/USD:
The ETH/USD chart currently exhibits a neutral bias, indicating a potential for price to fluctuate between the 1st resistance and the 1st support.
The 1st support level at 2,253.03 is identified as an overlap support, suggesting historical significance as a level where buying interest has previously emerged. The 2nd support level at 2,138.02 is recognized as a multi-swing-low support, adding to its potential as a support level.
On the resistance side, the 1st resistance level at 2,418.92 is identified as a multi-swing-high resistance that aligns close to the 161.80% Fibonacci extension level, suggesting a level where selling interest could materialize. The 2nd resistance level at 2,511.31 is recognized as a pullback resistance, suggesting a potential barrier for further upside movement.
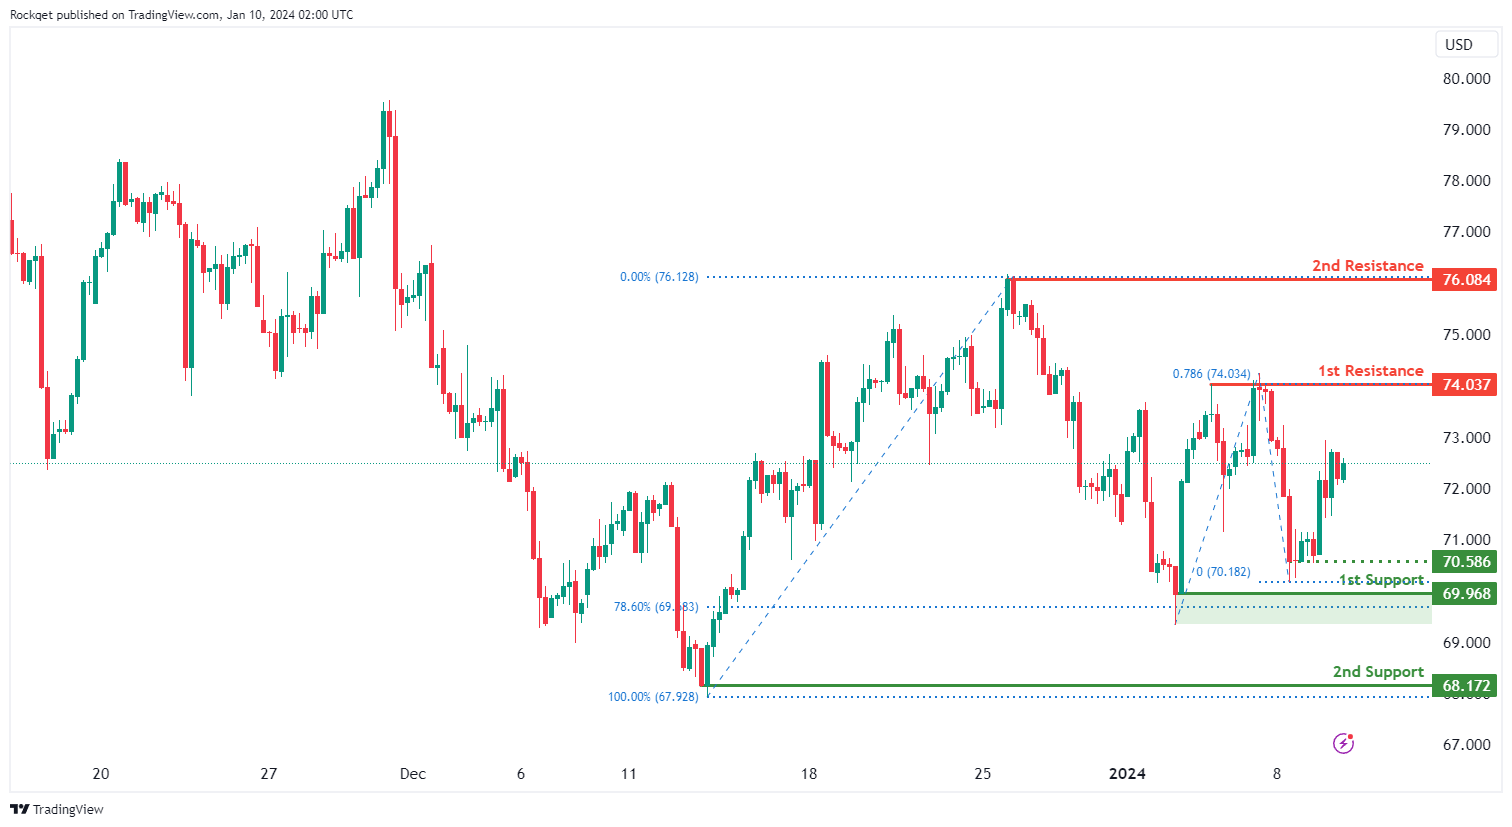
WTI/USD:
The WTI (West Texas Intermediate) chart currently exhibits an overall bullish momentum. In this context, there is a potential scenario for price to make a bullish continuation towards the 1st resistance.
The 1st resistance level at 74.03 is identified as a swing-high resistance that aligns with the 78.60% Fibonacci projection level. Higher up, the 2nd resistance level at 76.08 is also noted as a swing-high resistance, suggesting a potential barrier for further upside movement.
To the downside, the intermediate support level at 70.58 is identified as a pullback support while the 1st support level at 69.96 is noted as a swing-low support that aligns close to the 78.60% Fibonacci retracement level. Further below, the 2nd support level at 68.17 is also marked as a swing-low support, further reinforcing its importance as a key support level.
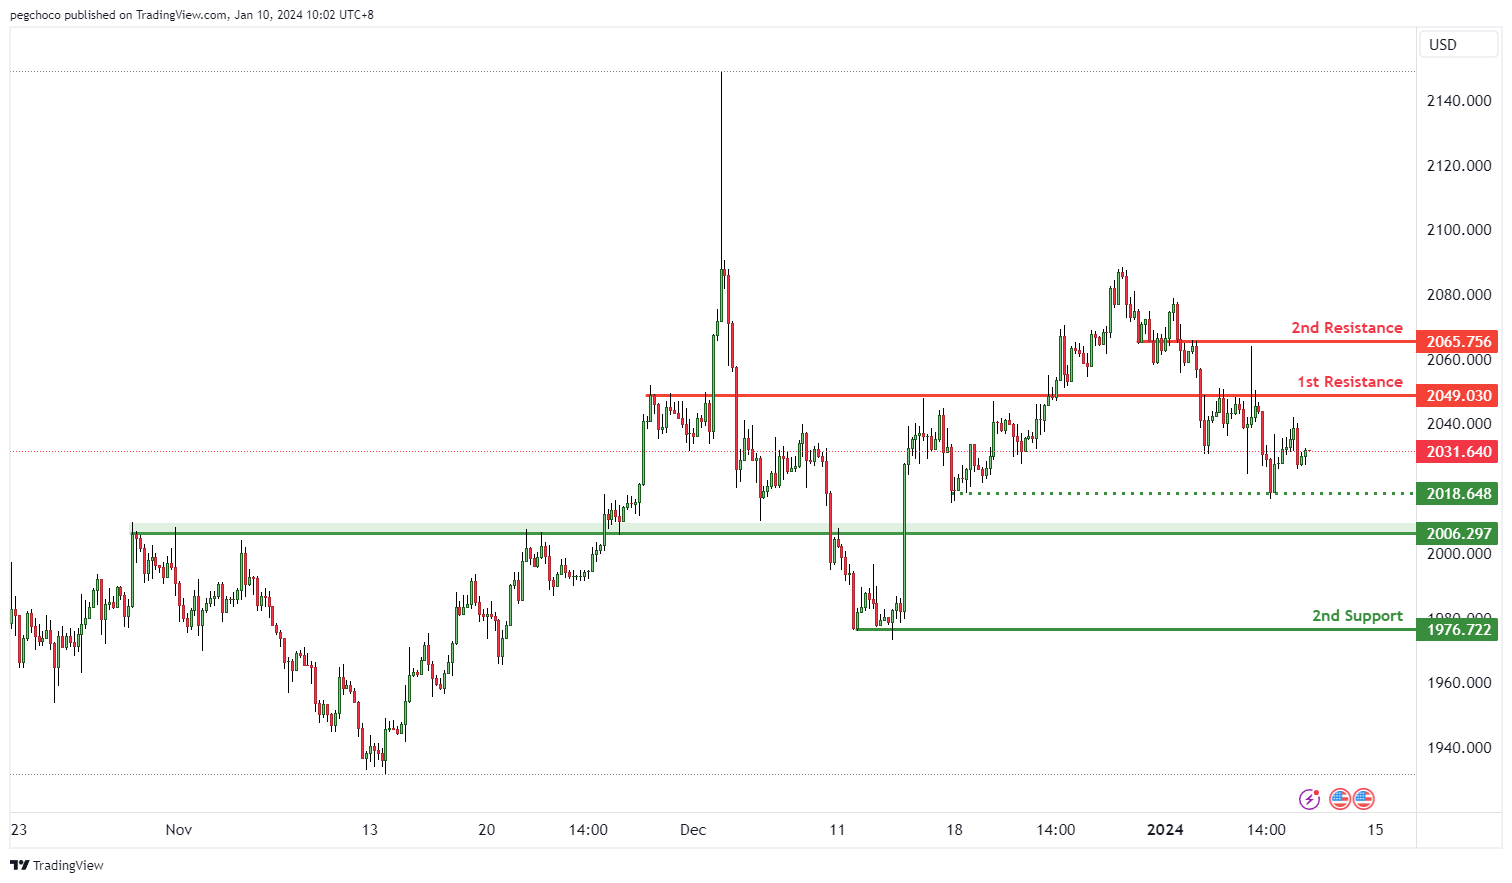
XAU/USD (GOLD):
The XAU/USD (Gold/US Dollar) chart currently exhibits a bearish overall momentum, indicating weakness in the price of gold relative to the US Dollar. This momentum suggests the potential for a bearish continuation towards the 1st support level.
The 1st support at 2006.29 is categorized as a pullback support. This level is significant as it implies a potential area where buying interest may emerge, providing temporary support for XAU/USD.
The 2nd support at 1976.72 is identified as multi-swing low support, further reinforcing its significance as a potential support zone.
On the resistance side, the 1st resistance at 2049.03 is marked as an overlap resistance, indicating a level where selling interest could intensify, potentially triggering a bearish reversal or resistance.
The 2nd resistance at 2065.75 is also categorized as an overlap resistance, further adding to its significance as a potential barrier for the price.
Additionally, there is an intermediate support level at 2018.64, identified as multi-swing low support. This level may also play a role in providing support to the XAU/USD pair.
Australia’s monthly CPI eases to 4.3% yoy, lowest since Jan 2022
Australia's monthly CPI saw notable deceleration in November, dropping from 4.9% yoy to 4.3% yoy, which was below expectation of 4.5% yoy. This represents the lowest reading since January 2022, as easing of the inflationary pressures continued
CPI excluding volatile items and holiday travel also slowed from 5.1% yoy to 4.8% yoy. Additionally, Trimmed Mean CPI, which removes the most volatile components to provide a clearer picture of underlying inflation trends, decelerated from 5.3% yoy to 4.6% yoy.
The primary drivers of the annual increase in November were in housing , which witnessed a significant rise of 6.6. Food and non-alcoholic beverages also saw a notable increase of 4.6%, Insurance and financial services recorded an 8.8% increase, and Alcohol and tobacco category experienced a 6.4% rise.
Crude Oil Price Could Drop Unless It Clears This Hurdle
Key Highlights
- Crude oil prices are struggling to climb above the $74.00 resistance.
- A major bearish trend line is forming with resistance near $73.10 on the 4-hour chart.
- Gold prices are also facing a major hurdle near $2,050.
- EUR/USD could recover above the 1.1000 resistance zone.
Crude Oil Price Technical Analysis
In the past few days, Crude oil prices saw a few swing moves below the $75.00 resistance zone. The price declined below the $74.00 and $73.00 support levels.
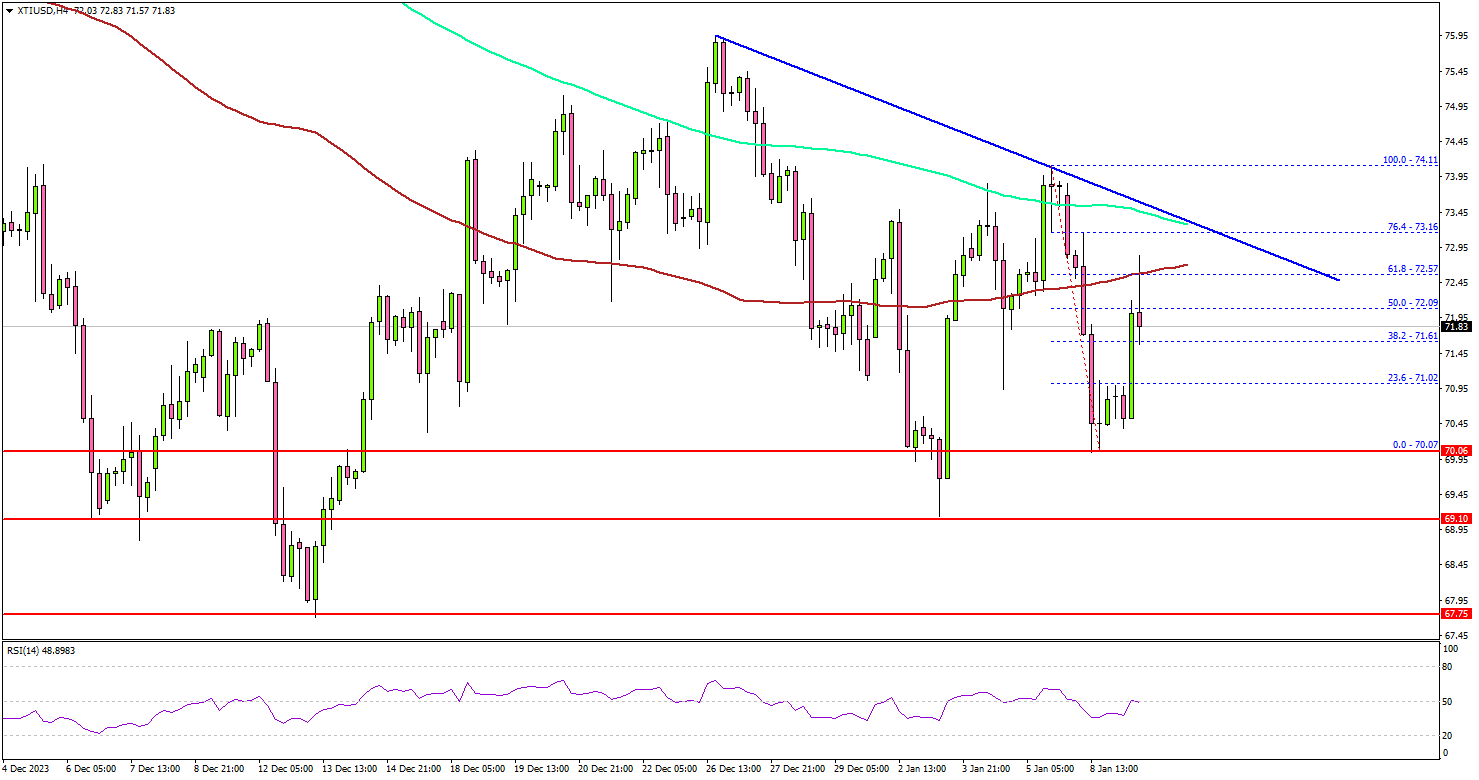
Looking at the 4-hour chart of XTI/USD, the price settled below the $73.20 zone, the 200 simple moving average (green, 4-hour), and the 100 simple moving average (red, 4-hour).
However, the bulls were active near the $70.00 zone. The recent low was formed near $70.07 before the price started a fresh increase. There was a move above the $71.50 resistance. On the upside, the price is facing hurdles near the $73.00 level.
There is also a major bearish trend line forming with resistance near $73.10 on the same chart. The next major resistance is near the $74.00 zone, above which the price may perhaps accelerate higher. In the stated case, it could even visit the $76.50 resistance.
Immediate support is near the $70.50 level. The next support is at $70.00, below which there is a risk of a sharp decline. In the stated case, the price could dive toward the $68.00 support. Any more losses might call for a test of the $66.20 support zone.
Looking at gold prices, the bears seem to be active and they might continue to protect the $2,050 resistance zone.
Economic Releases to Watch Today
- US Wholesale Inventories for Nov 2023 – Forecast -0.2%, versus -0.2% previous.
Japan’s labor cash earnings rises only 0.2% yoy, real wages down for 20th month
Japan's labor market showed a notable slowdown in nominal cash earnings growth in November, increasing by only 0.2% yoy, which was significantly below market expectation of 1.5% yoy. This rate marks the slowest growth in nearly two years and represents a considerable decrease compared to 1.5% yoy growth in October.
A closer look at the components of earnings reveals mixed trends. Regular or base salaries saw modest increase of 1.2% yoy, slightly down from previous month's 1.3% yoy. Overtime pay, which had been declining, showed a positive shift with 0.9% yoy increase, marking the first rise in three months. However, special payments, such as bonuses, experienced a significant drop of -13.2% yoy.
More concerning that real wages fell sharply by -3.0% yoy in November, exceeding expectations of -2.0% yoy decline. This drop marks the 20th consecutive month of contraction.
ECB’s Villeroy advocates for caution over haste or rigidity
ECB Governing Council member Francois Villeroy de Galhau, in an address to France's financial sector overnight, stated, "We will cut rates this year when the inflation outlook is solidly anchored at 2% with effective and durable data."
However, Villeroy did not specify a timeline for these potential rate cuts, emphasizing instead the ECB's reliance on economic data to guide their decisions. He asserted, "Our decisions will not be guided by a calendar, but by data."
Villeroy's statement, "We must demonstrate neither obstinateness nor haste," further highlights the ECB's approach as the central bank is keen on avoiding premature actions that could destabilize the disinflation process.
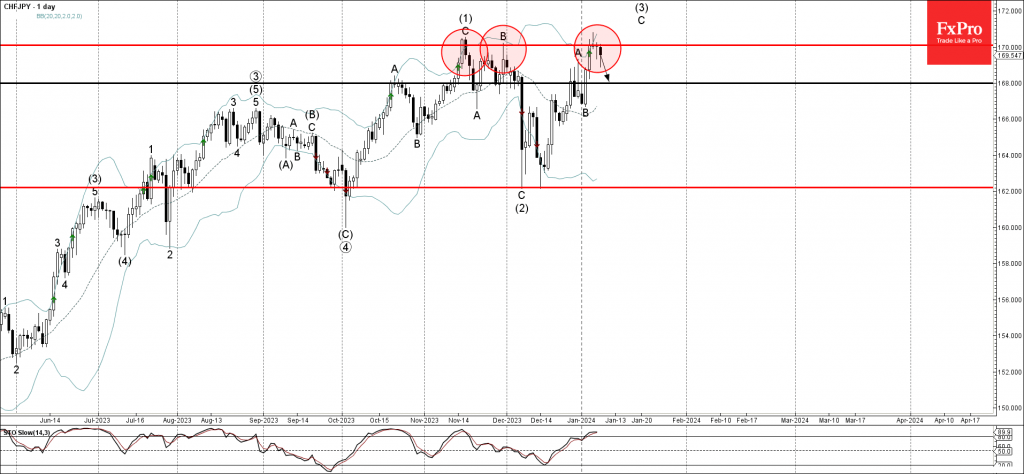
CHFJPY Wave Analysis
- CHFJPY reversed from resistance level 170.00
- Likely to fall to support level 168.00.
CHFJPY currency pair recently reversed down from the pivotal resistance level 170.00 (former Double Top from November) intersecting with the upper daily Bollinger Band.
The downward reversal from the resistance level 170.00 stopped the earlier impulse wave C from the start of this month.
Given the strength of the resistance level 170.00 and the overbought daily Stochastic, CHFJPY can be expected to fall further to the next support level 168.00.
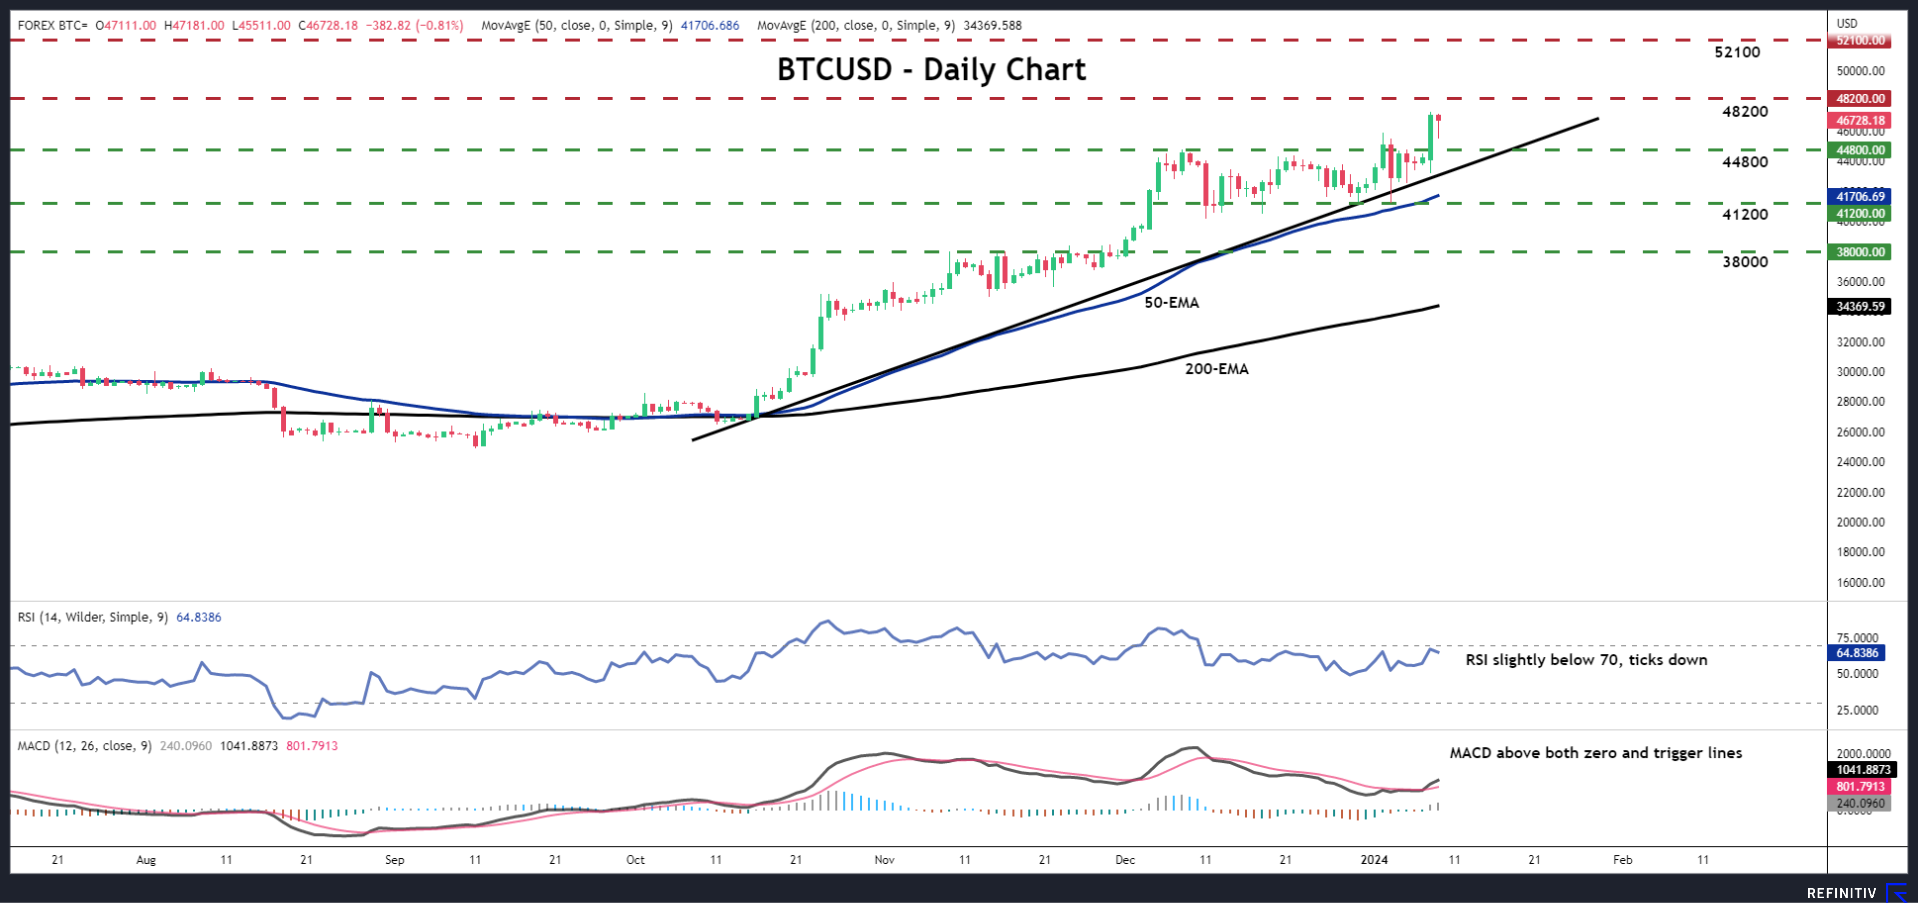
Bitcoin Climbs to New 21-month High Ahead of ETF Decision
- BTCUSD rallies and hits new 21-month high
- RSI and MACD detect positive momentum
- Bearish reversal to be considered upon dip below $41,200
BTCUSD surged yesterday, breaking back above $45,000 and hitting a new 21-month high at $47,282. It seems that the euphoria around the potential approval of a spot-Bitcoin ETF by the Securities and Exchange Commission (SEC) has been the main driver behind the current uptrend, increasing the chances for a sell-the-fact response at the time of the announcement.
That said, from a technical standpoint, even if the crypto king corrects lower, provided it stays above the uptrend line drawn from the low of October 13 and above the 50-day EMA, which has been tracking the advance well, the near-term outlook could still be considered positive. A break above the highs of March 2022 at around $48,200 could signal a trend continuation and perhaps pave the way towards the high of December 27, 2021, near $52,100.
The RSI and the MACD are both detecting positive momentum, with the former lying slightly below 70 and the latter running above both its zero and trigger lines. However, the RSI has ticked down after hitting resistance near its 70 line, which increases the likelihood of a small pullback before the next leg north.
For the outlook to start darkening, Bitcoin may need to dive below the $41,200 zone, which offered support several times since December 11. A break below that barrier may not only confirm the dip below the aforementioned uptrend line but also a violation of the 50-day EMA. The bears may then be encouraged to push the action down to the $38,000 area.
To recap, BTCUSD has been in uptrend mode since October in anticipation of a regulatory approval for Bitcoin-backed ETFs. The announcement of the approval may result in a corrective setback, but for a trend-reversal to start being discussed, a dip below $41,200 may be needed.
EUR/USD Price Action – Technical Analysis
EURUSD continues its attempt to reverse back above the 1.1000 level but has been unsuccessful so far, the current trading range is critical, and any real breakout may help in forecasting future price action, we will go over a long-term as well as a short-term timeframe reflecting the current price action.
Talking Points
- Weekly Chart – Longer Term Patterns overview
- 1-Hour Chart – Short Term and current price action
Weekly Chart
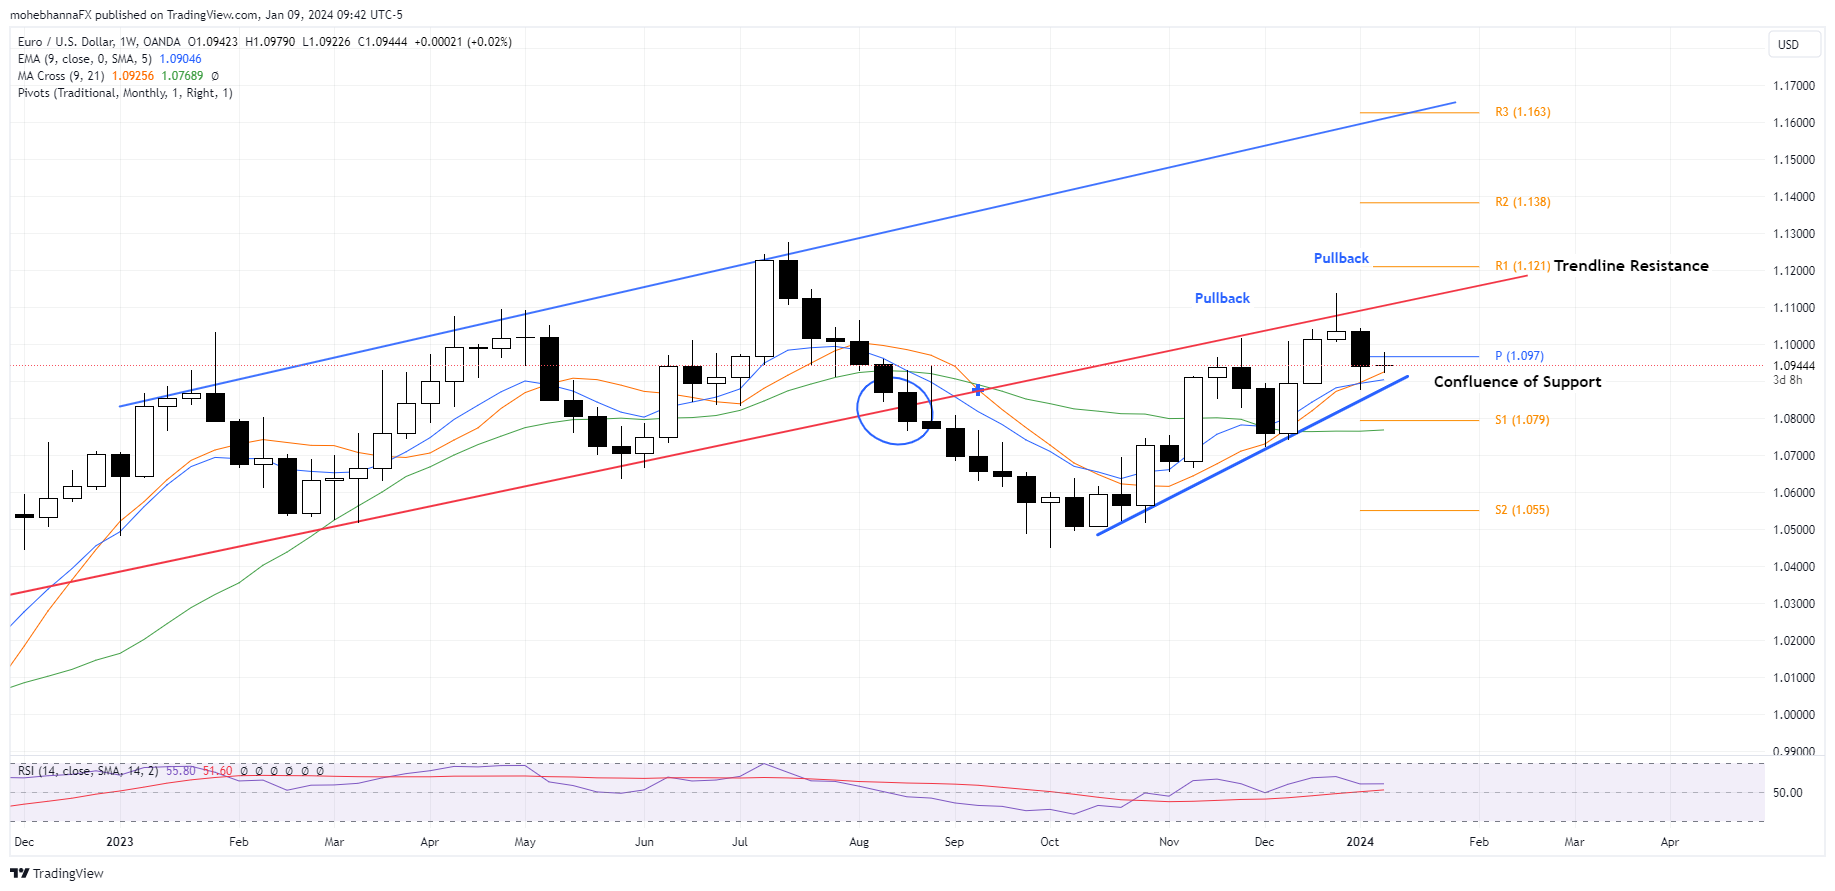
- Price continues to trade below its ascending channel as identified on the chart, Price action broke below the lower trendline in August 2023 and so far, 2 pullbacks have taken place where both times price found resistance and was unable to reenter the channel again.
- The two pullbacks are currently in a double-top formation and the connecting baseline is marked on the chart.
- A confluence of support is represented by the baseline, Monthly pivot point, and EMA9.
1-Hour Chart
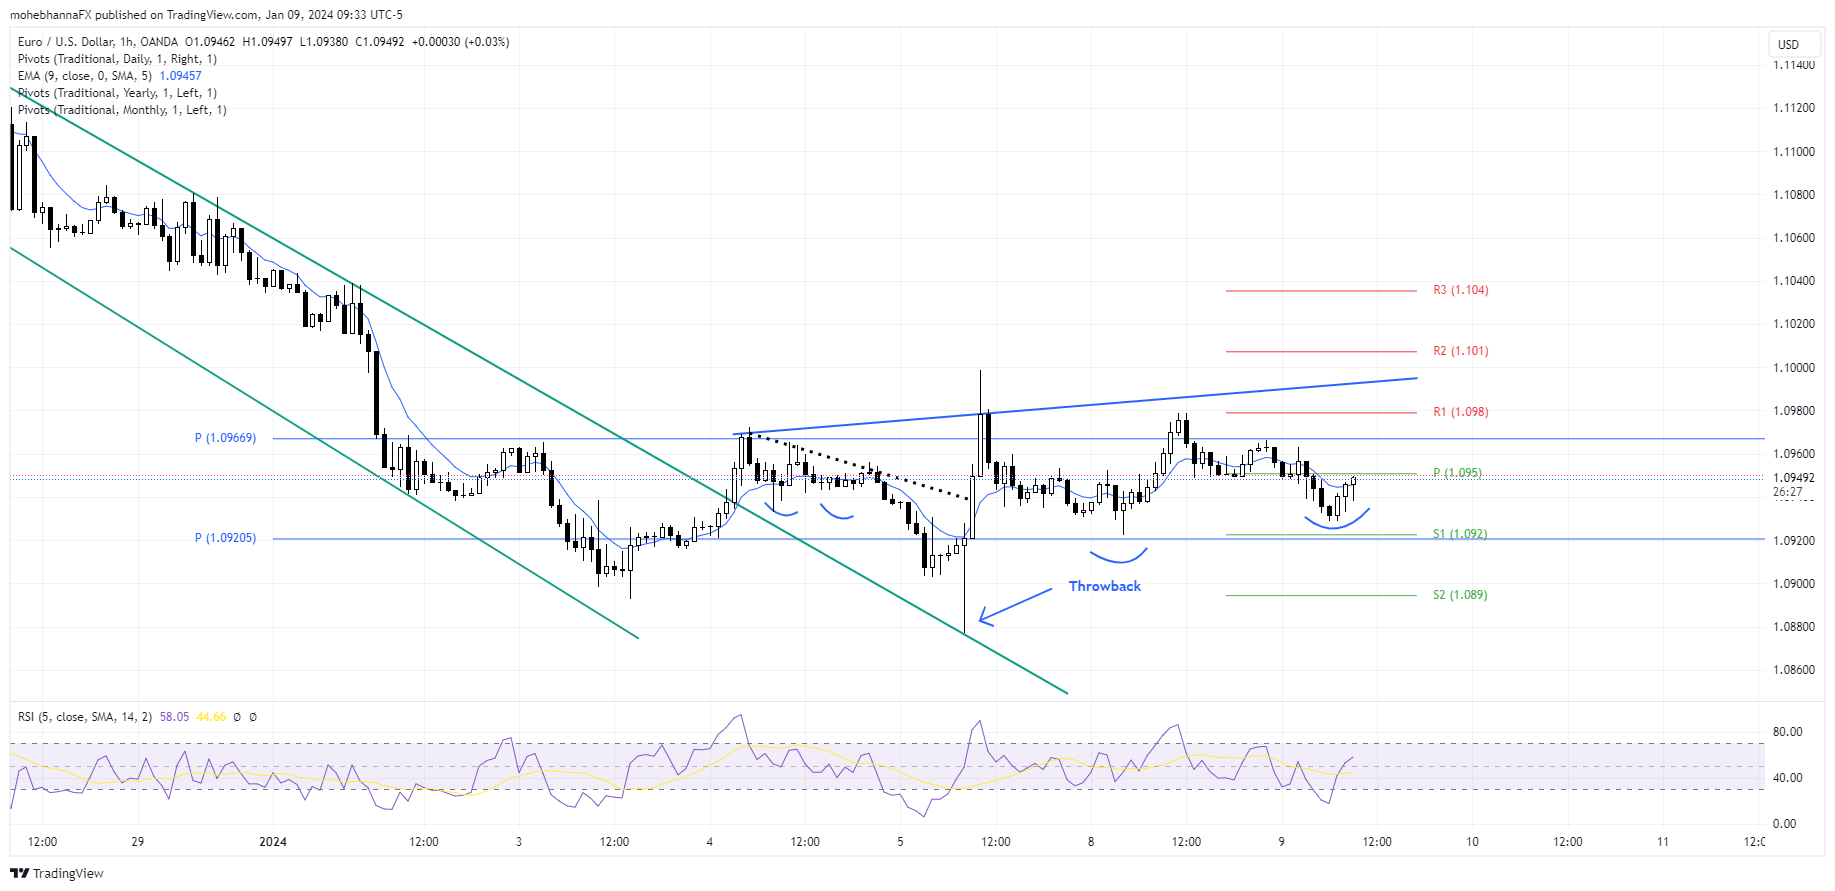
- EURUSD price action continues to trade within the range of 1.0920 – 1.0980, a confluence zone of support and resistance levels represented by monthly and annual calculations.
- Last month, December 2023, the price broke and closed above its annual pivot point of 1.0920, a critical level where the price spent an extended time trading around, the most recent EURUSD price decline in January 2024, took the rate back to 1.0920 where it is so far finding support.
- Price action broke out and closed above the upper resistance line of the descending channel (Green line), a throwback to the line took place on Friday with the Non-Farm Payroll release, however, price action found support above the green line and reversed back up.
- A triple bottom formation developed above the breakout and the price broke out again above the resistance line connecting the inverted bases for the bottoms. (Dotted black line)
- Price action is currently attempting an inverted Head and Shoulder formation, which is yet to materialize in full, the neckline lies at the 1.0980 – 1.0990 area which is the high end of the extended trading range, as well as the psychological level of 1.1000, which if penetrated along with price move following the pattern, may lead price action to the upcoming resistance levels. It is also important to remember that pattern failures can be an indication of a potential change in direction.