
Sample Category Title
Norges Bank Defies the Tide
In focus today
Today we get PMIs out of the big Western economies.
In the euro area, we expect continued modest contraction in the service sector while the downward trend in manufacturing becomes gradually less steep. We will also keep an eye on the price indices, which moved higher in November. Particularly the IFO survey showed German service businesses' price expectations increased markedly in November.
The 60 second overview
Norges Bank: Norges Bank was the major outlier in a string of monetary policy holds from the ECB, SNB and BoE yesterday. Norges Bank decided to hike its policy rate by 25bp to 4.50% and signal a 20% probability of another hike in March. Heading into the decision, most analysts - ourselves included - had called for unchanged policy rates while markets had priced a small hike probability (+4bp). Following the decision, we postponed our first rate cut from March to June, but lifted the number of expected rate cuts next year from 4 to 5.
ECB/BOE: Apart from Norges Bank, central bank decisions were in line with expectations. ECB kept the deposit rate at 4% and lowered its projections for growth and inflation next year. Lagarde struck a dovish tone with no clear intention to push back on the aggressive market pricing for next year. ECB will start reducing the PEPP portfolio in H2/24 and terminate reinvestments by the end of 2024. We stick to our call of the first cut being delivered at the June meeting, though risks are tilted towards an earlier start. The BoE also left the rate unchanged at 5.25%, though the communication was hawkish in an attempt to counter the easing of financial conditions seen recently. As for the ECB, we expect the first cut from BOE in June.
US: US retail sales surprised to the upside in November, rising by 0.3% m/m after the decline of 0.2% m/m in October. US consumers remain on a solid footing, not least due to the strong labour market. In that respect, initial claims data from last week came in better than expected at 202.000, the lowest level since mid-October.
Japan: Overnight, composite PMI data from Japan rose from 49.6 to 50.4 in December after declining for most of H2. The move was driven by improving activity among services providers, while manufacturing ticked further down below the 50 mark separating expansion from contraction. Focus now turns towards the BoJ meeting on Tuesday.
Equities: What a day in equities! European and Nordic stocks rallied in catch-up to the US session. However, US continued higher too with small cap Russell2000 adding another 3%. This takes small cap Russell 2000 a staggering +7% higher for the week vs Nasdaq +3%. It is clear that the rally is benefitting not only large cap tech. Small caps, REIT, regional banks, lower quality balance sheet and consumer cyclicals were the place to be this week. Value beating growth. Same story in the Nordics with real estate rallying double digit together with rate sensitive stocks like EQT and Nibe. This summed up to S&P 500 0.3%, Nordics 1.3% and Stoxx 600 0.9%. US futures are higher, again, this morning.
FI: Yesterday morning, European yields caught up with the significant decline in US yields following the FOMC meeting on Wednesday. The ECB statement and Lagarde's press conference pushed short-end rates a bit higher, though most of the rally had already faded prior to the ECB decision. Markets still expect ECB to cut rates by around 150bp next year. 10Y Bund yields ended the day down by 6bp, while 10Y UST yields extended the rally from Wednesday night by dropping an additional 11bp. The 10Y BTP/Bund spread tightened following the release of the PEPP schedule, as the planned reduction of EUR7.5bn/month in H2/2024 was less hawkish than feared.
FX: EUR/USD moved sharply higher following yesterday's ECB monetary policy announcement, trading close to the 1.10 mark. The Bank of England (BoE) yesterday decided to keep the Bank Rate unchanged at 5.25% and coupled with a hawkish tilt in communication, this initially sent EUR/GBP lower. However, the move was fully retraced following the ECB announcement, in line with our expectation. Yesterday Norges Bank surprised markets by hiking policy rates by 25bp including the sight deposit rate to 4.50% providing support for NOK. The SNB kept the policy rate unchanged at 1.75% yesterday and delivered a dovish message, which ultimately sent EUR/CHF notably higher. SEK faced headwinds from lower than expected inflation.
Credit: Credit spreads tightened massively, with iTraxx Xover closing 24bp tighter, taking the index to 329bp, while Main compressed 4.6bp and closed in 59.5bp.
Nordic macro
Market is expecting a slight increase in LFS November unemployment to 8.0 % SA. Take this data with a pinch of salt. We rely more on PES registries.
Something Doesn’t Feel Right
The European Central Bank (ECB) and the Bank of England (BoE) refused to join the Federal Reserve (Fed)-thrown pivot party. Both Christine Lagarde and Andrew Bailey declined to discuss cutting interest rates judging a policy loosening too early as the inflation threat looms. BoE’s Bailey pointed at the possibility of another rate hike, as three MPC members favoured hiking rates, while the ECB announced to accelerate EXIT from the PEPP stimulus, and the Norges Bank popped up with a surprise rate hike.
As a result, the rally in global stock and bond markets slowed. The S&P500 hit a fresh nearly 2-year high but closed nearly flat, the Stoxx 600 – I guess didn’t hear the news yet so it just - kept rallying. The US 10-year yield rebounded after tipping a toe below the 3.90% level. Note that there is growing speculation that the 10-year yield will fall to 3%, but I think that’s overstretched, and the dollar index had a rough day, because the hawkish European central banks further plummeted appetite for the greenback.
The USDNOK fell sharply to the lowest level since summer and the EURUSD shortly flirted with the 1.10 level, as yesterday’s ECB announcement threw the foundation of a stronger euro into the next year. The divergence between a more dovish Fed and still hawkish ECB should support a sustainable appreciation. Presently, the EURUSD stands right at the middle of January 2021 peak (near 1.22) and September 2022 dip (below parity). A further rise toward 1.1260 level would reasonably reflect the Fed-ECB divergence.
Cable, on the other hand, came close to the 1.28 level. Zooming out, the pair stands at around the mid-range of the 2021-2022 selloff (leaving the Liz Truss dip out of the analysis). The GBPUSD could reasonably be expected to extend gains toward the 1.30 level on the back of the divergence between the hawkish BoE and a softening Fed stance.
This being said, the Fed is the Fed and you can’t fight the Fed for long. This is what traders say, and this is also true for the central banks. The fact that the USD is set to soften will naturally strengthen its counterparts. And a stronger euro and a stronger pound will further help taming inflation in the Eurozone and in Britain. And given the morose economic outlook in the old continent, the ECB and the BoE will easily feel the pressure for lowering rates in Q1, and that could, in the medium run, stall the dollar weakness and limit the euro and sterling strength. Even more so, as the only major central bank which hinted at the end of policy tightening continues to see strong economic data. Released yesterday, the US retail sales unexpectedly rose, business inventories declined, and the weekly jobless claims fell to around 200K. Across the Atlantic Ocean, the flash PMI figures for December could show some improvement, but all the numbers are still comfortably in the contraction zone. The contrast between the resilient US economy adopting a dovish stance and faltering European economies holding on to a hawkish position gives the impression that something is amiss.
Speaking of divergence, the People’s Bank of China (PBoC) infused an impressive 1.45 trillion yuan during the Medium-term Lending Facility (MLF) rate setting and rollover. Out of this, 650 billion yuan matured, and the rest was a substantial monthly injection of 800 billion yuan, marking its largest to date.
On the data front, industrial production was stronger in November, but investment and retail sales missed expectations. China announced earlier this week that it will shift its focus to boosting industrial activity than consumer appetite – as consumers are difficult to cheer up with the tumbling property market. That’s a big U-turn for Xi Jinping who wanted to do things differently. In fact, China always boosted investment without caring much about transforming investment into consumption. That was one of the biggest problems regarding the whopping Chinese growth. Hence, originally, Xi Jinping was not wrong in wanting to throw the foundation of a healthier economy. But the way things happened was harsh. To tidy things up requires going back to a model that worked: boost investment, and spit growth. While the Chinese efforts will hardly bring masses back to the Chinese markets, industrial metals should benefit from China’s efforts to ramp up industries and real estate.
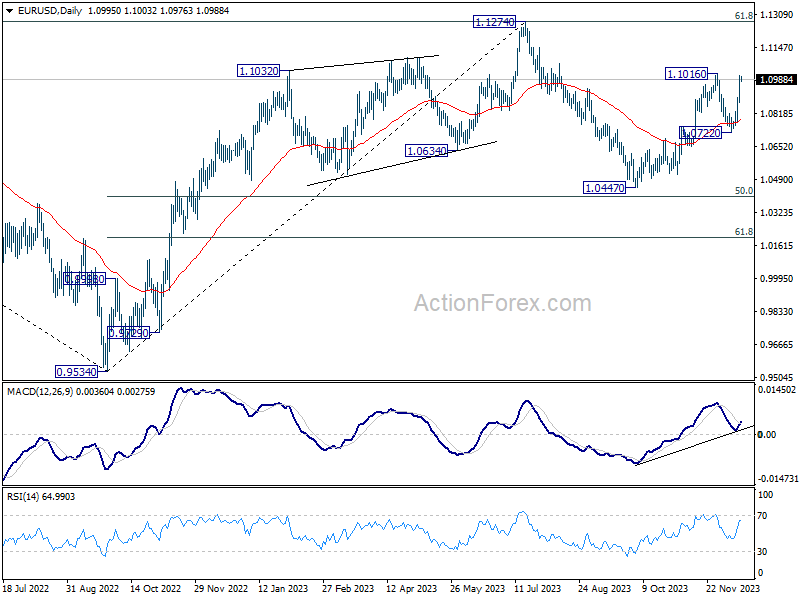
EUR/USD Daily Outlook
Daily Pivots: (S1) 1.0905; (P) 1.0957; (R1) 1.1044; More...
Intraday bias in EUR/USD stays on the upside for 1.1016 resistance. Decisive break there will will confirm resumption of whole rally from 1.0447. Further rally should then be seen to retest 1.1274 high. On the downside, below 1.0914 minor support will turn intraday bias neutral first. But outlook will stay cautiously bullish as long as 1.0722 support holds.
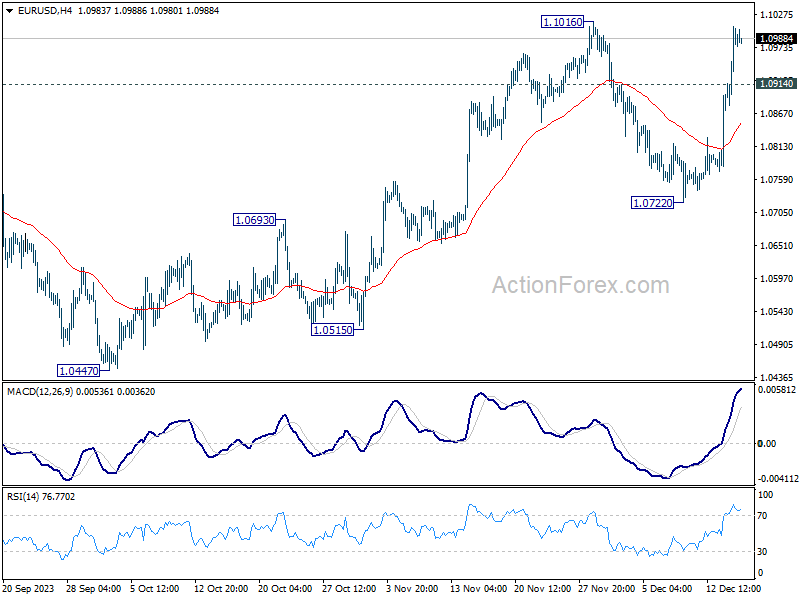
In the bigger picture, price actions from 1.1274 are viewed as a corrective pattern to rise from 0.9534 (2022 low). Rise from 1.0447 is seen as the second leg. While further rally could cannot be ruled out, upside should be limited by 1.1274 to bring the third leg of the pattern. Meanwhile, sustained break of 55 D EMA will argue that the third leg has already started for 1.0447 and below.
Euro Strong Ahead of PMI Release, Dollar Weak as 10-Yr Yield Broke 4%
Euro is emerging as the strongest currency for the week, bolstered by ECB's resistance to the expectations of a rate cut. The common currency will now look into today's Eurozone data. Positive surprises from there could solidify ECB's stance, and give Euro more fuel to extend recent rise. For now, Japanese Yen followed as the second strongest, supported by declining global treasury yields and in anticipation of the upcoming BoJ meeting. Australian Dollar ranked as the third strongest, driven by robust job data and an improving trade relationship with China.
Conversely, Dollar remains generally weak and is on track to be the worst performer for the week. Fed's dovish turn led to sharp decline in the greenback and treasury yields, while simultaneously propelling DOW to record highs. The impact of these moves is ongoing and far from over. New Zealand Dollar ranks as the second-worst performer, with economists retracting their expectations of another rate hike by RBNZ following disappointing GDP data. Canadian Dollar also underperformed, despite a recovery in WTI crude oil prices above 70 mark. Sterling showed mixed performance despite BoE's hawkish hold.
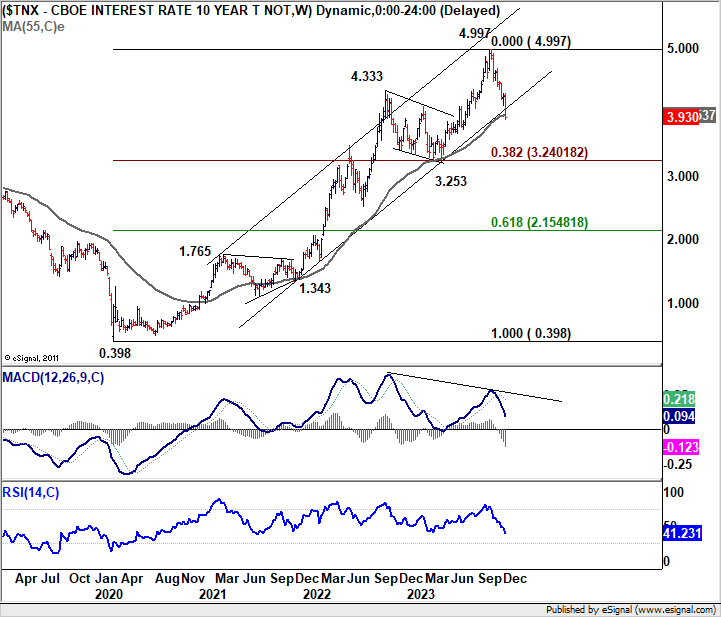
Technically, 10-year yield's close below 4%, the long term channel support, as well as 55 W EMA is worth a mention. If TNX cannot quickly recovered to 4% handle, chances are deeper decline is imminent to 3.253 cluster support (38.2% retracement 0.398 to 4.997 at 3.24). This decline would extend through the rest of the year to the early part of Q1, and keep Dollar pressured and Yen afloat.
In Asia, Nikkei closed up 0.87%. Hong Kong HSI is up 2.05%. China Shanghai SSE is down -0.58%. Singapore Strait Times is down -0.34%. Japan 10-year JGB yield rose 0.0238 to 0.700. Overnight, DOW rose 0.43%. S&P 500 rose 0.26%. NASDAQ rose 0.19%. 10-year yield fell -0.103 to 3.930.
Japan's PMI Composite up to 50.4, expansion resumes with inflation resurgence
Japan's PMI data for December presents a mixed picture of the country's economic The PMI Manufacturing index fell to 47.7 from 48.3, underperforming the market expectation of 48.2 and indicating contraction in the sector. In contrast, PMI Services index rose from 50.8 to 52.0. Consequently, PMI Composite index, moved back into expansion territory, rising from 49.6 to 50.4.
Annabel Fiddes, Economics Associate Director at S&P Global Market Intelligence, noted, "The December PMI surveys indicate that Japan's private sector experienced a renewed, albeit mild increase in overall business activity as the year came to a close."
Fiddes further elaborated, "The overall performance of the private sector remained subdued." This is evident in the composite new business, which declined for the second consecutive month. Although there was modest sales growth in the service sector, it was not sufficient to offset the sharp and accelerated drop in manufacturing orders.
Another critical aspect highlighted in the PMI report is the resurgence of inflationary pressures. Fiddes noted, "The latest survey also indicated a renewed pick up in inflationary pressures amid reports that a weaker exchange rate and higher labor and raw material costs had pushed up expenses." As a result, the prices charged by Japanese firms increased at the fastest pace since August.
China's industrial output Surges, retail sales and investment miss expectations
China's economic data for November 2023 presented a mixed picture, with industrial output exceeding expectations while retail sales and fixed asset investment fell short.
Industrial output saw a significant increase of 6.6% yoy, surpassing the expected 5.6% yoy and marking the strongest expansion since February 2022.
However, retail sales, rose by 10.1% yoy, which was below the anticipated 12.5%. It's important to note that this increase was influenced by a low base effect from the previous year, when China's stringent coronavirus pandemic control measures significantly impacted consumer activities.
Fixed asset investment, a key driver of economic growth, increased by 2.9% ytd yoy, slightly missing the expected 3.0%.
National Bureau of Statistics of China commented on the overall economic situation, stating: "There are still a lot of external instabilities and uncertainties, and the domestic demand appears insufficient." The NBS emphasized the need to solidify the foundation of the economy's recovery.
Australia PMI composite climbs to 47.4, aligning with soft landing scenario
Australia's manufacturing and service sectors showed marginal improvements in December, as indicated by the latest PMI data. PMI Manufacturing index inched up slightly from 47.7 to 47.8, while PMI Services index rose from 46.0 to 47.6. PMI Composite, which combines both manufacturing and services, also increased from 46.2 to 47.4. Despite these increases, all indices remained below 50.0 threshold that separates expansion from contraction, suggesting that both sectors are still facing challenges.
Warren Hogan, Chief Economic Advisor at Judo Bank, noted: "For the RBA and Treasury, these results are consistent with the soft landing view of the economic outlook. There are few signs that the economy is likely to tip into a steeper downturn next year."
Hogan also emphasized the importance of the employment sector in this context: "Most importantly, the strong employment results suggest the economy may prove resilient in 2024. It is hard to see a sharp downturn in the economy while employment and incomes are expanding."
NZ BNZ manufacturing improves to 46.7, ninth month in contraction
New Zealand's manufacturing sector experienced a slight improvement in November, as indicated by the BusinessNZ Performance of Manufacturing Index. The index rose from 42.9 to 46.7, marking its highest level since June. However, it's important to note that the PMI remained in contraction territory (below 50) for the ninth consecutive month.
Breaking down the index, several components witnessed modest improvements. Production increased from 41.6 to 43.6, employment from 43.8 to 47.9, new orders from 44.5 to 47.7, finished stocks from 45.8 to 50.7, and deliveries from 43.3 to 48.0. Despite these gains, the improvements were not strong enough to push the overall PMI into the expansion zone.
The proportion of negative comments from the manufacturing sector was 58.7%, a decrease from 65.1% in October and 68.8% in September. This indicates a slight shift in sentiment, although a significant portion of feedback remains pessimistic. The predominant concerns cited by manufacturers revolved around a general lack of demand and sales, highlighting the primary challenges facing the industry.
BNZ Senior Economist, Craig Ebert, particularly focused on the production index. He noted that despite a slight improvement in November, the production index remained almost 10 points below its long-term average. Ebert emphasized that "That's a big undershoot, in historical context".
Looking ahead
Flash PMIs from Eurozone and UK will be the main focuses in European session. Later in the day, US will release Empire State manufacturing index, industrial production and PMIs. Canada will release housing starts and wholesale sales.
EUR/USD Daily Outlook
Daily Pivots: (S1) 1.0905; (P) 1.0957; (R1) 1.1044; More...
Intraday bias in EUR/USD stays on the upside for 1.1016 resistance. Decisive break there will will confirm resumption of whole rally from 1.0447. Further rally should then be seen to retest 1.1274 high. On the downside, below 1.0914 minor support will turn intraday bias neutral first. But outlook will stay cautiously bullish as long as 1.0722 support holds.
In the bigger picture, price actions from 1.1274 are viewed as a corrective pattern to rise from 0.9534 (2022 low). Rise from 1.0447 is seen as the second leg. While further rally could cannot be ruled out, upside should be limited by 1.1274 to bring the third leg of the pattern. Meanwhile, sustained break of 55 D EMA will argue that the third leg has already started for 1.0447 and below.
Economic Indicators Update
| GMT | Ccy | Events | Actual | Forecast | Previous | Revised |
|---|---|---|---|---|---|---|
| 21:30 | NZD | Business NZ PMI Nov | 46.7 | 42.5 | 42.9 | |
| 22:00 | AUD | Manufacturing PMI Dec P | 47.8 | 47.7 | ||
| 22:00 | AUD | Services PMI Dec P | 47.6 | 46 | ||
| 00:01 | GBP | GfK Consumer Confidence Dec | -22 | -23 | -24 | |
| 00:30 | JPY | Manufacturing PMI Dec P | 47.7 | 48.2 | 48.3 | |
| 00:30 | JPY | Services PMI Dec P | 52 | 50.8 | ||
| 02:00 | CNY | Industrial Production Y/Y Nov | 6.60% | 5.60% | 4.60% | |
| 02:00 | CNY | Retail Sales Y/Y Nov | 10.10% | 12.50% | 7.60% | |
| 02:00 | CNY | Fixed Asset Investment YTD Y/Y Nov | 2.90% | 3.00% | 2.90% | |
| 04:30 | JPY | Tertiary Industry Index M/M Oct | -0.80% | 0.20% | -1.00% | |
| 08:15 | EUR | France Manufacturing PMI Dec P | 43.2 | 42.9 | ||
| 08:15 | EUR | France Services PMI Dec P | 46 | 45.4 | ||
| 08:30 | EUR | Germany Manufacturing PMI Dec P | 43.3 | 42.6 | ||
| 08:30 | EUR | Germany Services PMI Dec P | 49.8 | 49.6 | ||
| 09:00 | EUR | Eurozone Manufacturing PMI Dec P | 44.5 | 44.2 | ||
| 09:00 | EUR | Eurozone Services PMI Dec P | 49 | 48.7 | ||
| 09:30 | GBP | Manufacturing PMI Dec P | 47.5 | 47.2 | ||
| 09:30 | GBP | Services PMI Dec P | 51 | 50.9 | ||
| 10:00 | EUR | Eurozone Trade Balance (EUR) Oct | 10.3B | 9.2B | ||
| 13:15 | CAD | Housing Starts Y/Y Nov | 260.0K | 274.7K | ||
| 13:30 | CAD | Wholesale Sales M/M Oct | 0.50% | 0.40% | ||
| 13:30 | USD | Empire State Manufacturing Index Dec | 2 | 9.1 | ||
| 14:15 | USD | Industrial Production M/M Nov | 0.30% | -0.60% | ||
| 14:15 | USD | Capacity Utilization Nov | 79.20% | 78.90% | ||
| 14:45 | USD | Manufacturing PMI Dec P | 49.1 | 49.4 | ||
| 14:45 | USD | Services PMI Dec P | 50.5 | 50.8 |
WTI Oil Technical: Momentum-Term Downside Momentum Has Eased
- Two key positive technical analysis elements have emerged at the US$67.55/66.35 major support zone.
- The current medium-term downtrend phase from September 2023 may have reached a terminal point for a potential bullish reversal.
- China’s rosy retail sales and industrial production for November managed to offset downbeat housing data that provided a short-term tailwind for oil prices.
The medium-term downtrend phase of West Texas Oil (a proxy of WTI crude oil futures) in place since the 28 September 2023 high of US$95.50/barrel has almost reached the upper limit of a major support zone of US$67.55 (printed at an intraday low of US$67.82/barrel on 13 December 2023).
In addition, two key bullish elements have emerged where the price actions of West Texas Oil have traced out an impending bullish “Descending Wedge” configuration (see Fig 1) with a bullish divergence condition seen in the daily RSI momentum indicator at its oversold region on 12 December 2023.
Medium-term downtrend phase from September 2023 may have ended
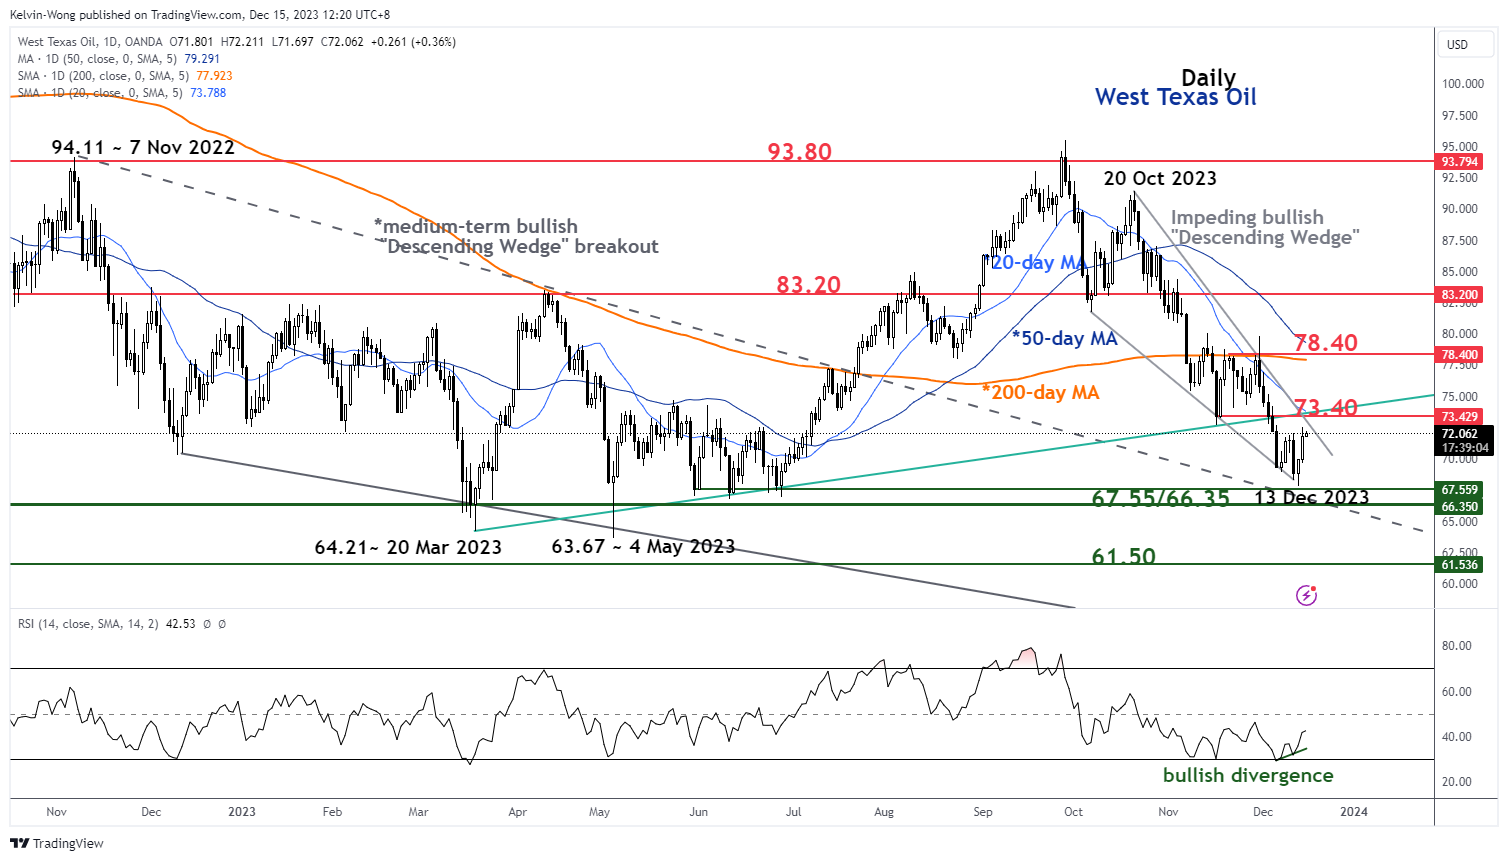
Fig 1: West Texas Oil medium-term trend as of 15 Dec 2023 (Source: TradingView, click to enlarge chart)
All in all, such medium-term bullish elements suggest that the recent medium-term downtrend that recorded an accumulated loss of -29% (28 September 2023 high to 13 December 2023 low) may have reached a terminal point (end of the medium-term downtrend) which in turn advocates the potential start of a minor short-term uptrend phase in the first step for West Texas Oil (a proxy of WTI crude oil futures).
Recent key economic data and events also supported the current +6% gain in oil prices seen in the last two days; oil prices have seen a bit of a “demand pull” factor due to the improved liquidity conditions after the US Federal Reserve’s dovish pivot on Wednesday, 13 December.
Also, a set of China’s key economic data for November released today has indicated some positive turnaround where industrial production advanced by 6% y/y, above the 4.6% y/y growth recorded in October and beat expectations of 5.6% y/y. Retail sales rose by 10.1 y/y, much faster than 7.6% y/y in October, and notched its 11th consecutive month of growth but below expectations of 12.5% y/y.
The rosy data from industrial production and retail sales have managed to offset the ongoing chronic weakness seen in the property development market as new home prices decelerated to -0.2% y/y in November from -0.1% y/y in October which marked its 5th consecutive month of decline.
Watch the short-term key support at US$70.00
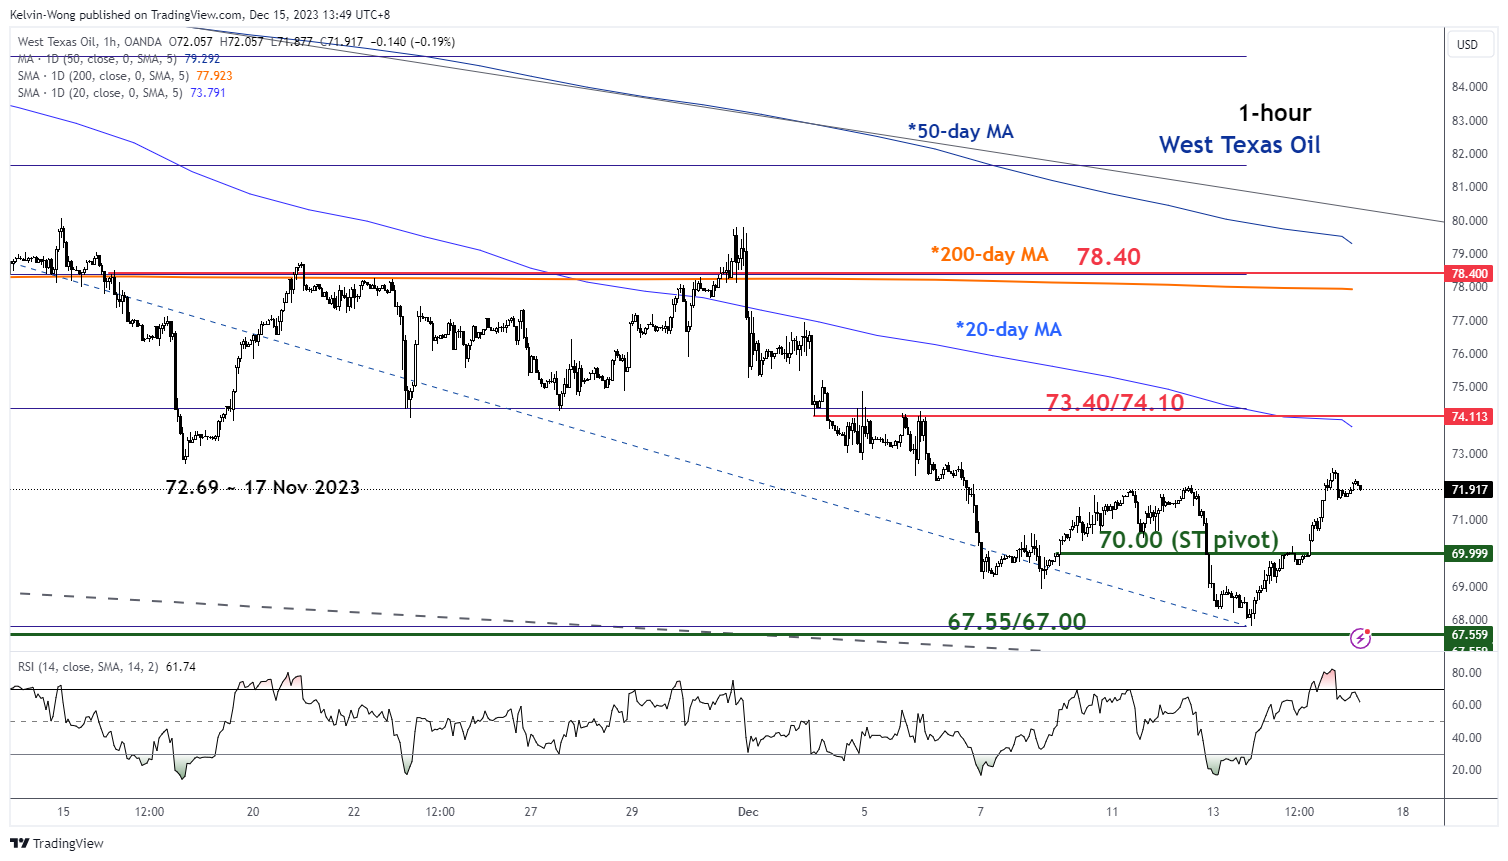
Fig 2: West Texas Oil minor short-term trend as of 15 Dec 2023 (Source: TradingView, click to enlarge chart)
In the shorter term as depicted in the hourly chart, the price actions of West Texas Oil may have evolved into a minor uptrend phase with key short-term pivotal support at US$70.00.
A clearance above the near-term resistance zone of US$73.40/74.10 (the upper limit of the “Descending Wedge” & 20-day moving average) may add further bullish impetus to see the next intermediate resistance coming in at US$78.40 (also the 200-day moving average & 38.2% Fibonacci retracement of the medium-term downtrend from 28 September 2023 high to 13 December 2023 low).
However, failure to hold at US$70.00 invalidates the short-term recovery scenario to expose the US$67.00/67.00 major support area.
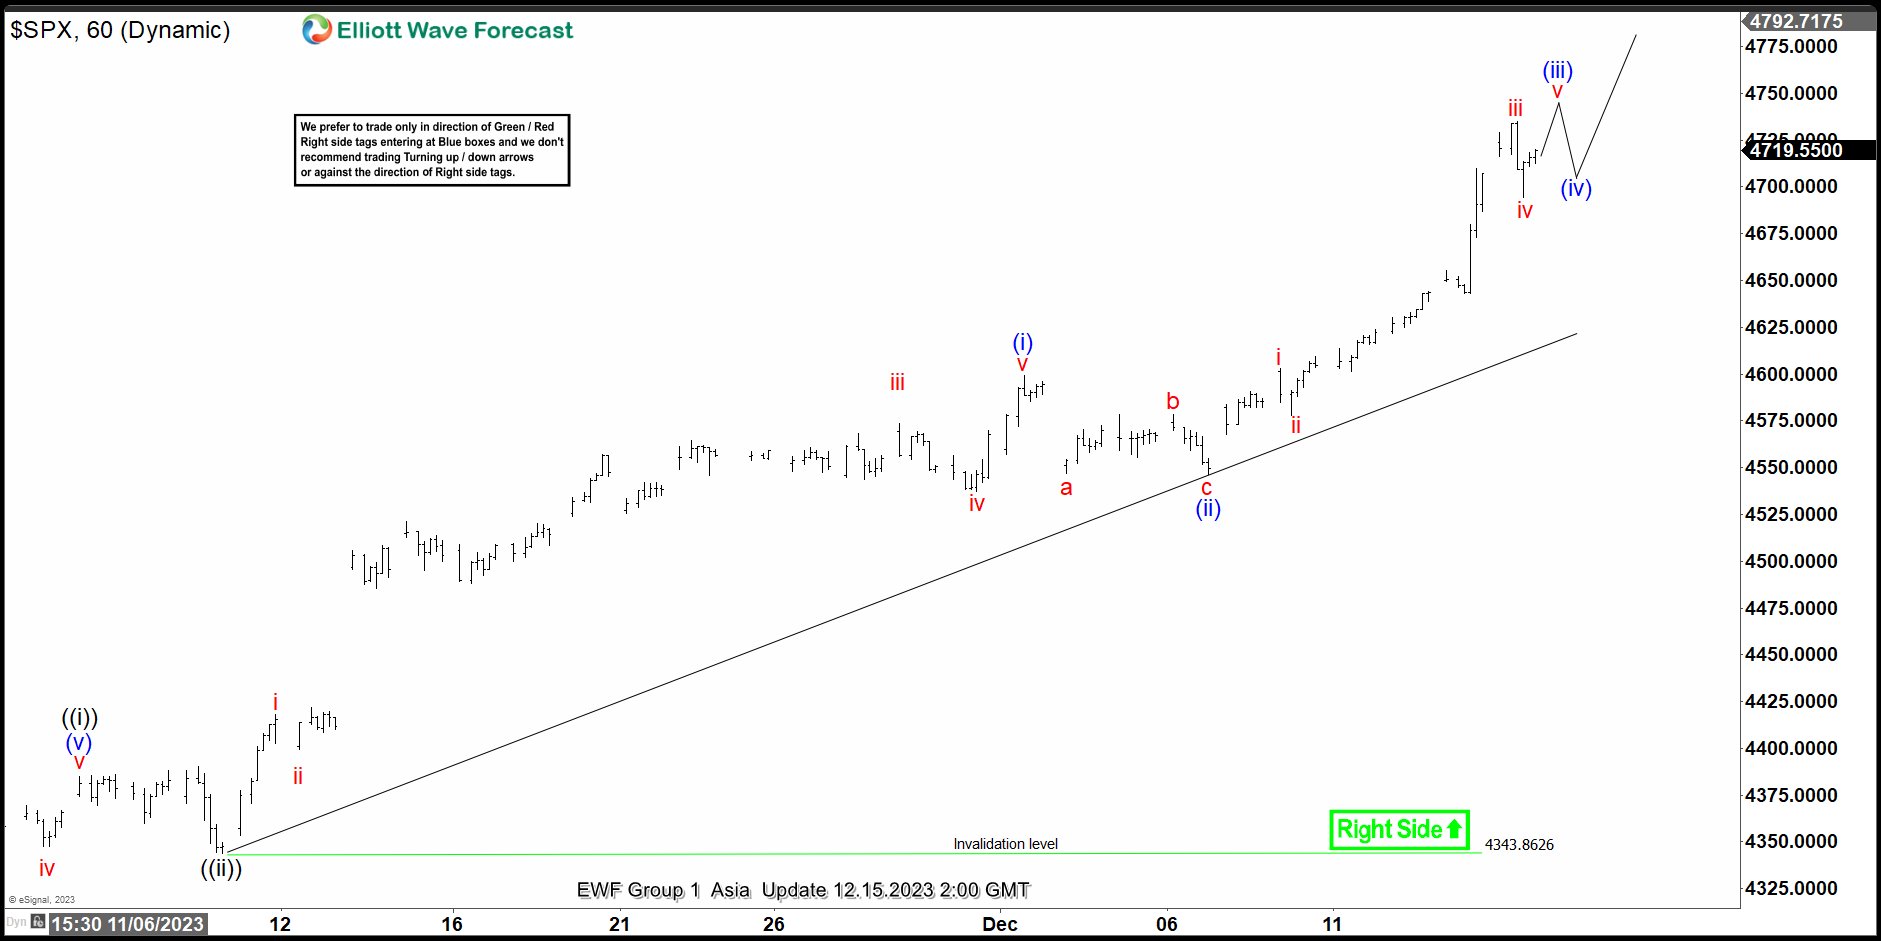
S&P 500 (SPX) Impulsive Rally in Progress
S&P 500 (SPX) rally from 10.27.2023 low is in progress as a 5 waves impulse Elliott Wave structure. Up from 10.27.2023 low, wave ((i)) ended at 4381.15. Wave ((ii)) ended at 4343.86 as the 1 hour chart below shows as expanded flat. The Index then resumes higher in wave ((iii)). Up from wave ((ii)), wave i ended at 4418.03 and pullback in wave ii ended at 4399.62. Index then resumed higher in wave iii towards 4573.75 and pullback in wave iv ended at 4537.24. Final leg wave v ended at 4599.39 and this completed wave (i).
Pullback in wave (ii) unfolded as a zigzag structure. Down from wave (i), wave a ended at 4546.72 and rally in wave b ended at 4578.42. Wave c lower ended at 4546.5 which completed wave (ii) in higher degree. Index then resumes higher in wave (iii). Up from wave (ii), wave i ended at 4603.2 and pullback in wave ii ended at 4577.96. Index resumes higher in wave iii towards 4734.87 and pullback in wave iv ended at 4694.34. Expect the Index to extend higher in wave v to end wave (iii), then it should pullback in wave (iv) before the next leg higher again. Near term, as far as pivot at 4343.86 low stays intact, expect dips to find support in 3 ,7, or 11 swing for further upside.
S&P 500 (SPX) 60 Minutes Elliott Wave Chart
SPX Elliott Wave Video
https://www.youtube.com/watch?v=esDw3PRLWRk
Technical Outlook and Review
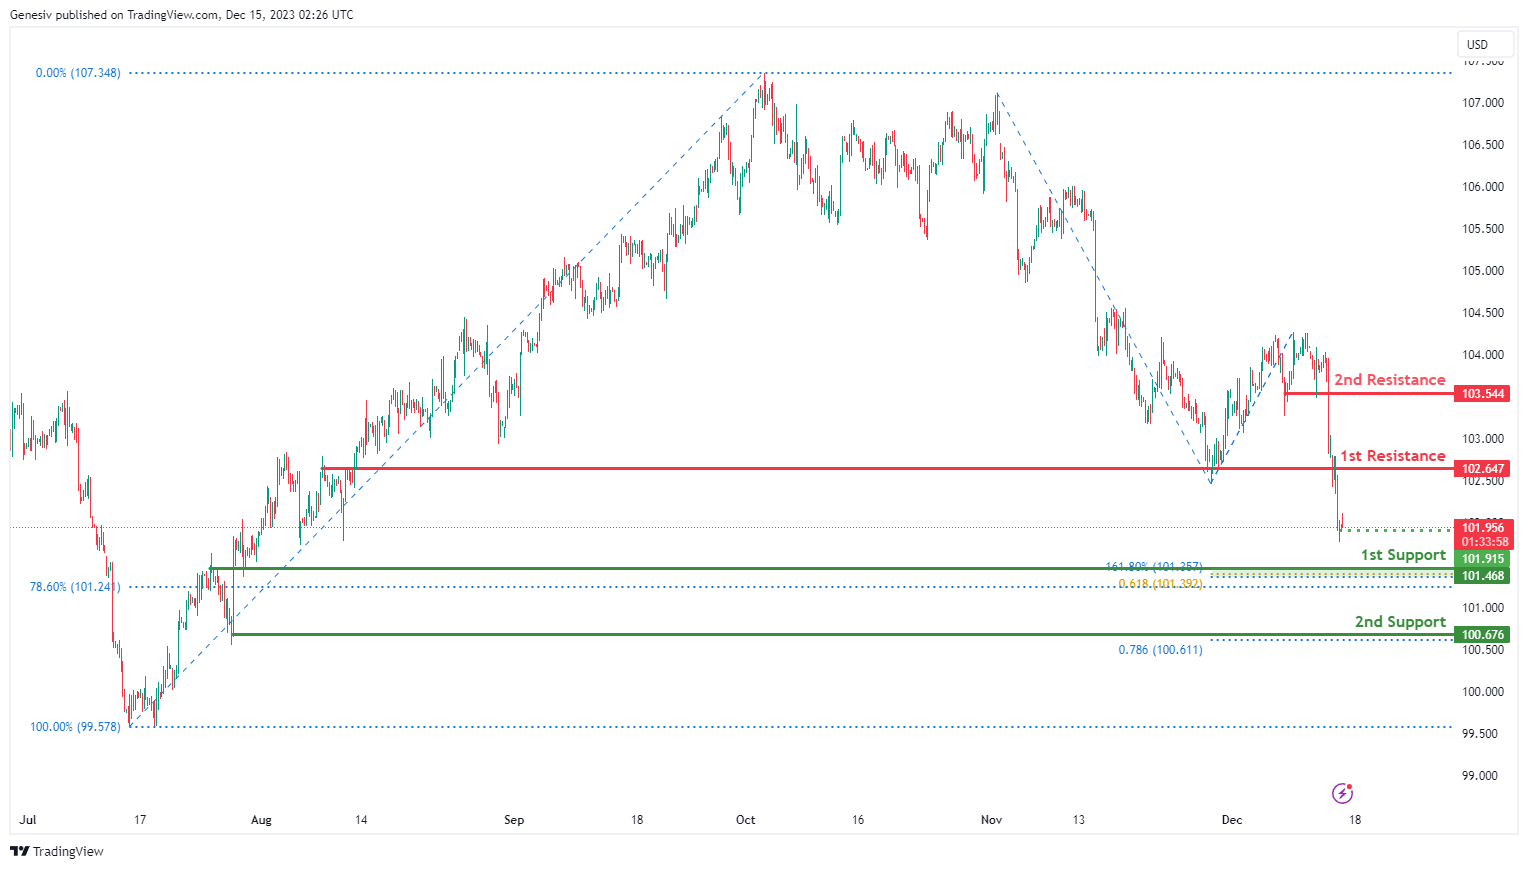
DXY:
The DXY (US Dollar Index) chart currently shows an overall bearish momentum, indicating a potential for price to make a bearish continuation towards the 1st support.
The 1st support level at 101.46 is identified as an overlap support that aligns with a confluence of Fibonacci levels i.e. the 161.80% extension and the 61.80% projection levels. Further below, the 2nd support level at 100.67 is noted as a swing-low support that aligns with the 78.60% Fibonacci projection level, further reinforcing its importance as a potential key support level.
On the resistance side, the 1st resistance level at 102.64 is identified as an overlap resistance. Higher up, the 2nd resistance level at 103.54 is marked as a pullback resistance, suggesting a potential barrier for further upside movement.
EUR/USD:
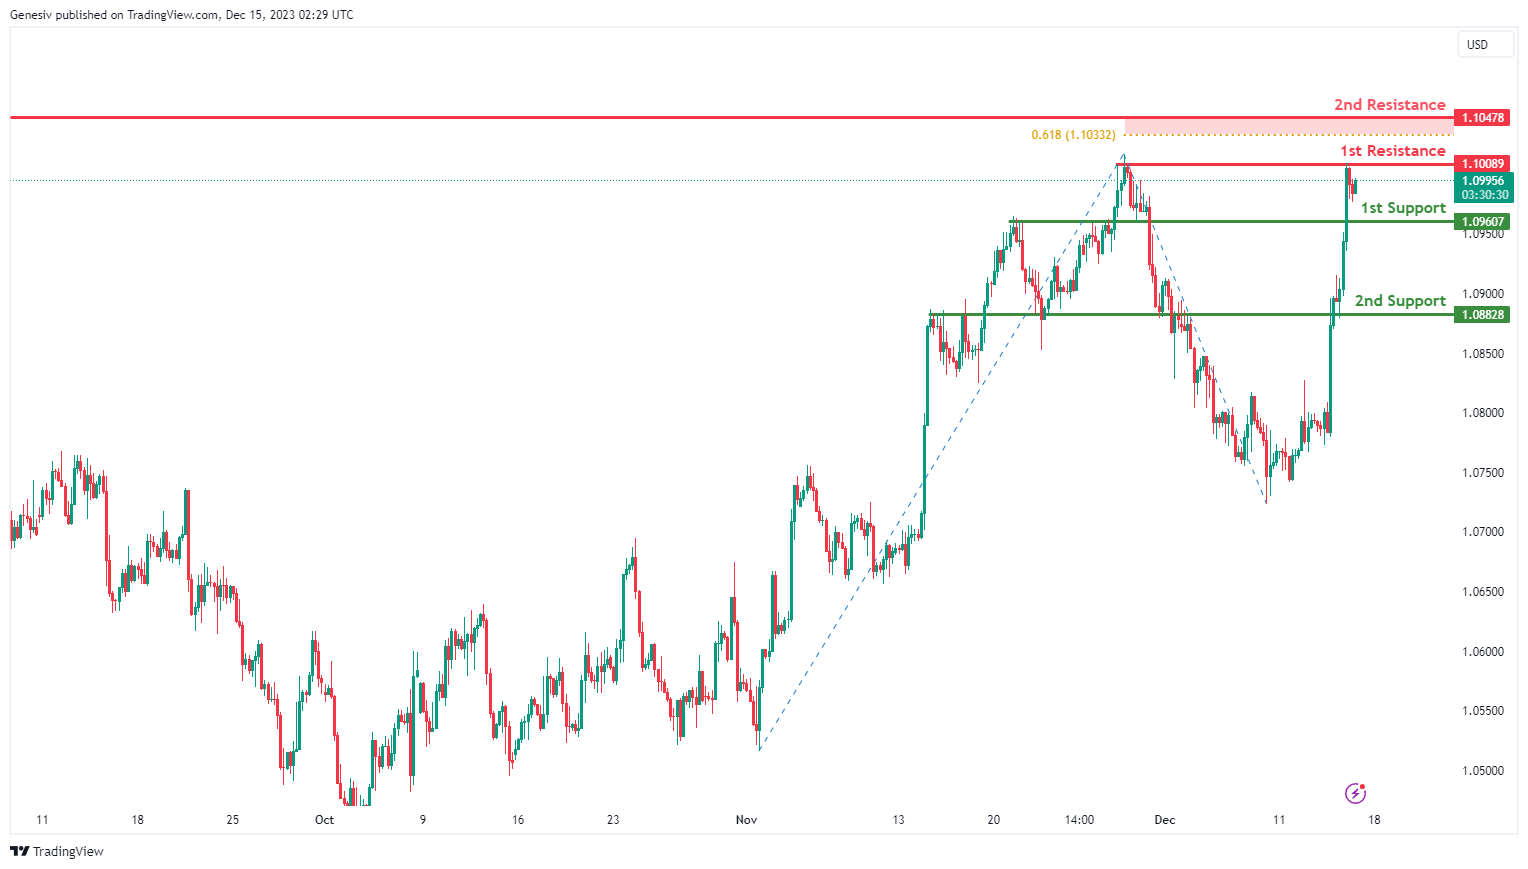
The EUR/USD chart currently exhibits an overall bullish momentum. In this context, there is a potential scenario for price to make a bullish continuation towards the 1st resistance.
The 1st resistance level at 1.1008 is identified as a swing-high resistance while the 2nd resistance level at 1.1047 is marked as a pullback resistance that aligns close to the 61.80% Fibonacci projection level, suggesting a potential barrier for further upside movement.
To the downside, the 1st support level at 1.0960 is identified as an overlap support. Further below, the 2nd support level at 1.0882 is also noted as an overlap support, further reinforcing its importance as a potential key support level.
EUR/JPY:
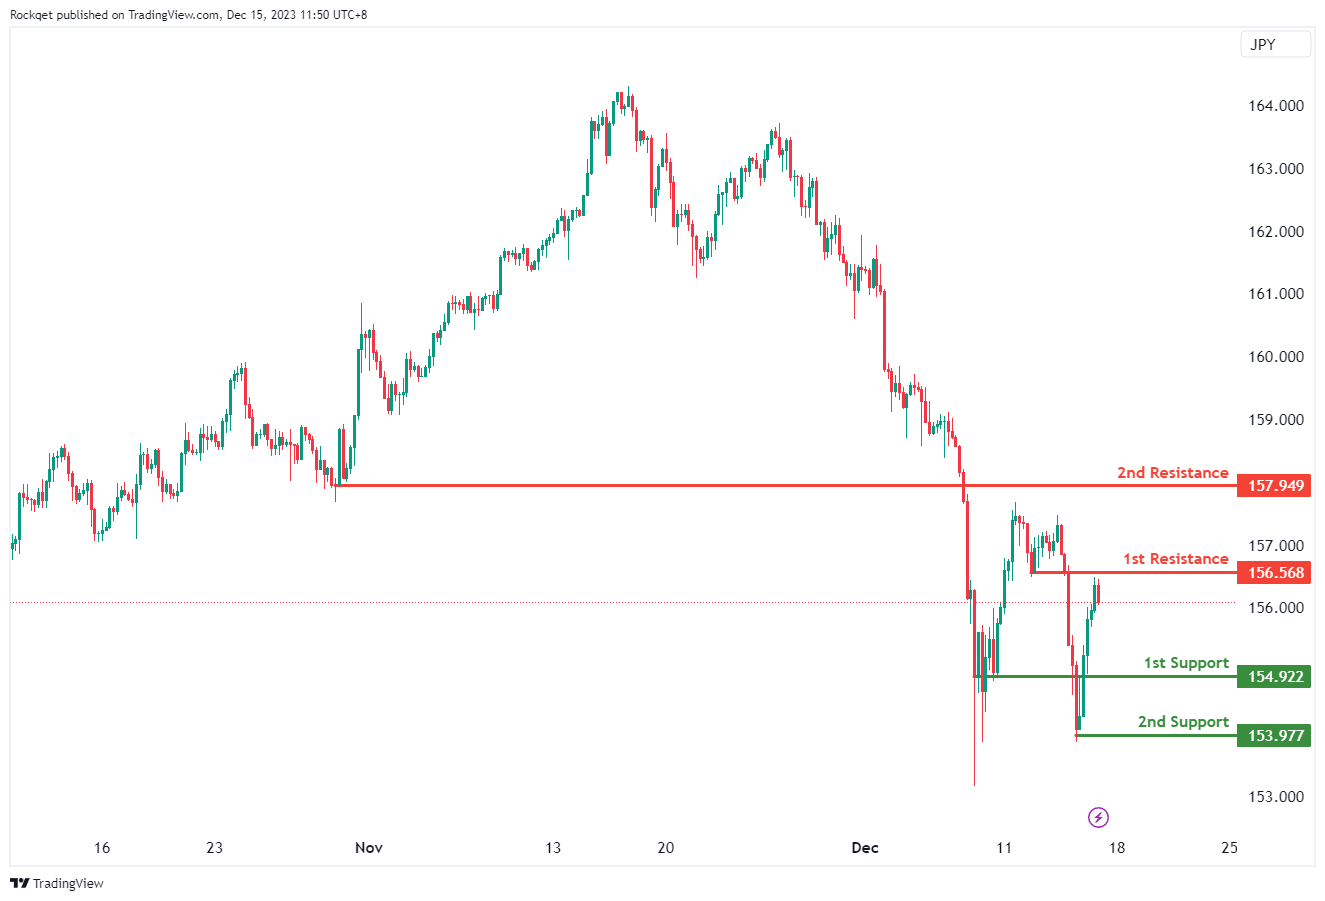
The EUR/JPY chart currently has a bearish overall momentum, and there is a potential scenario where the price could make a short-term rise towards the 1st resistance before reversing off it and dropping towards the 1st support.
The 1st support at 154.92 is considered significant as it represents a pullback support. This level indicates a potential area where buying interest may emerge after a pullback, providing support for the currency pair.
Similarly, the 2nd support at 153.98 is identified as a swing low support. This adds to the support structure, indicating another potential zone where buying interest may be present, further reinforcing the potential for a short-term rise.
On the resistance side, the 1st resistance at 156.57 is associated with a pullback resistance. This level may act as a barrier where selling interest could intensify, potentially causing a temporary pause or reversal in the bearish trend.
Furthermore, the 2nd resistance at 157.95 is characterized as a pullback resistance. This adds another layer of significance to the resistance, suggesting a potential area where selling pressure may increase, especially considering the alignment with another pullback resistance level.
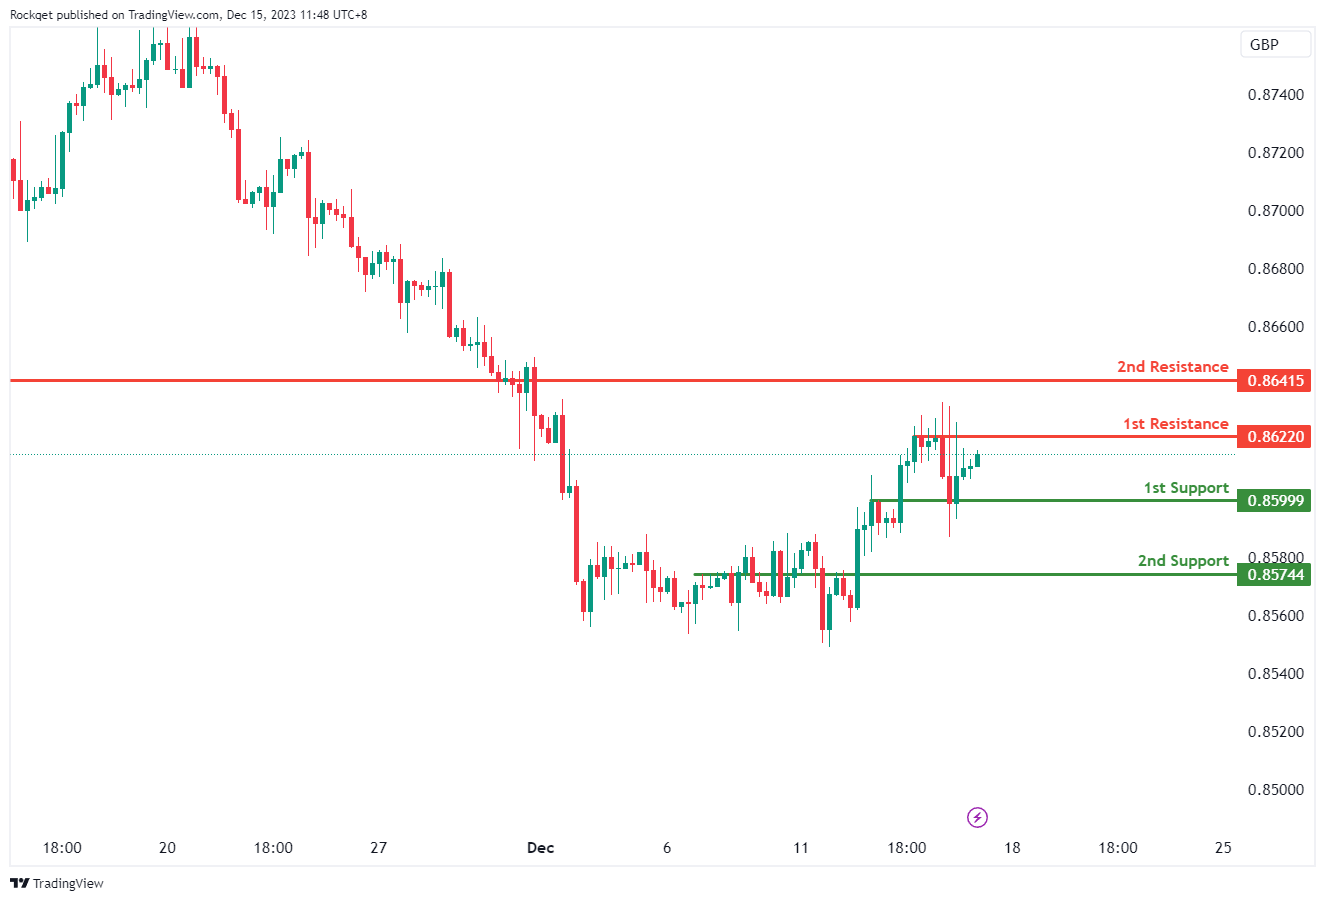
EUR/GBP:
The EUR/GBP chart currently has a bearish overall momentum, and there is a potential scenario where the price could make a short-term rise towards the 1st resistance before reversing off it and dropping towards the 1st support.
The 1st support at 0.8642 is considered significant as it represents an overlap support. This level indicates a convergence of historical price points, reinforcing its potential as a crucial area where buying interest may emerge. Additionally, this support level aligns with the 0.8642 level, providing additional significance.
Similarly, the 2nd support at 0.8574 is identified as an overlap support. This adds another layer of support, indicating another potential zone where buying interest may be present, further reinforcing the potential for a short-term rise.
On the resistance side, the 1st resistance at 0.8622 is associated with multi-swing high resistance. This level may act as a barrier where selling interest could intensify, potentially causing a temporary pause or reversal in the bearish trend.
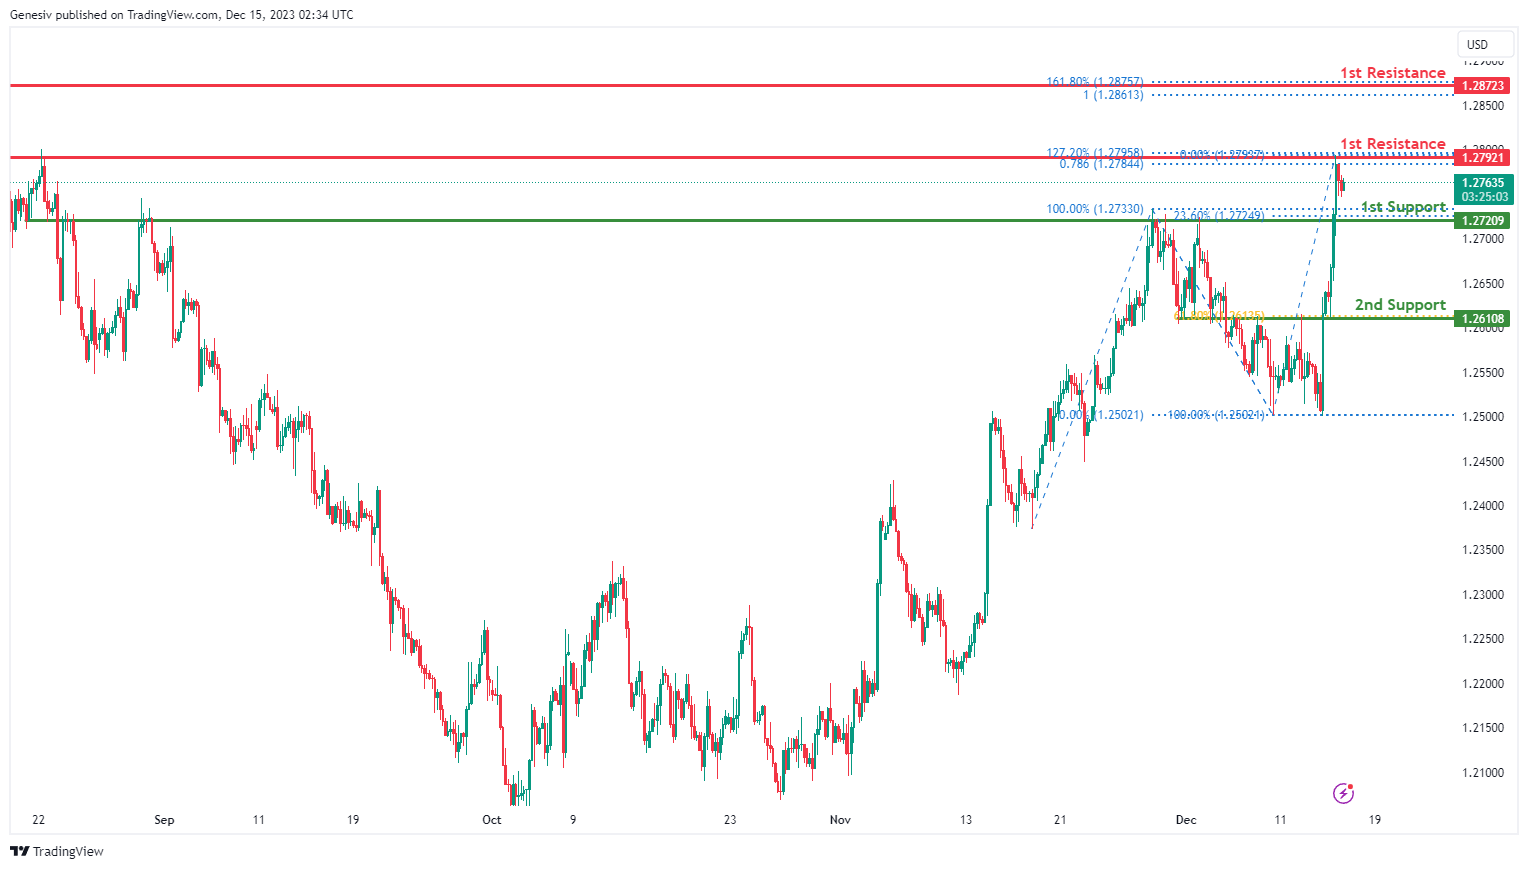
GBP/USD:
The GBP/USD chart currently exhibits an overall bullish momentum. In this context, there is a potential scenario for price to make a bullish continuation towards the 1st resistance.
The 1st resistance level at 1.2792 is identified as a multi-swing-high resistance that aligns with a confluence of Fibonacci levels i.e. the 127.20% extension and the 78.60% projection levels. Higher up, the 2nd resistance level at 1.2872 is marked as a pullback resistance that aligns with a confluence of Fibonacci levels i.e. the 161.80% extension and the 100.00% projection levels, suggesting a potential barrier for further upside movement.
To the downside, the 1st support level at 1.2720 is identified as an overlap support that aligns with the 23.60% Fibonacci retracement level. Further below, the 2nd support level at 1.2610 is also noted as an overlap support that aligns with the 61.80% Fibonacci retracement level, further reinforcing its importance as a potential key support level.
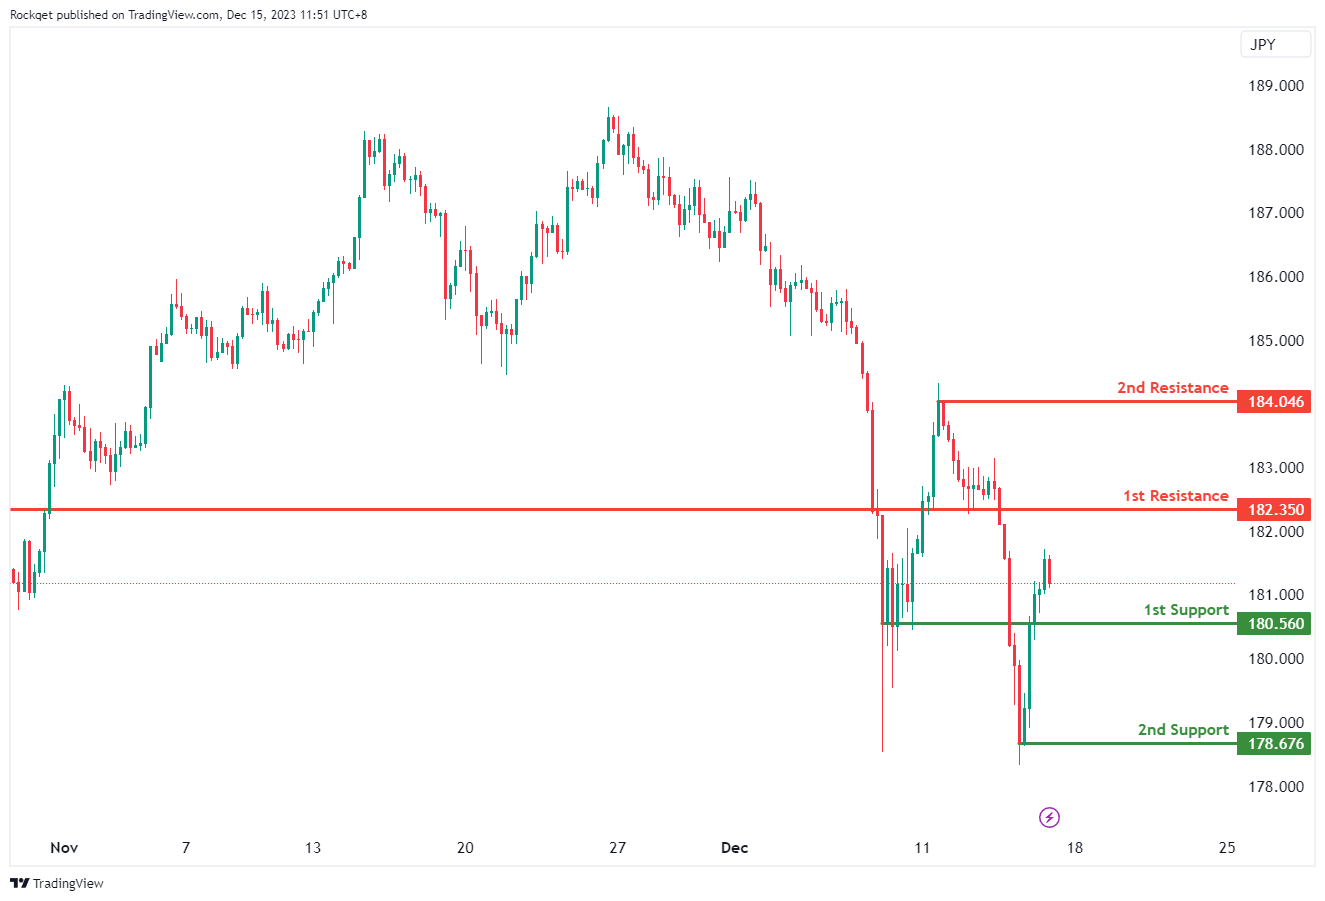
GBP/JPY:
The GBP/JPY chart currently exhibits a weak bullish momentum with low confidence, suggesting a potential for a cautious bullish continuation towards the 1st resistance.
The 1st support at 180.35 is considered significant as it represents a pullback support. This level indicates a potential area where buying interest may emerge after a pullback, providing support for the currency pair. However, given the weak bullish momentum with low confidence, traders should approach the potential continuation cautiously.
Similarly, the 2nd support at 178.68 is identified as another pullback support, adding another layer of potential support for the currency pair.
The intermediate resistance at 182.56 is associated with an overlap resistance. This level may act as a barrier where selling interest could intensify, potentially causing a temporary pause or consolidation in the bullish trend. The weak bullish momentum suggests that the breakout through this level may not be as strong.
Furthermore, the 1st resistance at 184.05 is characterized as a swing high resistance. This adds further significance to the resistance, suggesting a potential area where selling pressure may increase, especially considering its alignment with a previous swing high. Again, the weak bullish momentum should be taken into consideration when evaluating the potential for a breakout.
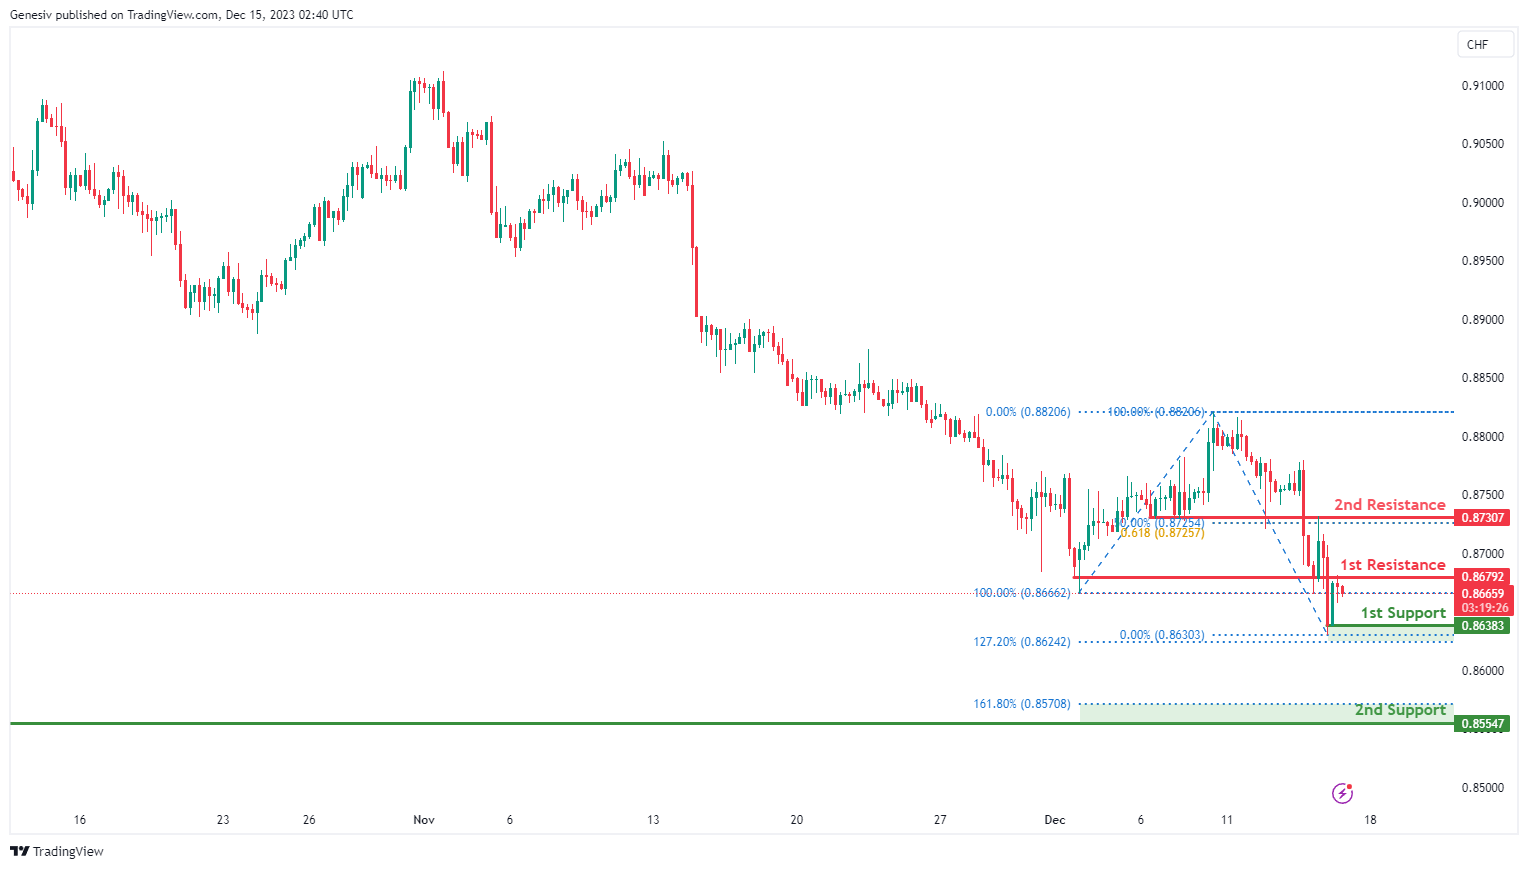
USD/CHF:
The USD/CHF chart currently exhibits an overall bearish momentum. In this context, there is a potential scenario for price to make a bearish continuation towards the 1st support.
The 1st support level at 0.8638 is identified as a pullback support that aligns with the 127.20% Fibonacci extension level. Further below, the 2nd support level at 0.8554 is noted as a multi-swing-low support that aligns close to the 161.80% Fibonacci extension level, further reinforcing its importance as a key support level.
On the resistance side, the 1st resistance level at 0.8679 is identified as an overlap resistance. Higher up, the 2nd resistance level at 0.8730 is also marked as an overlap resistance that aligns with a confluence of Fibonacci levels i.e. the 50.00% retracement and the 61.80% projection levels, suggesting a potential barrier for further upside movement.
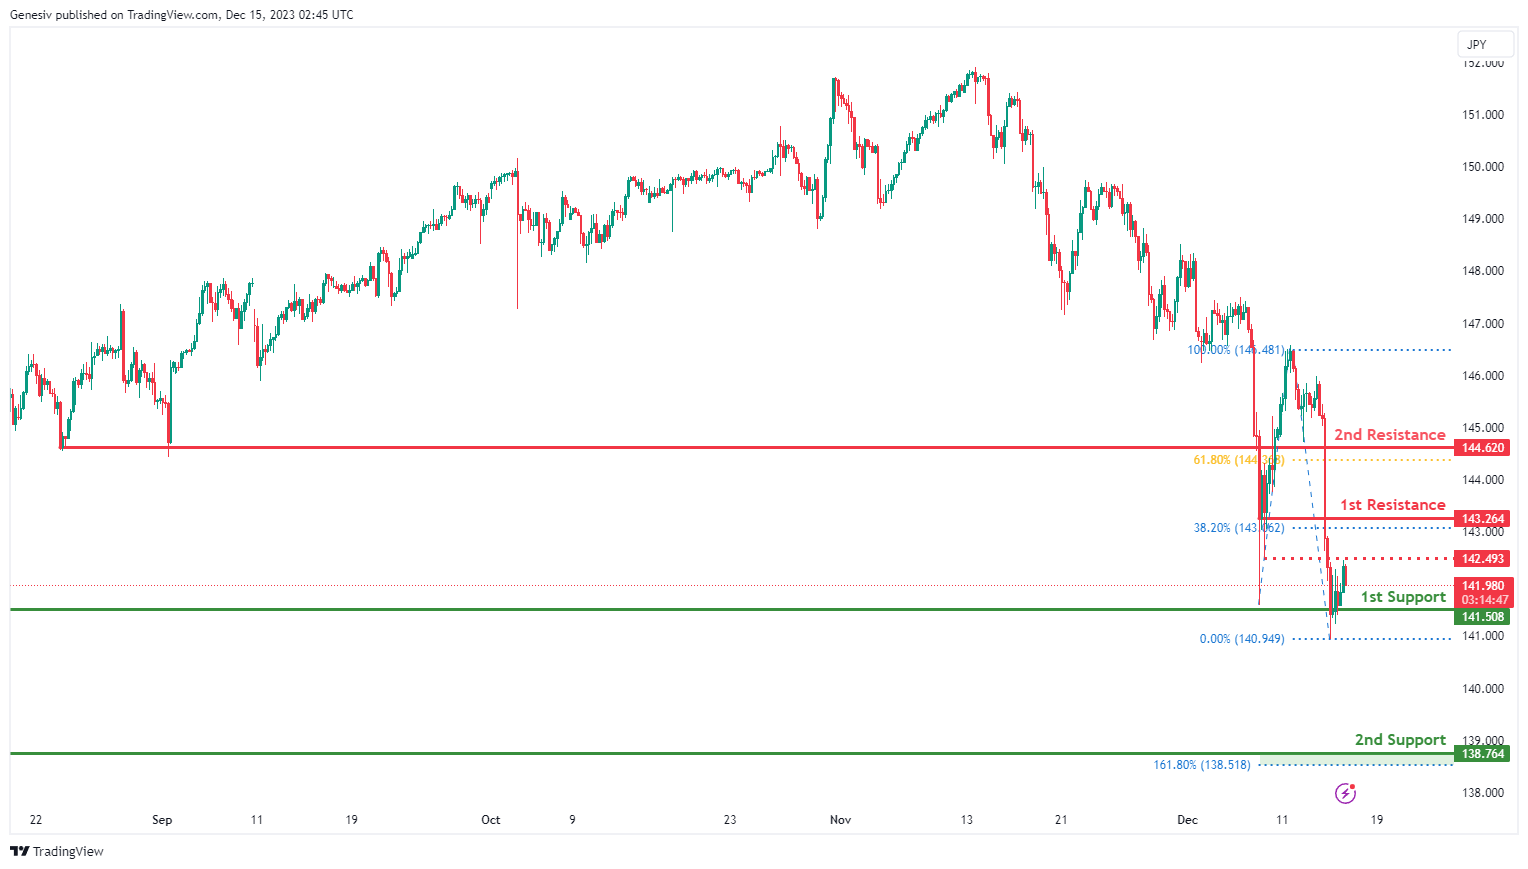
USD/JPY:
The USD/JPY chart currently exhibits a neutral momentum, indicating a potential for price to fluctuate between the 1st support and the 1st resistance.
The 1st support level at 141.50 is identified as a swing-low support while the 2nd support level at 138.76 is also noted as swing-low support that aligns close to the 161.80% Fibonacci extension level, further reinforcing its importance as a key support level.
On the resistance side, the intermediate resistance level at 142.49 is identified as an overlap resistance while the 1st resistance level at 143.26 is noted as a pullback resistance that aligns close to the 38.20% Fibonacci retracement. Higher up, the 2nd resistance level at 146.62 is identified as a pullback resistance that aligns close to the 61.80% Fibonacci retracement level, suggesting a potential barrier for further upside movement.
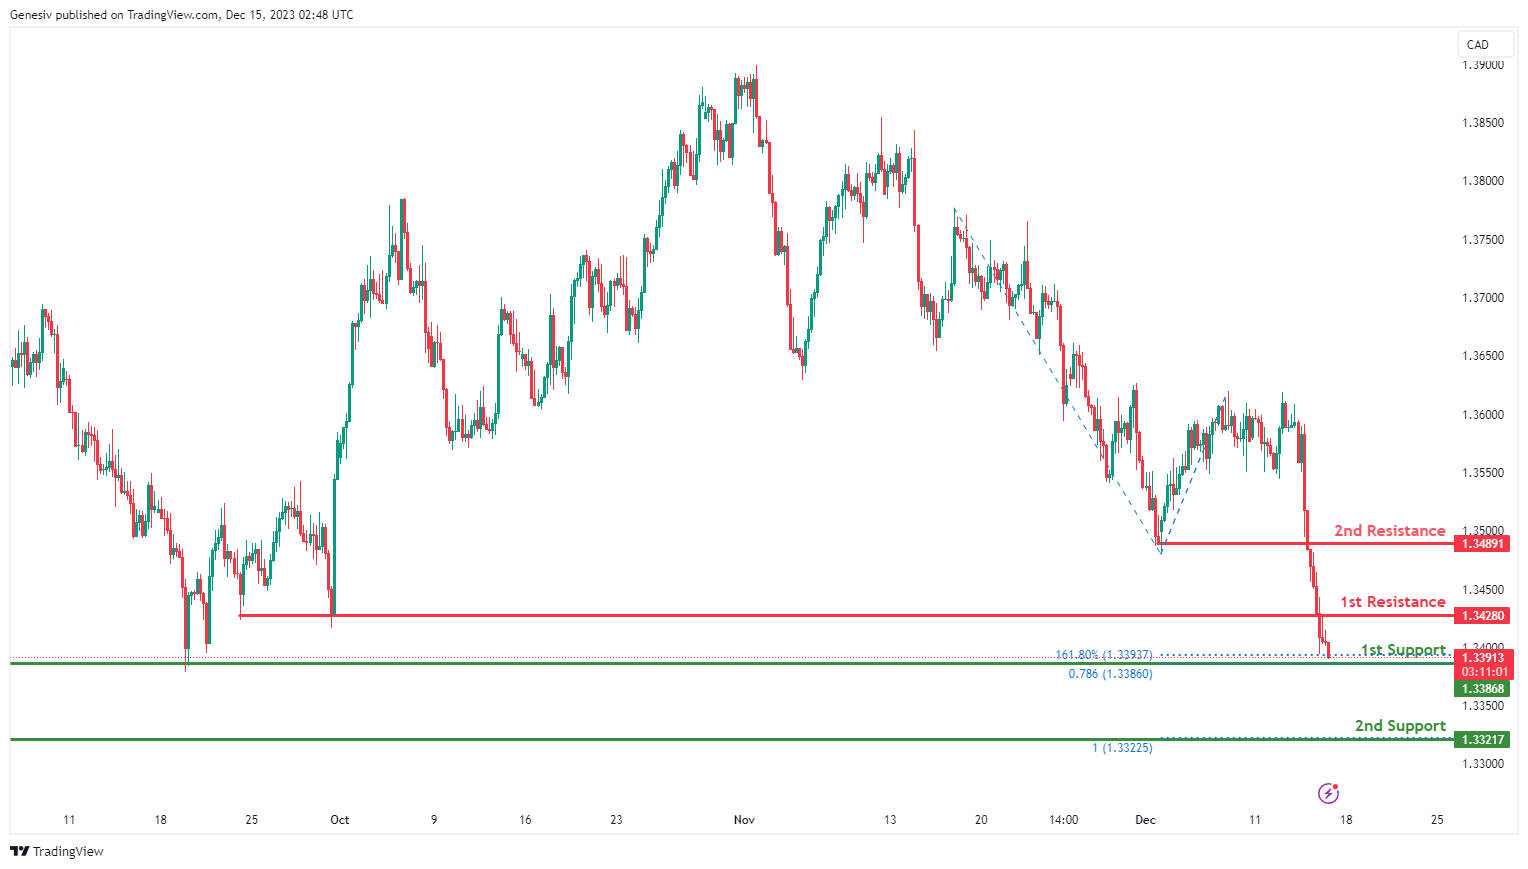
USD/CAD:
The USD/CAD chart currently exhibits an overall bearish momentum. In this context, there is a potential scenario for price to make a bearish continuation towards the 1st support.
The 1st support level at 1.3386 is identified as a multi-swing-low support that aligns with a confluence of Fibonacci levels i.e. the 161.80% extension and the 78.60% projection levels. Further below, the 2nd support level at 1.3321 is marked as a pullback support that aligns with the 100.00% Fibonacci projection level, further reinforcing its importance as a key support level.
To the upside, the 1st resistance level at 1.3428 is identified as a pullback resistance while the 2nd resistance level at 1.3489 is also noted as a pullback resistance, suggesting a potential barrier for further upside movement.
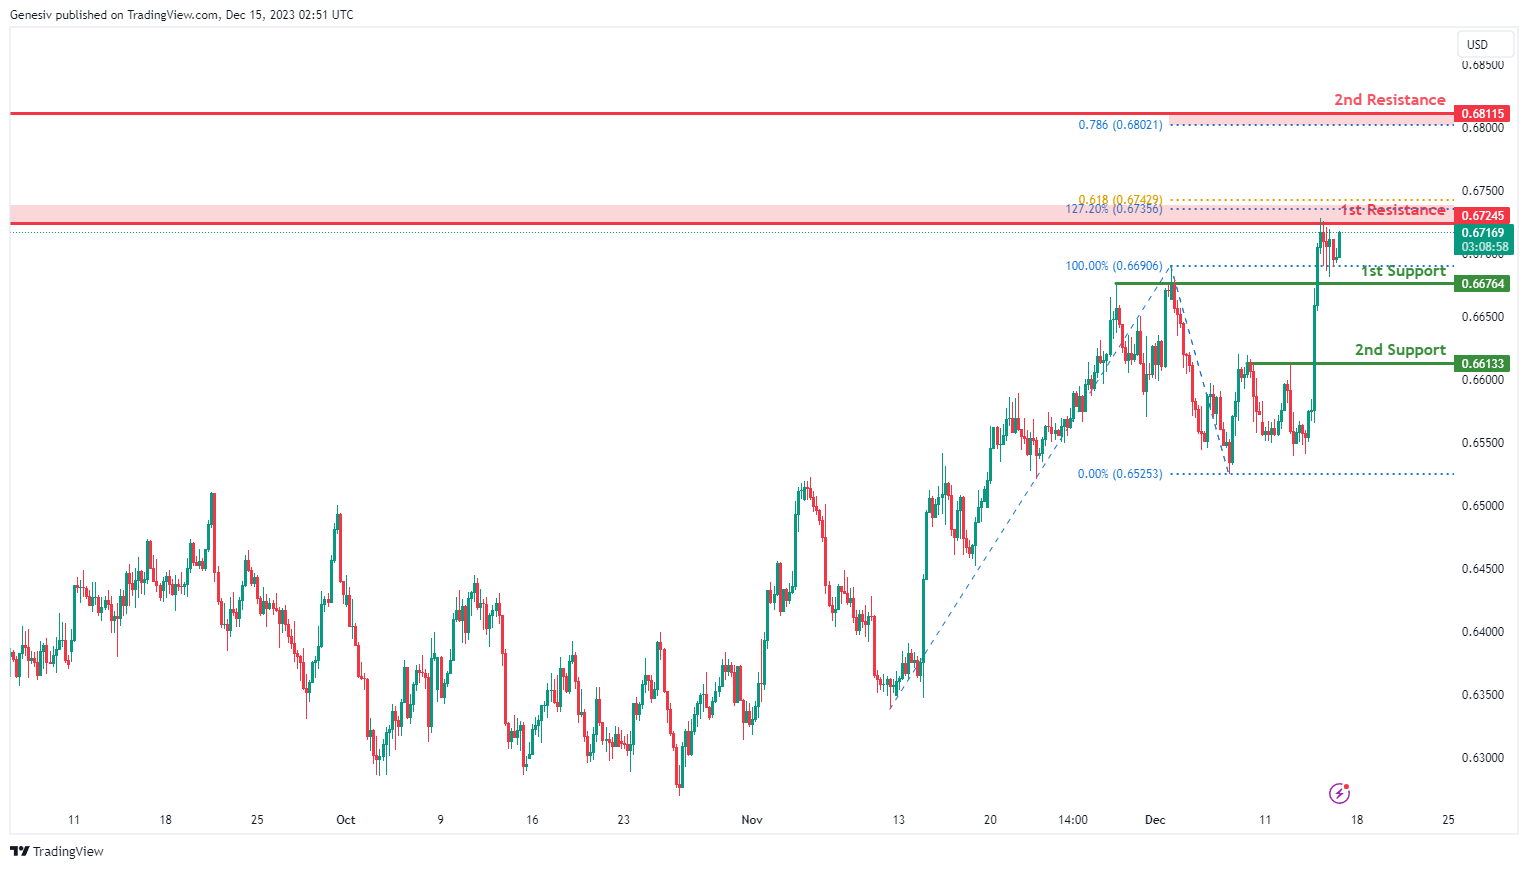
AUD/USD:
The AUD/USD chart currently exhibits an overall bullish momentum. In this context, there is a potential scenario for price to make a bullish continuation towards the 1st resistance.
The 1st resistance level at 0.6724 is identified as a swing-high resistance that aligns with a confluence of Fibonacci levels i.e. the 127.20% extension and the 61.80% projection levels. Higher up, the 2nd resistance level at 0.6811 is also marked as a swing-high resistance that aligns with the 78.60% Fibonacci projection level, indicating its potential significance as a barrier for further upward movement.
To the downside, the 1st support level at 0.6676 is identified as a pullback support while the 2nd support level at 0.6613 is also noted as a pullback support, further reinforcing its importance as a key support level.
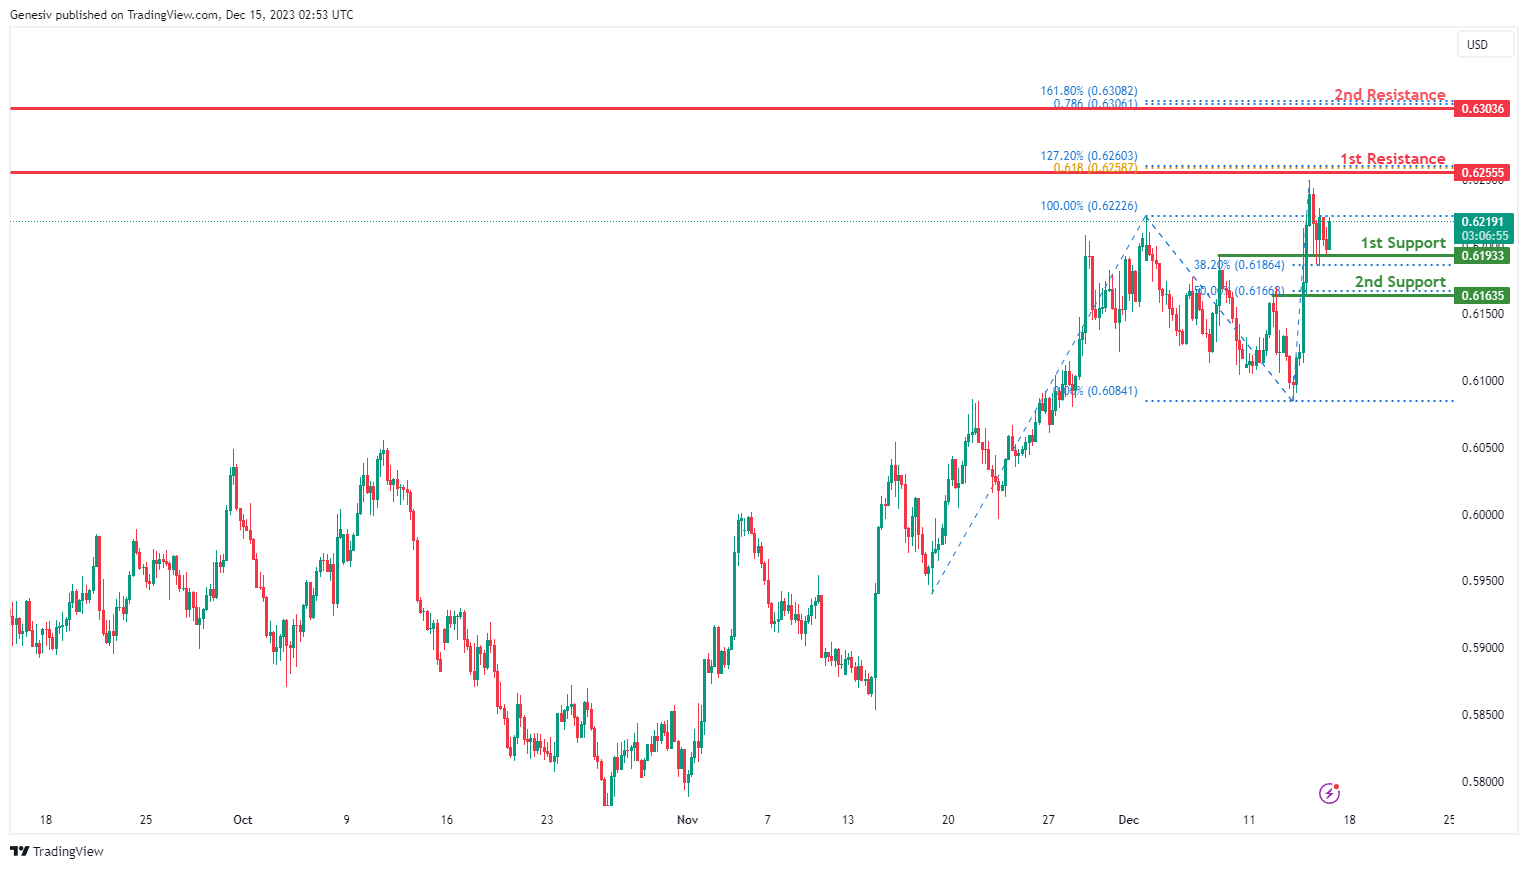
NZD/USD
The NZD/USD chart currently exhibits an overall bullish momentum. In this context, there is a potential scenario for price to make a bullish continuation towards the 1st resistance.
The 1st resistance level at 0.6255 is identified as a swing-high resistance that aligns with a confluence of Fibonacci levels i.e. the 127.20% extension and the 61.80% projection levels. Higher up, the 2nd resistance level at 0.6303 is also marked as a swing-high resistance that aligns with a confluence of Fibonacci levels i.e. the 161.80% extension and the 78.60% projection levels, indicating its potential significance as a barrier for further upward movement.
To the downside, the 1st support level at 0.6193 is identified as an overlap support that aligns with the 38.20% Fibonacci retracement level while the 2nd support level at 0.6163 is noted as a pullback support that aligns with the 50.00% Fibonacci retracement level, further reinforcing its importance as a key support level.
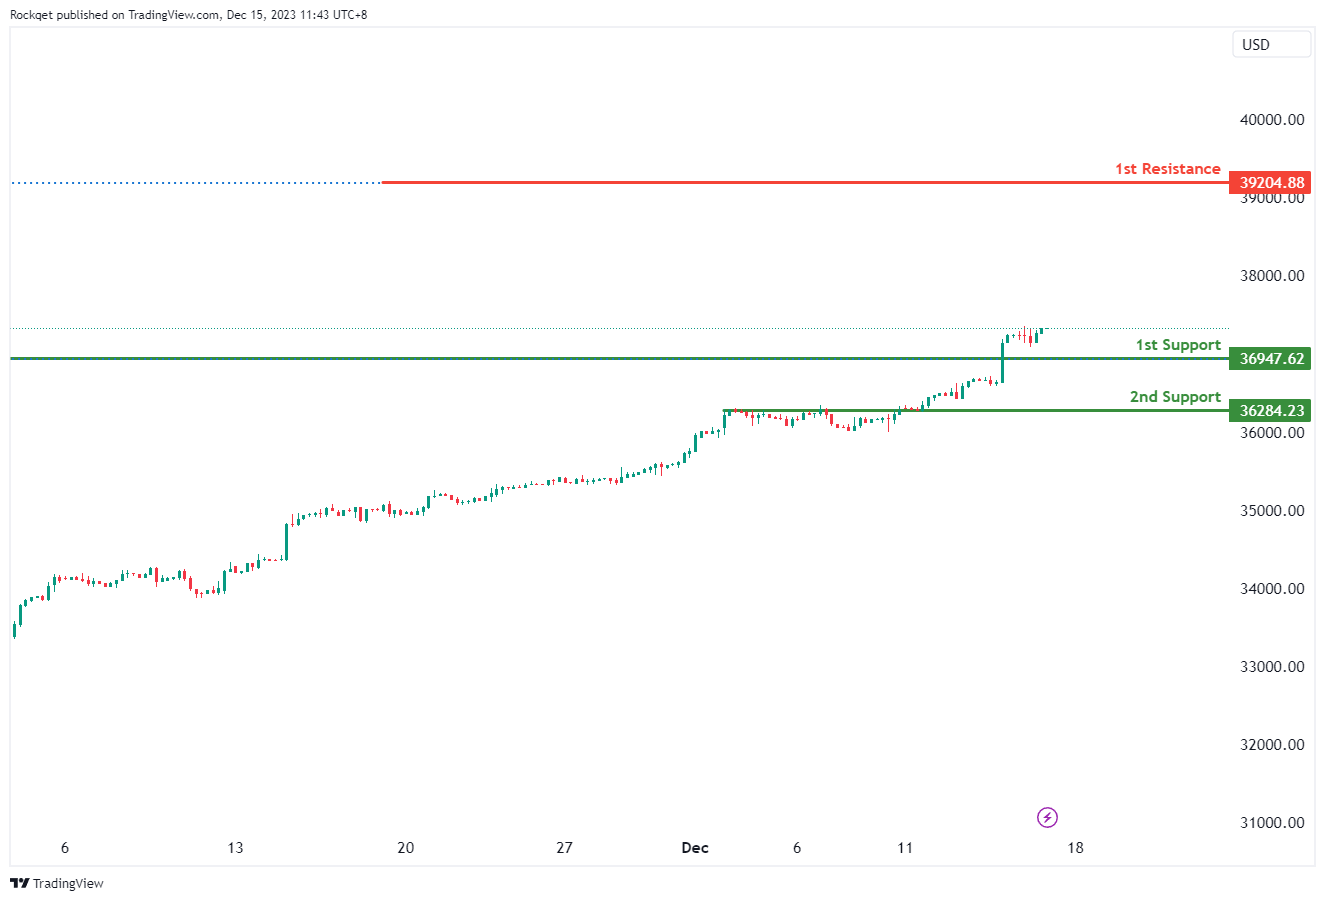
DJ30:
The DJ30 (Dow Jones Industrial Average) chart currently exhibits a bullish overall momentum, indicating a potential for a bullish continuation towards the 1st resistance.
The 1st support at 36947.62 is considered significant as it represents a pullback support. This level suggests a potential area where buying interest may emerge after a pullback, providing support for the index and contributing to the potential for a bullish continuation.
Similarly, the 2nd support at 36284.23 is identified as an overlap support. This adds an additional layer of support, indicating another potential zone where buying interest may be present, further reinforcing the potential for a bullish continuation.
On the resistance side, the 1st resistance at 39204.88 is linked to the 127.20% Fibonacci Extension. This adds significance to the resistance, suggesting a potential area where selling interest may intensify, potentially causing a temporary pause or reversal in the bullish trend.
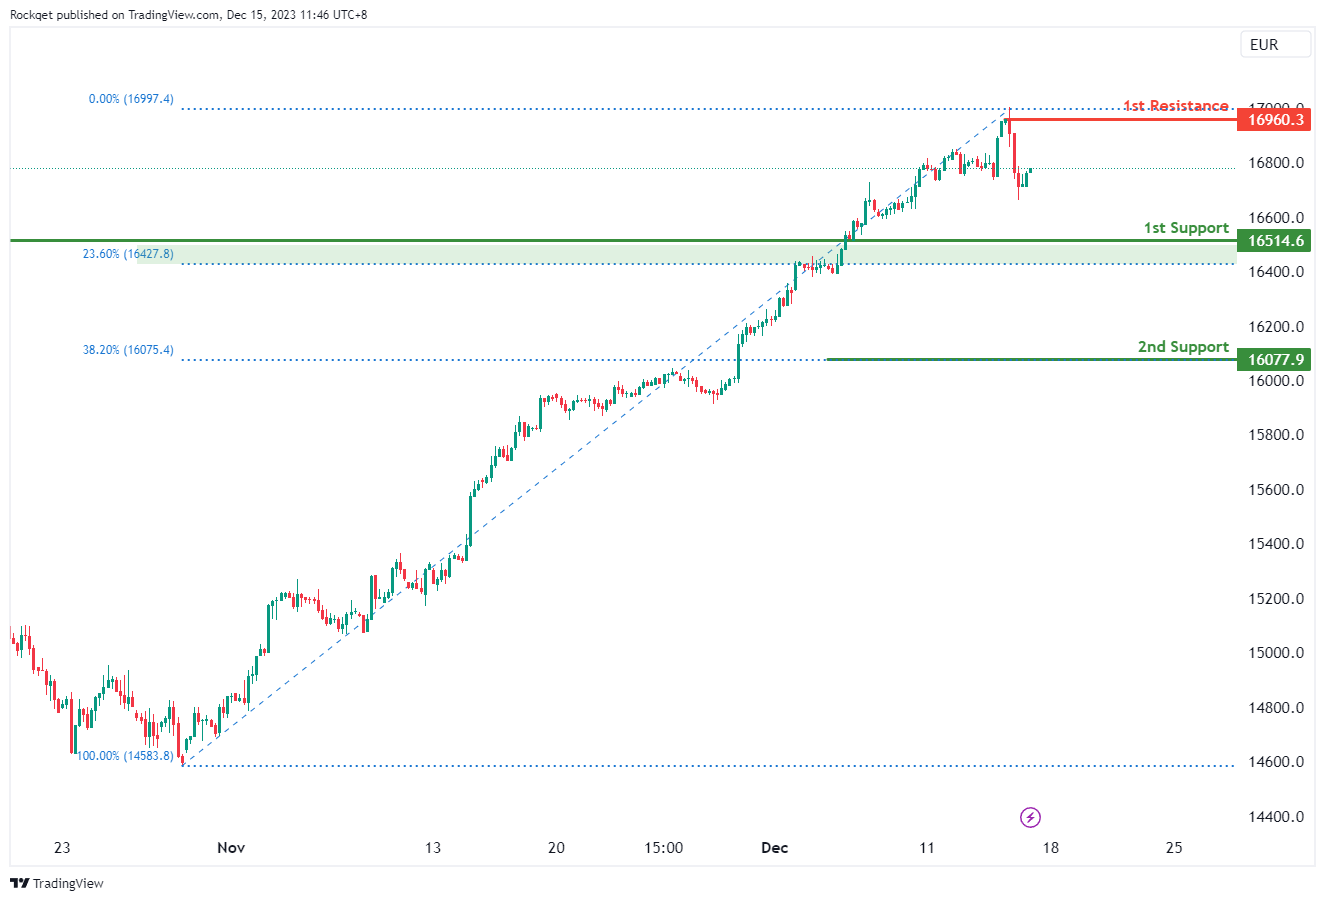
GER40:
The GER40 (DAX) chart currently indicates a neutral overall momentum, suggesting a potential scenario where the price may fluctuate between the 1st resistance and the 1st support level.
The 1st support at 16514.60 is considered significant for several reasons. Firstly, it is identified as a pullback support, indicating a potential area where buying interest may emerge after a pullback, providing support for the index. Additionally, this support level aligns with the 23.60% Fibonacci Retracement, further reinforcing its importance as a potential reversal or bounce point.
Similarly, the 2nd support at 16077.90 is characterized as a pullback support and is associated with the 38.20% Fibonacci Retracement. This confluence strengthens the support level, indicating a zone where historical price action aligns, and buyers may find significant interest, contributing to the potential for price fluctuation.
On the resistance side, the 1st resistance at 16960.30 is associated with a swing high resistance. This level may act as a barrier where selling interest could intensify, potentially causing a temporary pause or reversal in the neutral trend.
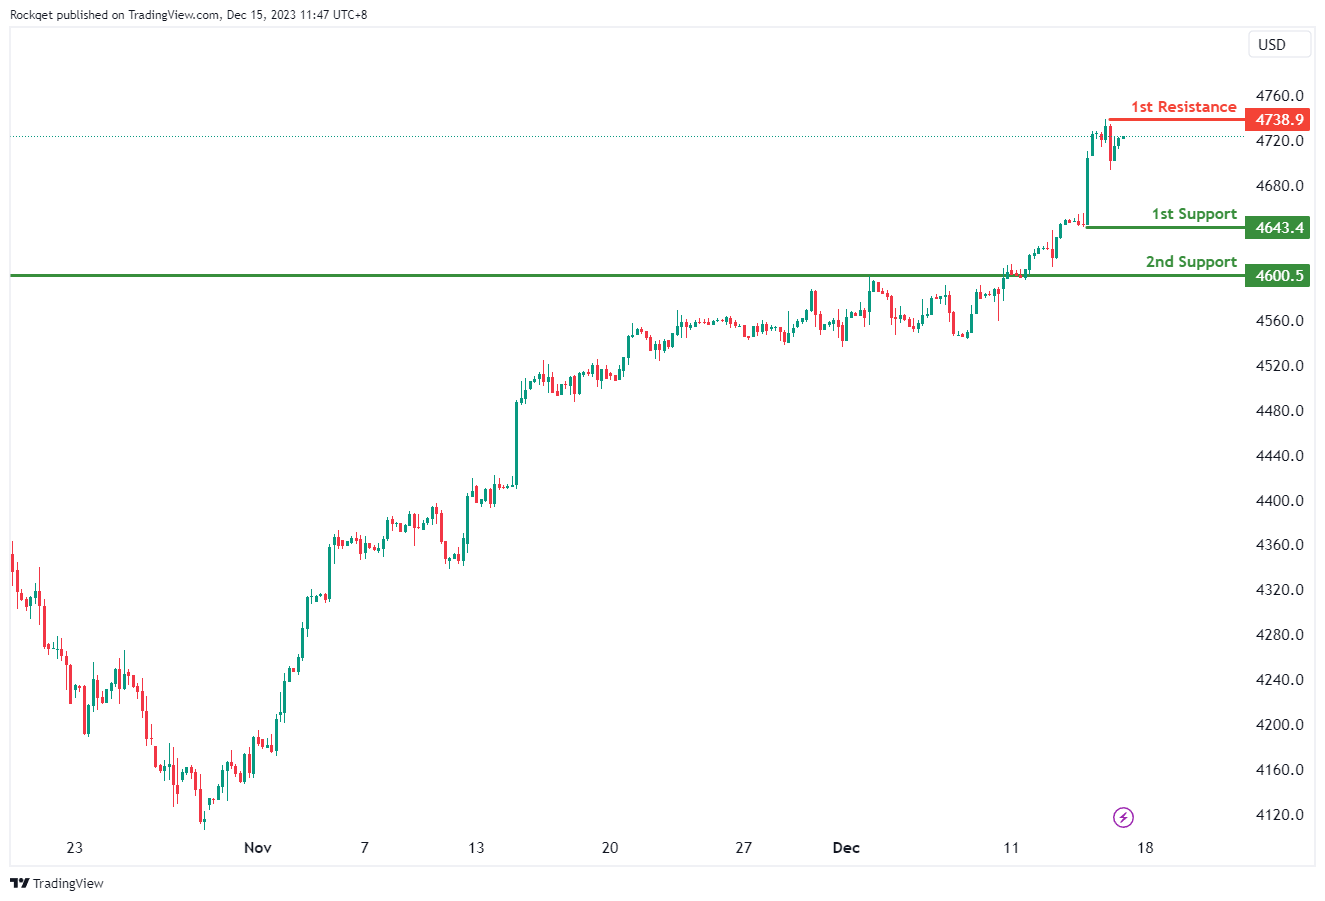
US500:
The chart’s overall momentum is currently bullish, suggesting a potential for a bullish continuation towards the 1st resistance.
The 1st support at 4643.4 is considered significant as it represents a pullback support. This level indicates a potential area where buying interest may emerge after a pullback, providing support for the price.
Similarly, the 2nd support at 4600.5 is identified as an overlap support. This adds an additional layer of significance to the support level, indicating a zone where historical price action aligns, and buyers may find significant interest, contributing to the potential for a bullish continuation.
On the resistance side, the 1st resistance at 4738.9 is associated with a swing high resistance. This level may act as a barrier where selling interest could intensify, potentially causing a temporary pause or reversal in the bullish trend.
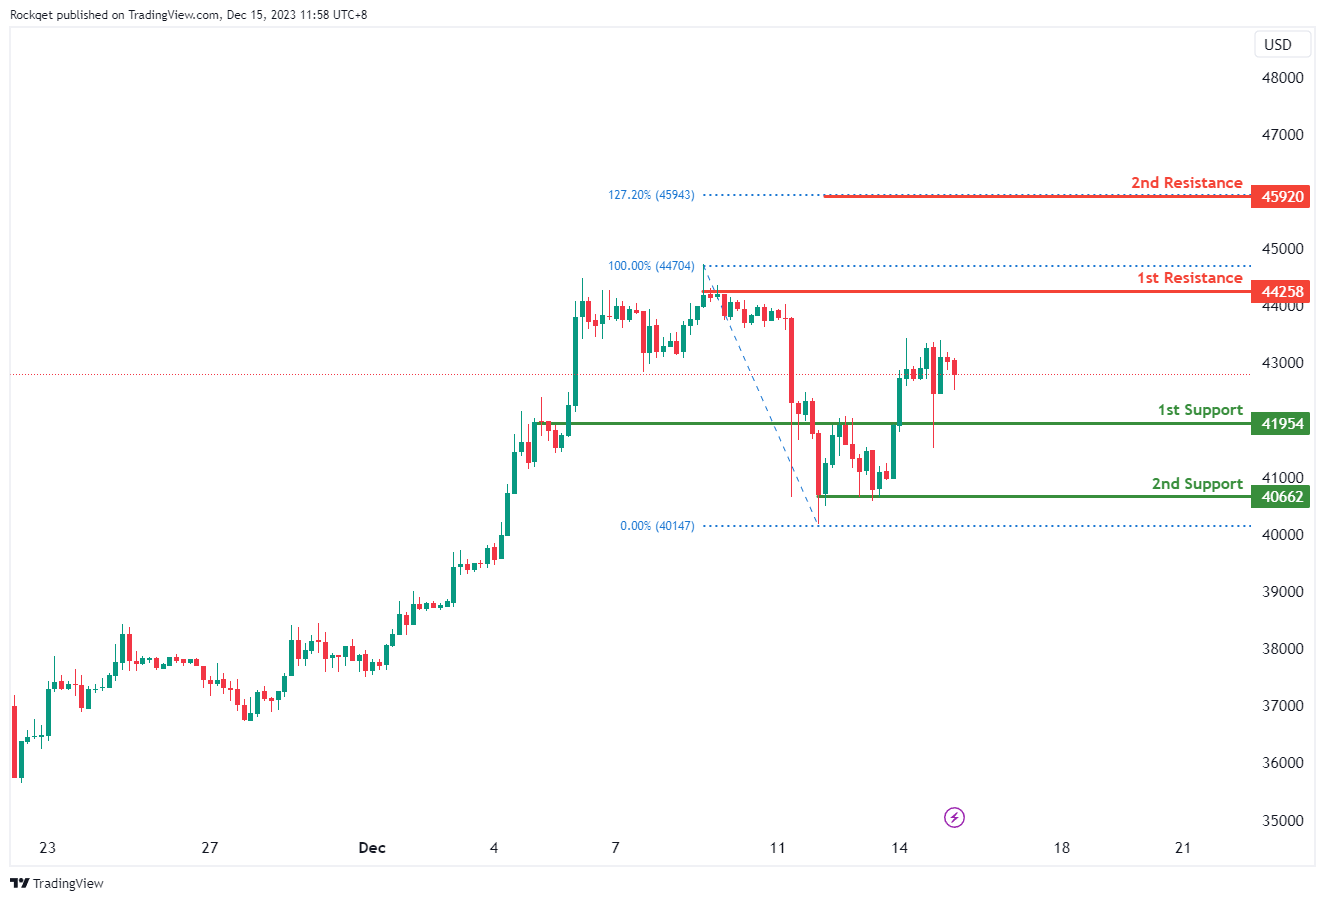
BTC/USD:
The BTC/USD overall momentum of the chart is currently described as weak bearish with low confidence, suggesting a potential for a bearish continuation towards the 1st support.
The 1st support at 41954 is considered significant for several reasons. Firstly, it is identified as an overlap support, suggesting a convergence of historical price points and reinforcing its potential as a crucial area where buying interest may emerge. Additionally, this support level aligns with an overlap, further enhancing its importance as a potential reversal or bounce point.
Similarly, the 2nd support at 40662 is characterized as a multi-swing low support. This adds to the support structure, indicating another potential zone where buying interest may be present, further reinforcing the potential for a bearish continuation.
On the resistance side, the 1st resistance at 44258 is associated with both a pullback resistance and the 100% Fibonacci Retracement. This confluence adds significance to the resistance, suggesting a potential area where selling interest may intensify, potentially causing a temporary pause or reversal in the weak bearish trend.
Furthermore, the 2nd resistance at 44240 is linked to the 127.20% Fibonacci Extension. This adds another layer of significance to the resistance, indicating another potential area where selling pressure may increase, especially considering the alignment with the Fibonacci-based extension level.
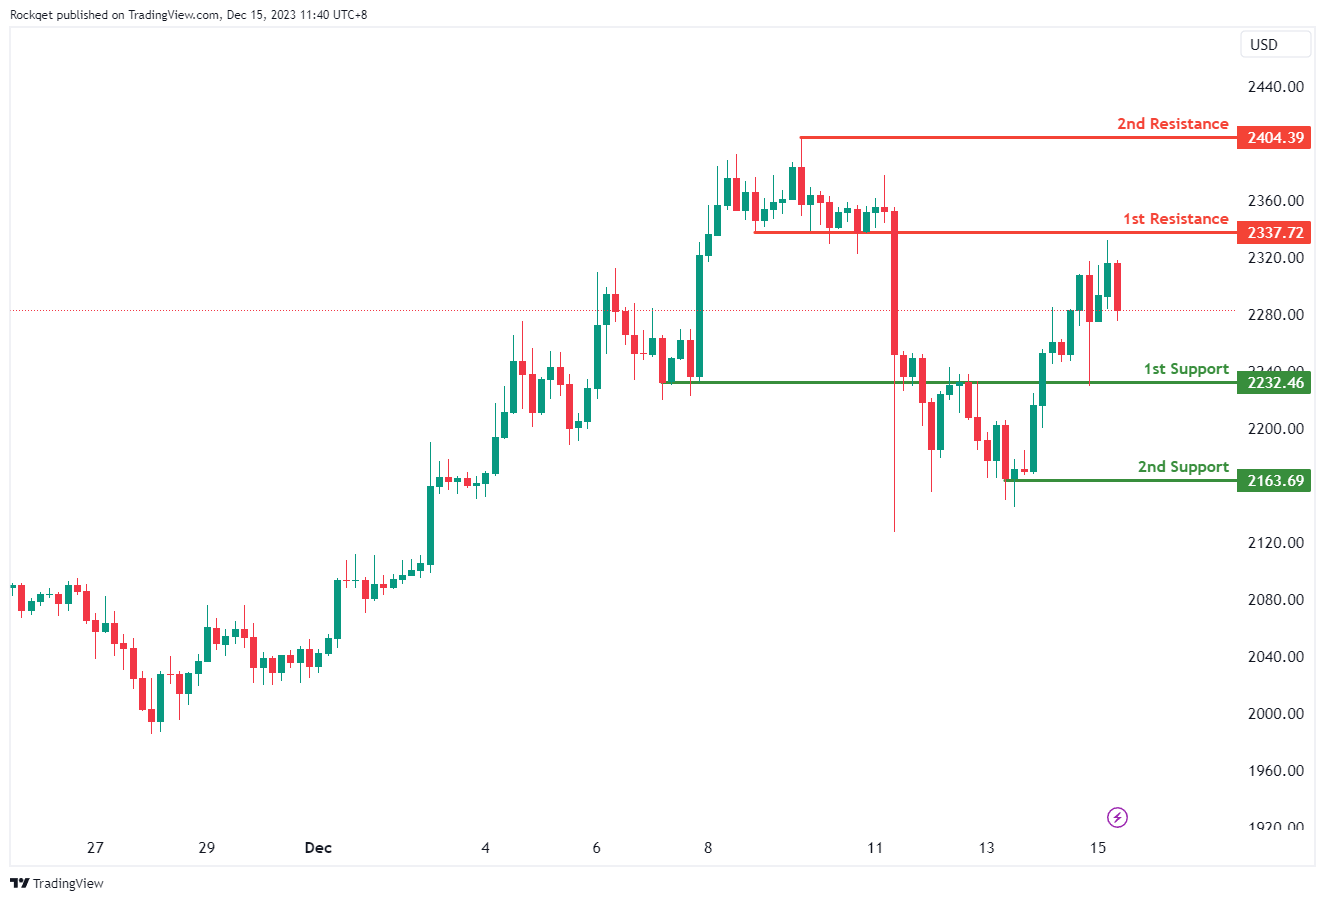
ETH/USD:
The ETH/USD chart currently displays a bullish overall momentum, suggesting a potential for a bullish continuation towards the 1st resistance.
The 1st support at 2232.46 is considered significant as it represents an overlap support. This level indicates a convergence of historical price points, reinforcing its potential as a crucial area where buying interest may emerge. The overlap support provides a strong foundation for a potential bounce or continuation of the bullish trend.
Similarly, the 2nd support at 2163.69 is identified as a pullback support. This level adds to the support structure, indicating another potential zone where buying interest may be present, further supporting the potential for a bullish continuation.
On the resistance side, the 1st resistance at 2337.72 is associated with a pullback resistance. This level may act as a barrier where selling interest could intensify, potentially causing a temporary pause or reversal in the bullish trend.
Furthermore, the 2nd resistance at 2404.39 is characterized as a swing high resistance. This level adds further significance to the resistance, suggesting a potential area where selling pressure may increase, especially considering its alignment with a previous swing high.
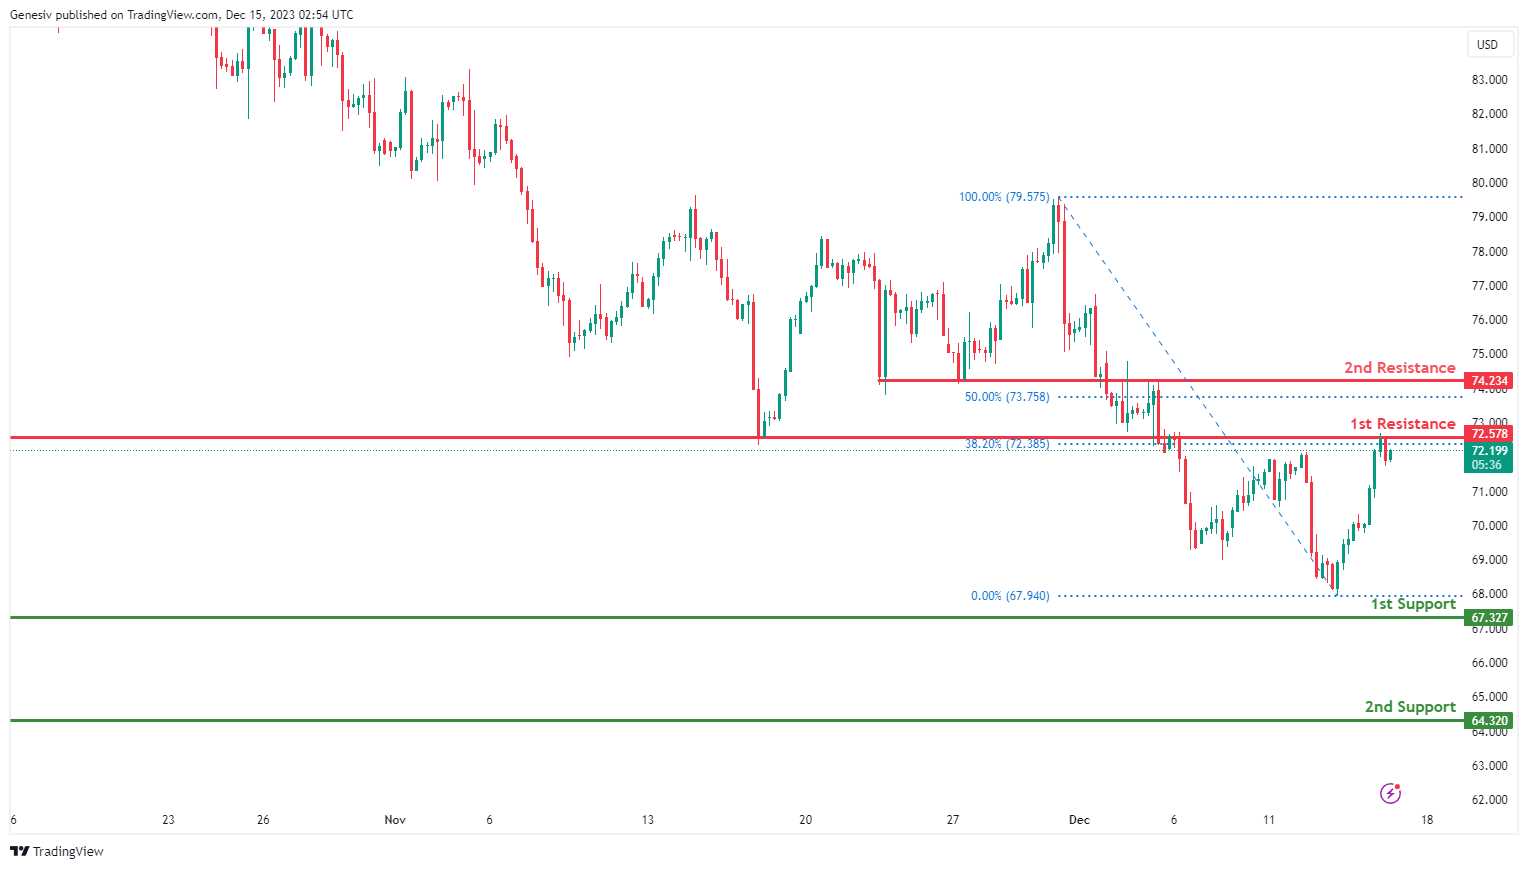
WTI/USD:
The WTI chart currently exhibits an overall bearish momentum, suggesting a prevailing downward trend. However, there is a potential for price to make a bullish movement towards the 1st resistance before resuming the downtrend and falling towards the 1st support.
The 1st resistance level at 72.57 is identified as an overlap resistance that aligns with the 38.20% Fibonacci retracement level. Higher up, the 2nd resistance level at 74.23 is also marked as an overlap resistance that aligns close to the 50.00% Fibonacci retracement level, further indicating its potential significance as a barrier for further upward movement.
To the downside, the 1st support level at 67.32 is identified as a pullback support. Further below, the 2nd support level at 64.32 is noted as multi-swing-low support, reinforcing its importance as a key support level.
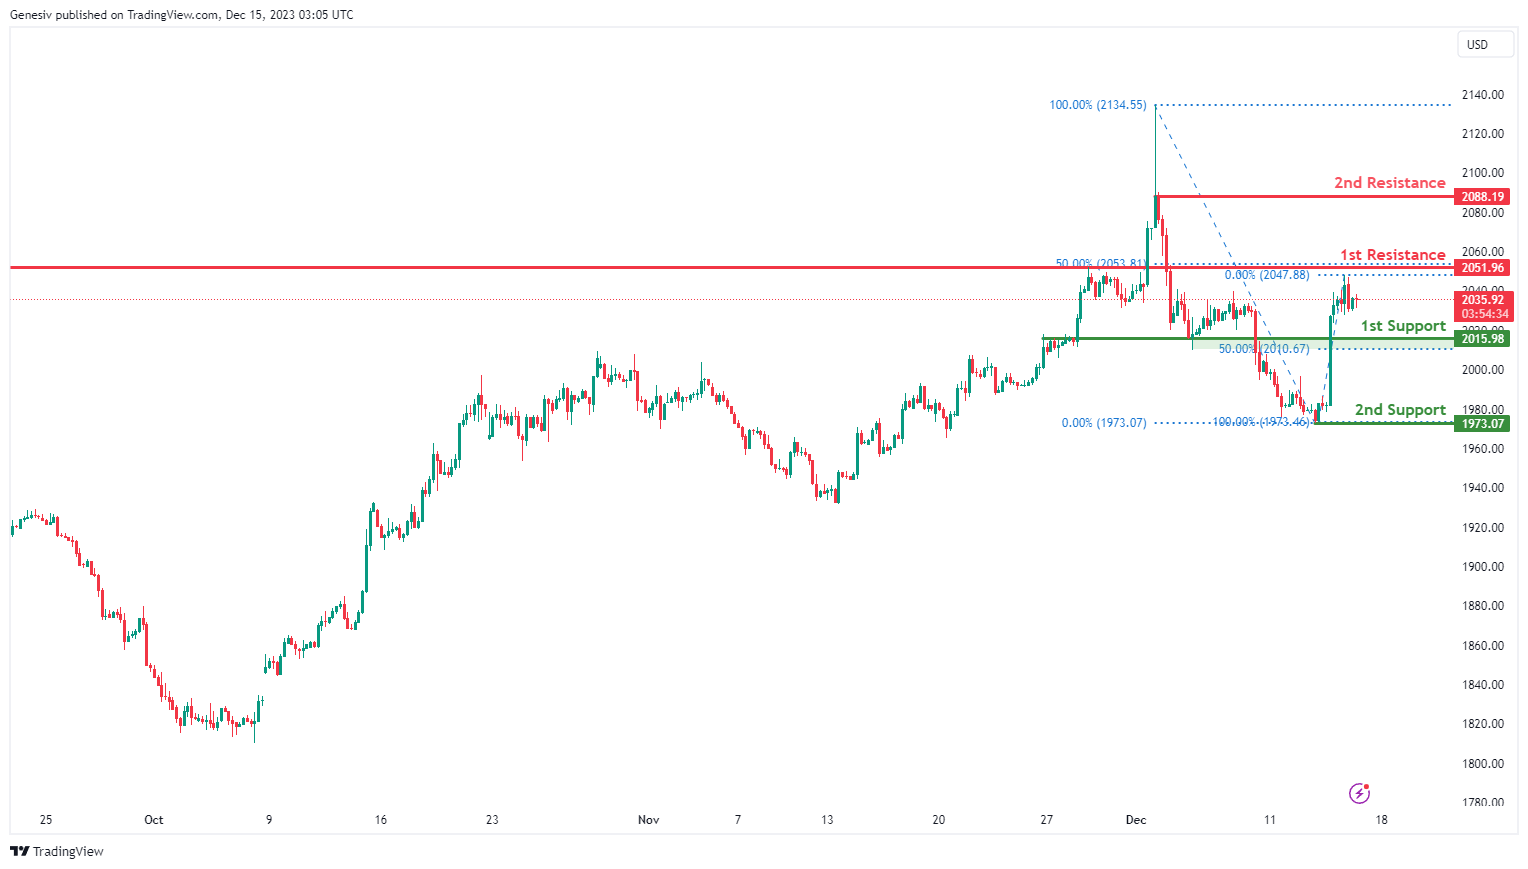
XAU/USD (GOLD):
The XAU/USD chart currently demonstrates a neutral momentum, indicating a potential for price to fluctuate between the 1st support and the 1st resistance.
The 1st support level at 2,015.98 is identified as an overlap support that aligns close to the 50.00% Fibonacci retracement level. Further below, the 2nd support level at 1,973.07 is noted as a swing-low support, reinforcing its importance as a key support level.
On the resistance side, the 1st resistance level at 2,051.96 is identified as a pullback resistance that aligns with the 50.00% Fibonacci retracement level. Higher up, the 2nd resistance level at 2,088.19 is marked as a swing-high resistance, further indicating its potential significance as a barrier for further upward movement.
China’s industrial output Surges, retail sales and investment miss expectations
China's economic data for November 2023 presented a mixed picture, with industrial output exceeding expectations while retail sales and fixed asset investment fell short.
Industrial output saw a significant increase of 6.6% yoy, surpassing the expected 5.6% yoy and marking the strongest expansion since February 2022.
However, retail sales, rose by 10.1% yoy, which was below the anticipated 12.5%. It's important to note that this increase was influenced by a low base effect from the previous year, when China's stringent coronavirus pandemic control measures significantly impacted consumer activities.
Fixed asset investment, a key driver of economic growth, increased by 2.9% ytd yoy, slightly missing the expected 3.0%.
National Bureau of Statistics of China commented on the overall economic situation, stating: "There are still a lot of external instabilities and uncertainties, and the domestic demand appears insufficient." The NBS emphasized the need to solidify the foundation of the economy's recovery.
Cliff Notes: An Abrupt Change in Expectations
Key insights from the week that was.
The latest edition of the Westpac-Melbourne Institute survey pointed to consumer sentiment remaining near its historic lows in December, the index rising just 2.7% to 82.1 compared to a long-run average of 100.8. The probability of further rate hikes may be dwindling, but consumers find themselves under considerable financial pressure as a result of the tightening experienced to date; the cumulative hit to real incomes from inflation; and a rising tax take, the latter principally a consequence of bracket creep and a topic discussed in depth by Westpac Chief Economist Luci Ellis. From the survey, the persistence of these factors is as significant as their scale: 2023 being the second weakest year ever for consumer sentiment overall; and assessments of family finances versus a year ago and for the year ahead respectively 23% and 15% below average.
The consequence for spending of this entrenched weakness is not only apparent in our consumer sentiment survey, but also the spending data. Last week’s Q3 GDP report estimated that real consumption was essentially flat over the six months to September and down around 2% over the year on a per capita basis. Available data for the current quarter is also poor, Westpac’s Card Tracker reporting a 5.9pt fall over the fortnight to December 9, unwinding the prior boost from Black Friday and taking the index back to its lowest reading since July 2022.
Challenges for the financial position of households were also on display in the November labour force survey, which showed a well above trend gain for employment of 61.5k but also a further lift in the unemployment rate from 3.8% to 3.9%, the mix made possible by a further rise in the participation rate to a new record high. While the cost of living squeeze appears to be encouraging those outside the labour force to join and those already engaged to remain, weak end-demand is starting to see businesses reduce hours worked by individual staff. The pattern would be consistent with workers seeking additional hours having to look for a second position rather than taking up overtime offers from their primary employer.
The improving availability of labour argues for limited upside risks to wages growth and the totality of the report points to upside risks for unemployment should the economy disappoint through 2024 and 2025. Our baseline expectation remains a gradual lift in the unemployment rate to 4.7% at end-2025 as population growth outpaces job gains. In assessing the risks for employment, it is important to closely assess the evolution of business conditions and confidence. While the NAB survey again reported robust conditions in late-November, business confidence fell to its third weakest reading for the monthly series back to 1997, outside the GFC and the 2020 covid outbreak. Highlighting businesses’ growing concern over the outlook, the capital expenditure index from the survey has fallen 8pts over the past four months to +4, the lowest reading since the delta outbreak.
The benefit of record employment was on display this week in the Government’s Mid-Year Economic Update (PDF 269KB), with a $66bn upgrade to expected receipts over the four years to 2026-27 and a consequent $40bn benefit to the Budget’s bottom line. The Government’s expectations for the labour market are relatively similar to our own, but the combination of population growth; bracket creep; and commodity price outperformance points to additional upside for receipts.
Over in New Zealand, two data releases indicated the economy is in a much weaker state than previously estimated. GDP not only contracted 0.3% in the September quarter, but heavy downward revisions to prior quarters left the annual rate at -0.6%yr and the level of GDP 1.8% lower than the RBNZ estimated for the November Monetary Policy Statement. Given population growth of 2.7%yr, per capita GDP has declined more than 3% over the 12 months to September – a very weak result. Statistics NZ’s update on consumer price movements in November was also softer than anticipated and resulted in our NZ economics team lowering their Q4 CPI forecast from 0.6% to 0.3%, a long way off the RBNZ’s forecast of 0.8%. If our team is correct, annual inflation will be 4.5%yr at December. There remains a degree of uncertainty about the persistence of disinflation. And so, with inflation still a long way from target, a need for careful monitoring of inflation dynamics.
Further afield, the FOMC’s December meeting was the highlight for market participants. The communications did not disappoint, with the Committee responding to success with inflation and balance in the labour market by not only removing the additional hike forecast at September for 2023, but also adding a cut to their 2024 view – 75bps of cuts are now projected by the Committee for 2024 to 4.6% followed by 100bps to 3.6% in 2025 and another 75bps to 2.9% in 2026. To end-2025, the revised FOMC view is broadly in line with our established view of 100bps of cuts in both 2024 and 2025 to 3.375% at end-2025.
During the post-meeting press conference, Chair Powell was balanced in his assessment of the risks noting that, despite the revisions to their forecasts, the Committee is willing to tighten policy further if appropriate (i.e. demand and inflation surprise materially to the upside). However, he also recognised the risk of recession with the full effects of monetary tightening still to be felt. Late in the press conference, he also cited a belief that the Committee needed to be “reducing restriction well before [inflation reaches] 2%”. Contrasting our own forecasts for the US economy as set out in the December/January edition of Market Outlook, we see downside risks to the FOMC’s activity views, forecasting two years of modestly below-trend growth in 2024 and 2025 and a lift in the unemployment rate to 4.7%. But we also expect inflation to surprise to the upside from H2 2024, with a 2.5% annualised pace anticipated on average to end-2025. This anticipated imbalance between growth and inflation is a consequence of enduring capacity constraints in the housing sector and the limited breadth of the business investment upswing.
The European Central Bank (ECB) and Bank of England (BoE) delivered their December decisions a day after the FOMC. Both sets of communications highlighted lingering inflation risks despite recognising success-to-date in bringing inflation towards their medium-term 2.0%yr target and with the activity outlook clouded. Given the rhetoric and assuming their forecasts prove accurate, both the ECB and BoE are set to follow the FOMC into rate cuts with a lag. This is part of the reason why we project a sustained uptrend in Euro and, to a lesser extent, Sterling over both 2024 and 2025. It is worth noting that both currencies have already jumped ahead to trade at levels we did not expect until mid-2024. There is therefore room for volatility around a steady uptrend. Full detail of our FX and interest rate forecasts can be found in Market Outlook.
Cliff Notes will return in mid-January 2024. We’d like to wish all our readers a Merry Christmas and happy new year.
USD/JPY Accelerates Lower As Dollar Takes Hit Post Fed Decision
Key Highlights
- USD/JPY extended losses below the 142.50 support.
- A crucial bearish trend line is forming with resistance at 145.20 on the 4-hour chart.
- EUR/USD and GBP/USD surged after the Fed’s dovish stance.
- The US Manufacturing PMI could decline from 49.4 to 49.3 in Dec 2023 (Preliminary).
USD/JPY Technical Analysis
The US Dollar remained in a bearish zone below the 145.00 level against the Japanese Yen. The Fed’s dovish outlook and possible rate cuts in 2024 sparked bearish moves in USD/JPY.
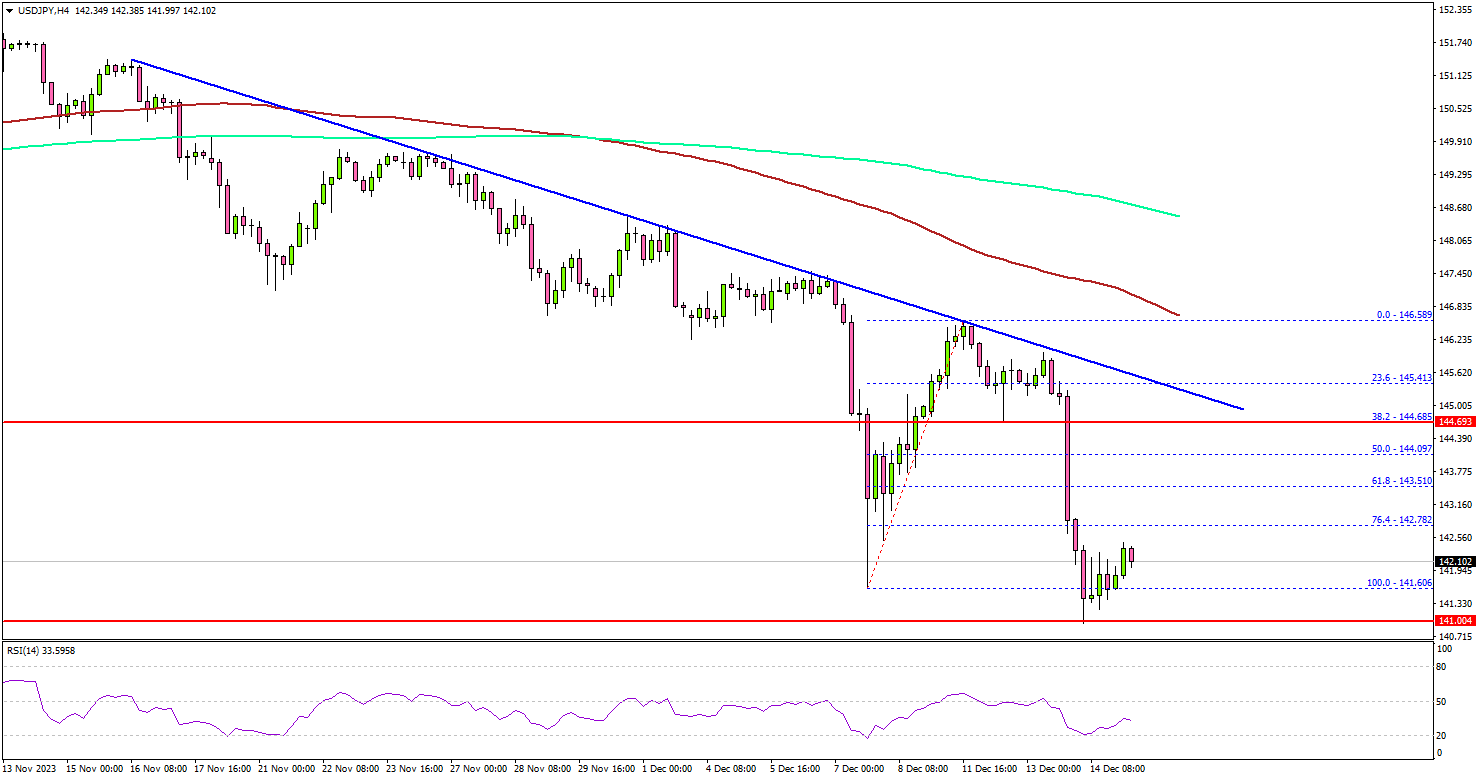
Looking at the 4-hour chart, the pair gained bearish momentum below the 143.50 support zone. It even settled below the 143.00 level, the 100 simple moving average (red, 4 hours), and the 200 simple moving average (green, 4 hours).
The pair accelerated lower below the 142.80 support zone. It seems like the bears are aiming for a move toward the 140.00 support zone.
The next major support is 138.80, below which the bears might aim for 136.20. On the upside, immediate resistance is near the 142.80 level. The next key resistance is near the 143.50 level.
The main resistance is near 145.00. There is also a crucial bearish trend line forming with resistance at 145.20 on the same chart. A close above the 145.00 zone could open the doors for more upsides. The next stop for the bulls might be 147.40.
Looking at EUR/USD, the pair found support and started a major upward move above the 1.0920 resistance zone.
Economic Releases
- Euro Zone Manufacturing PMI for Dec 2023 (Preliminary) – Forecast 44.6, versus 44.2 previous.
- Euro Zone Services PMI for Dec 2023 (Preliminary) – Forecast 49.0, versus 48.7 previous.
- UK Manufacturing PMI for Dec 2023 (Preliminary) – Forecast 47.5, versus 47.2 previous.
- UK Services PMI for Dec 2023 (Preliminary) – Forecast 51.0, versus 50.9 previous.
- US Manufacturing PMI for Dec 2023 (Preliminary) – Forecast 49.3, versus 49.4 previous.
- US Services PMI for Dec 2023 (Preliminary) – Forecast 50.6, versus 50.8 previous.