Sample Category Title
EUR/USD Daily Outlook
Daily Pivots: (S1) 1.0760; (P) 1.0794; (R1) 1.0829; More...
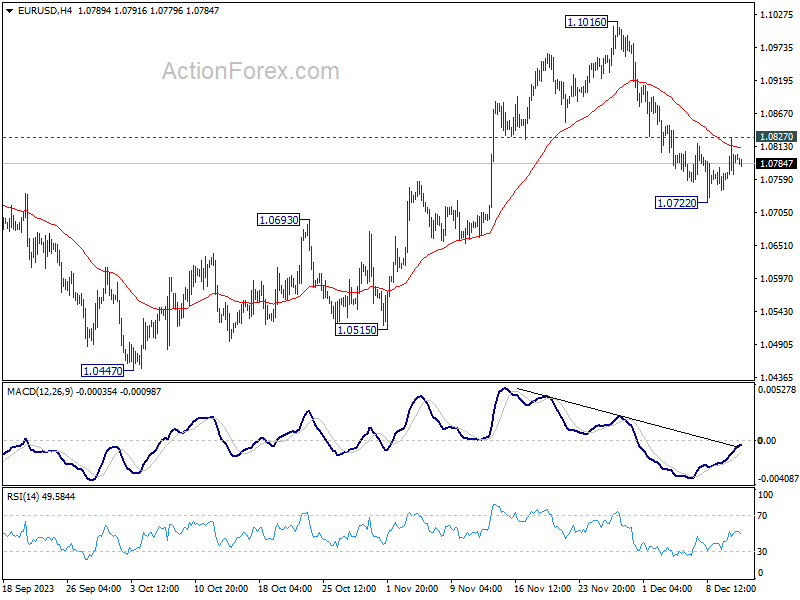
Intraday bias in EUR/USD stays neutral and further decline is mildly in favor as long as 1.0827 minor resistance holds. Break of 1.0722, and sustained trading below 55 D EMA (now at 1.0770) will extend the fall from 1.1016 short term top to retest 1.0447 support. However, on the upside, firm break of 1.0827 minor resistance will turn intraday bias back to the upside for stronger rebound.
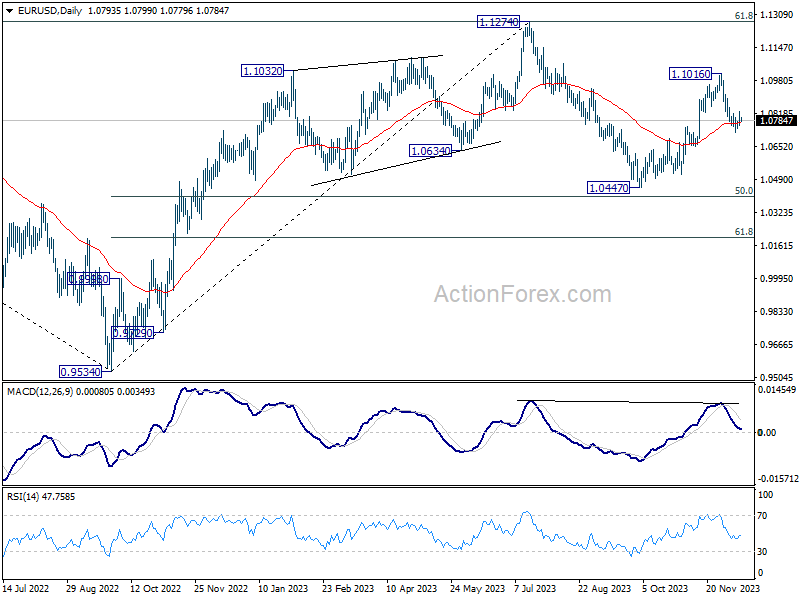
In the bigger picture, price actions from 1.1274 are viewed as a corrective pattern to rise from 0.9534 (2022 low). Rise from 1.0447 is seen as the second leg. While further rally could cannot be ruled out, upside should be limited by 1.1274 to bring the third leg of the pattern. Meanwhile, sustained break of 55 D EMA will argue that the third leg has already started for 1.0447 and below.
GBP/USD Daily Outlook
Daily Pivots: (S1) 1.2512; (P) 1.2564; (R1) 1.2614; More...
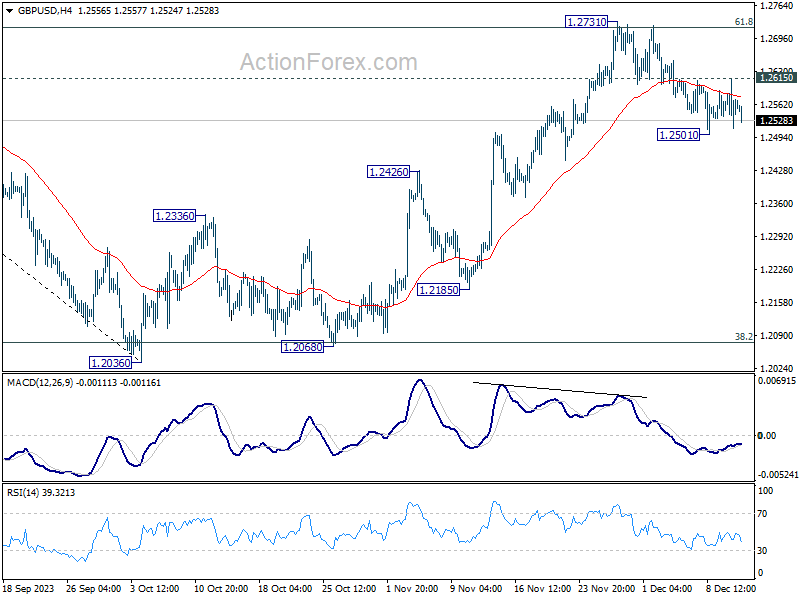
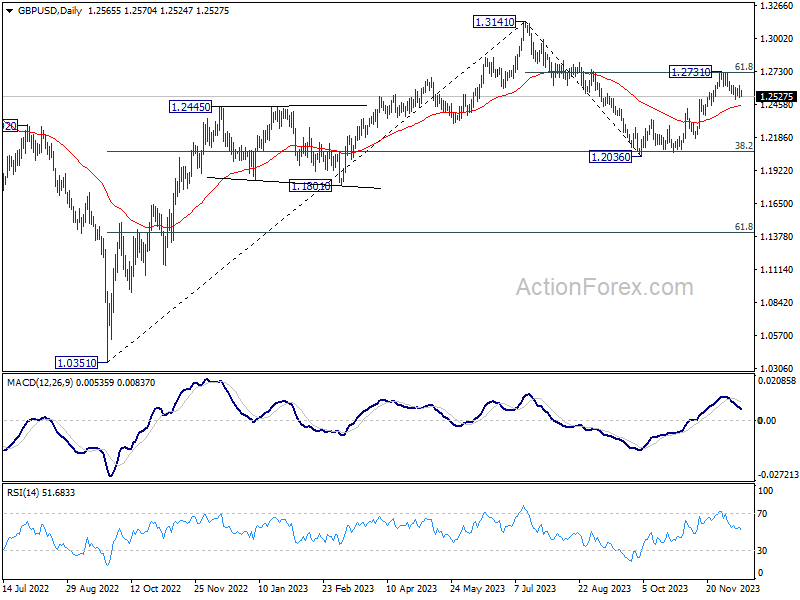
Intraday bias in GBP/USD stays neutral at this point. Further decline is mildly in favor as long as 1.2615 minor resistance holds. Break of 1.2501 will resume the fall from 1.2731 short term top to to 55 D EMA (now at 1.2452). Sustained break there will bring retest of 1.2036 low. However, firm break of 1.2615 will turn bias back to the upside for retesting 1.2731 resistance.
In the bigger picture, price actions from 1.3141 medium term top are seen as a corrective pattern to rise from 1.0351 (2022 low). Rise from 1.2036 is seen as the second leg, that could still extend through 1.2731. But upside should be limited by 1.3141 o bring the third leg of the pattern. Meanwhile, sustained trading below 55 EMA will argue that the third leg has already started for 38.2% retracement of 1.0351 (2022 low) to 1.3141 at 1.2075 again, and possibly below.
USD/CHF Daily Outlook
Daily Pivots: (S1) 0.8720; (P) 0.8757; (R1) 0.8789; More....
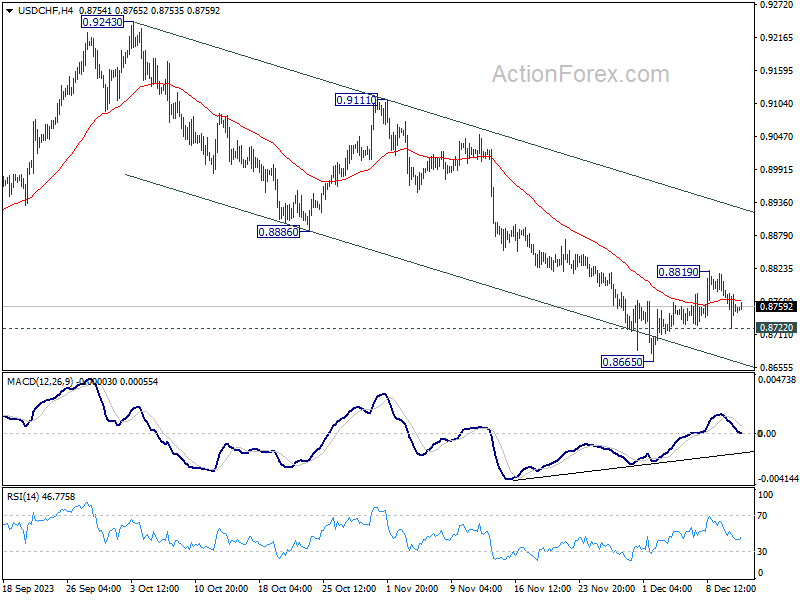
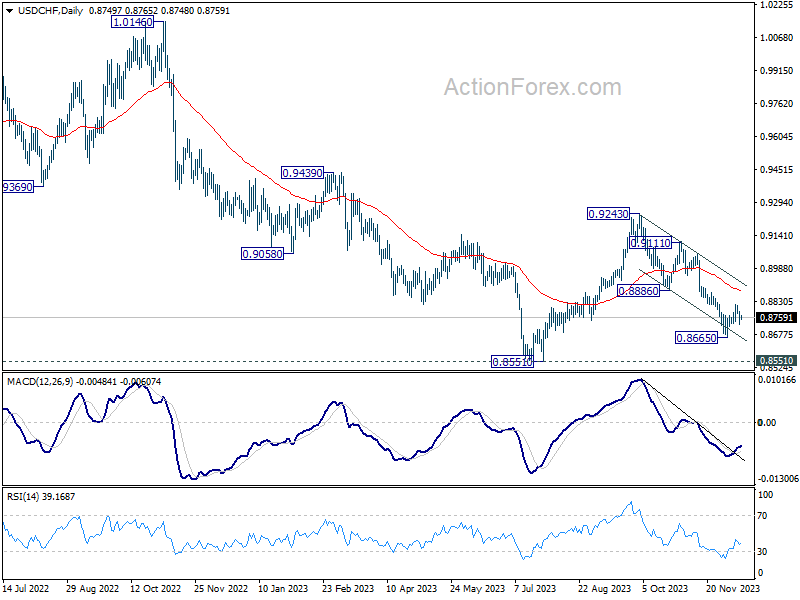
Intraday bias in USD/CHF remains neutral for the moment. Further rise remains in favor with 0.8722 minor support intact. Above 0.8819 will resume the rebound from 0.8665 short term bottom to 0.8886 support turned resistance first. However, firm break of 0.8722 will retain near term bearishness, and turn bias back to the downside to resume the fall from 0.9243 through 0.8665.
In the bigger picture, price actions from 0.8551 are currently seen as part of a corrective pattern to the decline from 1.0146 (2022 high). Fall from 0.9243 is seen as the second leg for now. Deeper decline could be seen to 0.8551 low but strong support should be seen there to bring rebound. Meanwhile, break of 0.9111 resistance will argue that the third leg has started already, and target 0.9243 and above.
USD/JPY Daily Outlook
Daily Pivots: (S1) 144.74; (P) 145.47; (R1) 146.19; More...
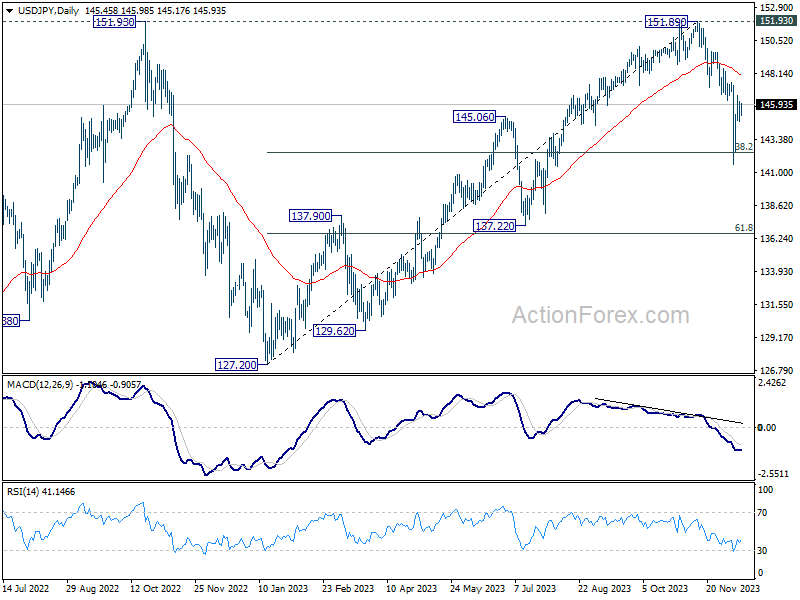
Intraday bias in USD/JPY remains neutral at this point. Outlook also stays bearish with 147.14 support turned resistance holds. On the downside, 144.72 minor support will suggest that rebound from 141.59 has completed at 146.58. Intraday bias will then be back on the downside for retesting 141.59 low. However, decisive break of 147.14 will dampen the bearish view, and bring stronger rally back towards 149.56/151.89 resistance zone.
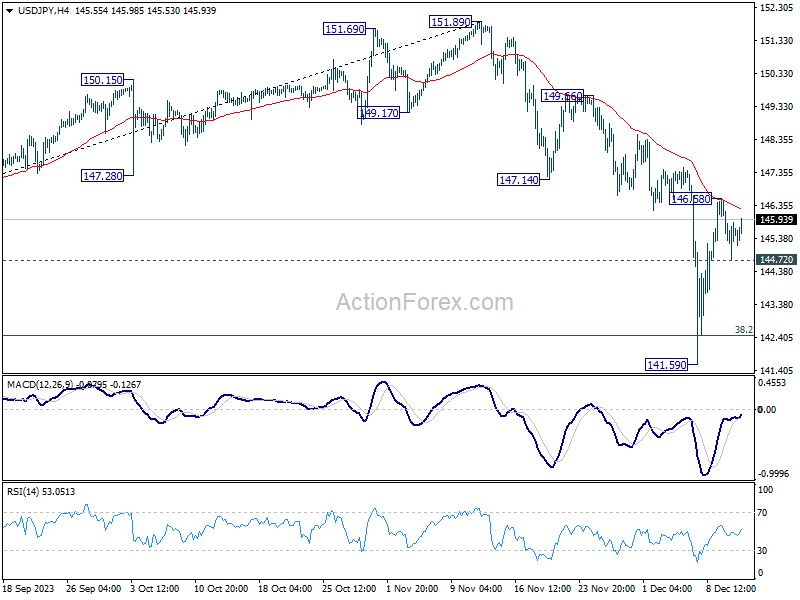
In the bigger picture, current fall from 151.89 is seen as the third leg of the corrective pattern from 151.93 (2022 high). Deeper decline would be seen through 38.2% retracement of 127.20 to 151.89 at 142.45 to 61.8% retracement at 136.63. This will now remain the favored as long as 147.14 support turned resistance holds.
AUD/USD Daily Report
Daily Pivots: (S1) 0.6529; (P) 0.6571; (R1) 0.6601; More...
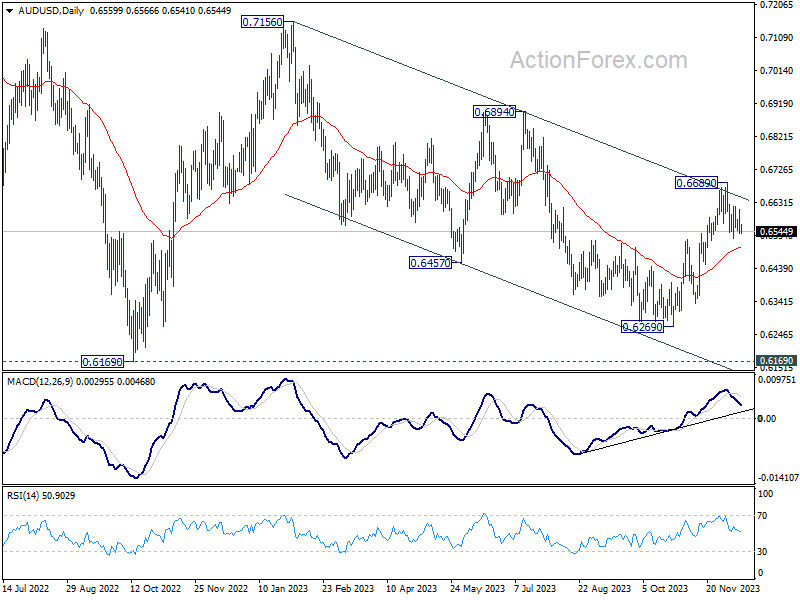
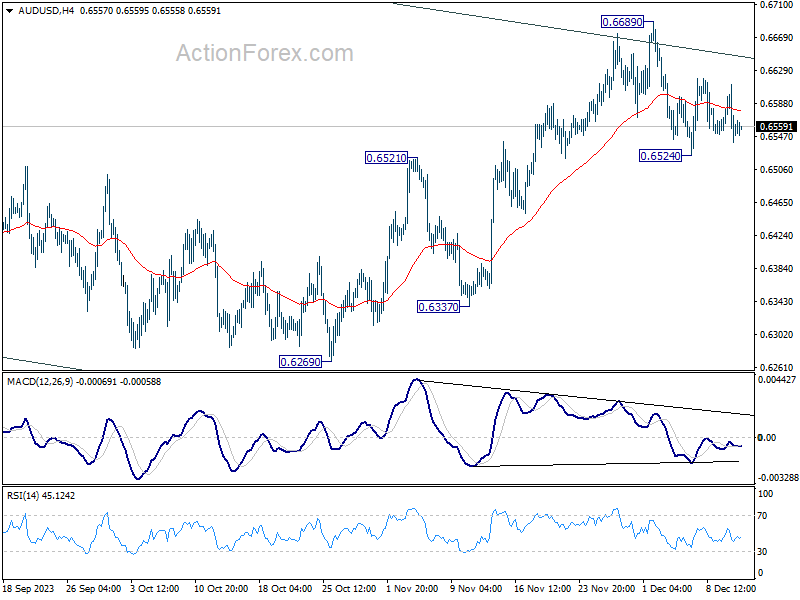
Range trading continues in AUD/USD and intraday bias remains neutral for the moment. Risk stays mildly on the downside at this point. Break of 0.6524 will affirm the case of rejection by channel resistance, and resume the fall from 0.6689 short term top to 55 D EMA (now at 0.6500) and below. Nevertheless, firm break of 0.6689 will resume the rise from 0.6269 instead.
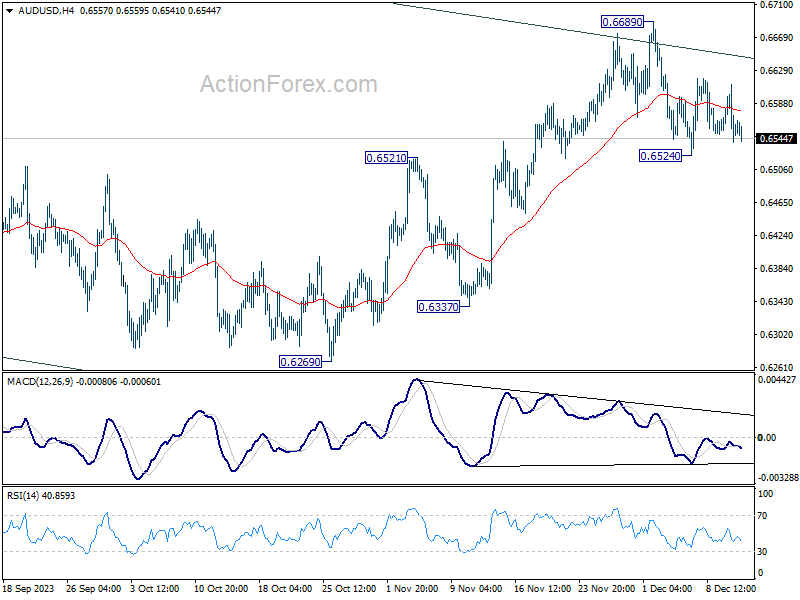
In the bigger picture, there is no confirmation that down trend from 0.8006 (2021 high) has completed. Price actions from 0.6169 (2022 low) could be just a medium term corrective pattern, with fall from 0.7156 as the second leg. For now, range trading should be seen between 0.6169 and 0.7156 (2023 high), until further developments.
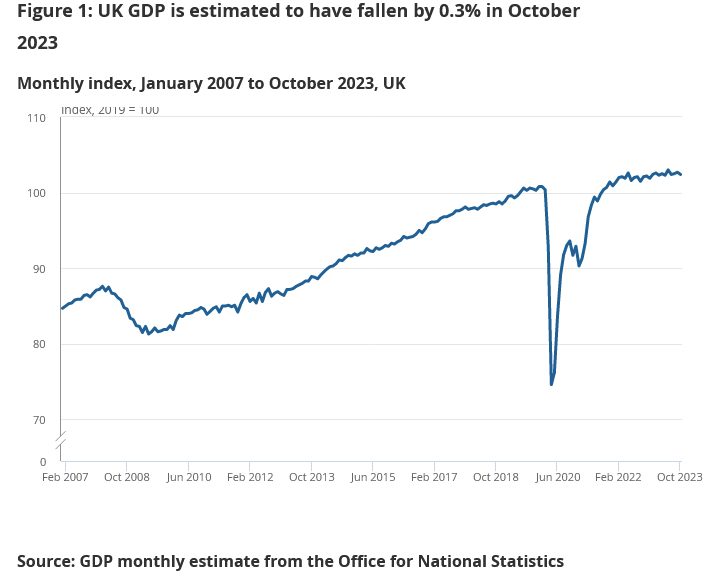
UK GDP shrinks -0.3% mom in Oct, all sectors contract
UK's GDP contracted by -0.3% mom in October, a figure that is notably worse than the expected -0.1% mom. The primary factor contributing to this downturn was the decline in services output, which fell by -0.2% mom. Additionally, production output experienced a sharper drop of -0.8% mom, and construction output also saw a contraction of -0.5% mom.
When examining the three-month period leading up to October, UK's real GDP showed no growth compared with the three months leading to July. During this quarter, while services output saw a marginal growth of 0.1%, both production and construction outputs declined, falling by -0.7% and -0.3%, respectively.
Sweet and Sour
US headline inflation fell to 3.1% as expected, thanks to an almost 9% fall in gasoline prices since last year, although shelter inflation – which is where everyone sees the biggest potential for easing - remained sticky yet another month. Core inflation eased to 4% on a yearly basis, BUT headline inflation was slightly higher-than-expected on a monthly basis. And that small uptick has raised suspicions that the Federal Reserve's (Fed) final stretch in combating inflation may be more challenging than anticipated.
The latter triggered a mini selloff in the 2-year bond right after the data, yet the selloff didn’t last long. The US 2-year yield is about where it was yesterday morning. Crude oil fell to $68pb even though the US oil inventories fell 2.3 mio barrels according to the API.
With the latest inflation report behind us with minimal fanfare, the Fed officials will lightheartedly keep interest rates steady this month. Economic forecasts and the dot plot will play a crucial role in providing insight into the perspectives of Federal Reserve officials regarding expectations for rate cuts.
According to activity on Fed funds futures, the Fed should gently start cutting the rates by May; that possibility is given around 75% probability, slightly less than 80% before yesterday’s CPI print, while the probability of a March hike fell to around 44% from nearly 50% on that mini spike in monthly headline inflation. In summary, rate cut bets are being placed for a rate cut in March or May 2024. May the best win.
Today, we will probably face a satisfied, calm but cautious Powell, who will say that the Fed has done a great job fighting inflation, but that the rates will remain restrictive as long as needed. One dovish tweak could be deleting ‘additional policy firming’ from the post-meeting communication.
In the best-case scenario, the doves will make a mountain out of the smallest dovish details that could justify a further fall in yields. The US dollar will likely remain under pressure below the 104.30 level, the major 38.2% Fibonacci resistance that should keep the US dollar index in the bearish consolidation zone. We could see the US 10-year retreat and even – shortly – test the 4% mark to the downside, and the 2-year yield – which captures the Fed expectations – to remain between 4.50/4.70 zone. Lower than that becomes unreasonably overstretched.
In a more down-to-earth scenario, Powell will contain market optimism and rectify the rate cut bets. If so, we should see correction and consolidation in bond and stock valuations during the final weeks of the year.
USD/CAD Daily Outlook
Daily Pivots: (S1) 1.3551; (P) 1.3585; (R1) 1.3625; More...
Intraday bias in USD/CAD remains neutral at this point as range trading continues. On the upside, firm break of 1.3265 minor resistance will confirm short term bottoming at 1.3479. More importantly, whole correction from 1.3897 could have completed too. Intraday bias will be back on the upside for strong rally back to 1.3853/3897 resistance zone. However, break of 1.3544 minor support will turned bias back to the downside for 1.3479 and below, to resume the decline from 1.3897.
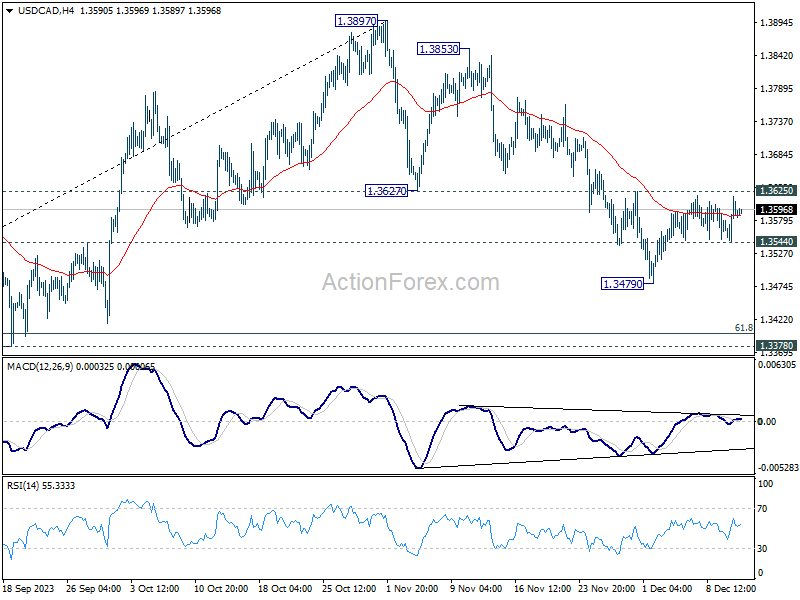
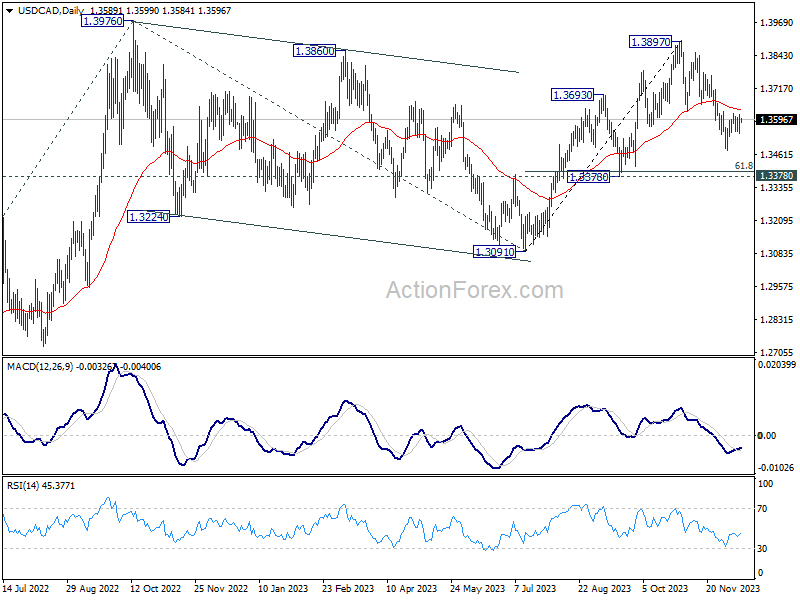
In the bigger picture, rise from 1.3091 is seen as the fifth leg of the whole rise from 1.2005 (2021 low). Further rally is expected as long as 1.3378 support holds, to 61.8% projection of 1.2401 to 1.3976 from 1.3091 at 1.4064. However, decisive break of 1.3378 will dampen this view and bring deeper fall back to 1.3091 instead.
Dollar in Wait-and-See Mode, Awaiting Federal Reserve’s Policy Cue
As the markets eagerly await FOMC rate decision and the release of new economic projections, Dollar is currently holding steady within a narrow range. The spotlight is particularly on the revised dot plot, as it is expected to provide crucial insights into the pace of monetary policy easing by Fed in the coming year. Investors are keenly looking for any signs of dovish policy shifts that could trigger risk-on sentiment, dragging down treasury yields and the greenback.
In the European trading session, the focus shifts momentarily to UK's GDP data, which is crucial for understanding the trajectory of the UK economy. This data will offer insights into whether the UK economy is cooling sufficiently to bring inflation down, possibly negating the need for additional policy interventions by BoE. Concurrently, European majors are range bound against each other. Their next moves hinge on the outcomes of today's UK data and probably even more on the upcoming central bank meetings of SNB, BoE, and ECB tomorrow.
In other currency market developments, commodity currencies, along with Yen, are showing weakness. Australian and New Zealand Dollar traders faced some disappointment following China's Central Economic Work Conference, which refrained from announcing substantial stimulus programs, opting instead for policy adjustments focused on "stabilizing expectations, stabilizing growth, and stabilizing employment." Canadian Dollar is also under pressure due to a renewed decline in oil prices.
From a technical analysis standpoint, the performance of commodity currencies relative to the Dollar warrants attention today, especially since movements in European majors might be constrained ahead of the central bank announcements tomorrow. In particular, a break below the 0.6524 minor support in AUD/USD and above 1.3625 minor resistance in USD/CAD would indicate that Dollar is regaining momentum and for extending its near-term rebound.
In Asia, Nikkei rose 0.25%. Hong Kong HSI is down -0.87%. China Shanghai SSE is down -0.83%. Singapore Strait Times is down -0.01%. Japan 10-year JGB yield is down -0.0474 at -0.691, back below 0.7 handle. Overnight, DOW Rose 0.48%. S&P 500 rose 0.46%. NASDAQ rose 0.70%. 10-year yield fell -0.033 to 4.206.
Record highs on the horizon for DOW as market awaits FOMC dot plot
US stock market closed generally higher overnight. In particular, DOW now stands just about 1% shy of its all-time high after recent rally. The current uptrend in major indexes is primarily fueled by an increasing speculation among investors that Fed would start cutting interest rates. Today's FOMC statement and the accompanying "dot plot" are eagerly awaited, as any signs of a dovish stance or indications of policy easing could further fuel the market's ascent, potentially catapulting the DOW to new record heights before year-end.
Expectations are leaning overwhelmingly towards Fed maintaining federal funds rate at the 5.25-5.50% range at today's meeting. Should Fed decide to keep rates unchanged, it would mark the third successive meeting without a rate hike. Such a decision could be interpreted as a signal that the Fed views its cycle of rate hikes as effectively complete. This sentiment is likely to be mirrored in the revised dot plot, which is anticipated to exclude the rate increase previously suggested for this year. There remains, however, a much less probable scenario where the median dots may indicate a postponed hike.
Traders are aggressively pricing in the prospect of Fed beginning its rate-cutting cycle as early as May, with the odds exceeding 50%, as indicated by fed funds futures. Moreover, there's a similar probability assigned to the expectation of a cumulative one percent rate cut by the end of 2024. It's important to note, however, that market predictions often tend to be rather unreliable for periods extending beyond one or two months.
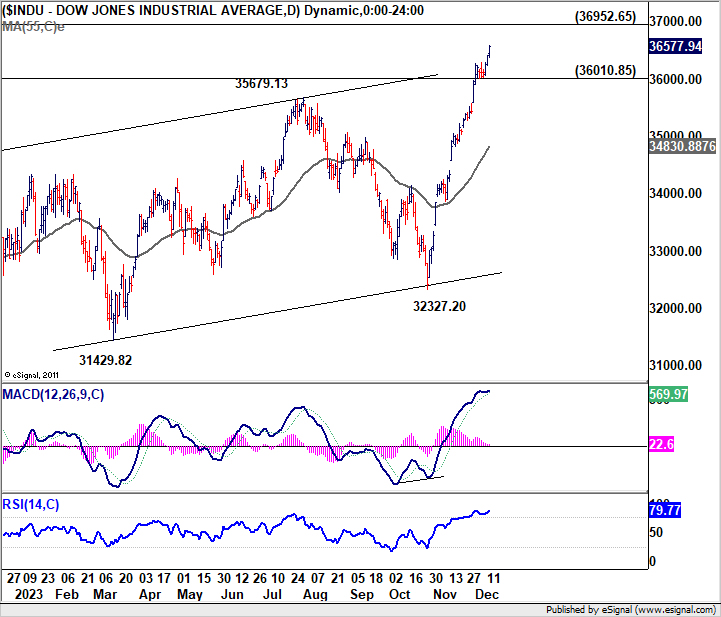
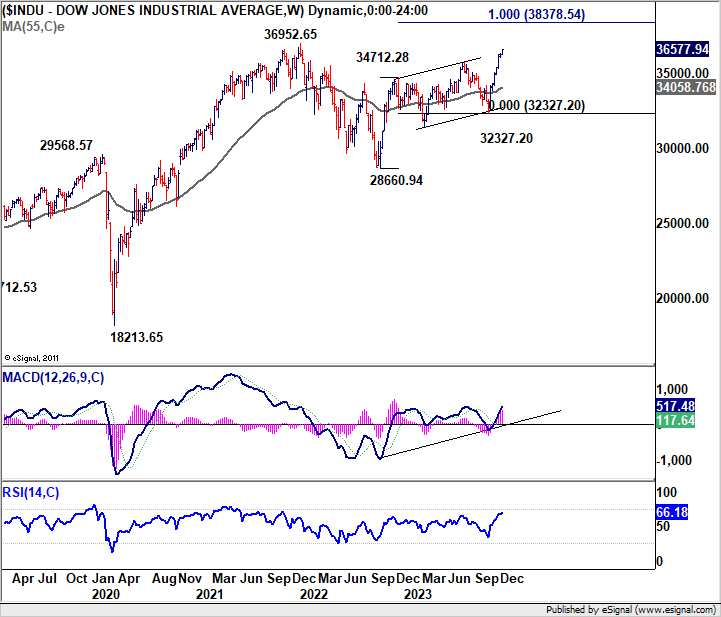
As for DOW, near term outlook will stay bullish as long as 36010.85 support holds. Next target is 36952.65 record high. Clearing of this record high would pave the way to 100% projection of 28660.94 to 34712.28 from 32327.20 at 38378.54.
Japan's Tankan manufacturing index rose to 12, highest in nearly 2 years
Japan's Tankan survey for Q4 show signs of strength in both manufacturing and non-manufacturing sectors. Yet, the cautious outlook among manufacturers suggests uncertainty about future economic conditions.
Large Manufacturing Index rose from 9 to 12, surpassing the expected figure of 10. This increase marks the third consecutive quarter of improvement and the highest level since Q1 2022. The Non-Manufacturing Index also showed positive development, rising from 27 to 30, exceeding the forecast of 27. This improvement represents the seventh consecutive quarter of growth, reaching its highest point since 1991.
However, the outlook for the next three months tells a different story. Large Manufacturing Outlook Index fell from 10 to 8, falling short of the expected 9, indicating less optimism among manufacturers for the near future. In contrast, Non-Manufacturing Outlook Index did improve from 21 to 24, yet it missed the anticipated mark of 25.
In terms of capital expenditure, big firms in Japan are projecting an increase of 13.5% for the current fiscal year ending in March 2024. This projection is more optimistic than the median market forecast, which anticipated a 12.4% increase.
ADB raises 2023 growth forecast, driven by stronger performance in China and India
Asian Development Bank upgrades growth forecasts Developing Asia for 2023, raising projection from 4.7% to 4.9%. This upgrade is primarily attributed to stronger than expected growth in two of the region's largest economies, China and India. On the other hand, growth forecast for 2024 remains unchanged at 4.8%.
Specifically, for China, ADB now projects growth to reach 5.2% in 2023, an increase from previous forecast of 4.9% made in September. Growth rate for China in 2024 is expected to slow to 4.5%, unchanged from prior predictions. In contrast, India's growth forecast for 2023 is raised from 6.3% to 6.7%, and the country is anticipated to maintain this robust growth rate of 6.7% in 2024.
In terms of inflation, ADB made slight adjustments to its forecasts for Developing Asia. Inflation expectation for 2023 is reduced from 3.6% to 3.5%, while forecast for 2024 sees a minor increase from 3.5% to 3.6%.
ADB, in its release, highlighted several downside risks to these forecasts. Key among these are the potential for "higher-for-longer interest rates in advanced economies," which could lead to financial instability. Additionally, potential supply disruptions from factors like El Niño and the ongoing Russian invasion of Ukraine pose risks of renewing energy and food security challenges, which could reignite inflationary pressures.
Elsewhere
UK GDP, production and trade balance in focus in European session, together with Eurozone industrial production. UK will release PPI and crude oil inventories before FOMC rate decision.
USD/CAD Daily Outlook
Daily Pivots: (S1) 1.3551; (P) 1.3585; (R1) 1.3625; More...
Intraday bias in USD/CAD remains neutral at this point as range trading continues. On the upside, firm break of 1.3265 minor resistance will confirm short term bottoming at 1.3479. More importantly, whole correction from 1.3897 could have completed too. Intraday bias will be back on the upside for strong rally back to 1.3853/3897 resistance zone. However, break of 1.3544 minor support will turned bias back to the downside for 1.3479 and below, to resume the decline from 1.3897.
In the bigger picture, rise from 1.3091 is seen as the fifth leg of the whole rise from 1.2005 (2021 low). Further rally is expected as long as 1.3378 support holds, to 61.8% projection of 1.2401 to 1.3976 from 1.3091 at 1.4064. However, decisive break of 1.3378 will dampen this view and bring deeper fall back to 1.3091 instead.
Economic Indicators Update
| GMT | Ccy | Events | Actual | Forecast | Previous | Revised |
|---|---|---|---|---|---|---|
| 23:50 | JPY | Tankan Large Manufacturing Index Q4 | 12 | 10 | 9 | |
| 23:50 | JPY | Tankan Large Manufacturing Outlook Q4 | 8 | 9 | 10 | |
| 23:50 | JPY | Tankan Non - Manufacturing Index Q4 | 30 | 27 | 27 | |
| 23:50 | JPY | Tankan Non - Manufacturing Outlook Q4 | 24 | 25 | 21 | |
| 23:50 | JPY | Tankan Large All Industry Capex Q4 | 13.50% | 12.40% | 13.60% | |
| 07:00 | GBP | GDP M/M Oct | -0.10% | 0.20% | ||
| 07:00 | GBP | Industrial Production M/M Oct | -0.10% | 0.00% | ||
| 07:00 | GBP | Industrial Production Y/Y Oct | 1.10% | 1.50% | ||
| 07:00 | GBP | Manufacturing Production M/M Oct | 0.00% | 0.10% | ||
| 07:00 | GBP | Manufacturing Production Y/Y Oct | 1.90% | 3.00% | ||
| 07:00 | GBP | Goods Trade Balance (GBP) Oct | -14.1B | -14.3B | ||
| 08:00 | CHF | SECO Economic Forecasts | ||||
| 10:00 | EUR | Eurozone Industrial Production M/M Oct | -0.30% | -1.10% | ||
| 13:30 | USD | PPI M/M Nov | 0.10% | -0.50% | ||
| 13:30 | USD | PPI Y/Y Nov | 1.00% | 1.30% | ||
| 13:30 | USD | PPI Core M/M Nov | 0.20% | 0.00% | ||
| 13:30 | USD | PPI Core Y/Y Nov | 2.20% | 2.40% | ||
| 15:30 | USD | Crude Oil Inventories | -1.9M | -4.6M | ||
| 19:00 | USD | Fed Interest Rate Decision | 5.50% | 5.50% | ||
| 19:30 | USD | FOMC Press Conference |
Technical Outlook and Review
DXY:
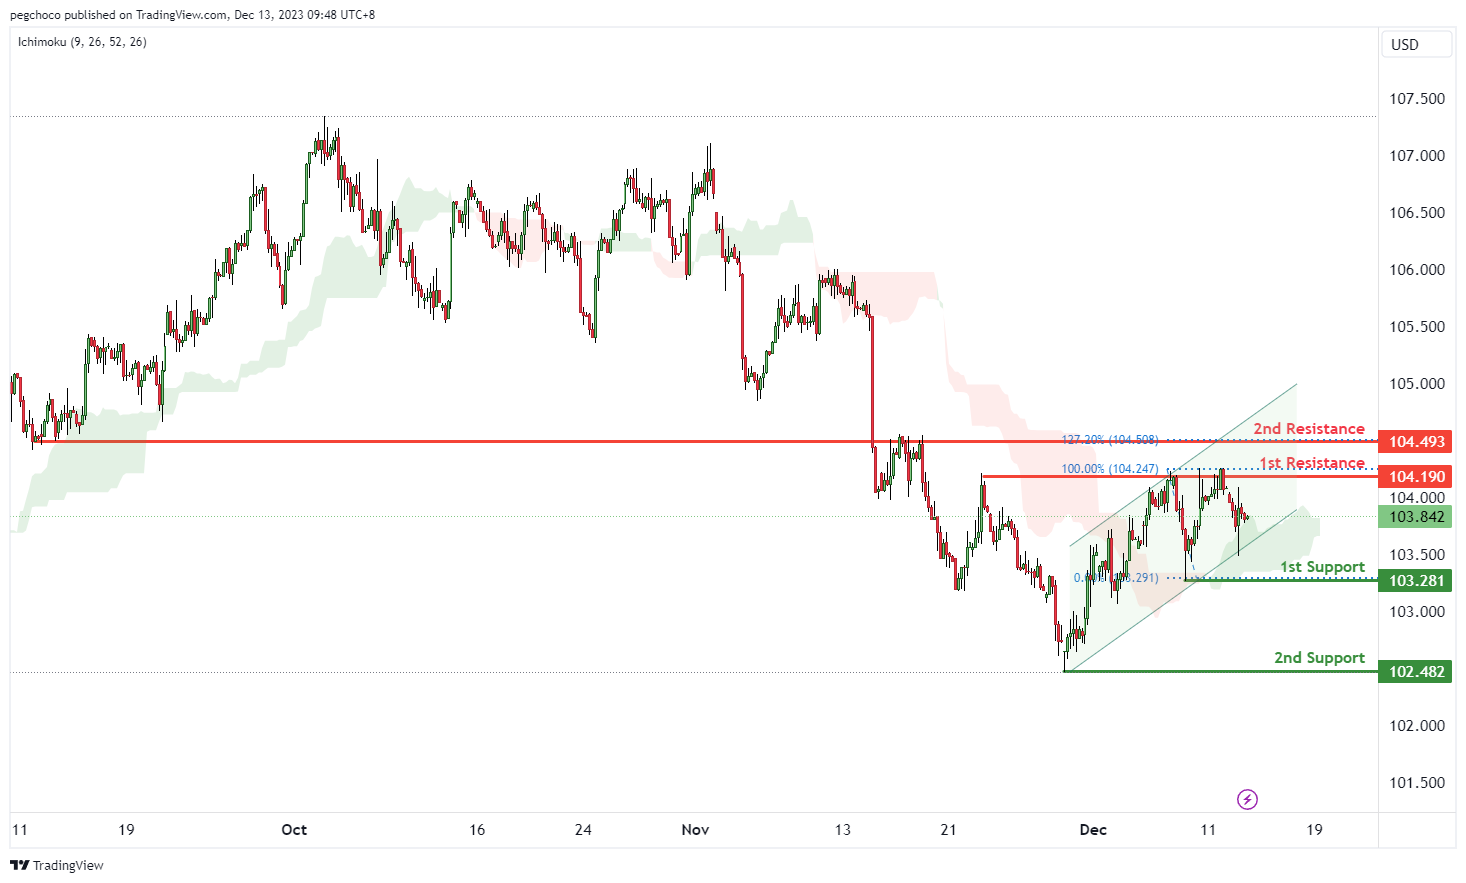
The DXY (US Dollar Index) chart currently has a bullish overall momentum, with price trading within a bullish ascending channel. In this scenario, price could potentially continue its bullish momentum towards the 1st resistance level.
The 1st support at 103.28 is considered a swing low support, indicating that it has previously acted as a level where buying interest emerged. Traders may look for potential buying opportunities or temporary support around this level.
Similarly, the 2nd support at 102.48 is another swing low support level, further reinforcing the potential for price to find support in this area.
On the resistance side, the 1st resistance at 104.19 is categorized as a multi-swing high resistance, suggesting that it has historically acted as a barrier to further upside movements. However, given the overall bullish momentum, traders may anticipate that price could break above this level.
Further up, the 2nd resistance at 104.49 is identified as an overlap resistance and coincides with the 127.20% Fibonacci Extension level, indicating a potential confluence of resistance factors. This level is likely to act as a substantial barrier where selling interest could intensify.
EUR/USD:
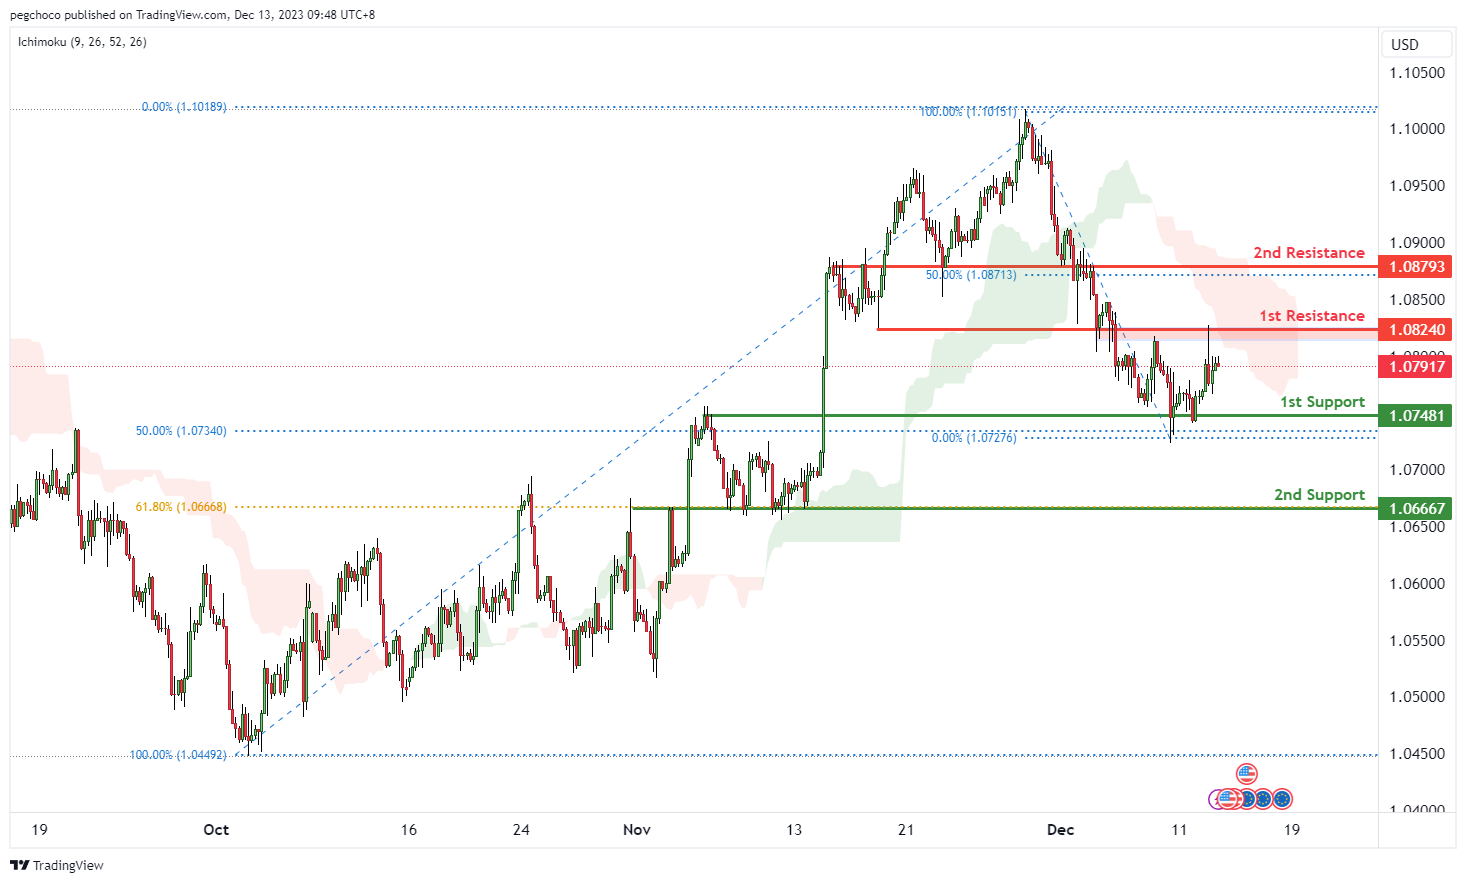
The EUR/USD chart currently has a bearish overall momentum, with price trading below the bearish Ichimoku cloud, indicating a bearish trend in place. In this scenario, price could potentially continue its bearish momentum towards the 1st support level.
The 1st support at 1.0748 is considered an overlap support and coincides with the 50% Fibonacci Retracement level. This level is significant as it suggests a potential area where buying interest may emerge, providing temporary support for EUR/USD.
Similarly, the 2nd support at 1.0666 is another overlap support level and aligns with the 61.80% Fibonacci Retracement level, further reinforcing the potential for price to find support in this area.
On the resistance side, the 1st resistance at 1.0824 is categorized as an overlap resistance. This level is likely to act as a barrier where selling interest could intensify, potentially preventing further upside movements.
Further up, the 2nd resistance at 1.0879 is identified as a pullback resistance and coincides with the 50% Fibonacci Retracement level, suggesting another level where selling pressure may increase.
EUR/JPY:
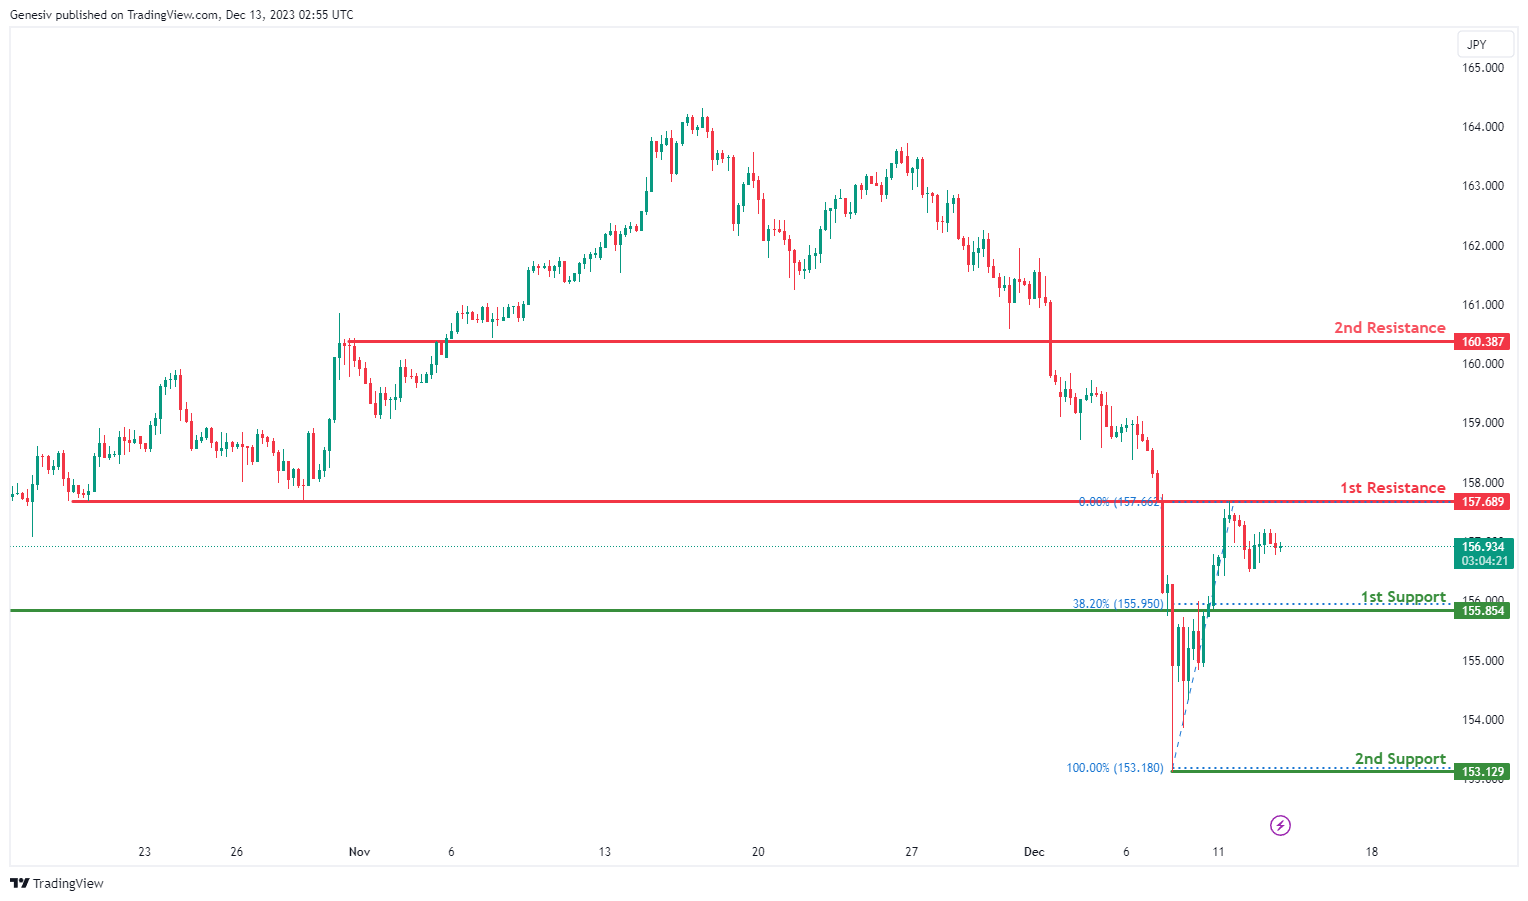
The EUR/JPY chart exhibits a bearish overall momentum, with the current price situated below the bearish Ichimoku cloud, signaling a prevailing bearish trend. Given this context, there is a potential continuation of the bearish momentum, targeting the 1st support level.
The 1st support at 155.85 holds significance as it represents an overlap support and aligns with the 38.20% Fibonacci Retracement level. This confluence suggests a key zone where buying interest may emerge, providing a potential area of temporary support for the currency pair.
Additionally, the 2nd support at 153.13 serves as another crucial level, characterized as a swing low support. This level adds further weight to the potential for support, strengthening the likelihood of a bounce or consolidation around this price point.
On the resistance front, the 1st resistance at 157.69 is identified as a pullback resistance. This level is expected to act as a barrier where selling interest may intensify, potentially impeding any significant upward movements.
Furthermore, the 2nd resistance at 160.39 is recognized as an overlap resistance, indicating a zone where selling pressure could increase. This level coincides with a previous area of interest, adding to its significance as a potential point of reversal for the currency pair.
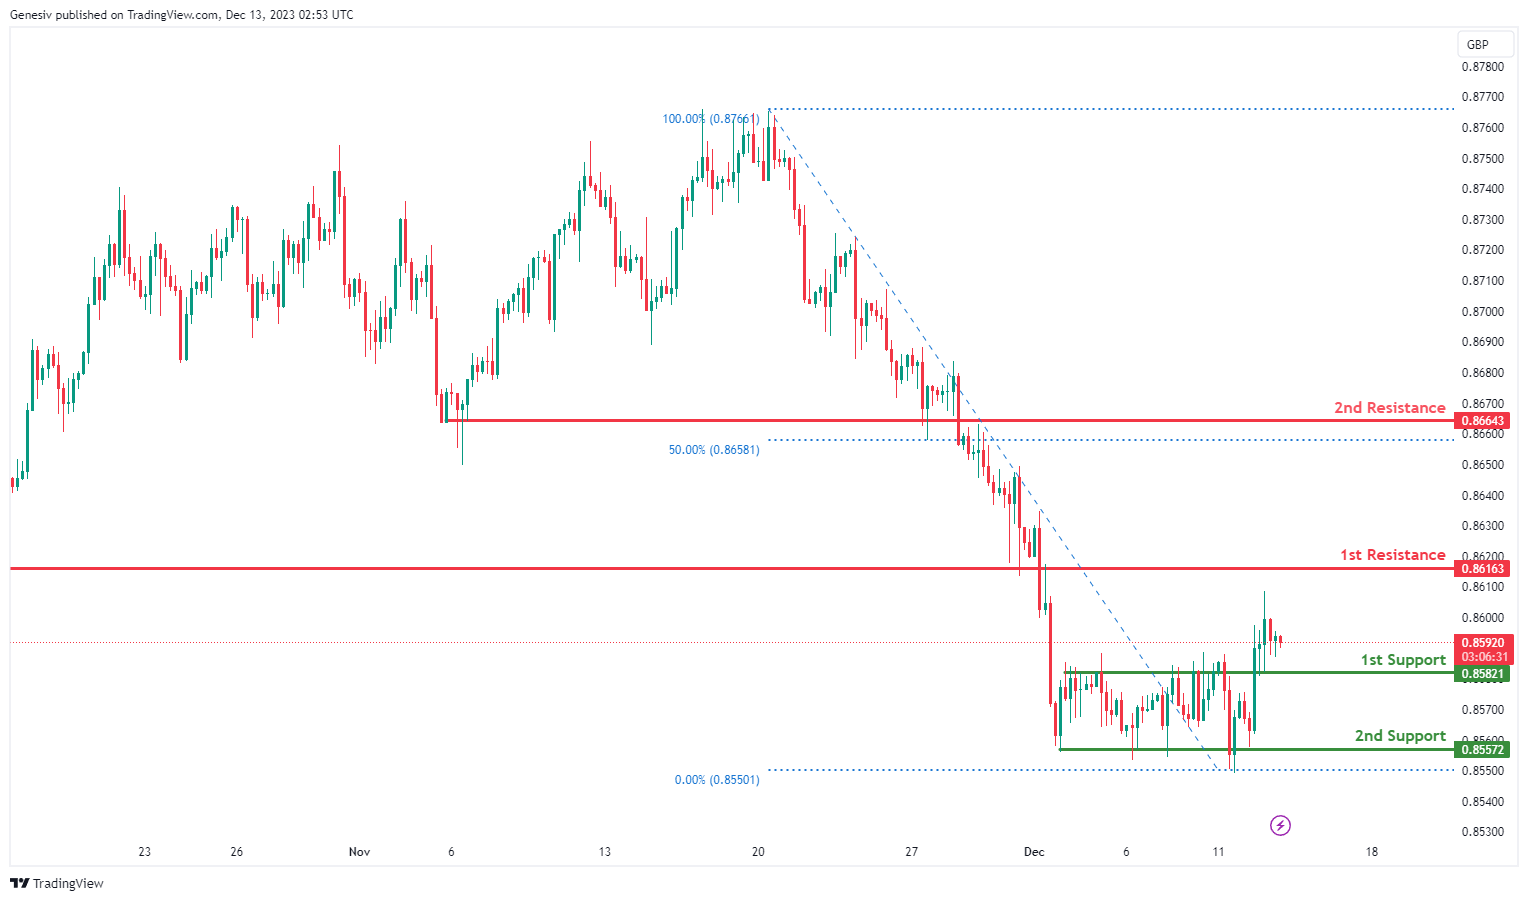
EUR/GBP:
The EUR/GBP chart currently demonstrates a bearish overall momentum, suggesting a potential continuation of the bearish trend towards the 1st support.
The 1st support at 0.8582 is deemed significant due to its classification as an overlap support. This level indicates a convergence of historical price points, reinforcing its potential as a crucial zone where buying interest may emerge, serving as a plausible area for a bearish continuation to find temporary support.
Similarly, the 2nd support at 0.8557 holds importance as a multi-swing low support. This level, derived from multiple swing lows, adds strength to the potential for support, implying that it may act as a substantial level where the bearish momentum could temporarily halt or reverse.
On the resistance side, the 1st resistance at 0.8616 is identified as a pullback resistance. This level is likely to act as a barrier where selling interest could intensify, hindering any significant upward movements and supporting the overall bearish bias.
Furthermore, the 2nd resistance at 0.8664 is characterized as both a pullback resistance and a 50% Fibonacci Retracement level. This confluence enhances the significance of this level, indicating a potential area where selling pressure may increase, aligning with the Fibonacci retracement, a commonly observed technical level in financial markets.
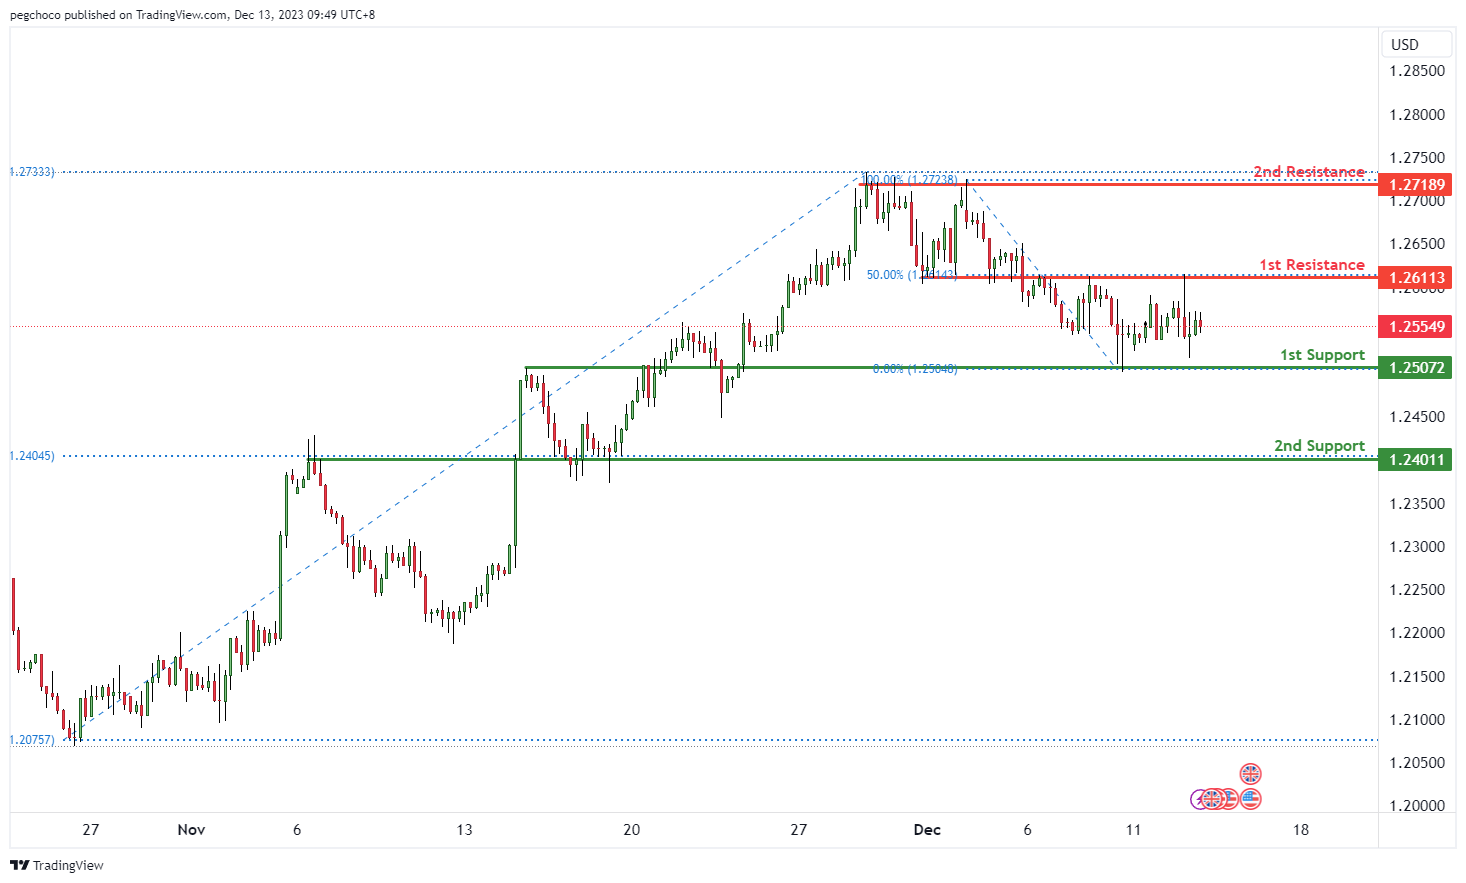
GBP/USD:
The GBP/USD chart currently has a neutral overall momentum, suggesting a lack of a clear directional bias in the near term. In this scenario, price could potentially fluctuate between the 1st resistance and 1st support levels, presenting a range-bound trading opportunity.
The 1st support at 1.2507 is categorized as an overlap support, and it may serve as a level where buying interest could emerge, providing temporary support for GBP/USD.
Similarly, the 2nd support at 1.2401 is another overlap support level and coincides with the 50% Fibonacci Retracement level, further reinforcing its potential as a support level.
On the resistance side, the 1st resistance at 1.2611 is identified as an overlap resistance, which may act as a barrier where selling interest could intensify, potentially preventing further upside movements.
Further up, the 2nd resistance at 1.2718 is categorized as a multi-swing high resistance, suggesting that it could be a significant level where selling pressure may increase.
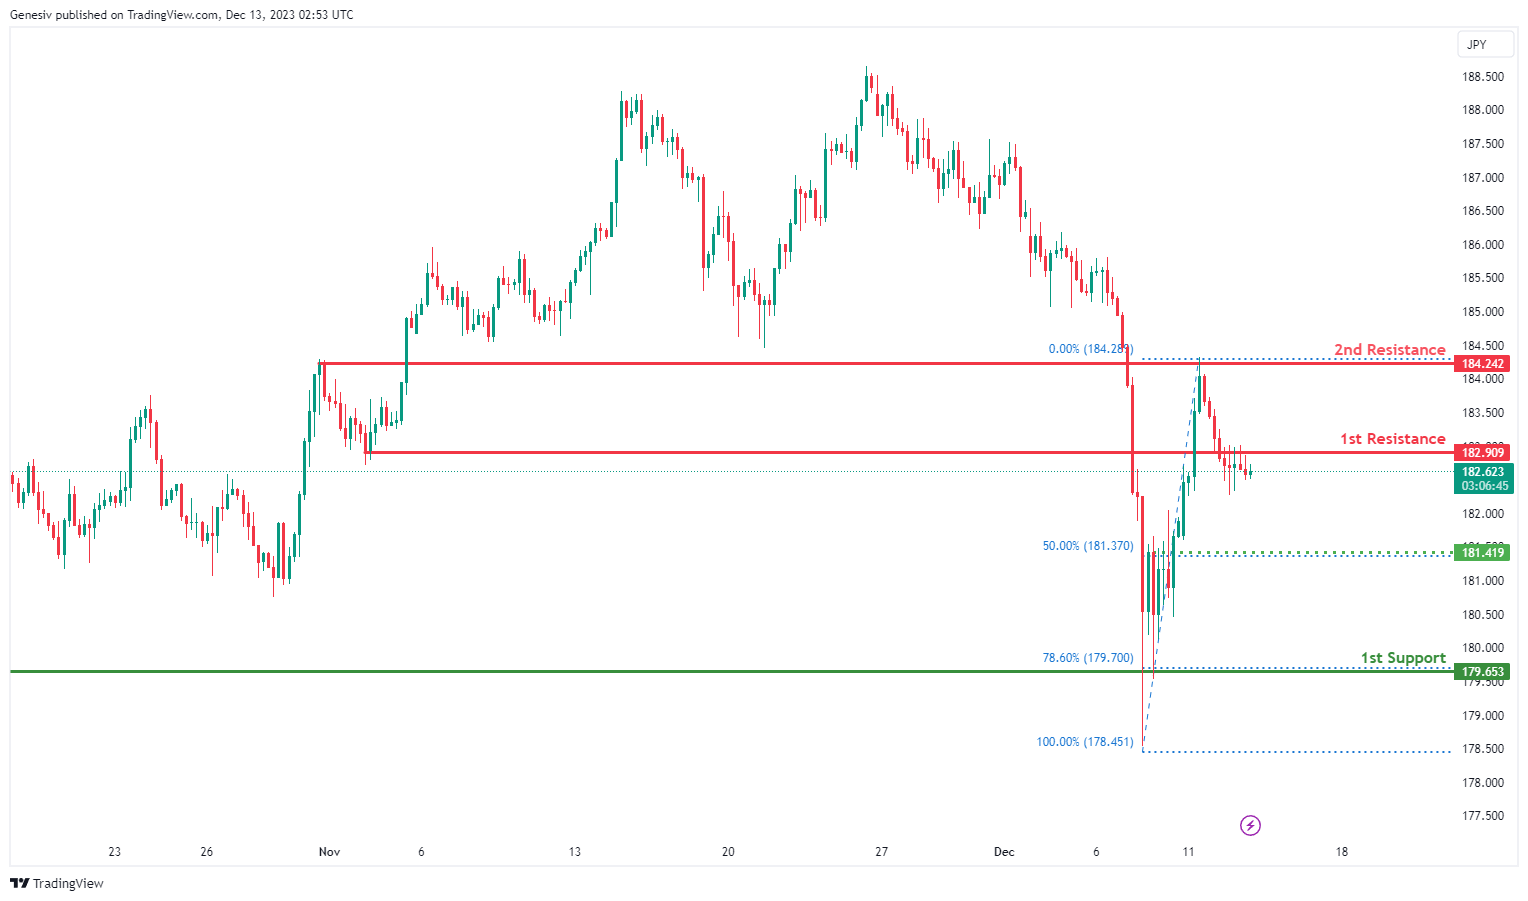
GBP/JPY:
The GBP/JPY chart currently reflects a bearish overall momentum, and there is a possibility of a short-term rise towards the 1st resistance before a potential reversal and subsequent drop towards the 1st support.
The 1st support at 179.65 is considered significant due to its classification as a pullback support and its alignment with the 78.60% Fibonacci Retracement level. This confluence suggests a key area where buying interest may emerge, providing potential support for the currency pair.
Additionally, there is an intermediate support at 181.42, identified as a pullback support. This level further reinforces the potential for support, acting as an additional zone where buyers might step in after a pullback.
On the resistance side, the 1st resistance at 182.91 is categorized as a pullback resistance. This level is likely to act as a barrier where selling interest could intensify, potentially causing a reversal in the short-term rise before a drop.
Furthermore, the 2nd resistance at 184.24 is associated with both a swing high resistance and an additional factor. This further strengthens the resistance level, indicating a zone where selling pressure may increase, especially considering the presence of both swing high resistance and another technical factor.
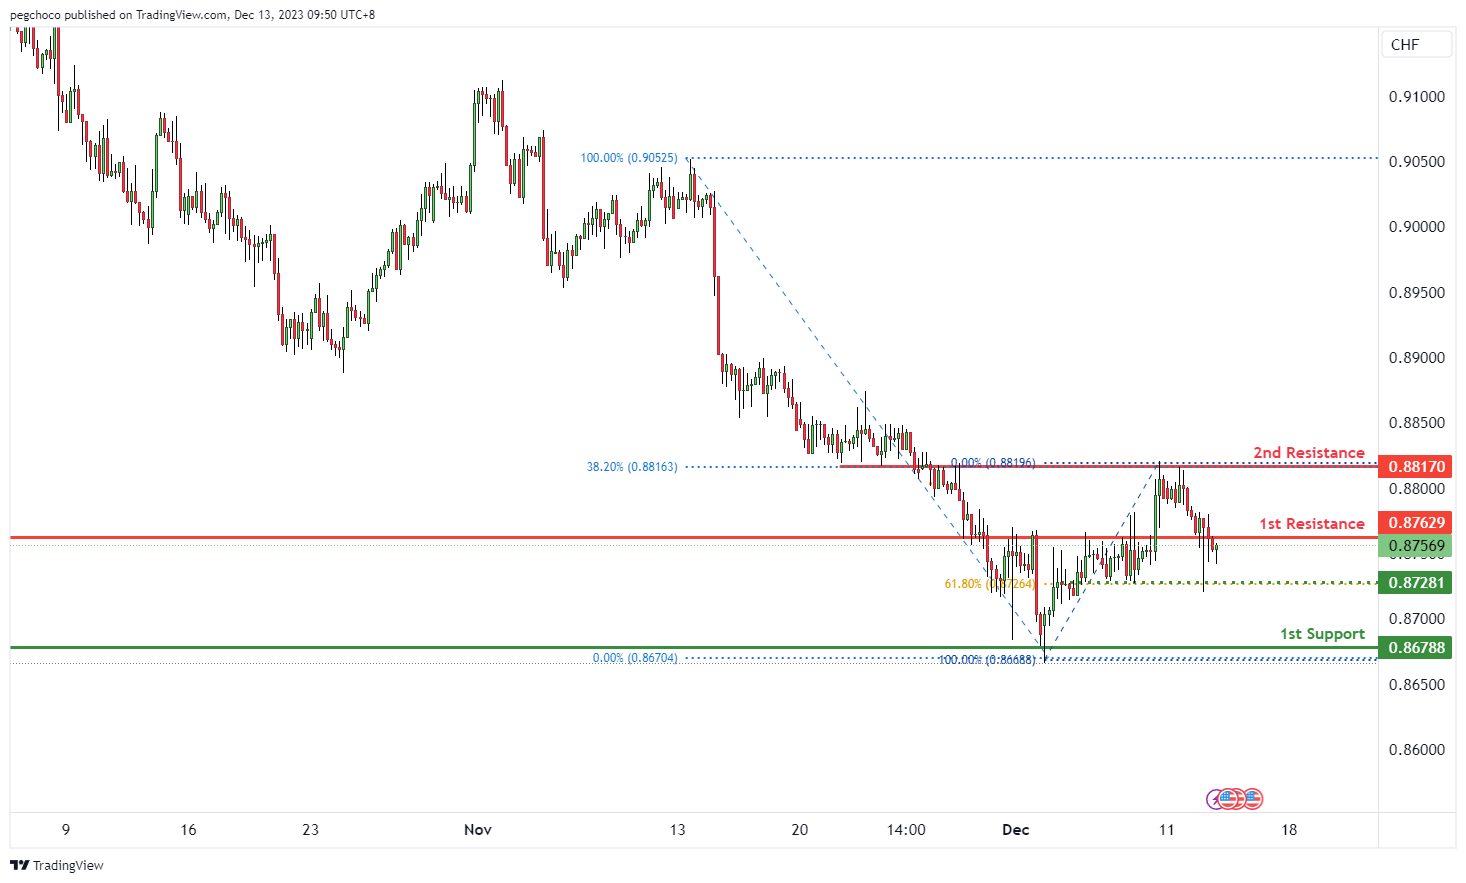
USD/CHF:
The USD/CHF chart currently has a bearish overall momentum, indicating a downward trend. Price could potentially make a bearish reaction off the 1st resistance and drop to the 1st support.
The 1st support at 0.8678 is considered a multi-swing low support level. This level has historical significance as it has previously acted as a level where buying interest emerged. It might serve as a temporary support zone for USD/CHF.
Intermediate support at 0.8728 is another level to watch. It’s categorized as an overlap support and coincides with the 61.80% Fibonacci Retracement level, suggesting potential Fibonacci confluence. This could add to its significance as a support level.
On the resistance side, the 1st resistance at 0.8762 is identified as a pullback resistance. This level could act as a significant barrier where selling interest may intensify, potentially causing a bearish reversal.
Further up, the 2nd resistance at 0.8817 is categorized as an overlap resistance and coincides with the 38.20% Fibonacci Retracement level. This level might also serve as a strong resistance zone where sellers could exert more pressure.
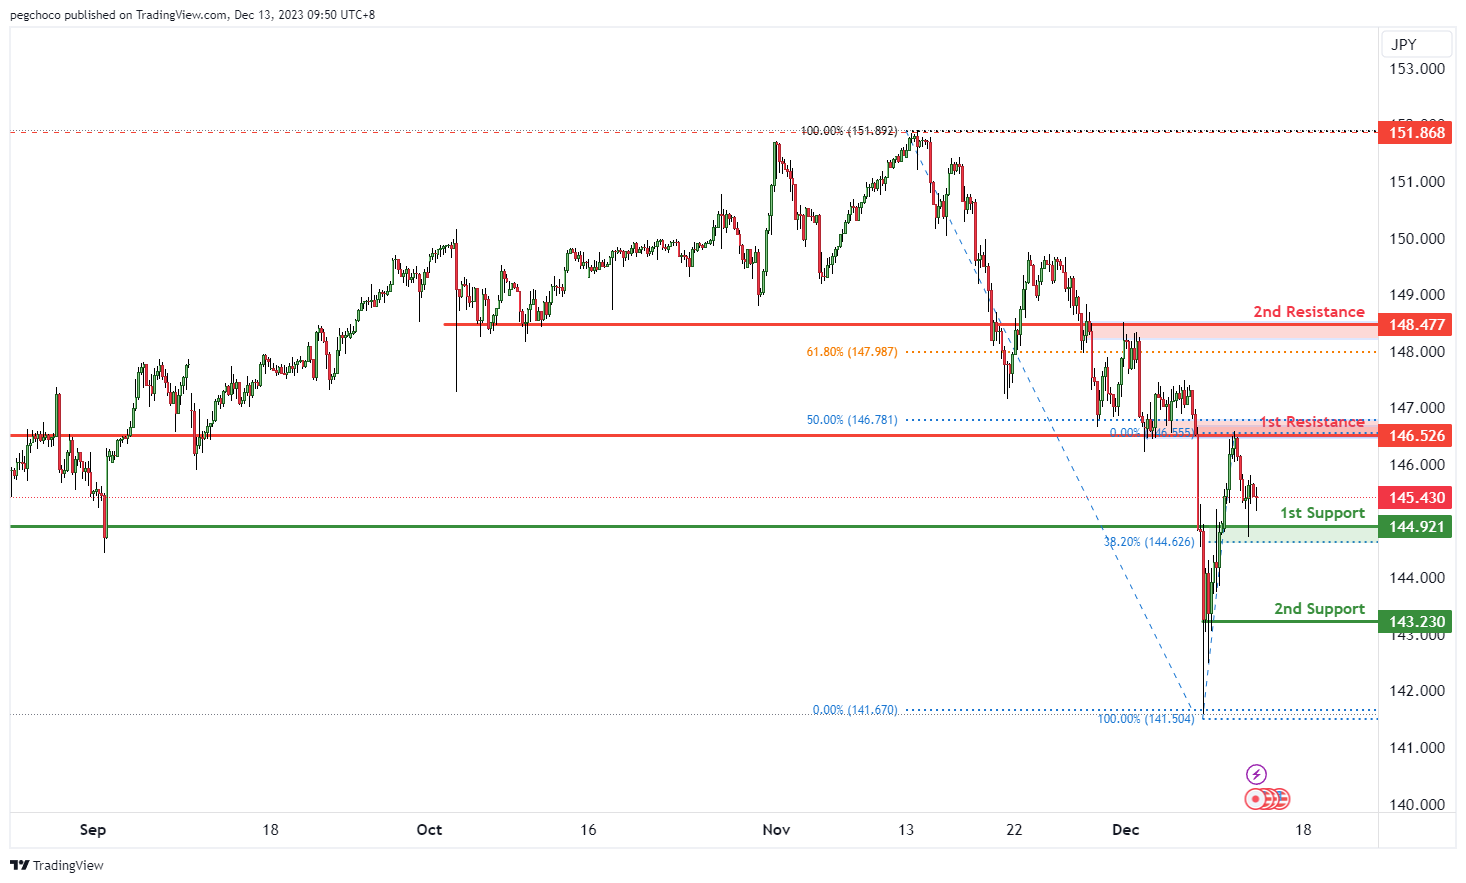
USD/JPY:
The USD/JPY chart currently has a bearish overall momentum, suggesting a downward trend. Price could potentially make a bearish break off the 1st support and drop towards the 2nd support.
The 1st support at 144.92 is considered an overlap support and also coincides with the 38.20% Fibonacci Retracement level. This level is significant as it has previously acted as a support level and aligns with Fibonacci retracement, adding to its potential importance as a support zone.
The 2nd support at 143.23 is categorized as a multi-swing low support. This level is another area to watch for potential support as it has historical significance and represents a lower level of price support.
On the resistance side, the 1st resistance at 146.52 is identified as an overlap resistance and coincides with the 50% Fibonacci Retracement level. This level could serve as a significant barrier where selling interest may intensify, potentially leading to a bearish reversal.
Further up, the 2nd resistance at 148.47 is also categorized as an overlap resistance and coincides with the 61.80% Fibonacci Retracement level. This level might also act as a strong resistance zone where sellers could exert more pressure.
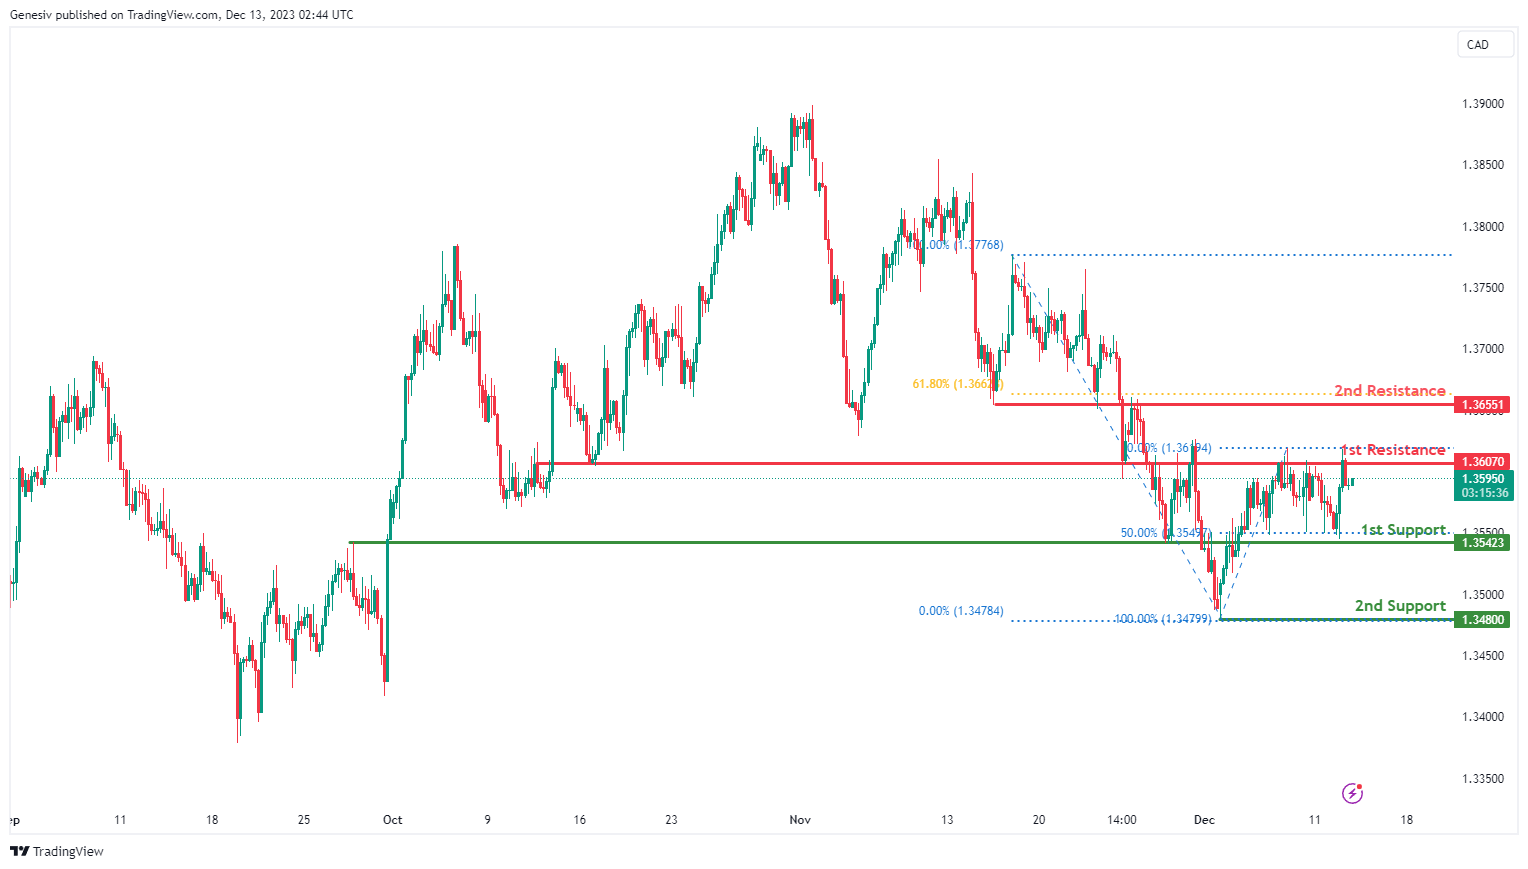
USD/CAD:
The USD/CAD chart currently exhibits an overall bullish momentum, indicating a prevailing upward trend. In this context, there is a potential scenario for price to make a bullish continuation towards the 1st resistance.
The 1st resistance level at 1.3607 is identified as an overlap resistance while the 2nd resistance level at 1.3655 is also noted as an overlap resistance that aligns close to the 61.80% Fibonacci retracement level, suggesting a potential barrier for further upside movement.
To the downside, the 1st support level at 1.3542 is identified as an overlap support that coincides with the 50.00% Fibonacci retracement level. Further below, the 2nd support level at 1.3480 is marked as a swing-low support, further reinforcing its importance as a key support level.
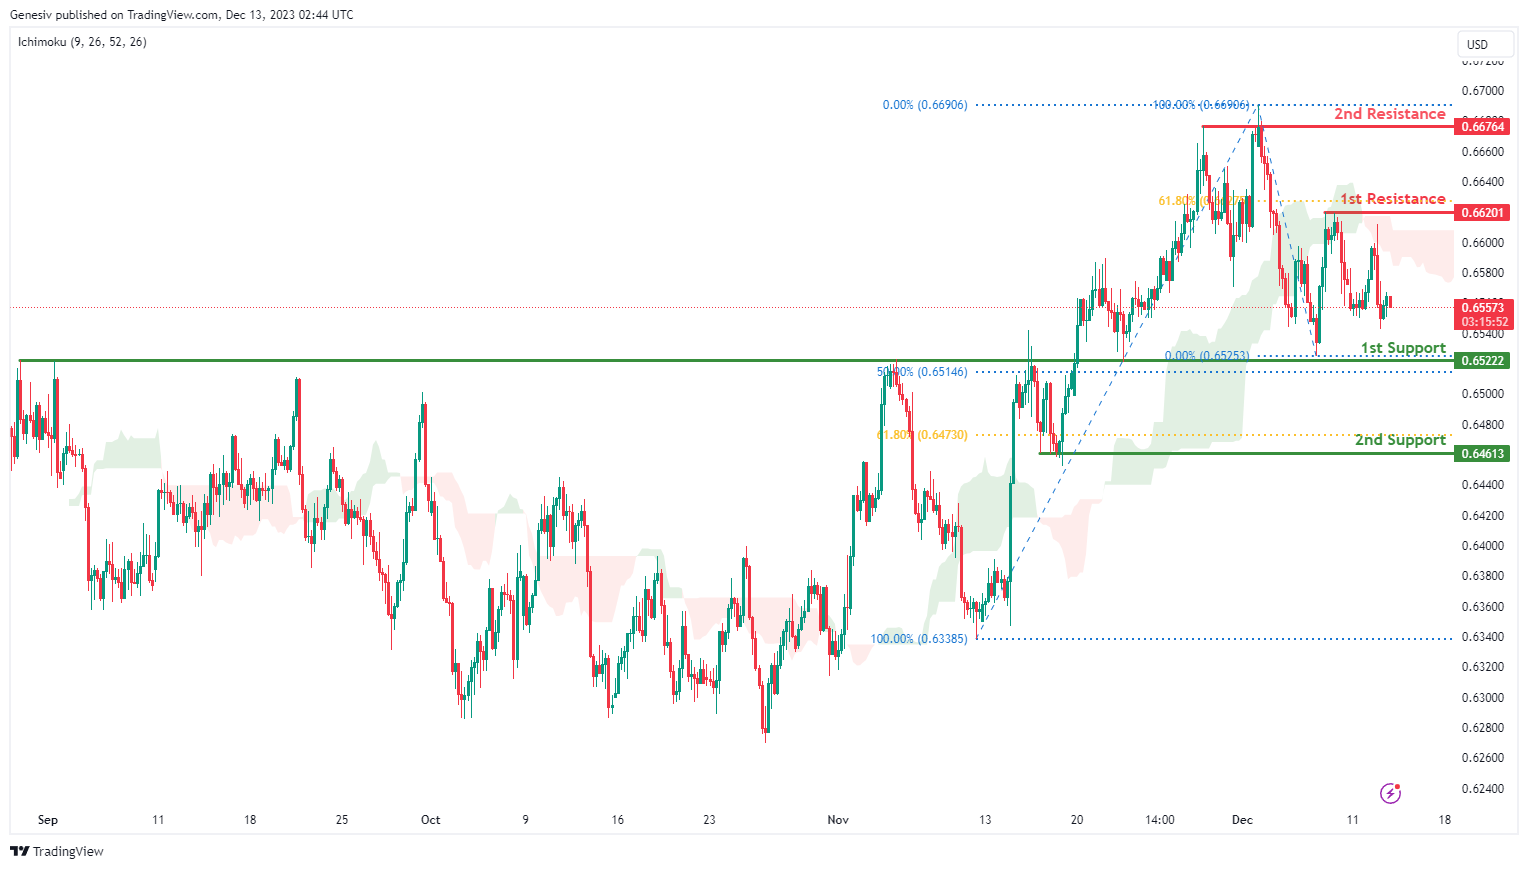
AUD/USD:
The AUD/USD chart currently exhibits an overall bearish momentum, indicating a prevailing downward trend with price trading under the bearish Ichimoku cloud. In this context, there is a potential scenario for price to make a bearish continuation towards the 1st support.
The 1st support level at 0.6522 is identified as an overlap support that aligns close to the 50.00% Fibonacci retracement level. Further below, the 2nd support level at 0.6461 is noted as a pullback support that aligns close to the 61.80% Fibonacci retracement level, reinforcing its importance as a significant support level.
On the resistance side, the 1st resistance level at 0.6620 is identified as a pullback resistance that aligns close to the 61.80% Fibonacci retracement level. Higher up, the 2nd resistance level at 0.6676 is also marked as a pullback resistance, indicating its potential significance as a resistance barrier for further upward movement.
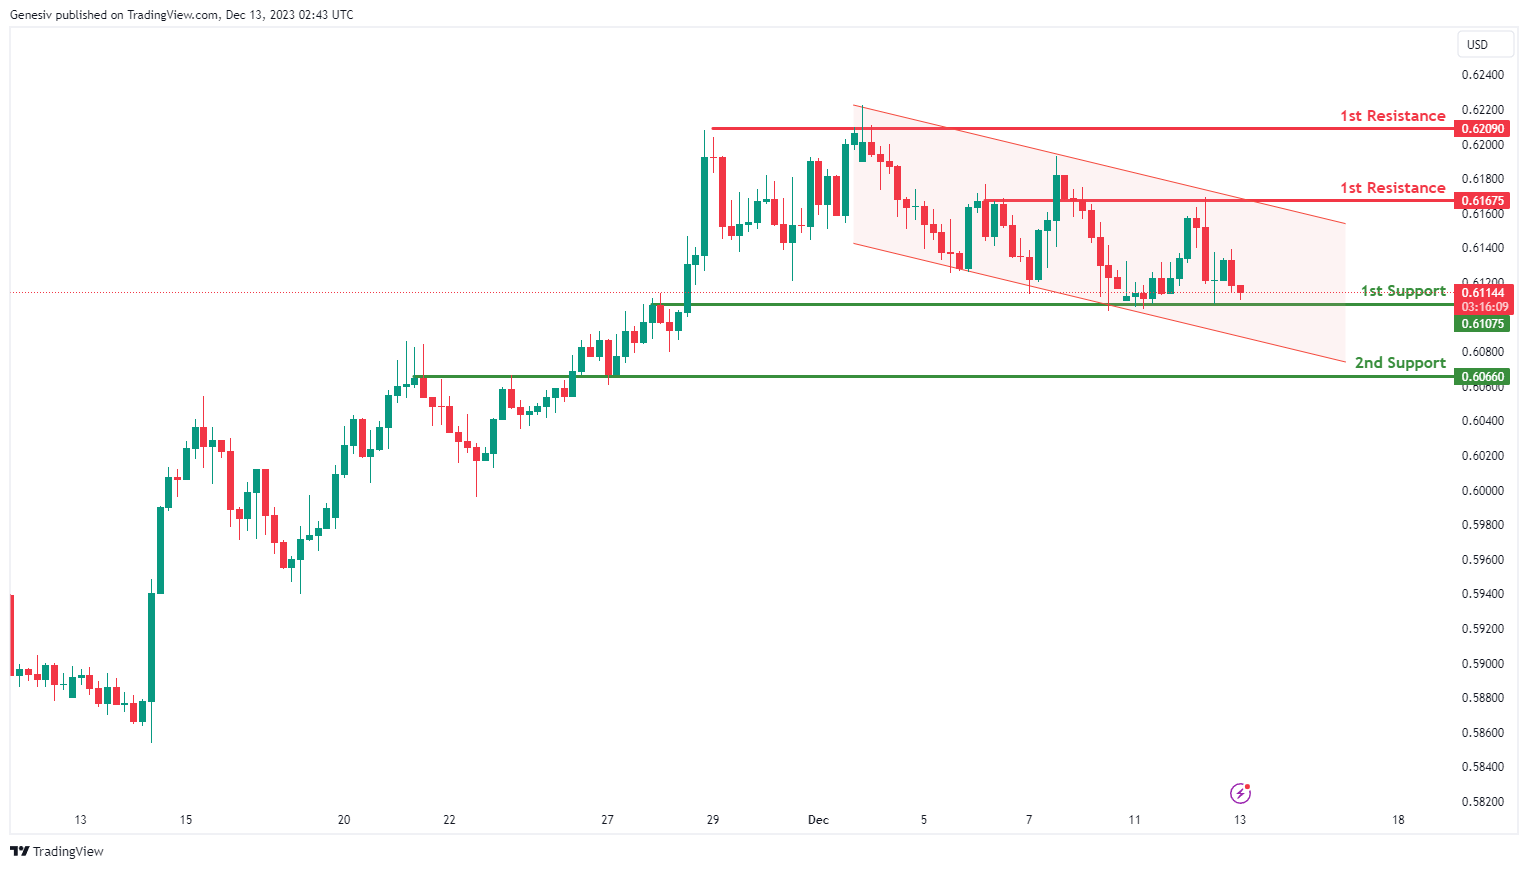
NZD/USD
The NZD/USD chart currently exhibits an overall bearish momentum, indicating a prevailing downward trend with price trading within the bearish channel. In this context, there is a potential scenario for price to break under the 1st support to make a bearish continuation towards the 2nd support.
The 1st support level at 0.6107 is identified as an overlap support while the 2nd support level at 0.6066 is also noted as an overlap support, further reinforcing its importance as a key support level.
On the resistance side, the 1st resistance level at 0.6167 is identified as a pullback resistance while the 2nd resistance level at 0.6209 is also marked as a pullback resistance, indicating its potential significance as barrier for further upward movement.
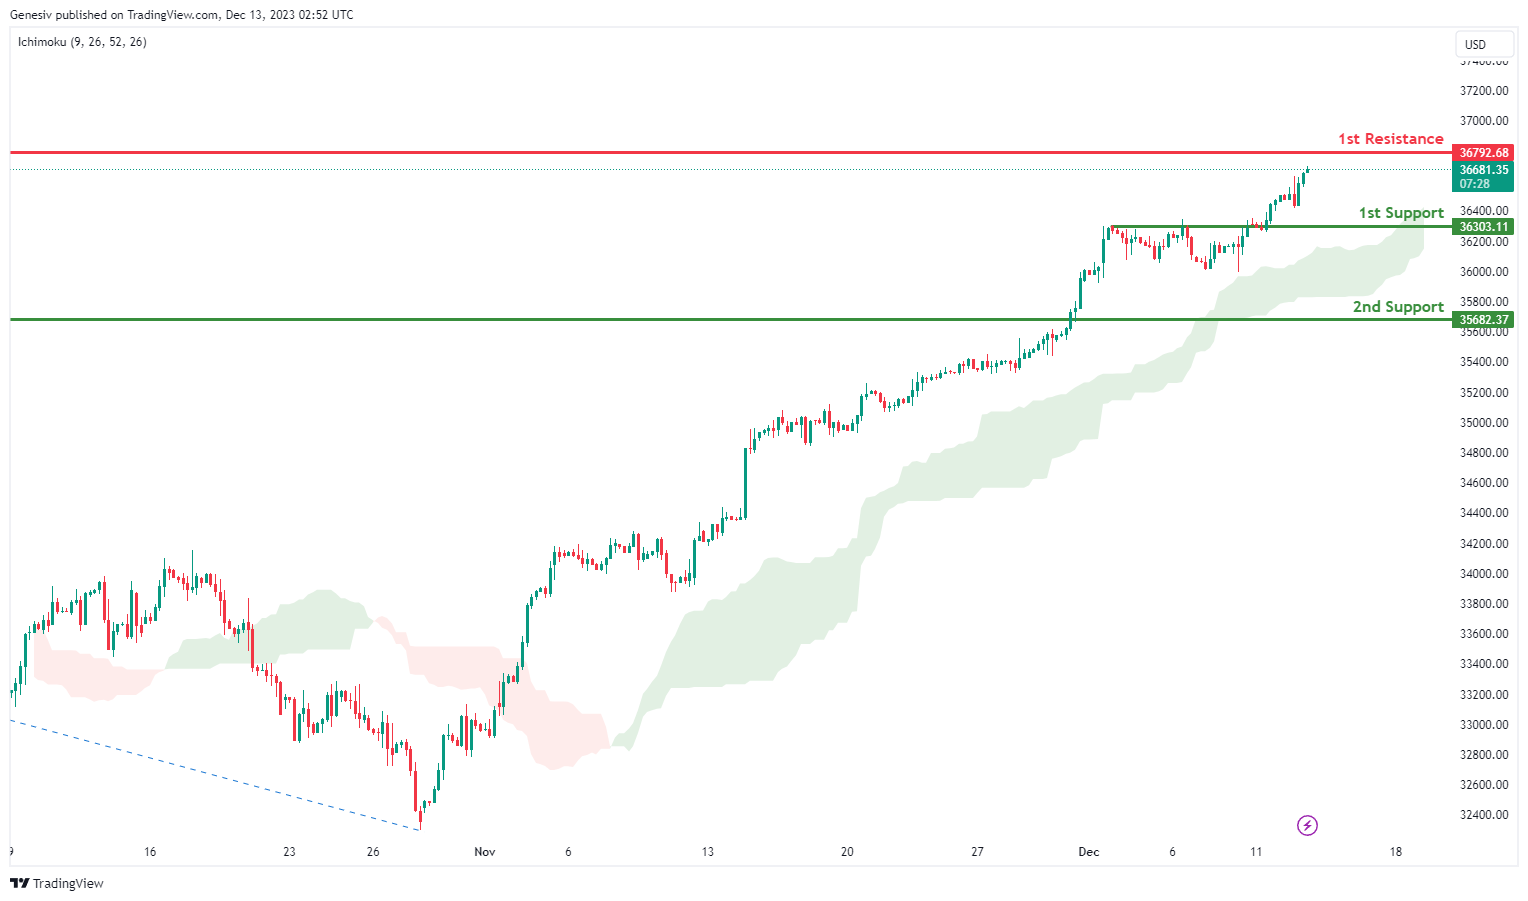
DJ30:
The DJ30 chart currently displays a bullish overall momentum, driven by the fact that the price is positioned above the bullish Ichimoku cloud, indicating favorable conditions for a potential bullish continuation.
In this scenario, the price could potentially continue its bullish momentum towards the 1st resistance.
The 1st support at 36303.11 is considered a significant level due to its classification as an overlap support. This suggests that historical price action aligns at this point, reinforcing its importance as a potential area where buying interest may emerge, providing support for the bullish trend.
Similarly, the 2nd support at 35682.37 is identified as a pullback support. This level represents a potential zone where the price could find support after a pullback, adding to the robustness of the overall support structure for the bullish momentum.
On the resistance side, the 1st resistance at 36792.68 is recognized as a swing high resistance. This level is likely to act as a barrier where selling interest could intensify, potentially causing a pause or reversal in the bullish trend.
Additionally, there is an intermediate resistance at 37842.61, associated with the 161.80% Fibonacci Extension. This Fibonacci level adds further significance to the resistance, indicating a potential area where selling pressure may increase, especially considering the extended nature of the move.
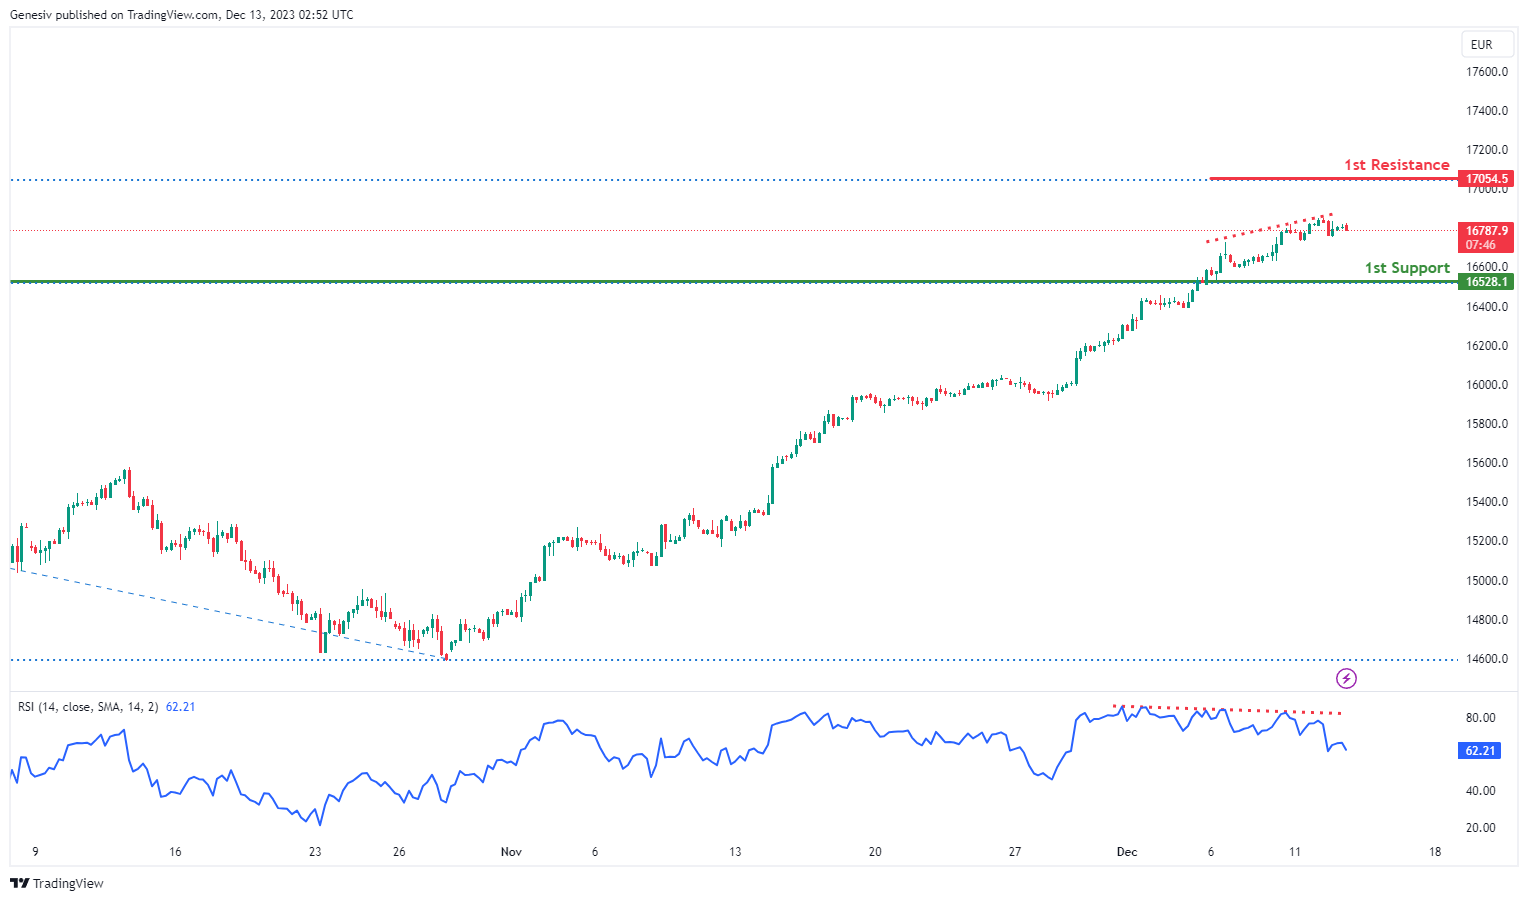
GER40:
The GER40 chart currently exhibits a bearish overall momentum, driven by bearish divergence signals. In this context, there is a potential for a bearish continuation towards the 1st support.
The 1st support at 16528.10 is considered significant as it represents a pullback support. This level indicates a potential area where buying interest may emerge after a pullback, providing support for the bearish continuation.
On the resistance side, the 1st resistance at 17054.50 is associated with the 127.20% Fibonacci Extension. This Fibonacci level adds importance to the resistance, suggesting that it could act as a barrier where selling interest might intensify, potentially causing a pause or reversal in the bearish trend.
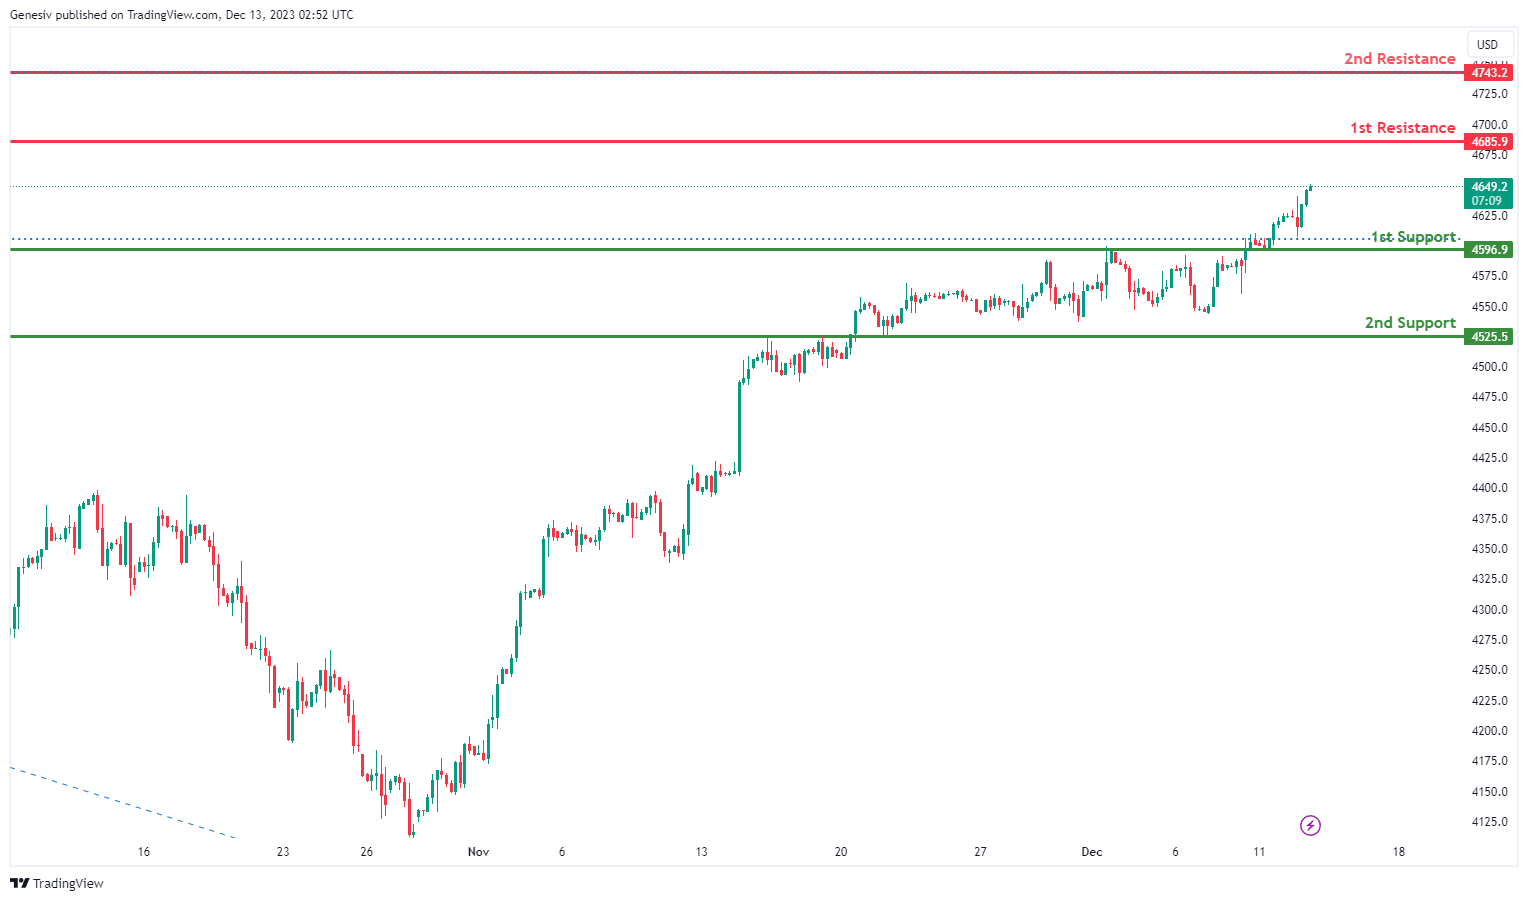
US500:
The US500 chart currently demonstrates a bullish overall momentum, suggesting a potential for a bullish continuation towards the 1st resistance.
The 1st support at 4596.9 holds significance as an overlap support. This level indicates a convergence of historical price points, reinforcing its potential as a crucial zone where buying interest may emerge. The overlap support suggests a strong foundation for the bullish trend to potentially find temporary support.
Similarly, the 2nd support at 4525.5 is also categorized as an overlap support. This further solidifies the support structure, indicating another zone where buying interest may be present. The dual presence of overlap support levels strengthens the overall support for a potential bullish continuation.
On the resistance side, the 1st resistance at 4685.9 is identified as a pullback resistance. This level is likely to act as a barrier where selling interest could intensify, potentially causing a pause or reversal in the bullish trend before pushing higher.
Furthermore, the 2nd resistance at 4743.2 is associated with both a swing high resistance and the 127.20% Fibonacci Extension. This confluence adds significant weight to the resistance, suggesting a potential area where selling pressure may increase, especially considering the presence of both technical and Fibonacci-based resistance.
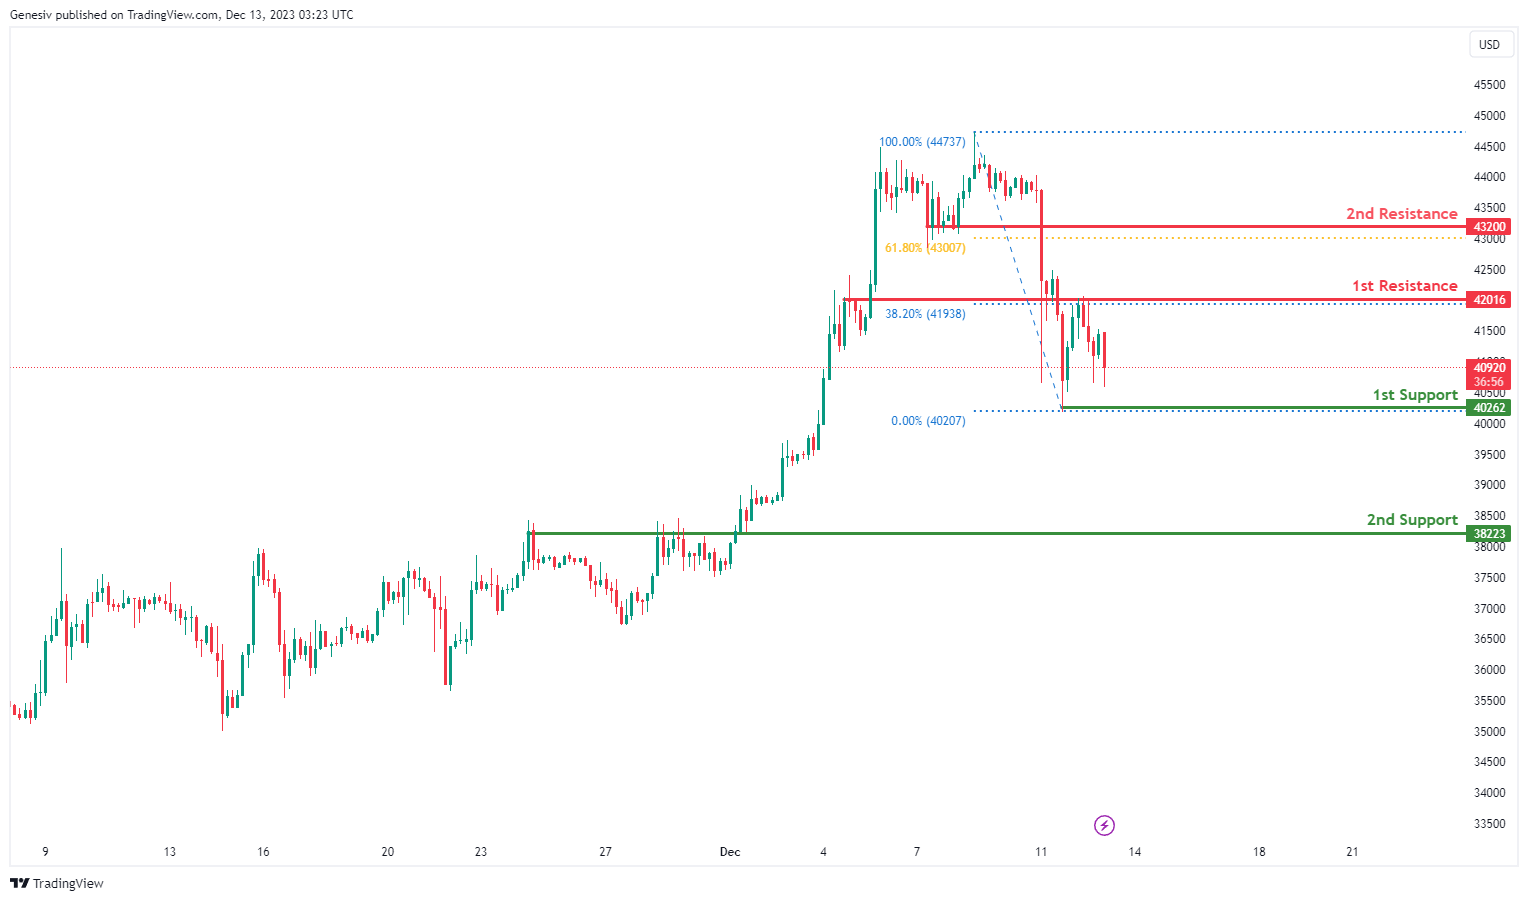
BTC/USD:
The BTC/USD chart currently exhibits a bearish overall momentum, and there is a potential scenario where the price reacts bearishly off the 1st resistance and drops towards the 1st support.
The 1st support at 40262 is considered significant as it represents a pullback support. This level suggests a potential area where buying interest may emerge, providing support for the cryptocurrency and potentially causing a bounce or reversal from the bearish trend.
Similarly, the 2nd support at 38223 is categorized as an overlap support. This adds an additional layer of significance to the support level, indicating a convergence of historical price points and strengthening the potential for this zone to act as a crucial area for buyers.
On the resistance side, the 1st resistance at 42016 is identified as both a pullback resistance and the 38.20% Fibonacci Retracement level. This confluence adds weight to the resistance, suggesting a potential area where selling interest may intensify, leading to a bearish reaction and a subsequent drop in price.
Furthermore, the 2nd resistance at 43200 is associated with both a pullback resistance and the 61.80% Fibonacci Retracement level. This level further strengthens the resistance, indicating another zone where selling pressure may increase, aligning with the Fibonacci retracement, a commonly observed technical level.
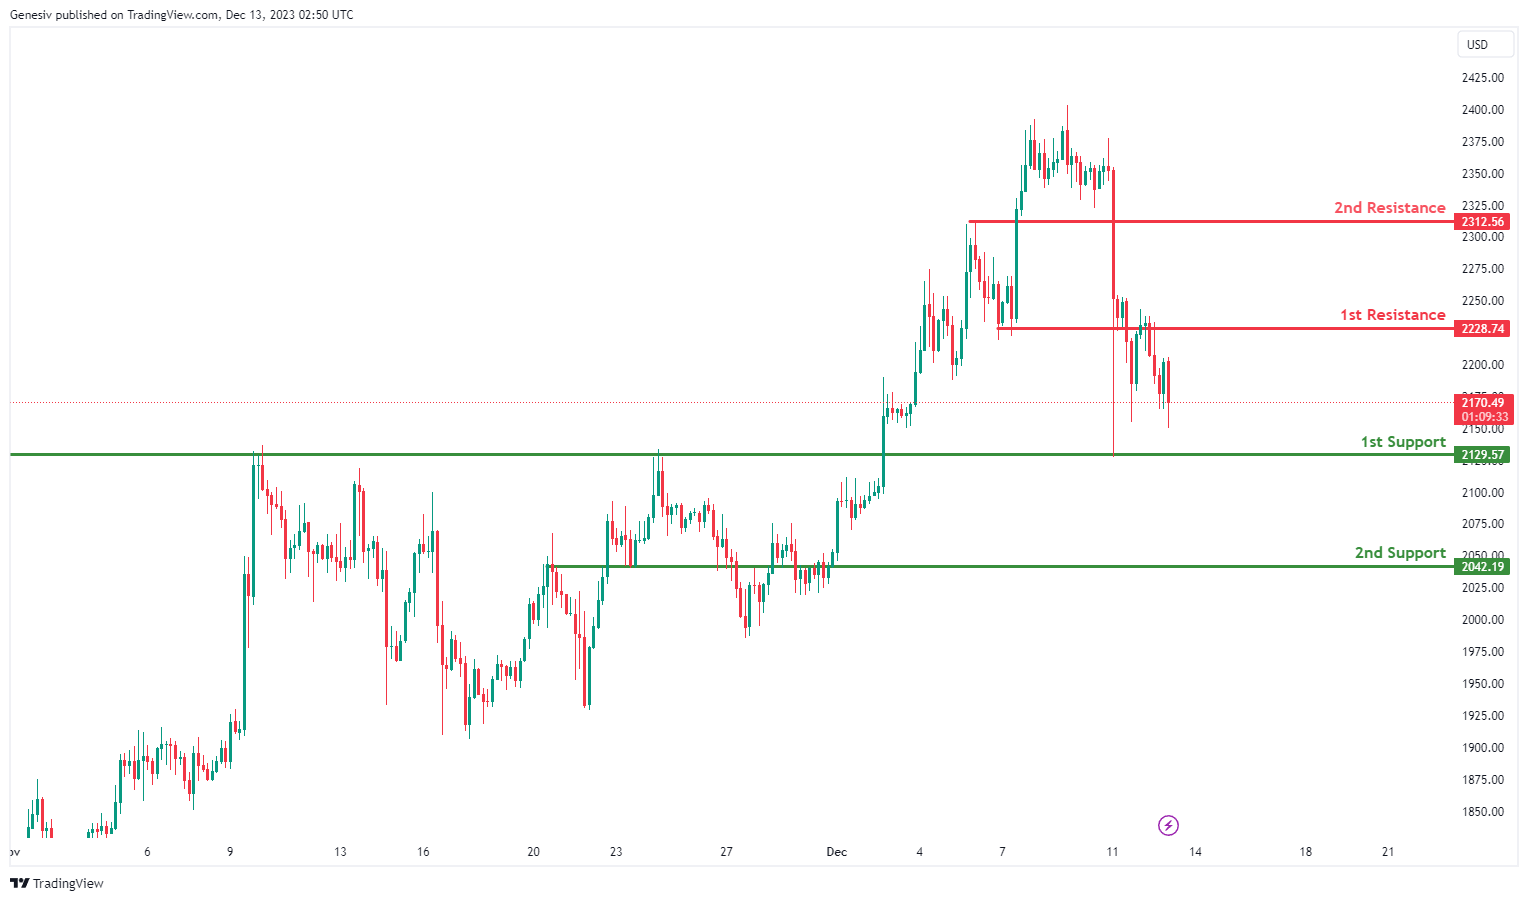
ETH/USD:
The ETH/USD chart currently exhibits a bullish overall momentum, indicating a potential for a bullish continuation towards the 1st resistance.
The 1st support at 21229.57 is considered significant as it represents an overlap support. This level suggests a convergence of historical price points, reinforcing its potential as a crucial area where buying interest may emerge, providing support for the cryptocurrency.
Similarly, the 2nd support at 2042.19 is categorized as an overlap support. This adds an additional layer of significance to the support level, indicating a zone where historical price action aligns, and buyers may find significant interest.
On the resistance side, the 1st resistance at 2228.74 is identified as an overlap resistance. This level may act as a barrier where selling interest could intensify, potentially causing a temporary pause or reversal in the bullish trend.
Furthermore, the 2nd resistance at 2312.56 is associated with a swing high resistance. This level further strengthens the resistance, indicating a potential area where selling pressure may increase, especially considering its alignment with a previous swing high.
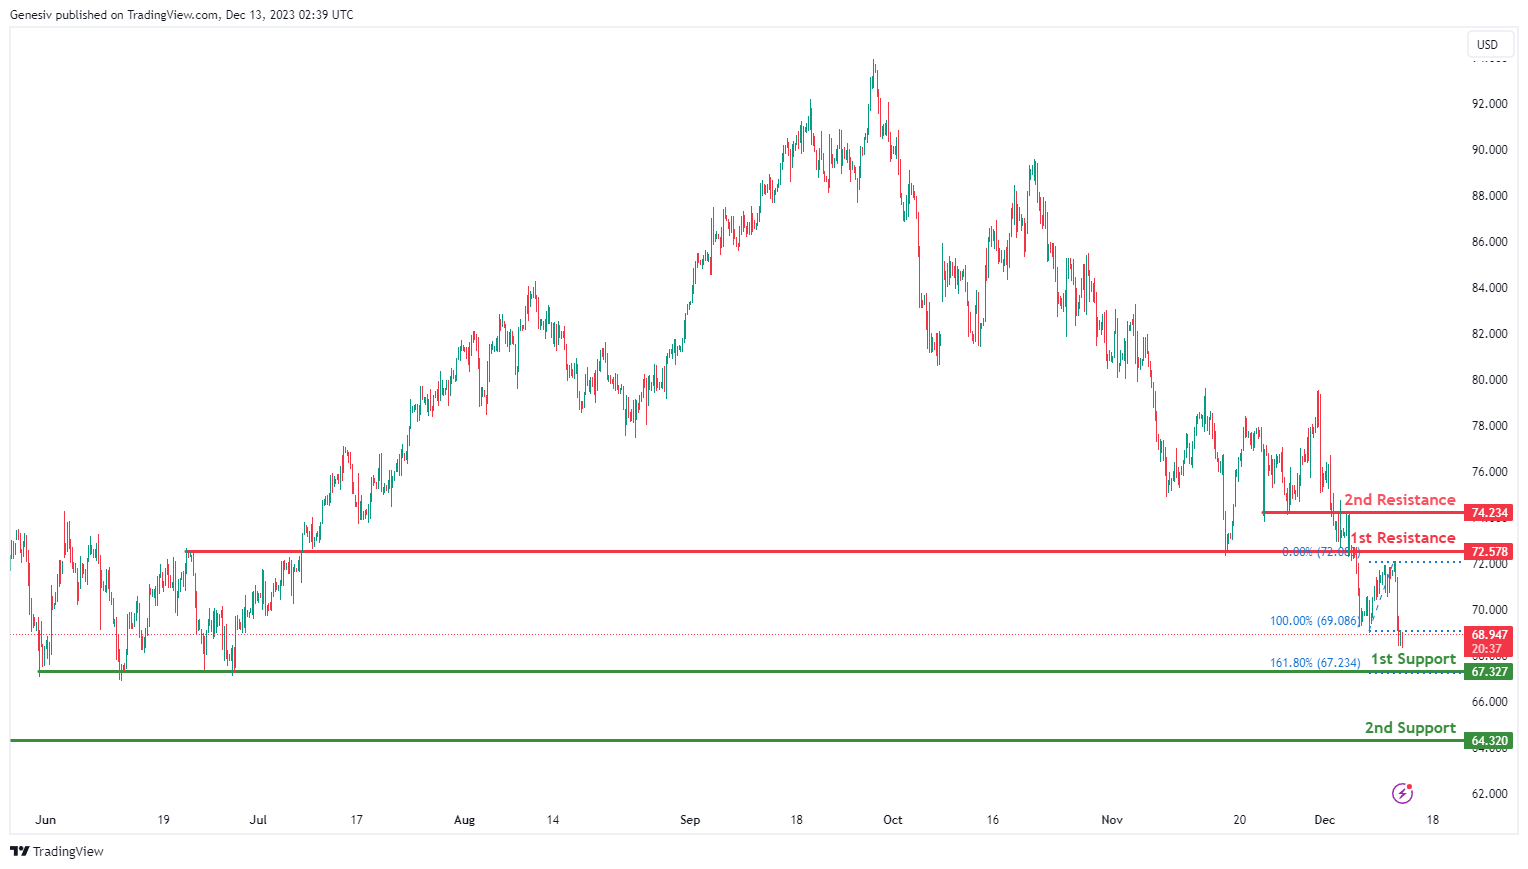
WTI/USD:
The WTI chart currently exhibits an overall bearish momentum, suggesting a prevailing downward trend. Within this context, there is a potential for price to make a bearish continuation towards the 1st support.
The 1st support level at 67.32 is identified as a pullback support that aligns with the 161.80% Fibonacci extension level. Further below, the 2nd support level at 64.32 is noted as multi-swing-low support, reinforcing its importance as a key support level.
On the resistance side, the 1st resistance level at 72.57 is identified as an overlap resistance. Higher up, the 2nd resistance level at 74.23 is also marked as an overlap resistance, further indicating its potential significance as a barrier for further upward movement.
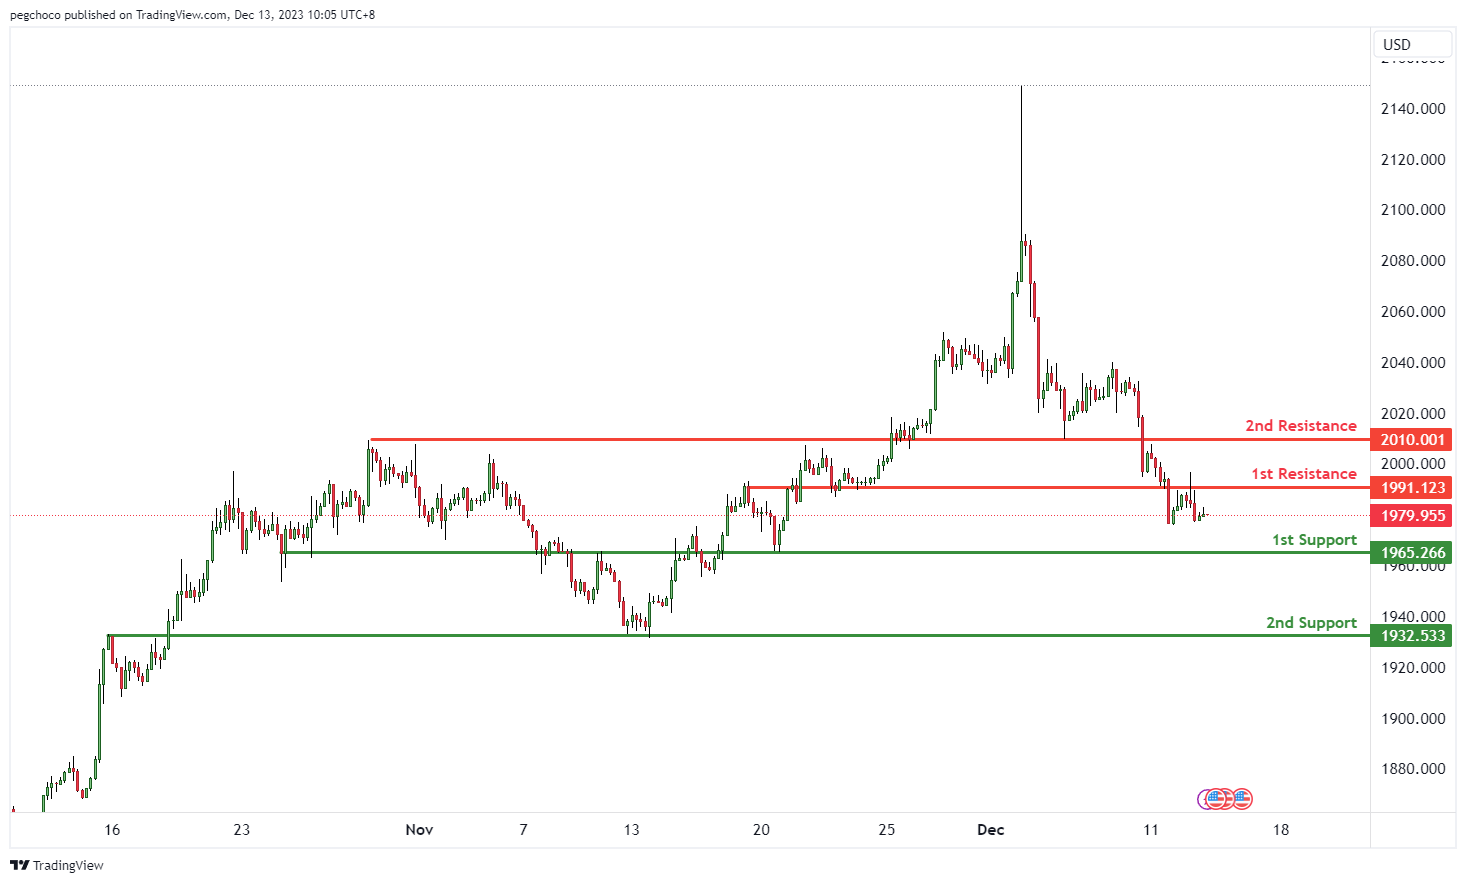
XAU/USD (GOLD):
The XAU/USD chart currently exhibits a bearish overall momentum, indicating a downward trend. Price could potentially continue in a bearish direction towards the 1st support level.
The 1st support at 1965.26 is identified as an overlap support, which means it has previously acted as a significant price level where buying interest emerged. This level is worth monitoring as it could potentially provide a temporary pause in the downward movement.
The 2nd support at 1932.53 is also categorized as an overlap support and is another area to watch for potential support. It has historical significance as a price level where buyers have stepped in before.
On the resistance side, the 1st resistance at 1991.12 is identified as an overlap resistance, indicating a level where selling interest may increase, potentially causing a bearish continuation.
Further up, the 2nd resistance at 2010.00 is also categorized as an overlap resistance and represents another potential barrier where selling pressure could intensify.