
Sample Category Title
Record highs on the horizon for DOW as market awaits FOMC dot plot
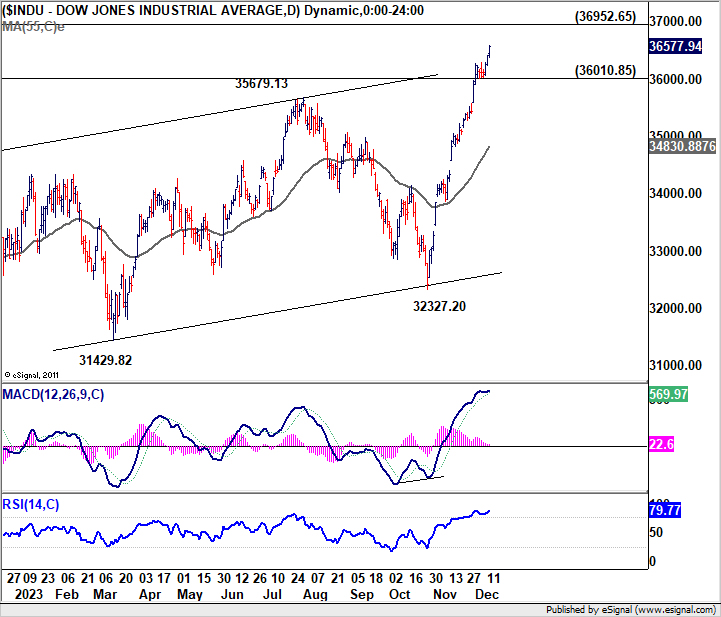
US stock market closed generally higher overnight. In particular, DOW now stands just about 1% shy of its all-time high after recent rally. The current uptrend in major indexes is primarily fueled by an increasing speculation among investors that Fed would start cutting interest rates. Today's FOMC statement and the accompanying "dot plot" are eagerly awaited, as any signs of a dovish stance or indications of policy easing could further fuel the market's ascent, potentially catapulting the DOW to new record heights before year-end.
Expectations are leaning overwhelmingly towards Fed maintaining federal funds rate at the 5.25-5.50% range at today's meeting. Should Fed decide to keep rates unchanged, it would mark the third successive meeting without a rate hike. Such a decision could be interpreted as a signal that the Fed views its cycle of rate hikes as effectively complete. This sentiment is likely to be mirrored in the revised dot plot, which is anticipated to exclude the rate increase previously suggested for this year. There remains, however, a much less probable scenario where the median dots may indicate a postponed hike.
Traders are aggressively pricing in the prospect of Fed beginning its rate-cutting cycle as early as May, with the odds exceeding 50%, as indicated by fed funds futures. Moreover, there's a similar probability assigned to the expectation of a cumulative one percent rate cut by the end of 2024. It's important to note, however, that market predictions often tend to be rather unreliable for periods extending beyond one or two months.
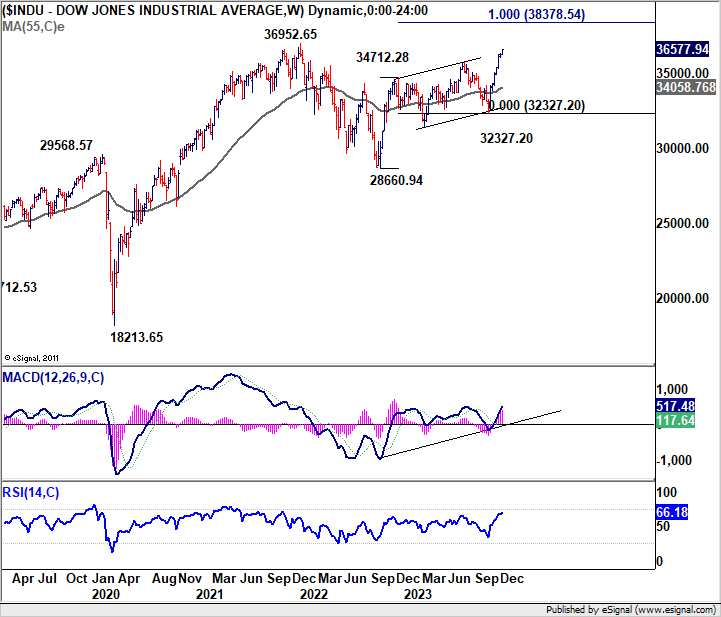
As for DOW, near term outlook will stay bullish as long as 36010.85 support holds. Next target is 36952.65 record high. Clearing of this record high would pave the way to 100% projection of 28660.94 to 34712.28 from 32327.20 at 38378.54.
Crude Oil Price Resumes Slide, Fed Rate Decision Up Next
Key Highlights
- Crude oil prices declined heavily below the $73.50 support.
- A connecting bearish trend line is forming with resistance near $71.45 on the 4-hour chart.
- Gold prices also declined and traded below the $2,000 support.
- The Fed interest rate decision is scheduled today (forecast 5.5%, versus 5.5% previous).
Crude Oil Price Technical Analysis
In the past few days, Crude oil prices saw a steady decline from well above the $78.00 level. The price declined toward the $73.50 zone to move into a bearish zone.
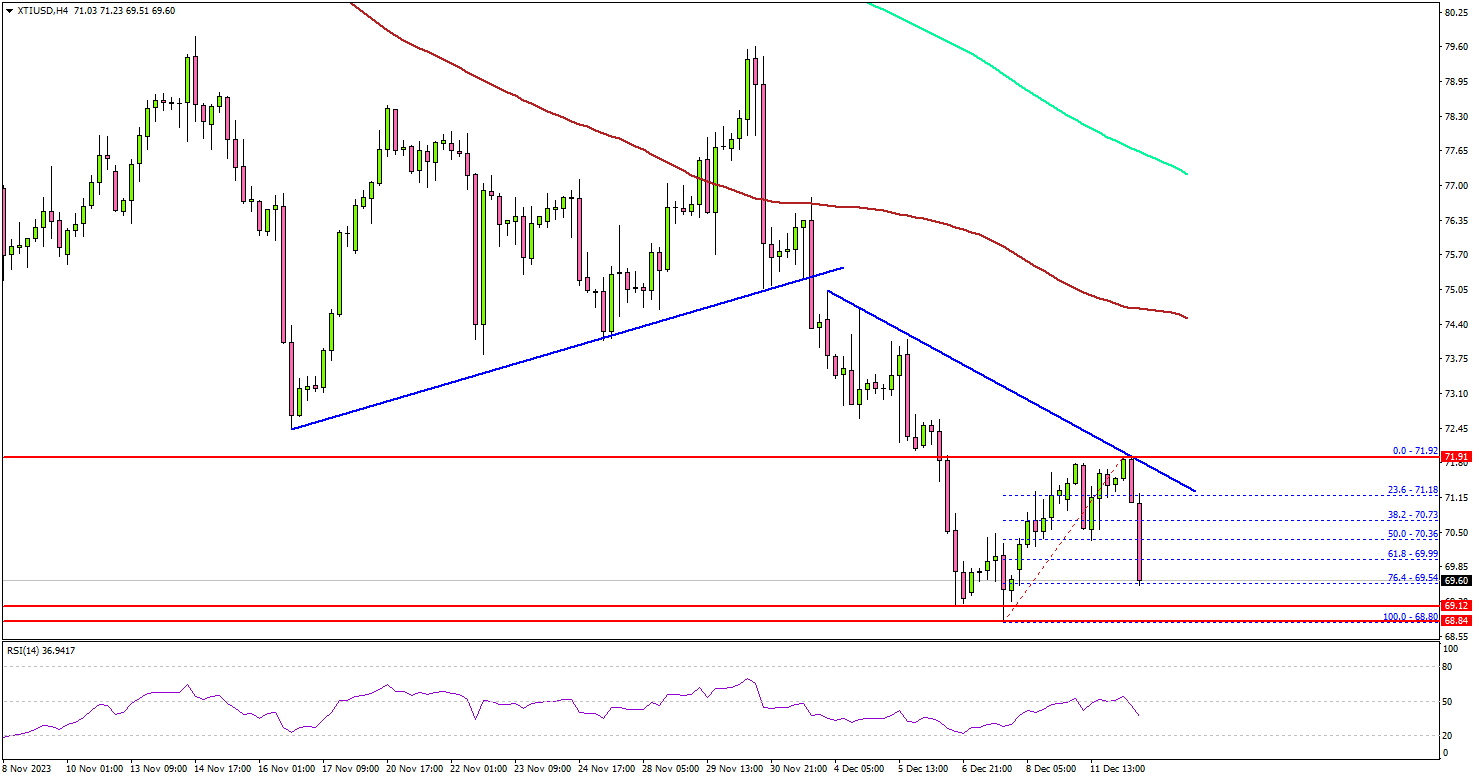
Looking at the 4-hour chart of XTI/USD, the price settled below the $72.50 pivot level, the 200 simple moving average (green, 4-hour), and the 100 simple moving average (red, 4-hour).
There was also a drop below the $70.00 level before the price corrected losses. There was a minor recovery wave above the $70.50 level. However, upsides were capped above the $72.00 level. The price again declined and traded below $70.00.
Immediate support is near the $69.20 level. The next support is at $68.80, below which there is a risk of a sharp decline. In the stated case, the price could dive toward the $65.00 support. Any more losses might call for a test of the $62.00 support zone.
On the upside, the price is facing hurdles near the $71.20 level. There is also a connecting bearish trend line forming with resistance near $71.45 on the same chart.
The next major resistance is near the $72.00 zone, above which the price may perhaps accelerate higher. In the stated case, it could even visit the $75.00 resistance or the 200 simple moving average (green, 4-hour) in the coming days.
Looking at gold prices, there was a steady decline below the $2,020 and $2,000 support levels. It is consolidating losses near $1,980.
Economic Releases to Watch Today
- US Producer Price Index for Nov 2023 (MoM) – Forecast +0.1%, versus -0.5% previous.
- US Producer Price Index for Nov 2023 (YoY) – Forecast +1%, versus +1.3% previous.
- Fed Interest Rate Decision - Forecast 5.5%, versus 5.5% previous.
ADB raises 2023 growth forecast, driven by stronger performance in China and India
Asian Development Bank upgrades growth forecasts Developing Asia for 2023, raising projection from 4.7% to 4.9%. This upgrade is primarily attributed to stronger than expected growth in two of the region's largest economies, China and India. On the other hand, growth forecast for 2024 remains unchanged at 4.8%.
Specifically, for China, ADB now projects growth to reach 5.2% in 2023, an increase from previous forecast of 4.9% made in September. Growth rate for China in 2024 is expected to slow to 4.5%, unchanged from prior predictions. In contrast, India's growth forecast for 2023 is raised from 6.3% to 6.7%, and the country is anticipated to maintain this robust growth rate of 6.7% in 2024.
In terms of inflation, ADB made slight adjustments to its forecasts for Developing Asia. Inflation expectation for 2023 is reduced from 3.6% to 3.5%, while forecast for 2024 sees a minor increase from 3.5% to 3.6%.
ADB, in its release, highlighted several downside risks to these forecasts. Key among these are the potential for "higher-for-longer interest rates in advanced economies," which could lead to financial instability. Additionally, potential supply disruptions from factors like El Niño and the ongoing Russian invasion of Ukraine pose risks of renewing energy and food security challenges, which could reignite inflationary pressures.
Japan’s Tankan manufacturing index rose to 12, highest in nearly 2 years
Japan's Tankan survey for Q4 show signs of strength in both manufacturing and non-manufacturing sectors. Yet, the cautious outlook among manufacturers suggests uncertainty about future economic conditions.
Large Manufacturing Index rose from 9 to 12, surpassing the expected figure of 10. This increase marks the third consecutive quarter of improvement and the highest level since Q1 2022. The Non-Manufacturing Index also showed positive development, rising from 27 to 30, exceeding the forecast of 27. This improvement represents the seventh consecutive quarter of growth, reaching its highest point since 1991.
However, the outlook for the next three months tells a different story. Large Manufacturing Outlook Index fell from 10 to 8, falling short of the expected 9, indicating less optimism among manufacturers for the near future. In contrast, Non-Manufacturing Outlook Index did improve from 21 to 24, yet it missed the anticipated mark of 25.
In terms of capital expenditure, big firms in Japan are projecting an increase of 13.5% for the current fiscal year ending in March 2024. This projection is more optimistic than the median market forecast, which anticipated a 12.4% increase.
Could Silver Bulls Stage a Rebound?
- Silver trades sideways today after a quick 12% correction
- Sell-off stopped a tad below a busy resistance area
- Momentum indicators are sending mixed signals
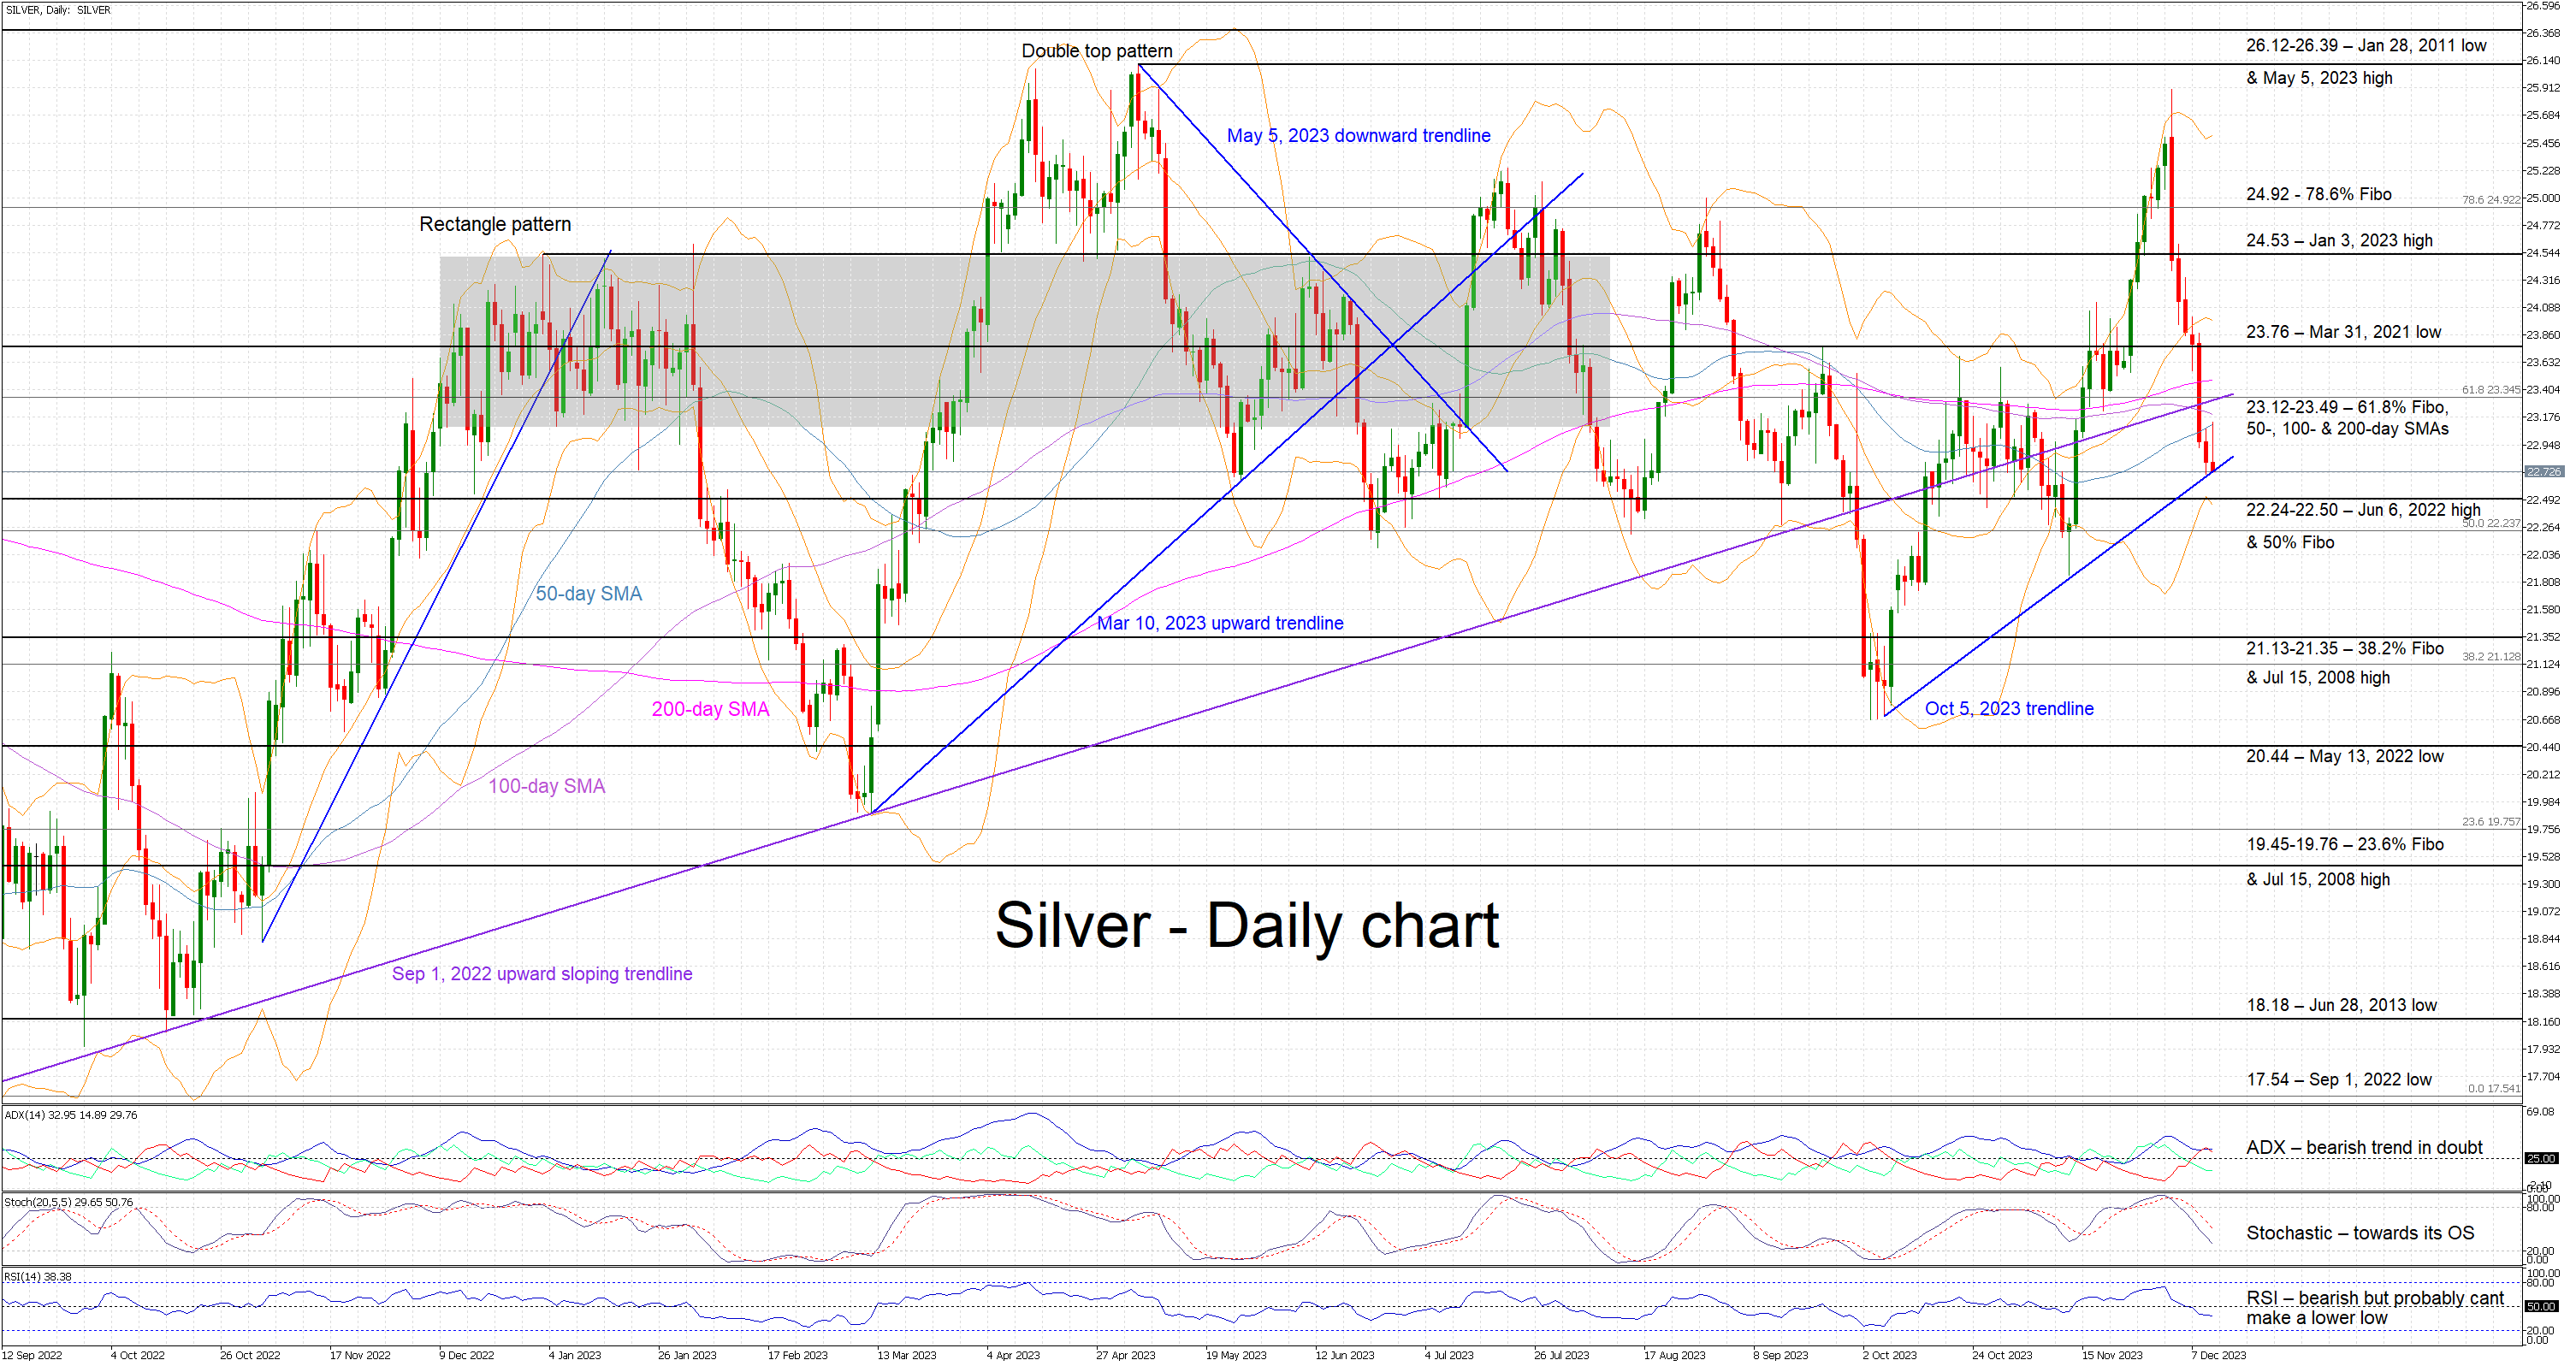
Silver is trading sideways today, bouncing off the October 5, 2023 ascending trendline and trying to test the resistance set by the 50-day simple moving average (SMA). This appears to be the first reaction from the bulls after six consecutive sizeable red candles that pushed silver around 12% below the December 4, 2023 high of 25.90.
In the meantime, the momentum indicators are showing some early signs that the correction might have run its course. The Average Directional Movement Index (ADX) is trading sideways and thus pointing to a weakening bearish trend in the market. Similarly, the RSI is trading below its midpoint but has failed to make a lower low.
More importantly, the stochastic oscillator is moving aggressively lower towards its oversold area and building a significant gap from its moving average. However, a bullish divergence appears to have formed as the higher low in silver has been met by a lower low in the stochastic oscillator.
Should the bears still feel hungry, they could try to push silver below the October 5, 2023 ascending trendline. They could then test the support set by the busy 22.24-22.50 area, which is populated by the June 6, 2022 high and the 50% Fibonacci retracement of the March 8, 2022 – September 1, 2022 downtrend. Even lower, the 21.13-21.35 range could be the last hurdle in the bears’ attempt to test the October lows.
On the other hand, the bulls are keen on regaining market control and leading silver above the 23.12-23.49 area, which is defined by the 61.8% Fibonacci retracement, the 50-, 100- and 200-day SMAs, and the long-term September 1, 2022 trendline respectively. If successful, they could then have a go at pushing silver towards the 23.76 level.
To conclude, silver bears could be taking a breather after a strong sell-off, but the bulls with some arguable support from the momentum indicators appear ready for a rebound.
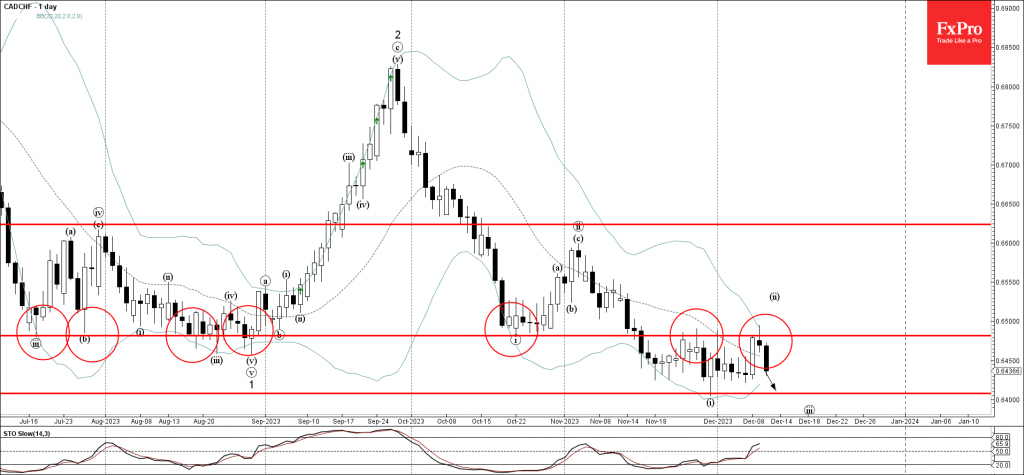
CADCHF Wave Analysis
- CADCHF reversed from resistance level 0.6490
- Likely to support level 0.6410
CADCHF currency pair recently reversed down from the strong resistance level 0.6490 (former strong support from October) intersecting with the upper daily Bollinger Band.
The downward reversal from the resistance level 0.64879 stopped the previous minor correction ii.
Given the predominant daily downtrend, CADCHF currency pair can be expected to fall further to the next support level 0.6410 (low of the previous impulse wave i).
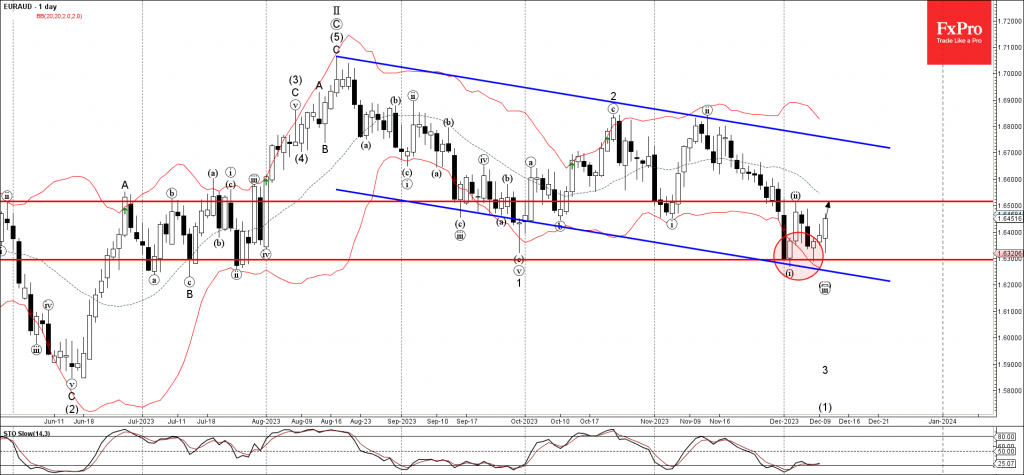
EURAUD Wave Analysis
- EURAUD reversed from key support level 1.6300
- Likely to rise to resistance level 1.6500
EURAUD currency pair recently reversed up from the key support level 1.6300 intersecting with the lower daily Bollinger Band and the support trendline of the weekly down channel from August.
The upward reversal from the support level 1.6300 stopped the previous impulse waves iii and 3.
Given the bullish divergence on the daily Stochastic, EURAUD currency pair can be expected to rise further to the next resistance level 1.650 (which stopped the earlier minor correction ii).
November CPI: Moving on to 2024
Summary
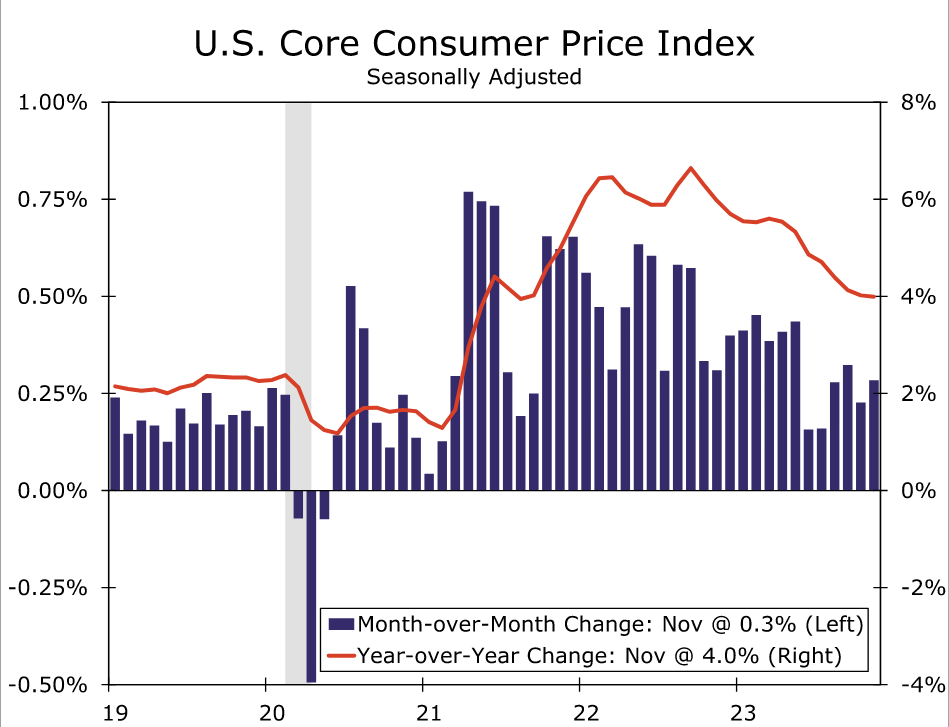
The November CPI report was relatively uneventful. Falling gasoline prices and modest food inflation restrained the headline CPI to just a 0.1% increase in the month. Excluding food and energy prices, core CPI was up 0.3%, in line with consensus expectations. Core goods prices continued to decline even as the drivers of the dip changed, while core services inflation was a bit stronger in November compared to October due to faster inflation for shelter, medical care and transportation.
The November CPI data probably do not move the needle much for the FOMC this week. Doves looking for a downside surprise did not see one materialize, but a nasty upside shock was also avoided. Looking through the month-to-month volatility, inflation continues to move back toward the Fed's 2% inflation target. That said, price growth remains far enough away from 2% that the central bank likely will not declare victory just yet. We suspect the FOMC will keep monetary policy in a holding pattern and look toward the Q1 labor market and inflation data to determine its next move. Our base case for the first rate cut remains June 2024.
Falling Gas Prices Keep CPI In Check
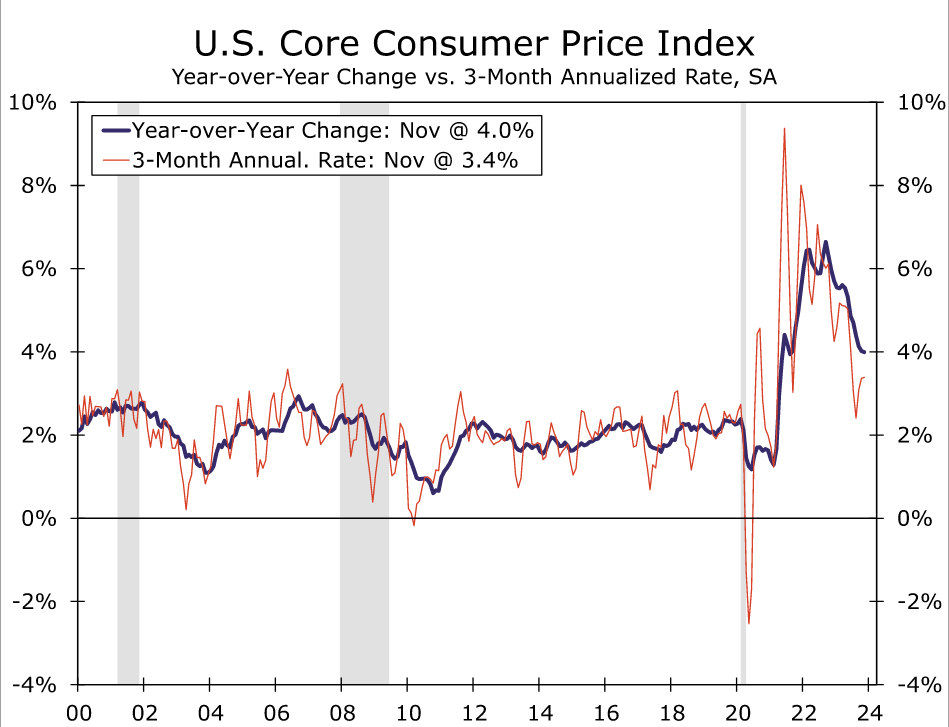
The Consumer Price Index rose 0.1% in November, a touch stronger than the Bloomberg consensus forecast. Excluding food and energy, core prices rose 0.3% during the month, in line with expectations. Compared to one year ago, headline CPI inflation was 3.1%, while the core CPI has increased by 4.0% over the same period. For context, both headline and core CPI inflation were 2.3% year-over-year in December 2019, shortly before the COVID-19 pandemic struck.
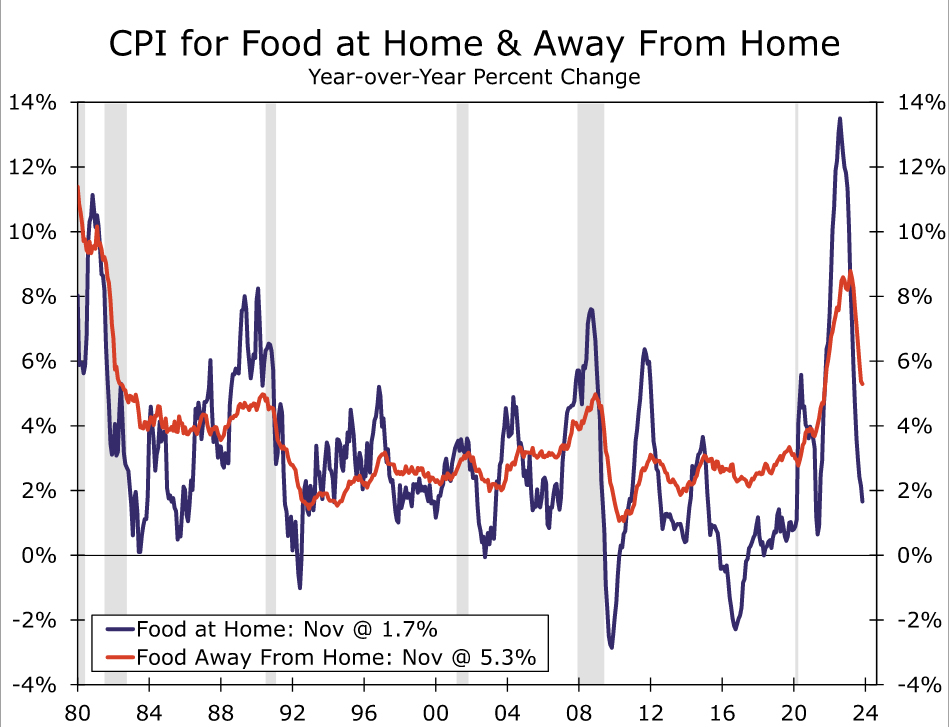
A major decline in energy prices in November kept monthly CPI inflation in check. Gasoline prices fell by 6.0% in November on the heels of a 5.0% dip in October. Energy services inflation was stronger at 1.7%, led higher by electricity prices (+1.4%) and utility gas (+2.8%). Food price inflation moderated a touch from September's pace, registering 0.2% in November. Prices for meals at restaurants continue to rise faster than prices at the grocery store, a shift from the trend that prevailed earlier in the cycle (chart).
Excluding food and energy, price growth showed little change in the recent rate of underlying inflation. Core CPI rose 0.3% in November, which kept the 3-month annualized rate unchanged at 3.4%.
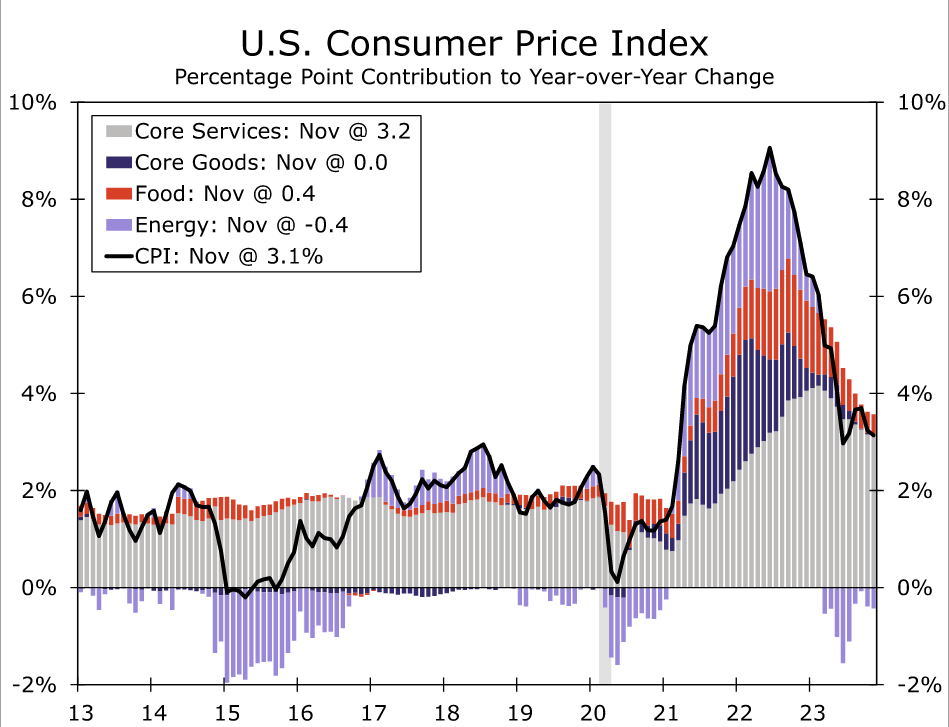
Underneath the hood, the split between core goods and services remains firmly in place. Core goods prices declined for a sixth-consecutive month. The 0.3% drop in November came despite a rise in used vehicles (+1.6%) as extended Black Friday deals helped to drive prices down for electronics (-2.7%), apparel (-1.3%), recreation goods (-0.6%) and household furnishings (-0.4%). Looking ahead, used vehicle prices look set to renew their downward trend, while prices for holiday shopping categories seem unlikely to repeat November's pace of declines. Through the ups and downs of various sub-categories, the trend in core goods prices is likely to remain modestly deflationary over the coming months, led primarily—but not entirely—by lower vehicle prices.
Core services inflation, on the other hand, firmed a bit in November, increasing 0.5% after a 0.3% gain in October. Shelter inflation continues to moderate slowly rather than sharply, with primary shelter (rent of primary residences and owners' equivalent rent) price growth edging up sequentially in November (0.5%) but continuing to move down on a year-over-year basis (6.7% after 6.9% in October). Among other services, medical care costs came in stronger, led by a rebound in physician services, while travel services (largely lodging away from home and airfares) declined less sharply. However, there were signs that the plateauing in vehicle prices is beginning to bring some relief to the rate of motor vehicle insurance price hikes (up 1.0% in November—the smallest increase since February), while motor vehicle maintenance, recreation services, tuition and other personal services also posted subdued gains relative to each category's recent monthly trend.
Economics
Overall, progress continues in getting inflation back down to the Fed's 2% target. On a year-over-year basis, CPI inflation has slowed 4.0 percentage points since November 2022. Outright declines in energy prices have put the biggest dent in inflation over the past year, but price growth has slowed for other major categories, including food, core goods, housing and other core services (chart). While the level of prices remains frustratingly higher for consumers, having grown 19% since the onset of COVID, the slowing rate of change is at least consistent with the Fed making headway toward a stable inflation environment.
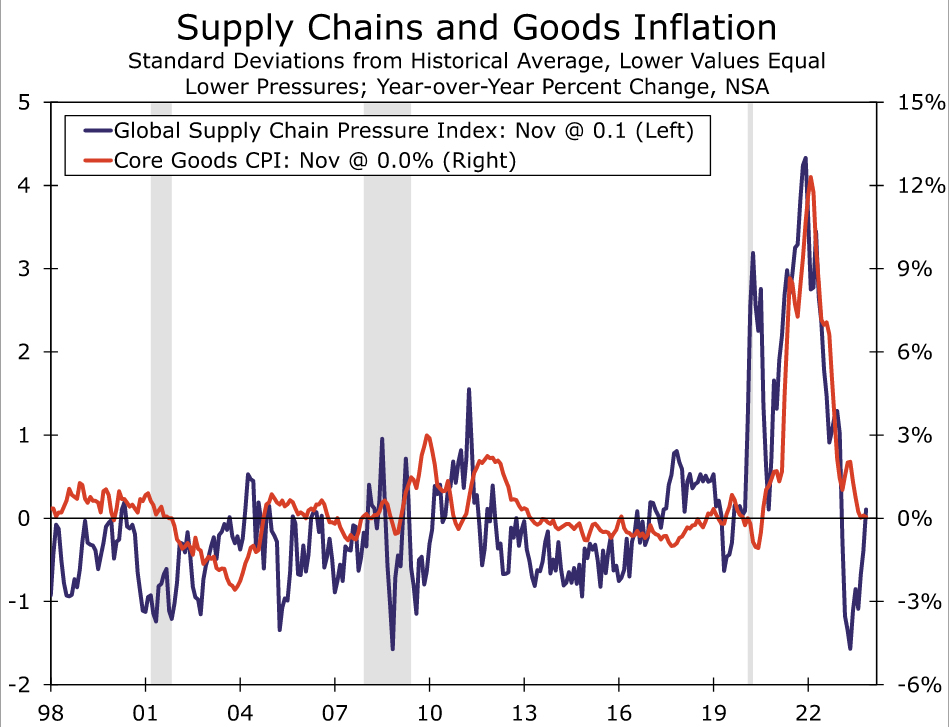
Yet even with the significant slowdown in inflation over the past year, price growth continues to run above the Fed's desired rate on both a headline and core basis. We expect inflation to slow further over the course of the coming year as demand growth weakens and improved supply dynamics limit input cost growth and feed through to consumer prices. However, progress is likely to be slower-going ahead, with the bulk of normalization to supply chains and the labor force behind us, leaving demand to take on greater importance in reducing inflation (chart).
In our view, today's CPI report probably does not meaningfully impact this week's FOMC meeting. Despite some noise underneath the headline figures, the broad takeaway is that the steady-but-bumpy downward trend in inflation remains in place. In light of this trend, we believe the FOMC will stand pat at its December meeting with an eye toward the Q1 inflation and labor market data to guide when rate cuts will be appropriate. So long as inflation continues to slow in 2024, rate cuts should materialize next year, with the pace of cuts determined by the resiliency (or lack thereof) in the U.S. labor market.
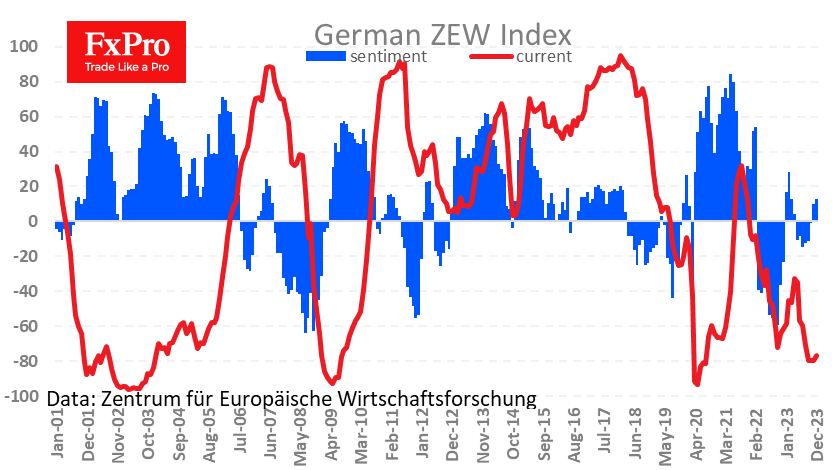
Economic Sentiment in Germany Is Improving but Slowly
Fresh business sentiment assessments from ZEW saw the sentiment index rise from 9.8 to 12.8, a positive surprise for analysts who had anticipated a slight decline to 9.6. The current optimism level is the highest since March this year but below the long-term average of 20.8.
Some signs of a reversal can be found in the assessment of current conditions. The corresponding index has risen to -77.1 after -79.9 and -79.8 in the past two months. This is a retreat from a cyclical low but is still at the depressed-low levels seen in early 2020 and 2009.
Wholesale prices fell 0.2% in November after falling 0.7% a month earlier and -3.6% y/y. Negative annual inflation rates over the past eight months have helped to reduce inflationary pressures, allowing the ECB to turn its rhetoric towards greater softness and willingness to cut rates earlier than previously expected.