Sample Category Title
Recent Inflation Data Probably Will Allow Fed to Remove a Final Rate Hike
Markets
Markets yesterday understandably started the week in a wait-and-see modus, looking forward to key eco data, including US CPI and policy meetings of the Fed, the ECB and the Bank of England later this week. One-year inflation expectations in the New York Fed’s consumer expectations survey eased slightly from 3.57% to 3.36%, the lowest level since April 2021, but were unchanged for the horizon 3-y (3.0% ) and 5-y ahead. The immediate impact on US bond trading was limited. US yields trended higher ahead of a $50 bln 3-y Treasury Note auction and a $37 bln 10-y note sale. Both auctions only attracted mediocre investor interest. Still yields finally trended south again after the auctions were out of the way. US yields changed between -1.3 bps (2-y) and +2.3 bps (30-y). German yields also altered less than 2 bps across the curve. Expectations for easier financial conditions continue to support equities. The Dow and the S&P 500 touched now top levels for 2023. The Nasdaq set a 2023 closing high. On FX market headlines/speculation on whether or the BOJ will change its ultra-easy policy anytime soon still were an important driver for trading. Bloomberg comments said that BOJ officials considered it too early to already leave the era of sub-zero rates. USD/JPY throughout the day rebounded to the mid 146 area to close at 146.18. Gains in the DXY index (close 104.1) were limited and technically insignificant. EUR/USD even closed little changed at 1.0765. Sterling tested the EUR/GBP 0.8550 area, but a sustained break again didn’t occur.
Today, the US November CPI release will take center stage. Headline inflation is expected unchanged on the month with the Y/Y measure to ease from 3.2% to 3.1%. The consensus expects core inflation at 0.3% M/M and 4.0% Y/Y (from 0.2% and 4.0% previous month). We assume that a big surprise in either direction will be needed to trigger a big/sustained market reaction going to tomorrow’s Fed policy decision. In the meantime, we look out whether the bottom in yields set last week might become more solid. The recent inflation data probably will allow Fed governors in the dots to remove a final rate hike. Question now is how much room for rate cuts they see in 2024. A maximum of 50 bps expected rate cuts might help to trigger some consolidation on the recent decline in yields. Such a scenario might also put a floor for the dollar. In Europe, we look out whether ZEW German investor confidence might bring some good/less negative news.This morning, UK November labour market data printed on the soft side of expectations. Payrolled employees declined 13k compared to the previous month and there was a slowdown in the October average weekly earnings (7.2% from 8.0% vs 7.7% expected overall; 7.3% from 7.8% vs 7.4% expected ex bonus). EUR/GBP currently gains about 10-15 ticks to trade near 0.857.
News & Views
The Polish parliament yesterday appointed Donald Tusk as the new prime minister in a 248-201 vote. It did so after outgoing PM Morawiecki lost a vote of confidence a few hours earlier, effectively bringing eight years of PiS rule to an end. Tusk’s centre-right and pro-European Civic Plaftorm, a coalition of opposition parties, won the elections in October. But the PiS being still the biggest single party was given a first shot by president Duda to try to secure another term in office even as key potential partners to form a majority ruled out working together in advance. Duda is a PiS appointee and is said to have helped stalling Tusk’s nomination. He’s also seen as the biggest threat to Tusk’s legislative agenda due to its veto powers. The president on Monday left for a two-day visit to Switzerland, meaning Tusk only can be signed into office upon his return tomorrow. The incoming prime minister will nevertheless present his government and its programme in parliament later today and attend a EU summit later this week.
Indian authorities recently banned onion exports, restricted the use of sugar for ethanol production and cut the size of wheat stocks traders and retailers are allowed to hold. This comes on top of other export restrictions on rice, wheat and sugar that were already in place and have helped sent global prices materially higher amid weather-related supply disruptions in other major producers as well. Despite a recent correction, sugar prices are at multiyear highs. Rice in recent weeks is being sold for prices well above historical averages. India’s decision is seen in light of next year’s general elections with the Modi government trying to dampen domestic prices in the run-up.
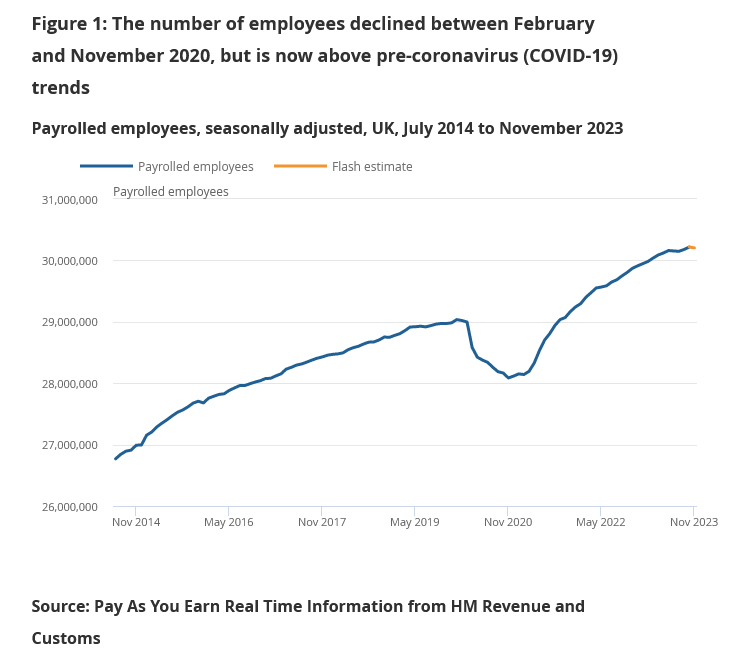
UK payrolled employment fell -13k in Nov, unemployment rate steady at 4.2% in Oct
UK payrolled employment fell slightly by -13k in November, compared with October. Comparing with November 2022, payrolled employment rose 1.1% yoy or 333k. Meanwhile monthly pay increased by 5.3% yoy, slowed from 6.2% yoy.
In the three months to October, unemployment rate was unchanged at 4.2% yoy. Average earnings (including bonus) growth slowed from 8.0% yoy to 7.2% yoy, below expectation of 7.7% yoy. Average earnings (excluding bonus) growth slowed from 7.7% yoy to 7.3% yoy, below expectation of 7.4% yoy.
Nikkei Strong Reaction Higher From The Equal Legs Area
In this technical blog, we will look at the past performance of the 4-hour Elliott Wave Charts of Nikkei. We presented to members at the elliottwave-forecast. In which, the rally from 04 October 2023 low unfolded as an impulse structure. And showed a higher high sequence favored more upside extension to take place. Therefore, we advised members not to sell the $NKD_F & buy the dips in 3, 7, or 11 swings. We will explain the structure & forecast below:
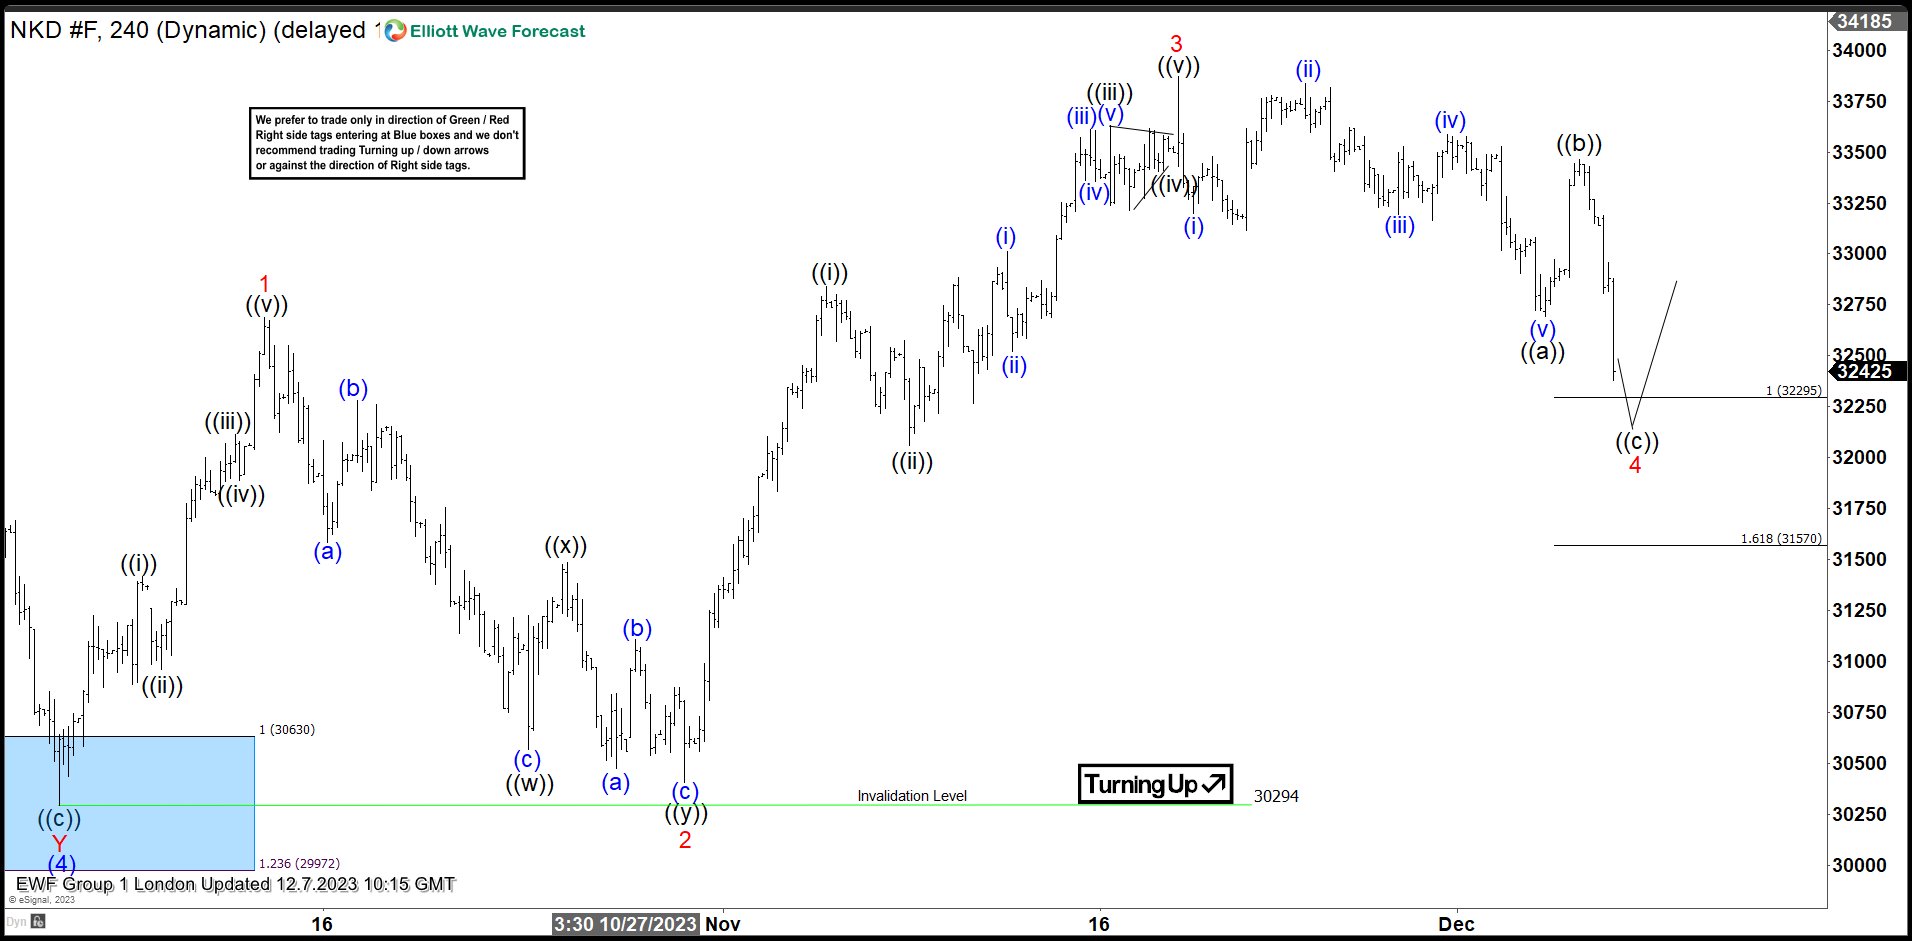
Nikkei 4-Hour Elliott Wave Chart From 12.07.2023
Here’s the 4-hour Elliott wave chart from the 12/07/2023 London update. In which, the cycle from the 10/30/2023 low ended in wave 3 as an impulse structure at 33870 high. Down from there, the index made a pullback in wave 4 to correct that cycle. The internals of that pullback unfolded as Elliott wave zigzag structure where wave ((a)) at 32695 low. Wave ((b)) ended at 33465 high and wave ((c)) managed to reach the equal legs area at 32295- 31570 area. From there, buyers were expected to appear looking for the next leg higher or for a 3-wave bounce minimum.
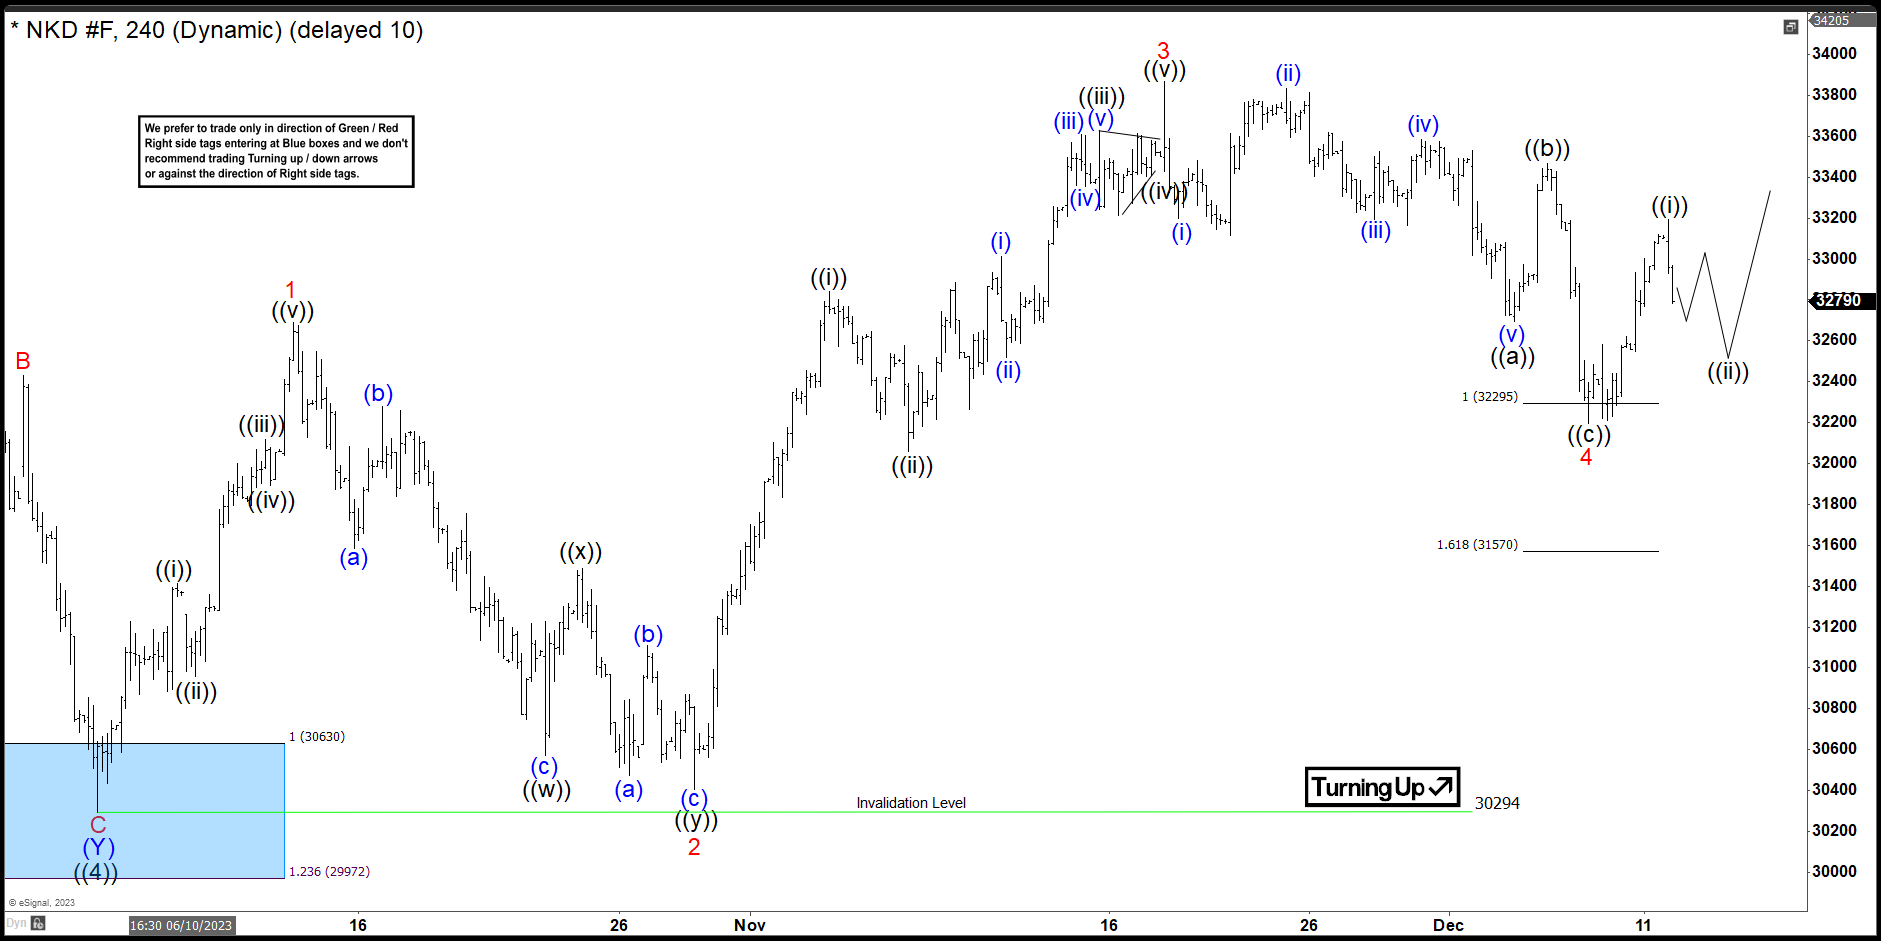
Nikkei Latest 4-Hour Elliott Wave Chart
This is the latest 4-hour Elliott wave Chart update. In which the Nikkei is showing a strong reaction taking place, right after ending the zigzag correction within the equal legs area. Allowed members to create a risk-free position shortly after taking the long position. However, a break above the 33870 high is still needed to confirm the next extension higher & avoid a double correction lower.
GBP/JPY Daily Outlook
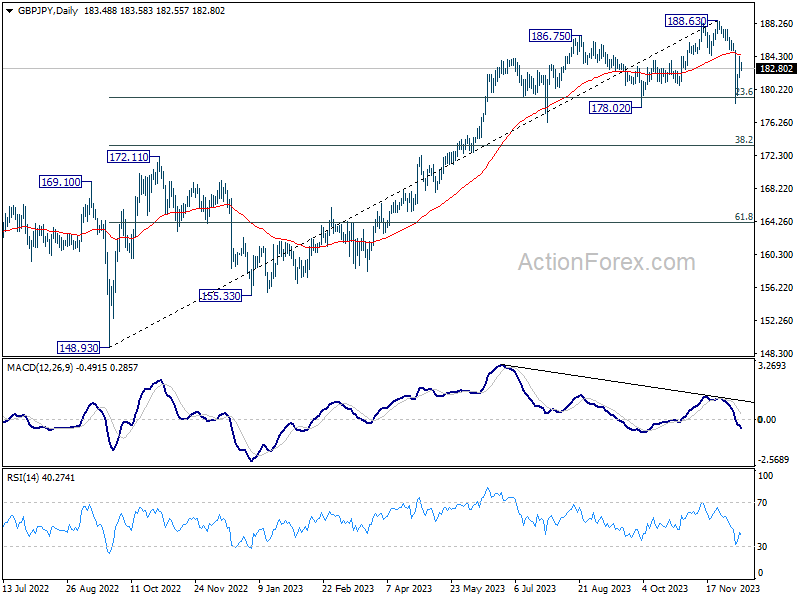
Daily Pivots: (S1) 182.01; (P) 183.17; (R1) 184.68; More...
Intraday bias in GBP/JPY is turned neutral first with current retreat. On the downside, break of 181.66 minor support will suggest that rebound from 178.58 has completed. Intraday bias will be back to the downside for retesting 178.58 low. Overall outlook will stay bearish as long as 184.44 support turned resistance support turned resistance holds.
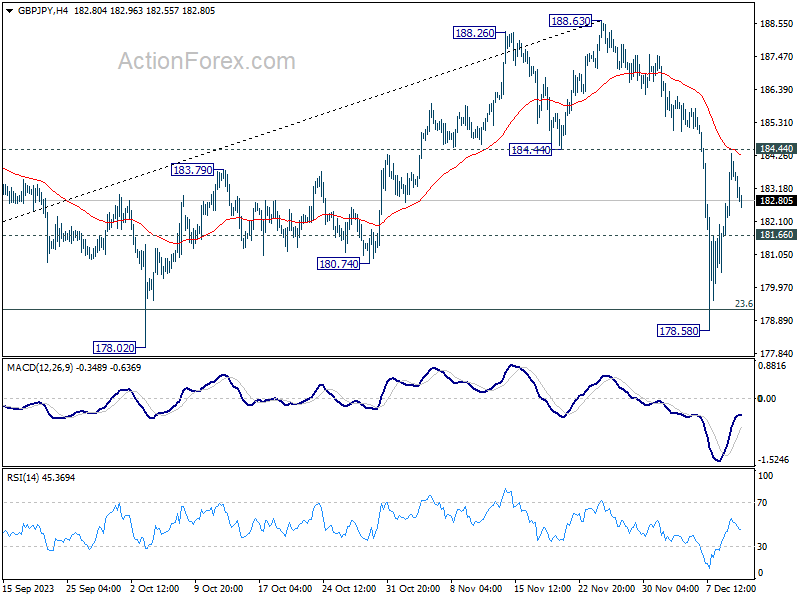
In the bigger picture, while a medium term top is in place at 188.63, there is no clear sign of long term bearish trend reversal yet. As long as 55 W EMA (now at 175.67) holds, price actions from 188.63 are seen as a corrective move only. Larger up trend from 123.94 (2022 low) could resume at a later stage.
EUR/JPY Daily Outlook
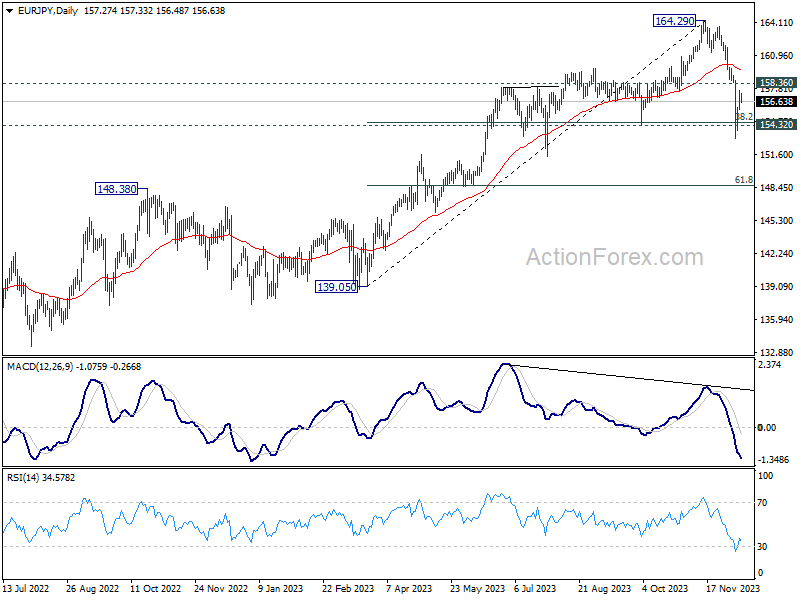
Daily Pivots: (S1) 156.26; (P) 156.98; (R1) 158.04; More..
While EUR/JPY's recovery from 153.15 could extend higher, upside should be limited below 158.36 minor resistance to bring another fall. On the downside, below 155.98 will turn bias to the downside for retesting 153.15. Break of 153.15 and sustained trading below 38.2% retracement of 139.05 to 164.29 at 154.64 will target 61.8% retracement at 148.69 next.
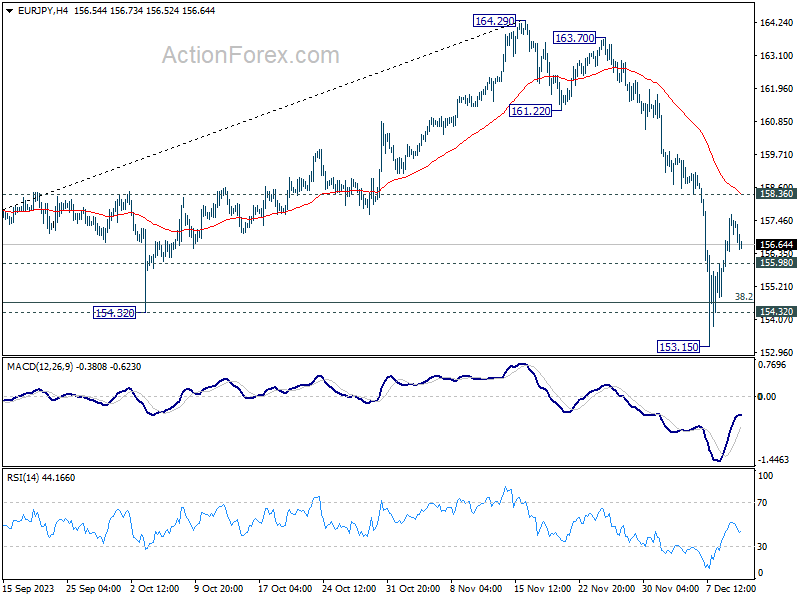
In the bigger picture, price actions from 164.29 medium term top are tentatively seen as a correction to rise from 139.05 for now. As long as 148.48 resistance turned support holds (2022 high), larger up trend from 114.42 (2020 low) could still resume through 164.29 at a later stage.
EUR/GBP Daily Outlook
Daily Pivots: (S1) 0.8552; (P) 0.8570; (R1) 0.8591; More....
EUR/GBP is still bounded in sideway consolidation despite brief dip to 0.8548. Intraday bias remains neutral at this point. IN case of another recovery, upside should be limited below 0.8648 support turned resistance to bring another decline. Below 0.8548 will target 0.8491 low first. Firm break there will resume larger down trend.
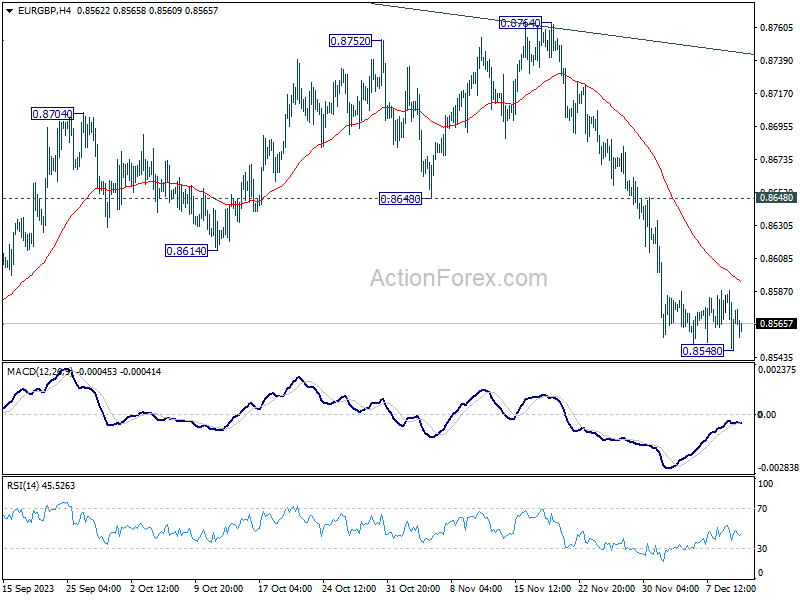
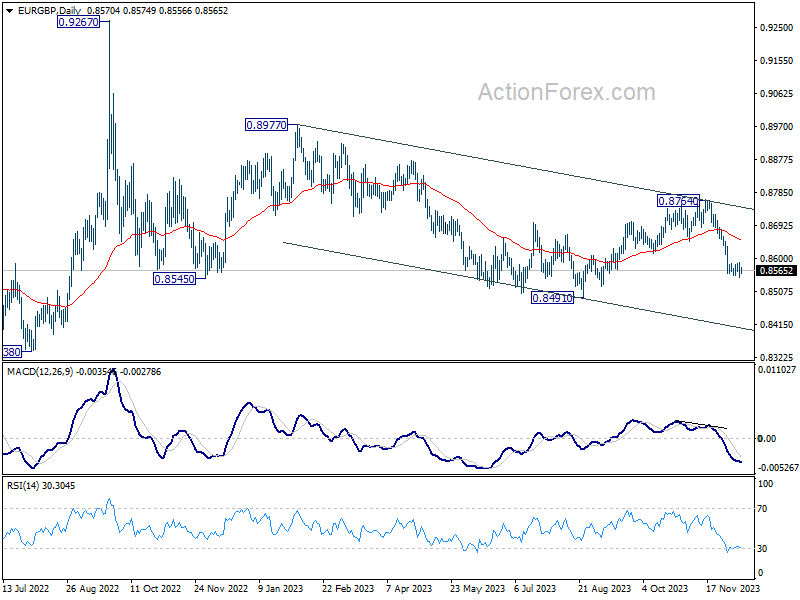
In the bigger picture, current development suggests that down trend from 0.9267 (2022 high) is still in progress. This decline is seen as the third leg of the pattern from 0.9499 (2020 high). Break of 0.8201 will target 100% projection of 0.9499 to 0.8201 from 0.9267 at 0.7969. In any case, outlook will stay bearish as long as 0.8764 resistance holds.
USD/JPY Technical: Potential JPY Bullish Pressure Reasserts
- The 2-day rebound seen in USD/JPY has reached 146.20/70 minor resistance zone.
- The movement of USD/JPY in the past month has a significant direct correlation with the US 10-year Treasury/10-year JGB yield spread.
- The short-term to medium-term trends of the US 10-year Treasury/10-year JGB yield spread remain bearish.
- Watch the 146.70 key short-term resistance on USD/JPY.
USD/JPY has rebounded and hit the short-term resistance zones of 144.80/145.30 and 146.20/70 as highlighted in our previous analysis reinforced by the better-than-expected US non-farm payrolls data for November and a media report released yesterday, 11 December that stated the Bank of Japan (BoJ) officials were in no rush to scrap short-term negative interest in the upcoming 18 to 19 December monetary policy meeting according to sources.
This latest set of “BoJ’s monetary policy thought process” reported by the media contrasted with the hawkish remarks made by BoJ Governor Ueda and Deputy Governor Himino last week that increased market speculations that the decade-plus of short-term negative interest rate policy in Japan may be scrapped sooner than expected.
The USD/JPY extended its gains from last Friday and rallied by +0.86% to print an intraday high of 146.59 as seen in yesterday’s 11 December US session on the backdrop of the media report.
It’s all about the yield spread between the US 10-year Treasury & 10-year JGB
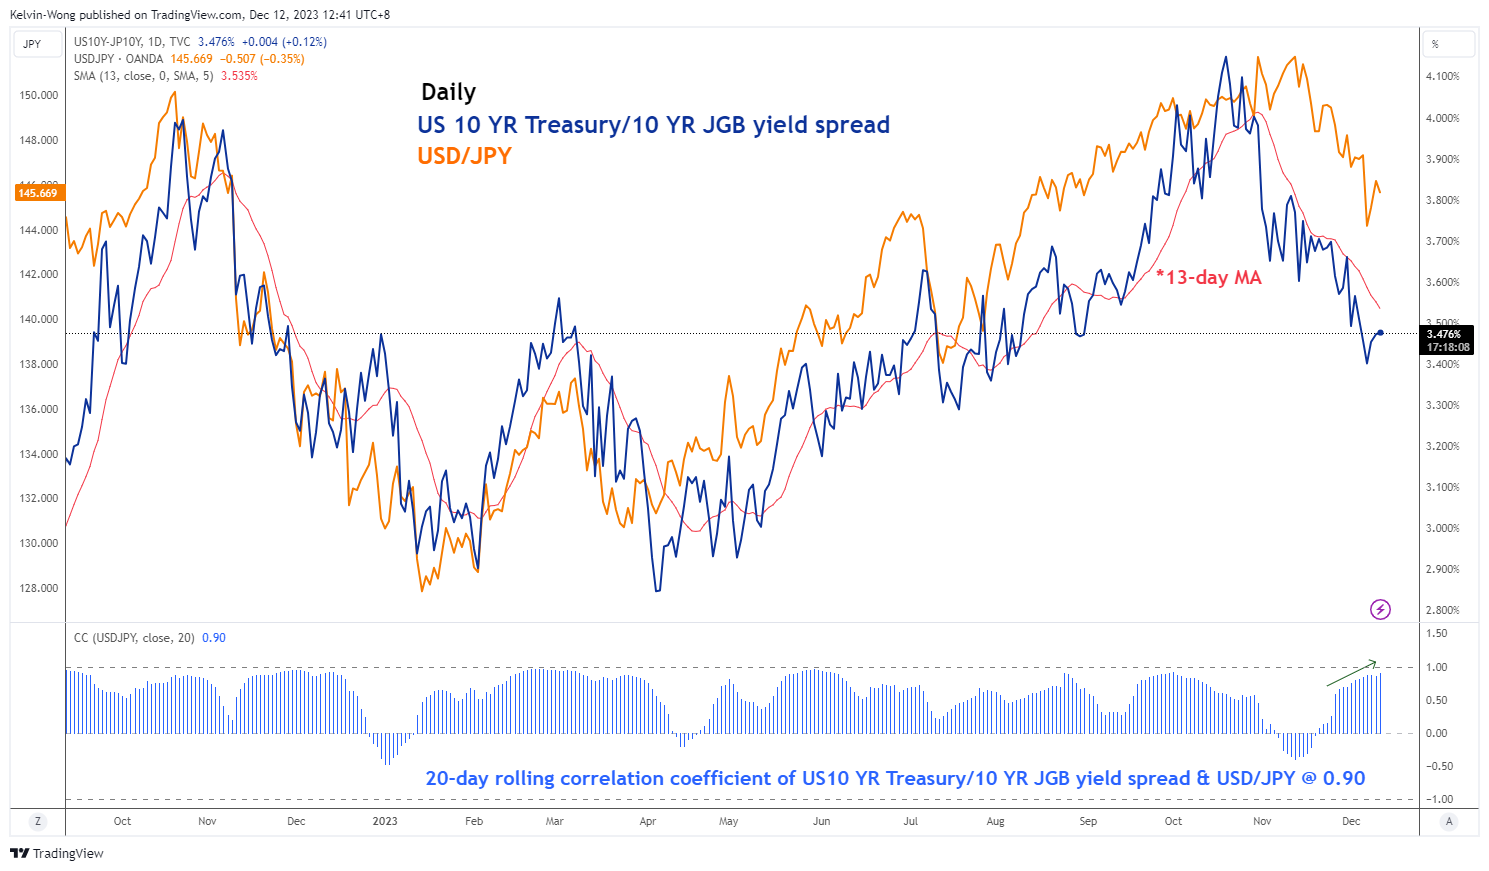
Fig 1: Movement of USD/JPY and US 10-year Treasury/10-year JGB yield spread as of 12 Dec 2023 (Source: TradingView, click to enlarge chart)
Interestingly, the movement of the USD/JPY in the past month has moved in sync with the yield spread of the US 10-year Treasury/10-year Japanese government bonds (JGB) which can be considered as an indirect summation net effect of monetary policy guidance from the Fed and BoJ.
Their current 20-day rolling correlation coefficient is at 0.90 which suggests that the movement of the US 10-year Treasury/10-year JGB yield spread has a significant direct influence on the movement of the USD/JPY.
If the US 10-year Treasury/10-year JGB yield spread compressed (inched downwards), the movement of the USD/JPY reflected a similar directional move on the downside and vice versus if the yield spread expanded to the upside.
Overall, the short to medium-term trend phases of the US 10-year Treasury/10-year JGB yield spread is still bearish as it continues to trend below its downward sloping 13-day moving average. Hence, it may put further downside pressure on the USD/JPY.
USD/JPY’s recent minor rally may have exhausted
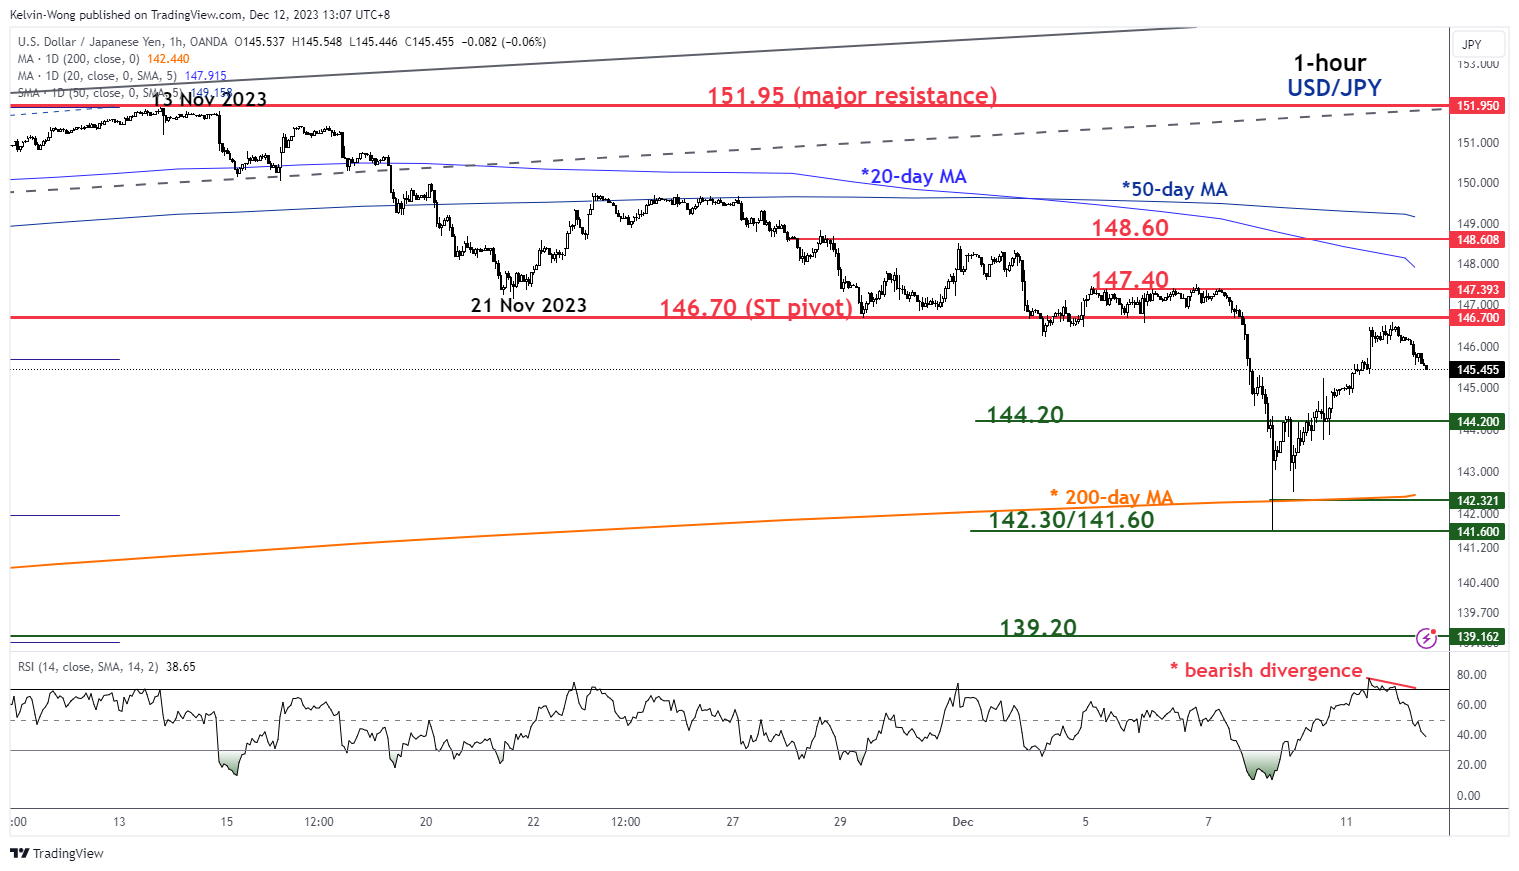
Fig 2: USD/JPY short-term minor trend as of 12 Dec 2023 (Source: TradingView, click to enlarge chart)
The price actions of the USD/JPY have staged a bearish reaction after 2-day of counter-trend rebound at the 146.70 short-term pivotal resistance (former minor swing lows area of 4/5 December 2023 & 50% Fibonacci retracement of the prior minor downtrend phase from 13 November 2023 high to 7 December 2023 low).
In addition, the hourly RSI momentum indicator has flashed out a bearish divergence condition at its overbought condition during yesterday’s US session which suggests that the bullish momentum of the 2-day rally is likely to be exhausted.
Near-term support will be at 144.20 and a break below it exposes the next intermediate support zone of 142.20/141.60 (coincides with the 200-day moving average).
On the flip side, a clearance above 146.70 sees a potential extension of the counter-trend rebound towards the medium-term resistance zone of 147.40/148.60 (coincides with the downward sloping 20 and 50-day moving averages).
All Eyes on US Inflation
The Stoxx 600 and the S&P500 traded at a fresh ytd high on Monday as the British FTSE 100 lagged behind its Western peers, as mining stocks drove the index lower. But overall, the week started on an optimistic note ahead of today’s US inflation update, tomorrow’s FOMC decision and Thursday’s European Central Bank (ECB) and Bank of England (BoE) decisions. The US 2-year yield advanced to 4.77% and the 10-year yield tested the 4.30% resistance, but both are down this morning, as bond investors lie in ambush before the US inflation update that will hit the headlines in a couple of hours from now.
All eyes on US CPI
Headline CPI in the US is expected to have steadied on a monthly basis thanks to subdued energy prices and the yearly figure may have eased from 3.2% to 3.1% in November. Core inflation is seen steady at 4%. These numbers certainly look much better than what they did back in 2022, when we saw the US core inflation reach 6.6%. But at 4%, core inflation in the US is still twice the Federal Reserve’s (Fed) 2% policy target. And as the Fed Chair Powell will certainly say tomorrow, there is an encouraging progress in the Fed’s fight against inflation, but the job is not done just yet.
But because the whole monetary policy tightening is here to fight inflation, a softer-than-expected set of inflation figures could further boost the Fed doves and appetite in US bonds, but gains will likely remain limited before tomorrow’s Fed decision and economic forecasts. Although the Fed is happy with the current results – weakening inflation despite a healthy loosening in the job market and quite a resilient growth – Powell won’t cry victory on inflation and pop the champagne this week. If he did, the sovereign bond party would get out of control. The latter would send yields collapsing and loosen the financial conditions before time and interfere with the Fed’s plans to bring inflation down to 2%. Therefore, the chances are that the Fed will sound happy but cautious, no matter what we see in inflation print today.
Activity in Fed funds futures assesses 80% chance for a May rate cut and nearly 50% chance for a March rate cut. This week’s inflation data and Fed comments will shift these expectations toward one way or the other, but Powell will sure find it harder to control market optimism if headline inflation eased below the 3% psychological target, into the 2% waters… as yes, at 2 and something percent, we get really closer to the 2% target.
Calm down, says BoJ
The US dollar sees resistance near the top of its November-to-now downtrending channel, the EURUSD waits around its 100-DMA to find a fresh direction, as the USDJPY trades around the 145 level, having priced out a good number of expectations of an imminent rate hike next week, as the Bank of Japan (BoJ) officials already killed the idea that a rate hike will happen this month. But the BoJ will hike sooner rather than later, and that makes a short USDJPY a good trade, for those who are patient enough. From now on, any price recoveries in the USDJPY will be interesting opportunities to strengthen short USDJPY positions for top sellers. Note that a stronger yen and a tighter monetary policy is not positive for stock valuations, therefore we could see the Japanese Nikkei 225 index drift lower as the hawkish BoJ expectations strengthen into next year.
In the energy space, US crude is gently recovering toward the $72pb level on threats that OPEC would extend and deepen cuts in case the selloff continued, but on the other hand, the industry news doesn’t help bring the bulls in. Freshly announced, Occidental agreed to buy CrownRock for about $10bn to extend its presence in the Permian Bassin. Consolidation in the Permian Bassin means synergy, scale economies and eventually lower production costs. The deal – which is set to close early 2024 – will help drive shale prices to levels not seen since the pandemic crushed oil markets, according to Bloomberg news. Just saying.
EUR/AUD Daily Outlook
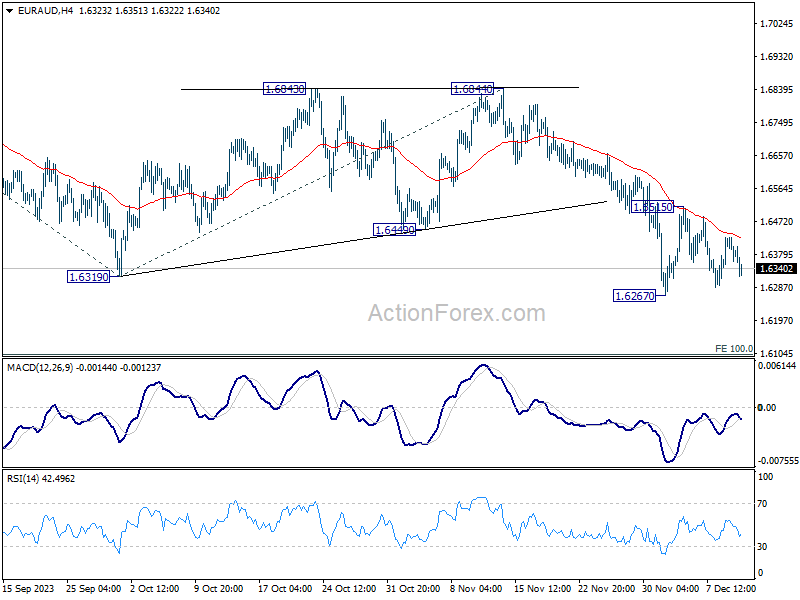
Daily Pivots: (S1) 1.6348; (P) 1.6389; (R1) 1.6431; More...
EUR/AUD is still bounded in consolidation from 1.6267 and intraday bias remains neutral. Outlook will stay bearish as long as 1.6515 resistance holds. On the downside, break of 1.6267 will resume the whole decline from 1.7062 to 100% projection of 1.7062 to 1.6319 from 1.6844 at 1.6106 next. However, break of 1.6515 resistance will turn bias back to the upside for stronger rebound.
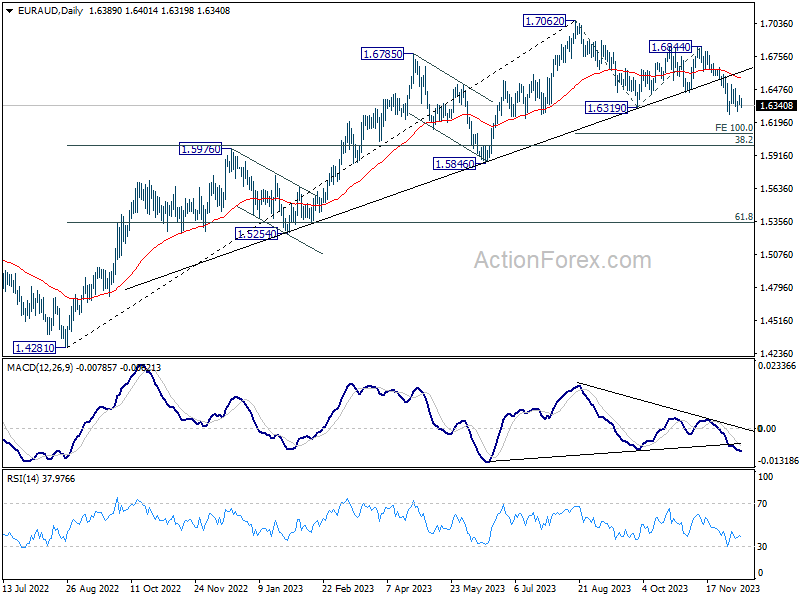
In the bigger picture, fall from 1.7062 medium term top is seen as correcting the whole up trend from 1.4281 (2022 low). Deeper decline would be seen to 38.2% retracement of 1.4281 to 1.7062 at 1.6000. Strong support could be seen there to bring rebound on first attempt. But risk will stay on the downside as long as 1.6844 resistance holds. Sustained break of 1.6000 would bring further fall to 61.8% retracement at 1.5343.
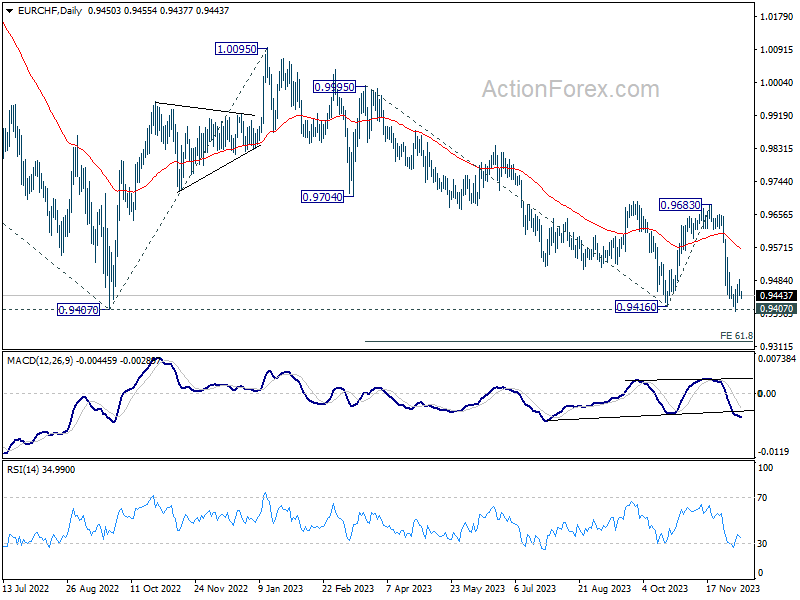
EUR/CHF Daily Outlook
Daily Pivots: (S1) 0.9439; (P) 0.9463; (R1) 0.9480; More...
Intraday bias in EUR/CHF stays neutral at this point, as consolidation from 0.9402 might extend further. Overall outlook stays bearish as long as 0.9543 resistance holds. On the downside, decisive break of 0.9407 will confirm larger down trend resumption.
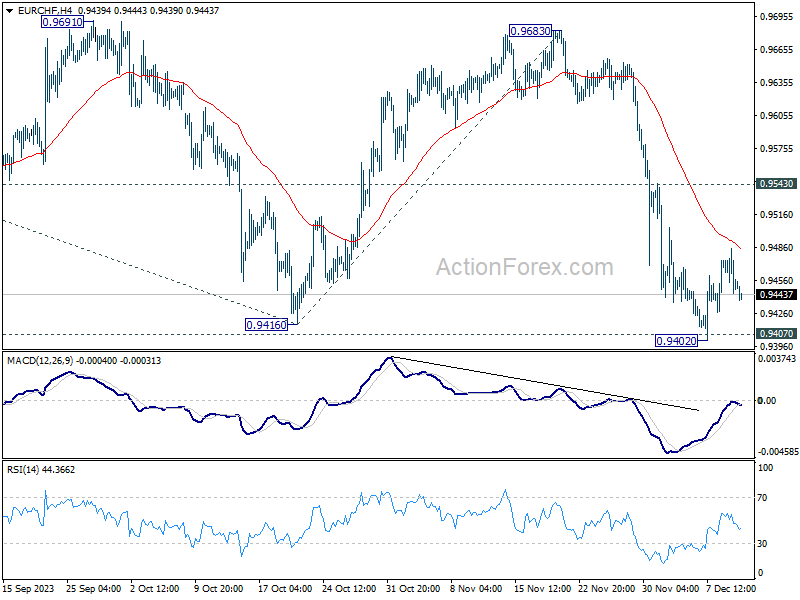
In the bigger picture, medium term outlook remains bearish as long as 0.9683 resistance holds. Firm break of 0.9407 (2022 low) will resume long term down trend. Next target will be 61.8% projection of 1.1149 (2020 high) to 0.9407 from 1.0095 at 0.9018.