Sample Category Title
Australian Dollar on a Roller-Coaster, US NFP Looms
- Australian dollar steady after sharp gains on Thursday
- US nonfarm payrolls expected to climb to 180,000
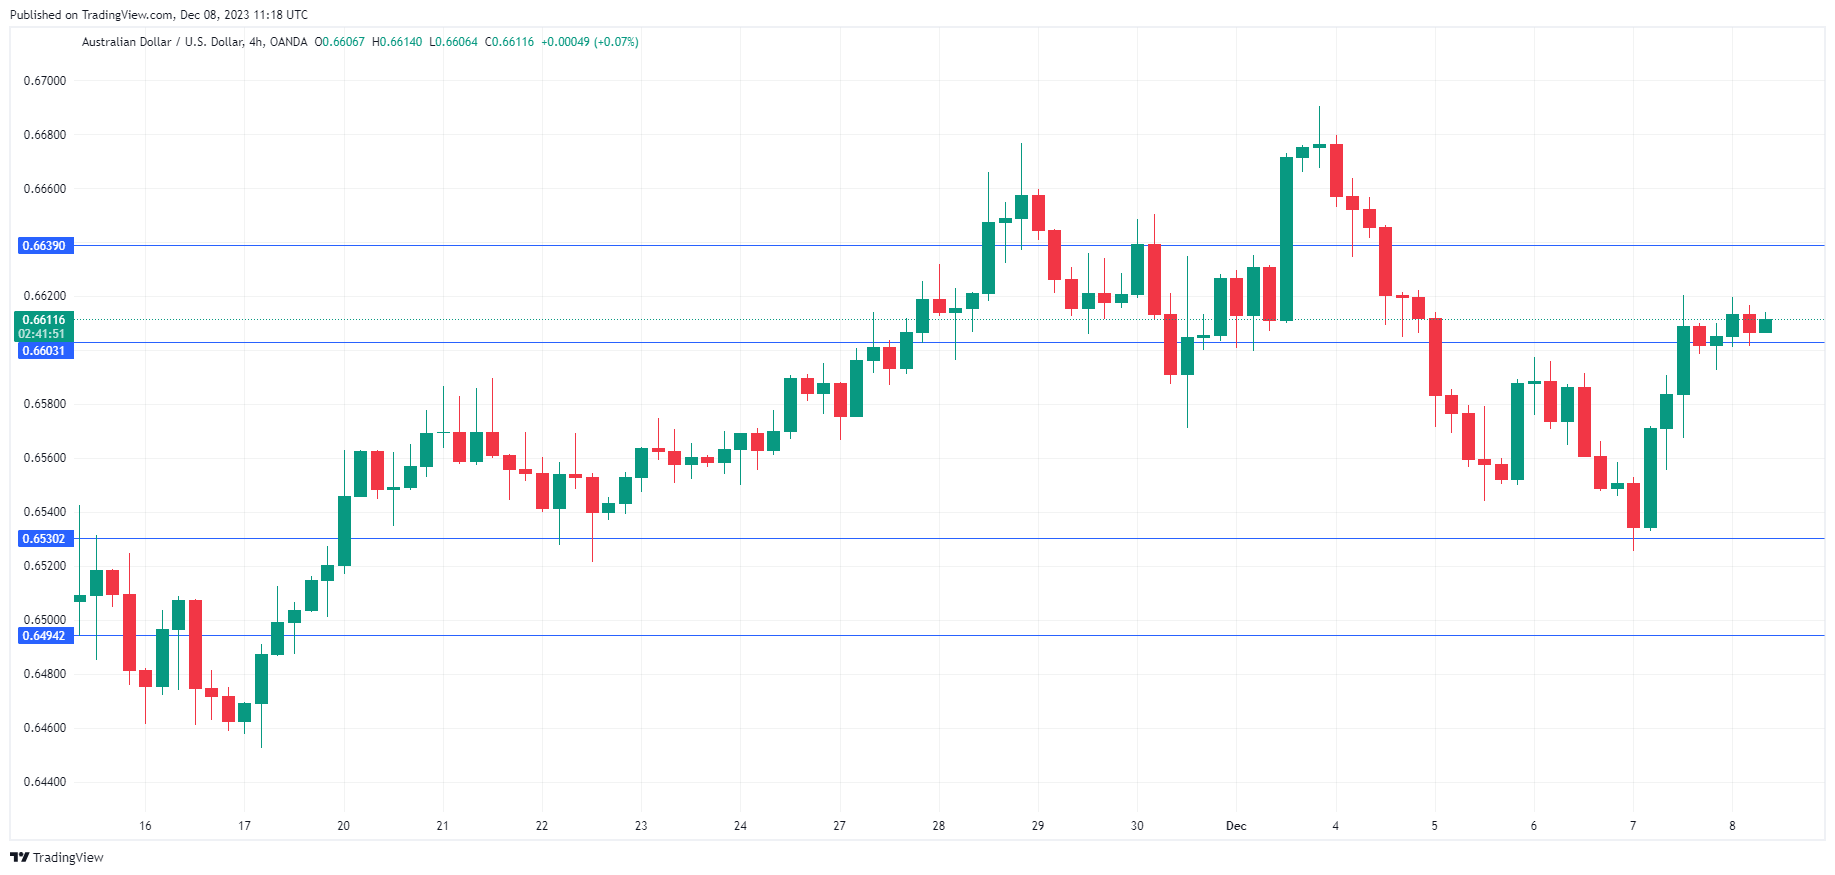
The Australian dollar is trading quietly on Friday. In the European session, AUD/USD is trading at 0.6611, up 0.14%.
It has been a roller-coaster week for the Australian dollar. After declining 1.88% early in the week, the Aussie rebounded on Thursday and gained 0.80%. Today’s US nonfarm payrolls report could result in further volatility from the Australian dollar in today’s North American session.
US nonfarm payrolls expected to rise
All eyes are on the US nonfarm payroll release later today. After falling sharply in October to 150,000 from a revised 297,000, nonfarm payrolls are expected to rebound to 180,000. If nonfarm payrolls are weaker than expected, speculation of a Fed rate cut will rise, while a hot report would undermine market confidence that a rate hike isn’t too far away.
Outside the headline data, average hourly earnings will be closely watched, as wage growth is a key driver of inflation. The consensus estimate for average hourly earnings in November stands at 0.3% m/m, compared to 0.2% in October. A higher-than-expected reading could generate a market reaction and give the US dollar a lift.
Australia’s largest trading partner is China and the slowdown in the world’s second-largest economy will likely dampen Australia’s economy. China’s economic woes were reflected in this week’s Australian GDP, which posted a weak 0.2% gain for the third quarter, compared to the 0.4% gain in Q2. Notably, exports dropped for the first time since Q1 2022.
China’s economic slowdown has resulted in disinflationary pressures. Chinese CPI decreased 0.1% in October and another 0.1% decline is expected in the November release on Saturday. If China’s economy continues to weaken, demand for Australian exports could fall even further and that could weigh on the Australian dollar.
AUD/USD Technical
- AUD/USD is testing resistance at 0.6603. Above, there is resistance at 0.6639
- 0.6530 and 0.6494 are providing support
BoE survey reveals lower public inflation expectation
The latest Bank of England/Ipsos quarterly Inflation Attitudes Survey show inflation expectations decreased in the near term. There's also a shift in public sentiment towards a more balanced view of the economic situation in the UK, with decreasing number of people expecting further interest rate hikes and an increasing number advocating for stability or reduction in rates.
Median expectation for inflation over the coming year has decreased to 3.3%, down from 3.6% in August 2023. This decline suggests a growing optimism among respondents about the easing of inflationary pressures in the near term. However, when considering the twelve months following that period, expectations remain unchanged at 2.8%, indicating that respondents anticipate a stabilization of inflation rates in the longer term.
Regarding the future path of interest rates, there has been a notable shift in public opinion. Only 44% of respondents now expect rates to rise over the next 12 months, a significant decrease from the 63% who held this view in August. Conversely, 29% expect rates to stay about the same, up from 19%.
When asked about what would be "best for the economy", only 11% of respondents suggested that rates should "go up", down from 13%. Meanwhile, the proportion of respondents who believe that interest rates should "go down" remains steady at 40%, and those who think rates should "stay where they are" have increased to 29% from 26%.
Euro Flat as German Inflation Declines
- German inflation confirmed at -0.4%
- US nonfarm payrolls project to accelerate to 180,000
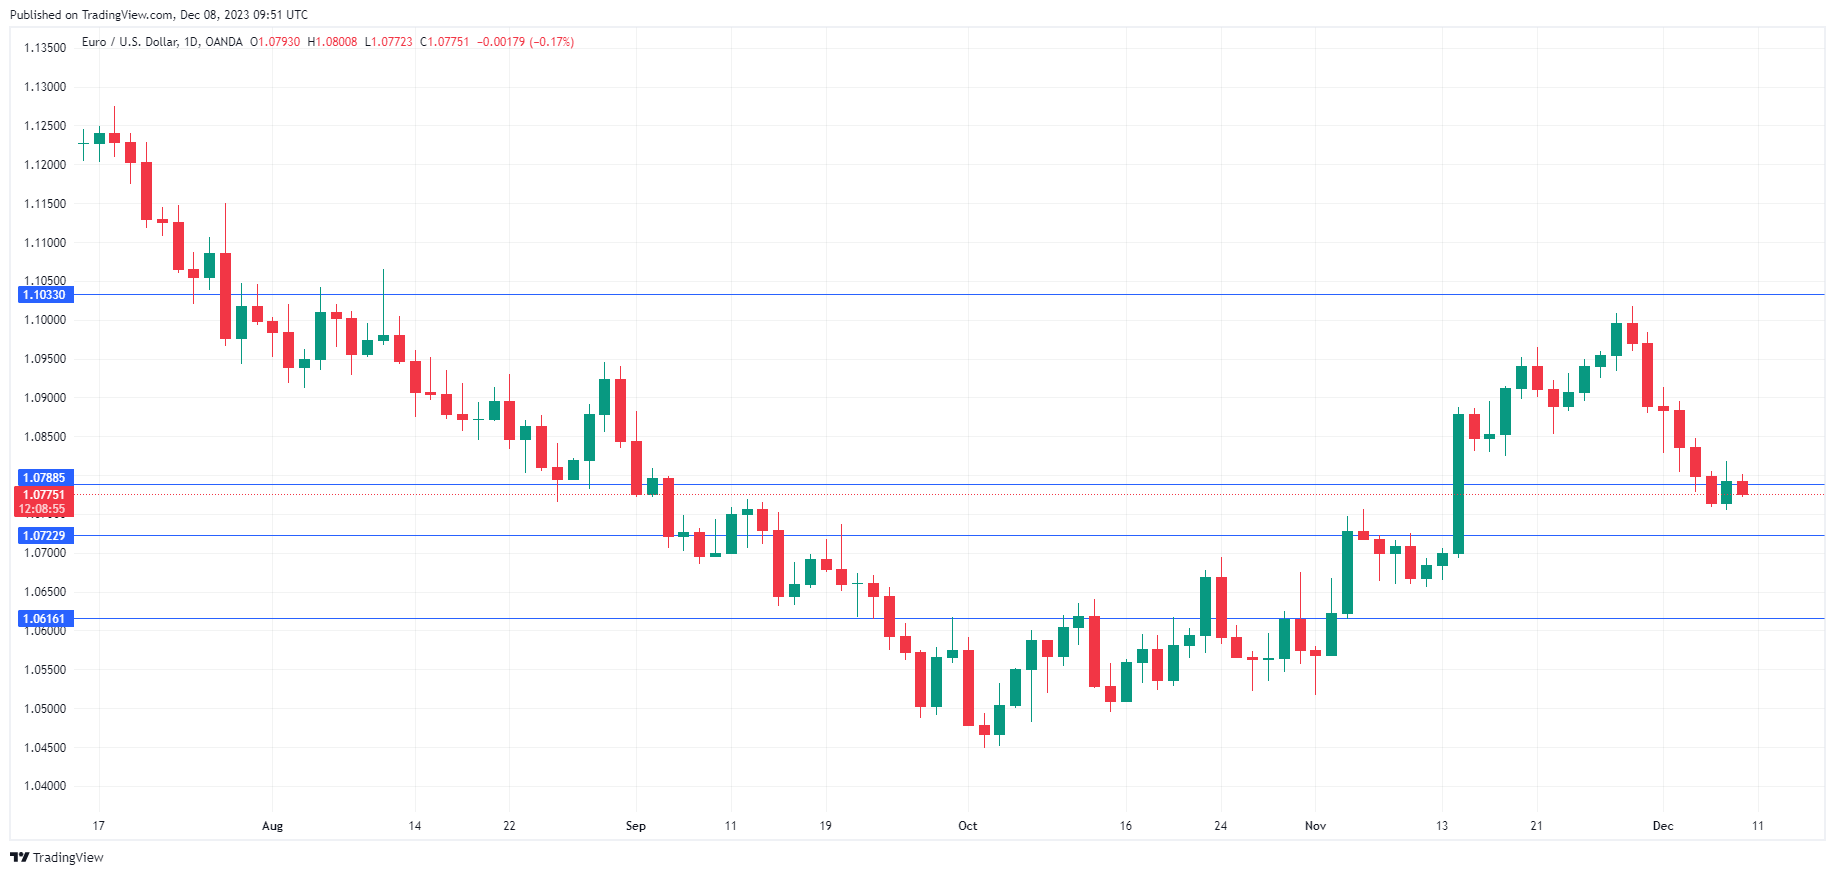
The euro has edged lower on Friday. In the European session, EUR/USD is trading at 1.0774, down 0.17%. The euro has struggled lately against the US dollar and has slipped 2.2% since November 28.
German inflation confirmed at -0.4%
Germany’s economy is sputtering, so much so that the once proud economic powerhouse is being called the sick man of Europe. Germany boasts the largest economy in the eurozone, and it will be difficult for the eurozone to recover unless Germany recovers from its current malaise. Weak economic conditions have pushed inflation lower and German CPI was confirmed at -0.4% in November, down from no growth in October and matching the consensus estimate. On an annualized basis, CPI eased to 3.2% in November, down from 3.8% in October and matching the consensus estimate.
The fall in inflation is good news for the ECB, as curbing inflation is its number one priority. Eurozone inflation fell to 2.4% in November, down from 2.9% a month earlier and below the market forecast of 2.7%. Core CPI dropped to 3.6% from 4.2% and the positive data has fuelled expectations of a rate cut by the ECB in 2024. The central bank has pushed back against talk of rate cuts and has said it will continue its “higher for longer” rate policy, which means there is a significant disconnect between the central bank and the markets.
Will nonfarm payrolls accelerate?
All eyes are on the US nonfarm payroll release later today. After falling sharply in October to 150,000 from a revised 297,000, nonfarm payrolls are expected to rebound to 180,000. A soft nonfarm payroll report will fuel speculation of a Fed rate cut, which could push the US dollar lower in today’s North American session.
EUR/USD Technical
- There is resistance at 1.0788 and 1.0822
- 1.0722 and 1.0615 are providing support
Yen Pushes Higher, GDP Softer than Expected
- Japan’s Q3 GDP revised lower to -2.9%
- Japanese yen gains ground but can’t consolidate
- US nonfarm payrolls expected to rise to 180,000
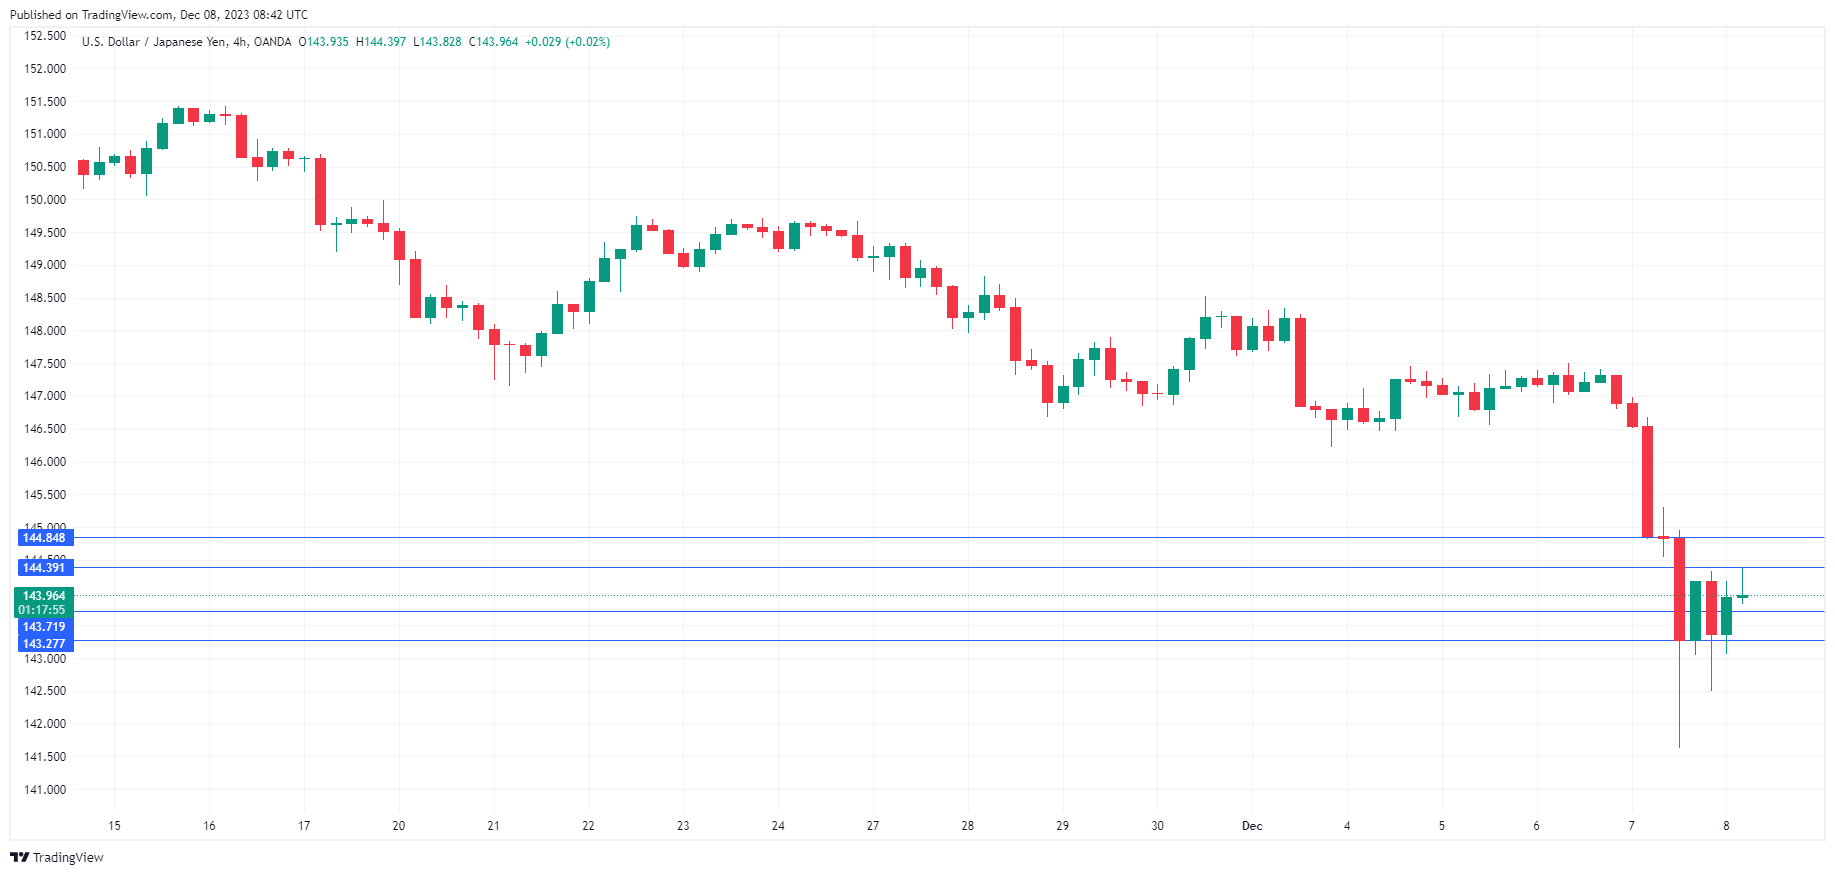
The Japanese yen continues to show strong swings. In the European session, USD/JPY is trading at 143.94, down 0.16%. Earlier, the yen gained as much as 1.1% but couldn’t consolidate and surrendered almost all of these gains.
Japan’s Q3 GDP declines more than expected
Japan’s GDP contracted by 2.9% y/y in the third quarter, revised downwards from the initial estimate of 2.1% and below the revised market forecast of -2.0%. Consumer and business spending declined, and real wages and household spending also fell. Inflation remains high and continues to squeeze consumers.
The Bank of Japan will be paying particular attention to the fact that wages continue to fall sharply. inflation-adjusted real wages declined by 2.3% y/y in October, marking a 19th straight monthly decline. The BoJ has insisted that it will not exit its ultra-loose policy until 2% inflation is sustainable, and that would require stronger wage growth. The soft GDP release and the disappointing wage data could complicate the BoJ’s plans to tighten policy.
The BoJ’s signals this week that it is looking to shift policy sent the yen surging on Thursday, with massive gains of 2.14%. Governor Ueda and BoJ Deputy Governor Ryozo Himino hinted at changes in policy, which was most unusual from the normally tight-lipped central bank. The yen reacted with huge gains and the December 18-19 meeting will be eagerly anticipated, as the BoJ could make some major announcements.
Nonfarm payrolls expected to rise
All eyes are on the US nonfarm payroll release later today. After falling sharply in October to 150,000 from a revised 297,000, nonfarm payrolls are expected to rebound to 180,000. If nonfarm payrolls are weaker than expected, speculation of a Fed rate cut will rise, and that could push the US dollar lower in the North American session.
USD/JPY Technical
- USD/JPY tested support at 143.72 earlier. Below, there is support at 143.27
- There is resistance at 144.39 and 144.84
Bitcoin 2024: The Story Is Cyclical
In the dynamic world of financial trading, understanding the nuanced relationship between the Federal Reserve's key interest rates and Bitcoin can be a game-changer. As a trader, it's crucial to grasp how these seemingly disparate elements interact, influencing investment strategies and market movements. Is this a definite coincidence? Absolutely not!
The Federal Reserve's key rate, which determines the minimum interest rate for interbank lending, significantly impacts the broader financial landscape, including risk assets like Bitcoin.
The relationship between Bitcoin and the Federal Reserve's key rate has grown stronger. Traditionally, American retail and institutional investors believe that risk assets decline during the rate hikes and vice versa. Today, the markets await an upcoming key rate cut in 2024, anticipating new highs for digital assets.
This article will describe why the current bullish BTCUSD is approaching its end.
2017 - 2020 scenario
In the first half of 2019, the US key rate consolidated around its local maximum values. During this period, Bitcoin gained 370%, reaching the 61.8 Fibonacci Level, on traders' expectations of approaching rate cuts.
As the famous saying goes: "Buy the rumors, sell the news." The actual situation turned out to be the opposite. As soon as the rates started to decline, the BTCUSD entered a bearish trend. It happened because the central bank usually reduces the key rate when the macroeconomic situation worsens and economic growth slows. People don't have enough money to invest in risky assets but prefer to sell them and bring their capital to a safer place.
This case wasn't an exception. In March 2020, when the Federal Reserve announced an emergency 100-bps rate cut in response to the economic impact of COVID-19, BTCUSD experienced a 50% decline.
This move was aimed at saving and boosting the economy. Of course, the overall plan worked, and later, many investors turned to Bitcoin as a potential hedge against inflation, pushing the price to the moon. However, the decline of the crypto market in early March whipped many traders out of the market.
BTCUSD, weekly timeframe
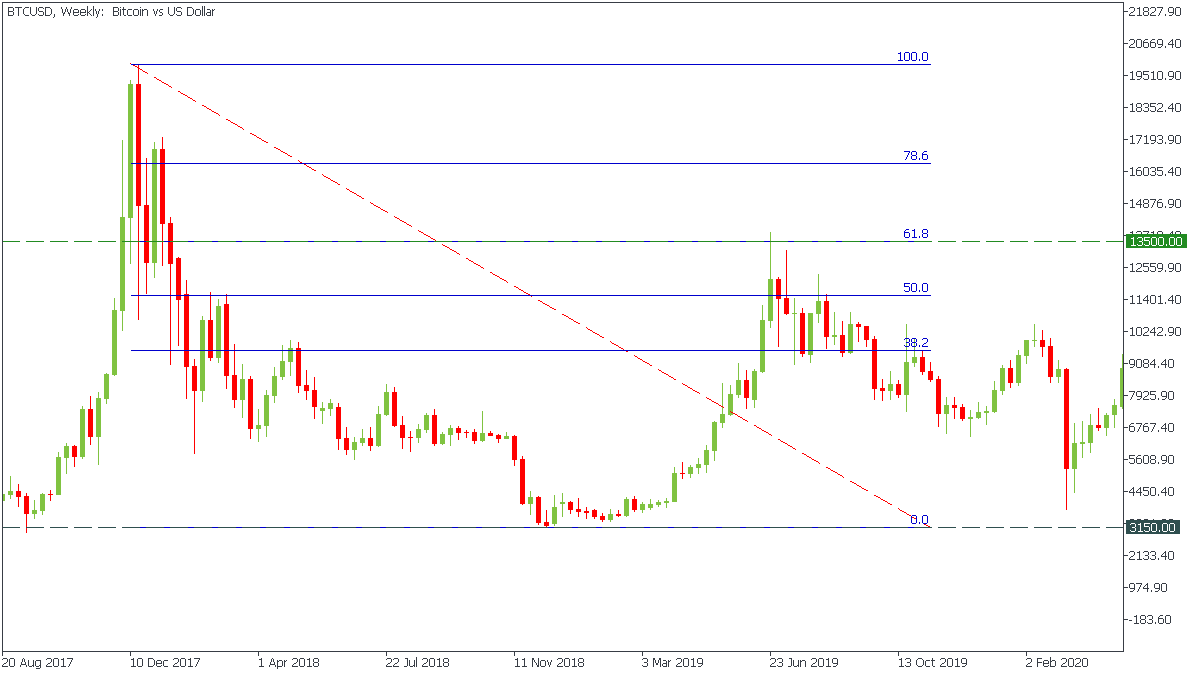
Looking at the 2017 - 2019 scenario from the technical side, we notice that after a solid bear market ended in early 2018, BTCUSD bounced toward the 61.8 Fibonacci level. The price was rising on the expectations of upcoming rate cuts while the actual rate was consolidating at its highs. In August 2019, exactly at the moment when the Fed cut the rate, the BTCUSD entered a downtrend.
2021 - 2024 scenario
In 2023, the Federal Reserve continued its trend of increasing interest rates, a policy initiated in March 2022 to combat inflation. Over 16 months starting in March 2022, the rates were raised by 525 basis points, reaching a high point of 5.25%-5.5% in July, the highest level in 22 years.
Contrary to the opinion that such rate hikes would dampen the demand for risky assets like cryptocurrencies, Bitcoin’s value increased. Especially, after the Fed announcement regarding a pause in rate hikes in September 2023 because markets started to price in an upcoming rate decline.
BTCUSD, weekly timeframe
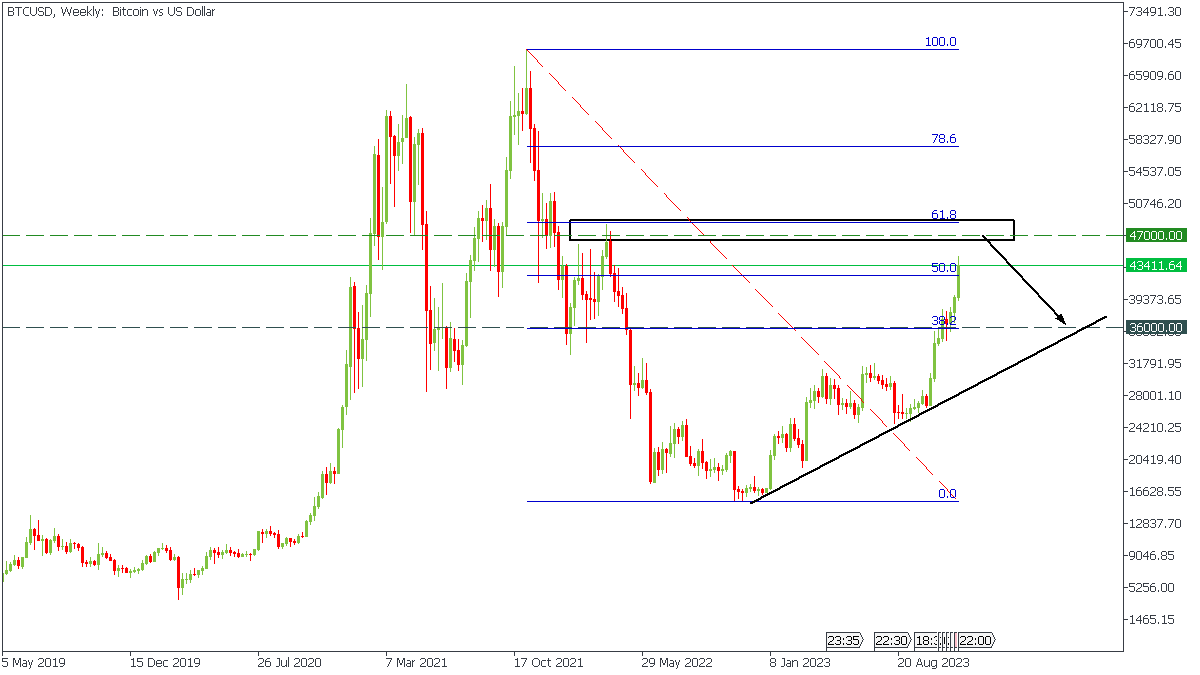
If we look at the chart in 2023 and analyze it in the same way, we find a lot of similarities with the 2017 - 2020 picture. Using the Fibonacci Retracement, we notice that the price movement follows the same scenario. BTCUSD is approaching the same 61.8 Fibonacci level that matches the 47 000 horizontal resistance level. At the same time, markets anticipate an upcoming rate cut by the Federal Reserve. The overall setup looks similar, doesn't it?
Given the similarity of the patterns, we expect the price to reach the 61.8 Fibonacci level around 47 000 and bounce off toward the 35 000 target after the first Fed rate cut in 2024.
Conclusion
This scenario is noteworthy, yet it often goes unnoticed. During each cycle, there is an anticipation in the markets that a key rate cut by the Federal Open Market Committee (FOMC) will have a positive effect on the prices of risky assets such as Bitcoin. However, it's crucial to grasp the fundamental aspect: a key rate cut typically occurs when the economy is stagnating and growth is decelerating, leading to panic selling and the disposal of risky assets.
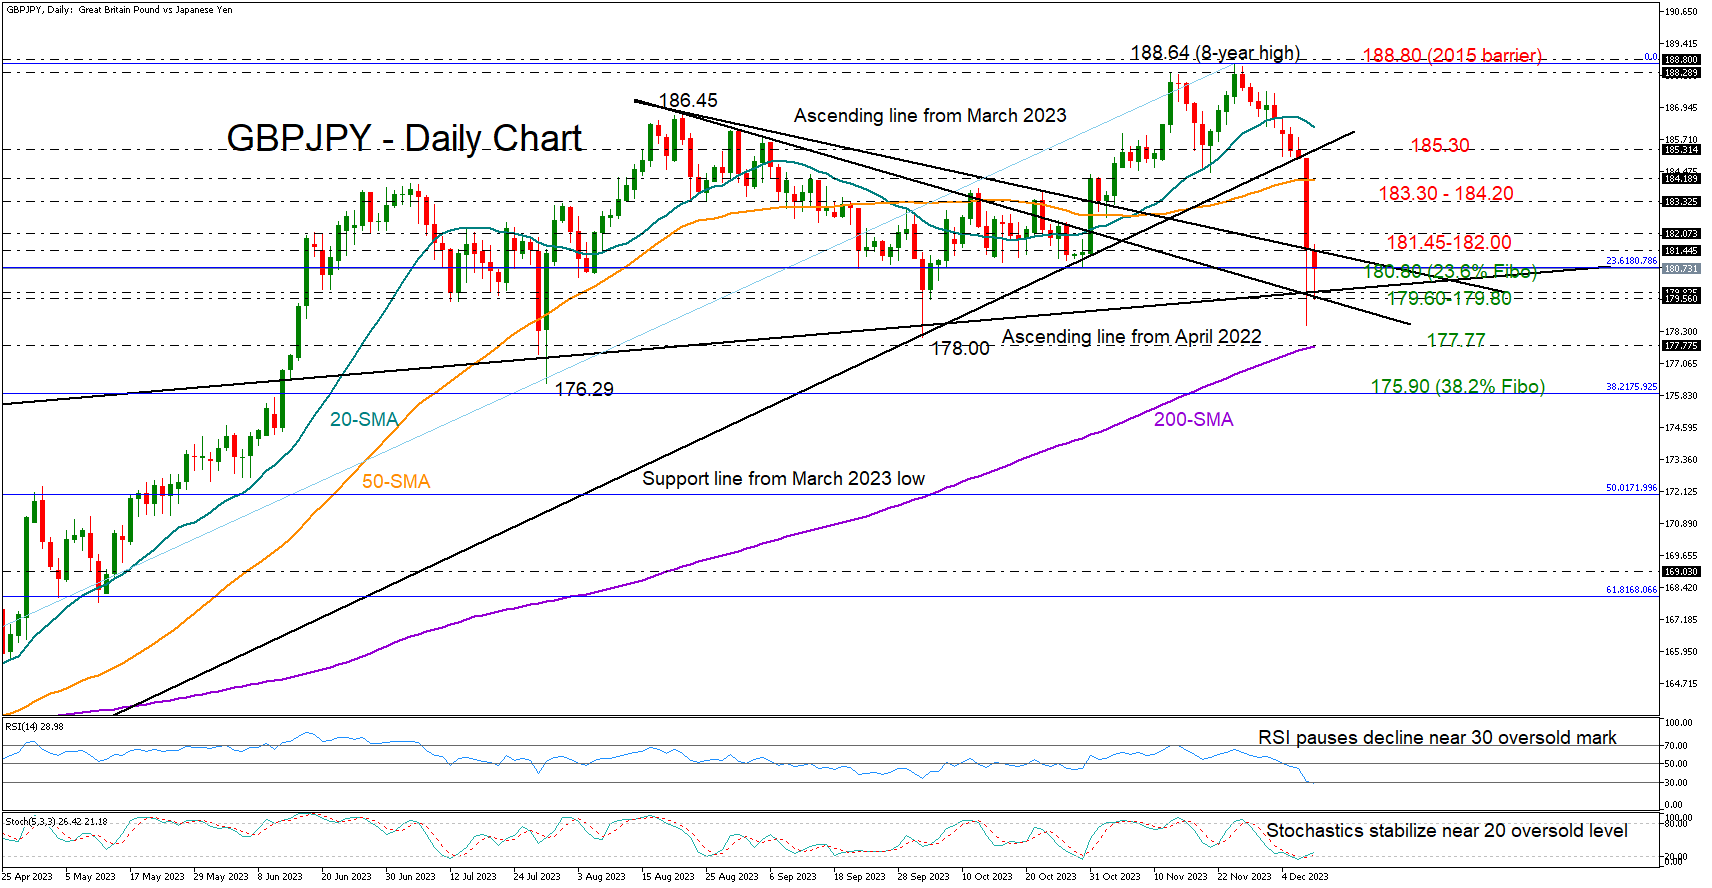
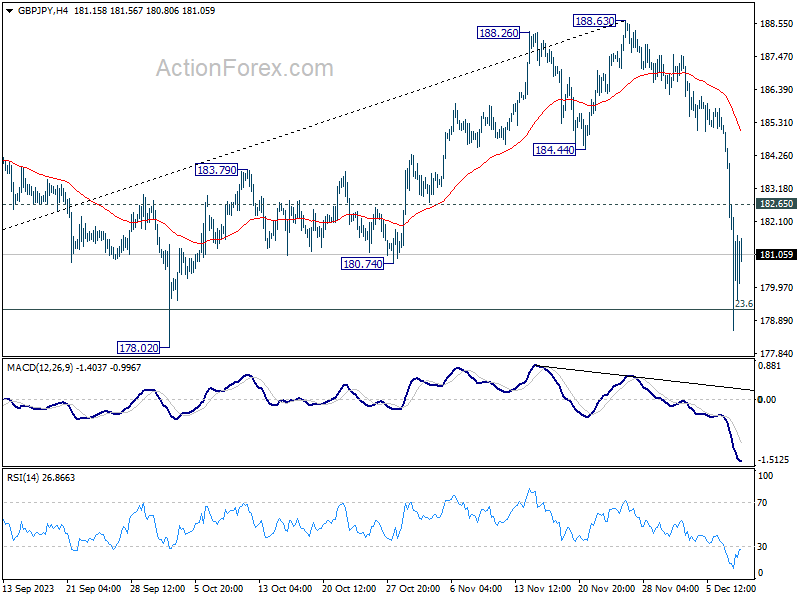
GBPJPY Seeks Buyers After Worst Day of the Year
- GBPJPY reverses October-November rally
- Oversold conditions detected after sharp drop
- Resistance at 181.45-182.00
GBPJPY crashed by 3.5% to 178.51 on Thursday before closing the day at 181.45, marking its worst daily session of the year. The pair faced heavy selling in the wake of renewed signals the Bank of Japan could exit its existing super accommodative monetary policy.
The bears are currently aiming to push the price back below the 180.00 mark, but the RSI and the stochastic oscillators have already plunged into oversold waters, suggesting selling pressures could fade soon.
The 23.6% Fibonacci retracement level of the 2023 uptrend is slightly lower at 180.80 and could help the pair to crawl back above the nearby resistance of 181.45 and the 182.00 round level. Running higher, some consolidation could develop between the 183.30 barrier and the 50-day simple moving average (SMA) at 184.20. If the recovery continues, the bulls will attempt to climb back above the broken support trendline at 185.30 and perhaps cross above the 20-day SMA at 186.16 too.
Alternatively, a step below 180.80 could initially stabilize within the 179.60-179.80 region, where the ascending line from April 2022 intersects the short-term restrictive lines from August. A defeat there could open the way towards the 200-day SMA at 177.77. Beneath that, sellers could head for the 38.2% Fibonacci of 175.90.
In a nutshell, GBPJPY could heal some of its wounds following its latest freefall. A clear move above 181.45-182.00 could strengthen upside forces.
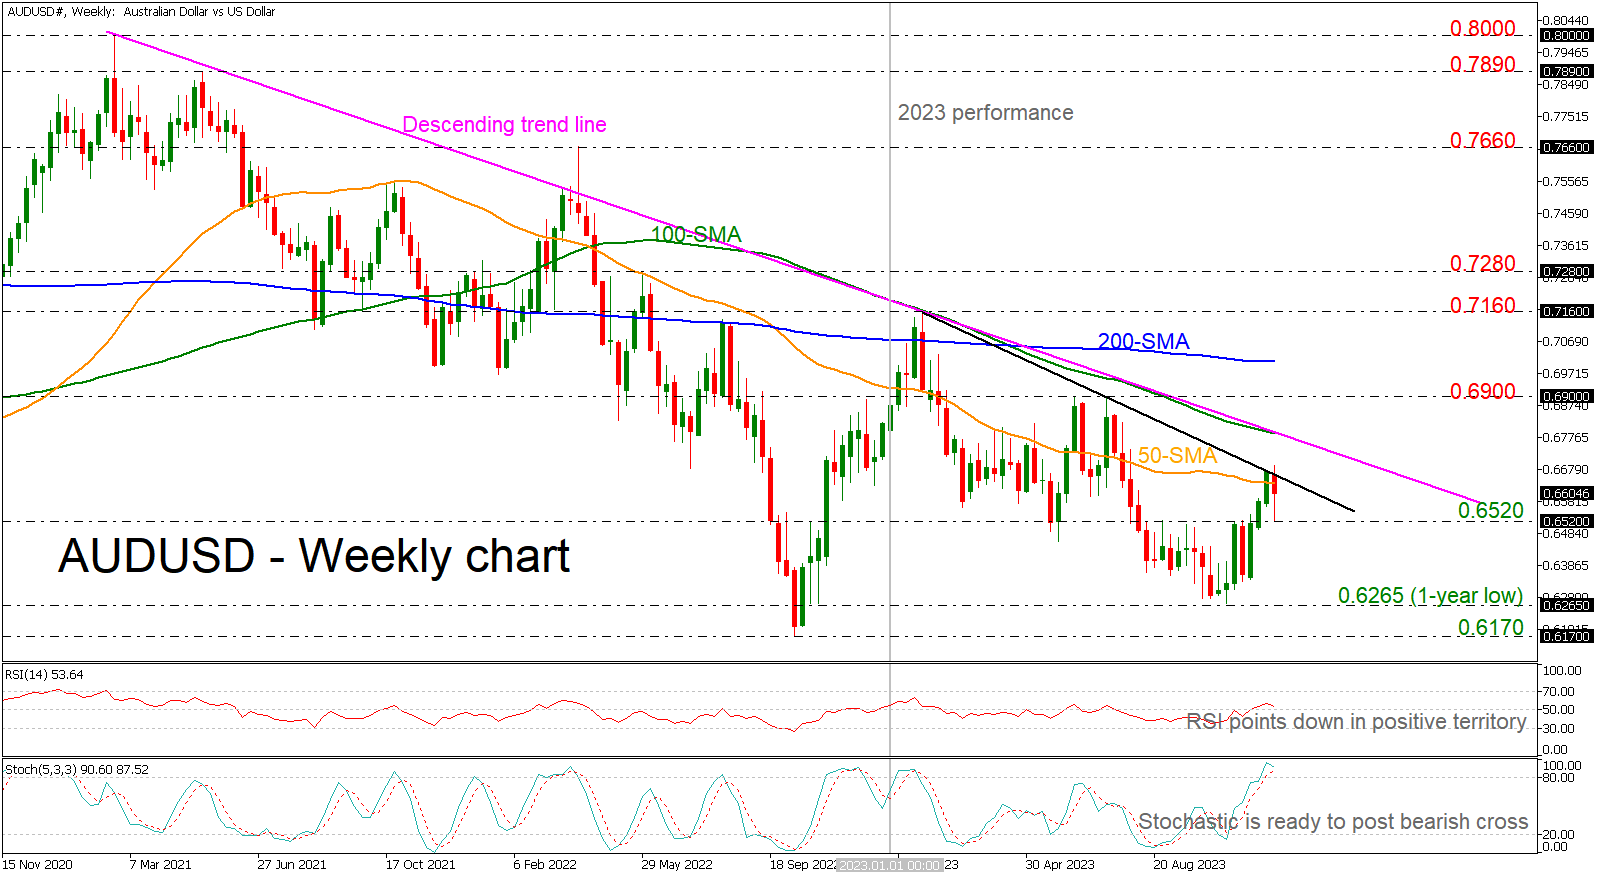
AUDUSD Ends Another Year With Negative Mode
- AUDUSD pulls back from 1-year downtrend line
- Strong resistance lines to test before switching the downtrend
- RSI and stochastic indicate more losses
As the year 2023 is approaching its conclusion, AUDUSD is continuing the descending movement that started back in February 2021. Currently, the pair is testing the downtrend line, which has been drawn since January and the 50-week simple moving average (SMA).
According to technical oscillators, they are confirming the recent negative movement on price as the RSI is ticking down near the neutral threshold of 50, while the stochastic is ready to post a bearish crossover within its %K and %D lines in the overbought market, suggesting that bears would take the upper hand again in the short-term.
Now should sellers stay in charge, the first obstacle to the downside might be the 0.6520 zone, which has acted both as support and resistance in recent months. If violated, the spotlight would then shift to the one-year low of 0.6265 area, which halted the retreat in October.
In case buyers take control and pierce above the one-year falling trend line, then it may manage to hit the very long-term downtrend line, which overlaps with the 100-week SMA at 0.6790. Moving higher, the 0.6900 psychological mark and the 200-week SMA at 0.7000 could be significant resistance levels to have in mind, changing the outlook to neutral.
Summarizing, the long-term outlook remains clearly negative. A decisive break above 0.7000 is needed to bring that into doubt, although a pullback from the recent descending line would confirm again the current trend.
NIKKEI Analysis: Japanese Stock Market Outlook
In the first half of 2023, the Japanese stock market was dominated by bullish sentiment due to (still) negative interest rates — while the rest of the G7 countries raised their rates to combat inflation.
The NIKKEI-225 index grew by 30% in the first half of the year. But then the balance of supply and demand was achieved, judging by the daily chart, where a range was formed (shown in blue), framing the index’s fluctuations in the second half of the year. Judging by the change in the slope of the bullish trend lines, demand was sufficient to maintain the price at the lower limit of the range, but not enough to go beyond the upper limit.
The situation is fundamentally reversed. While interest rates in the US, Europe and elsewhere are thought to be near the top, there is growing talk in Japan that the central bank will begin raising them after years of being stuck in negative territory:
→ Bloomberg: The next meeting of the Bank of Japan will be held on December 19 – speculation is growing that the Bank will move away from negative interest rates as early as this month.
→ Reuters: 22 of 26 economists (85%) surveyed in November believe the Bank of Japan will abandon its negative interest rate policy by the end of next year.
The winding down of ultra-loose monetary policy could have a negative impact on the growth of Japanese companies - accordingly, the growing bearish sentiment is reflected in the index quote. Since the end of November, the NIKKEI 225 has dropped almost 5%.
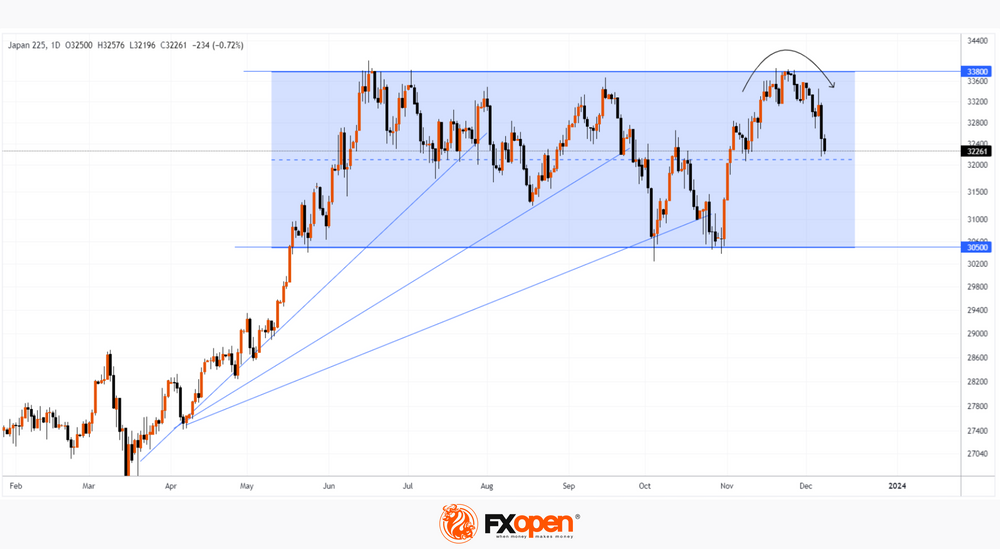
The chart shows that the November top:
→ did not exceed the annual maximum set in June;
→ only slightly exceeded the September high – in fact, a false breakout;
→ the price forms a rounding (shown by an arrow) - a sign of gradual depletion of demand, which is replaced by the dominance of supply.
It is possible that the bears, which are gaining power, will be able to form a breakdown of the median line of the blue channel as early as December.
This article represents the opinion of the Companies operating under the FXOpen brand only. It is not to be construed as an offer, solicitation, or recommendation with respect to products and services provided by the Companies operating under the FXOpen brand, nor is it to be considered financial advice.
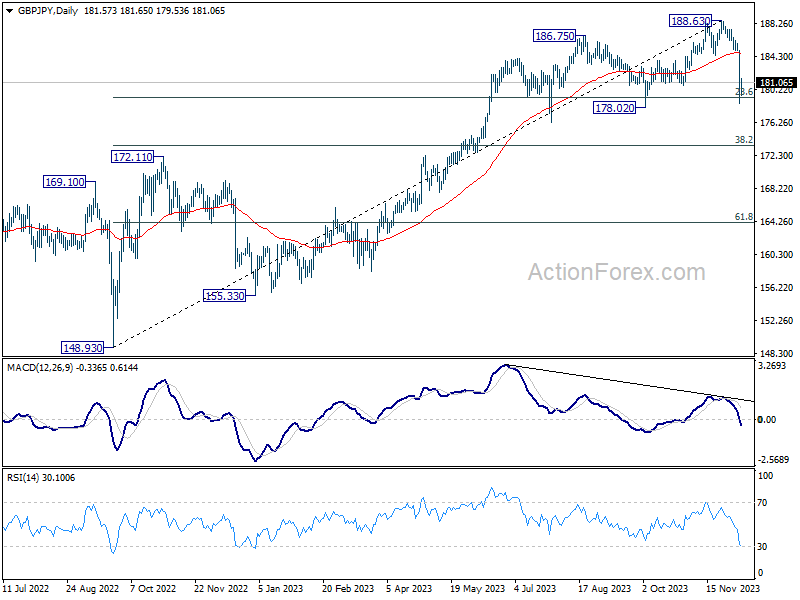
GBP/JPY Daily Outlook
Daily Pivots: (S1) 178.41; (P) 181.75; (R1) 184.88; More...
GBP/JPY's fall from 188.63 extended to as low as 178.58, and breached 23.6% retracement of 148.93 to 188.63 at 179.26 briefly. There is no sign of bottoming yet and intraday bias stays on the downside. Sustained trading below 179.26 will pave the way to 38.2% retracement at 173.46 next. On the upside, above 182.65 minor resistance will turn intraday bias neutral and bring consolidations first, before staging another fall.
In the bigger picture, while a medium term top is in place at 188.63, there is no clear sign of long term bearish trend reversal yet. As long as 55 W EMA (now at 175.67) holds, price actions from 188.63 are seen as a corrective move only. Larger up trend from 123.94 (2022 low) could resume at a later stage.
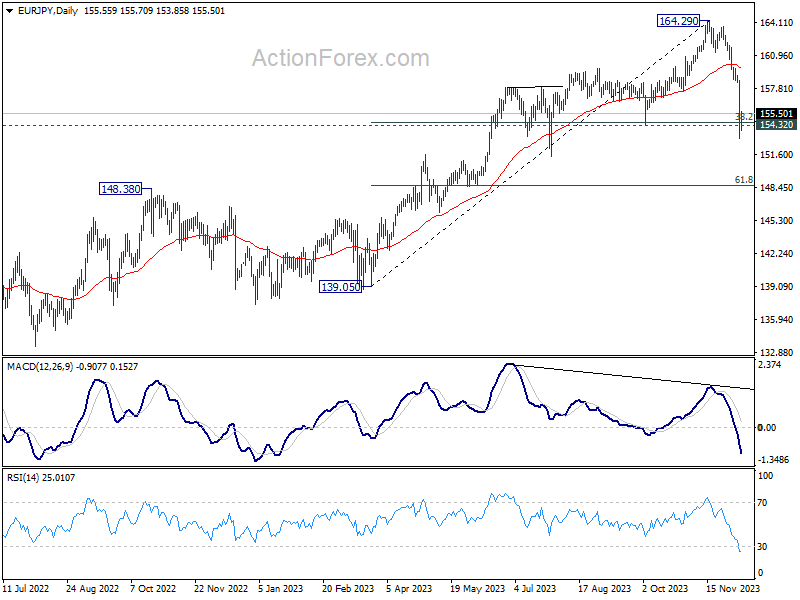
EUR/JPY Daily Outlook
Daily Pivots: (S1) 152.94; (P) 155.85; (R1) 158.48; More..
EUR/JPY's fall from 164.29 extended to as low as 153.15 and breached 154.32 cluster support (38.2% retracement of 139.05 to 164.29 at 154.64). There is no clear sign of bottoming yet and intraday bias stays on the downside. Sustained trading below 154.32 will target 61.8% retracement at 148.69 next. On the upside, above 156.42 minor resistance will turn intraday bias neutral and bring consolidations first, before staging another decline.
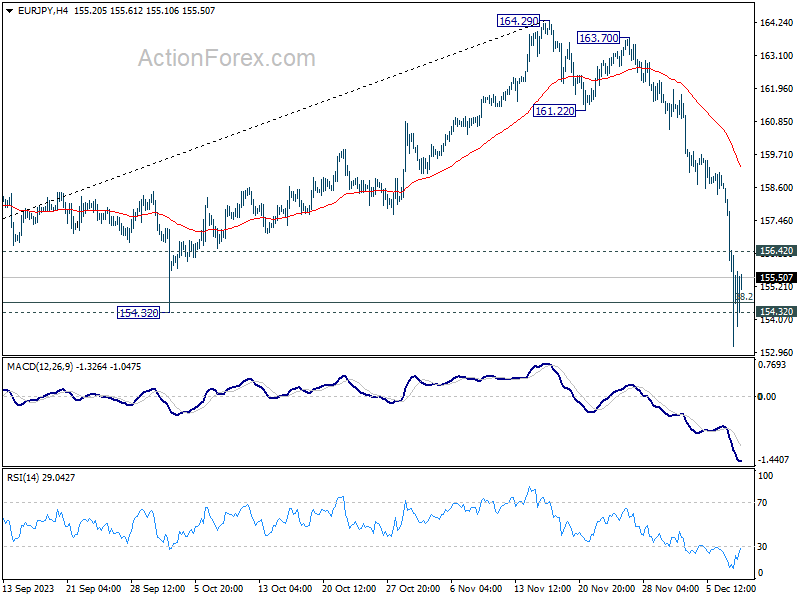
In the bigger picture, bearish divergence condition in 55 D EMA indicates that a medium term top was e formed at 164.29 already. Price actions from there are tentatively seen as a correction only. There is no clear sign that the up trend from 144.42 (2020 low) has completed yet. As long as 55 W EMA (now at 152.12) holds, another rally through 164.29 is still in favor as a later stage.