
Sample Category Title
USD/JPY Daily Outlook
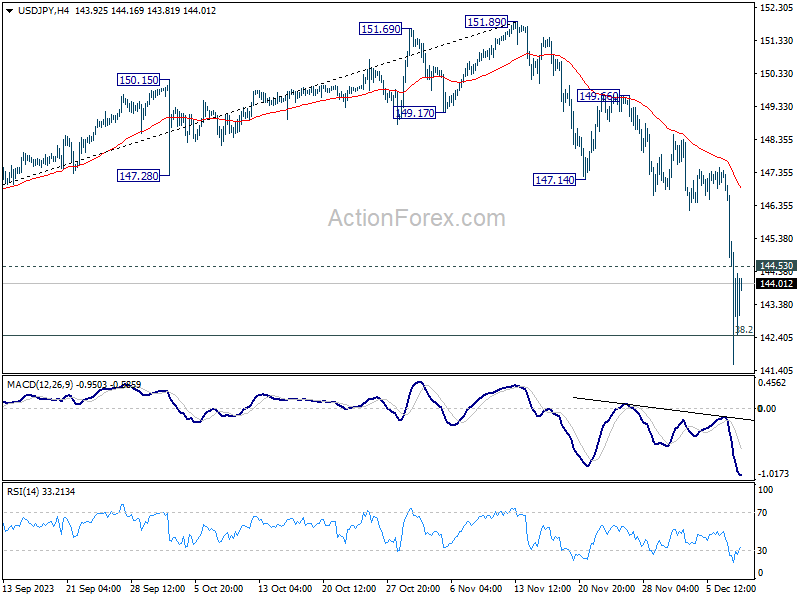
Daily Pivots: (S1) 141.43; (P) 144.38; (R1) 147.10; More...
USD/JPY recovered after breaching 142.45 fibonacci level, but there is no clear sign of bottoming yet. Intraday bias stays on the downside, sustained trading below 142.45 will pave the way to next fibonacci level at 136.63. On the upside, break of 144.53 minor resistance will turn intraday bias neutral and bring consolidations. But recovery should be limited below 147.14 support turned resistance to bring another fall.
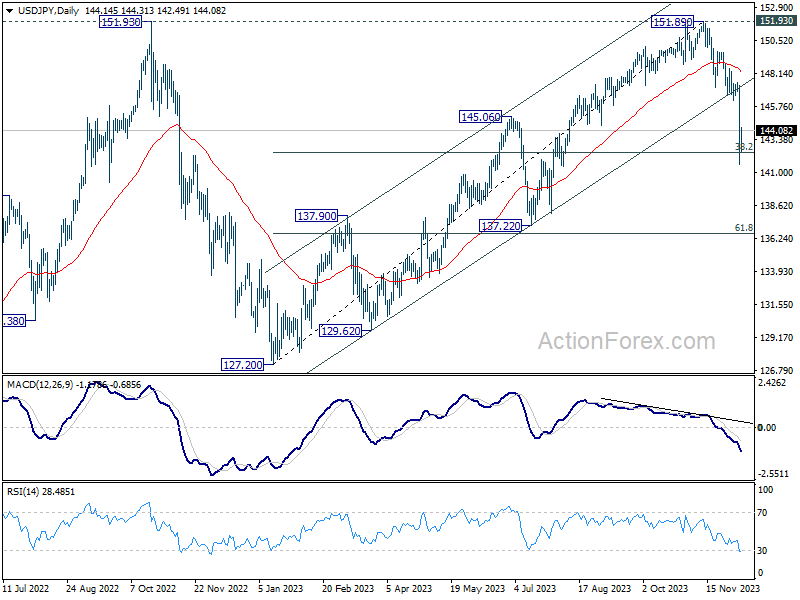
In the bigger picture, current fall from 151.89 is seen as the third leg of the corrective pattern from 151.93 (2022 high). Deeper decline would be seen to through 38.2% retracement of 127.20 to 151.89 at 142.45 to 61.8% retracement at 136.63. This will now remain the favored as long as 147.14 support turned resistance holds.
USD/CHF Daily Outlook
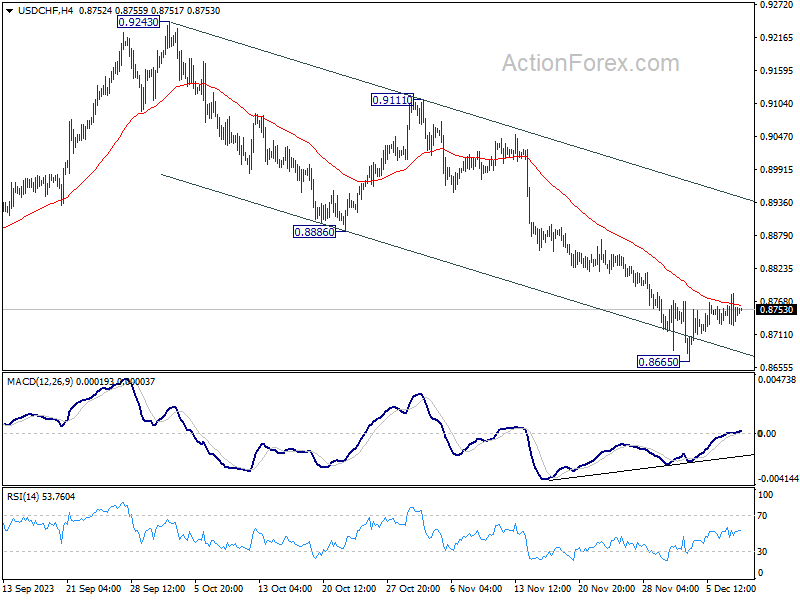
Daily Pivots: (S1) 0.8727; (P) 0.8754; (R1) 0.8780; More....
Intraday bias in USD/CHF stays mildly on the upside for the moment. As short term bottom should be in place at 0.8665, on bullish convergence condition in 4H MACD. Further rally would be seen to 0.8886 support turned resistance first. Decisive break there will indicate that whole fall from 0.9243 has completed, and bring stronger rally to 0.9111 resistance next. However, break of 0.8665 will dampen this view and resume the fall from 0.9243 instead.
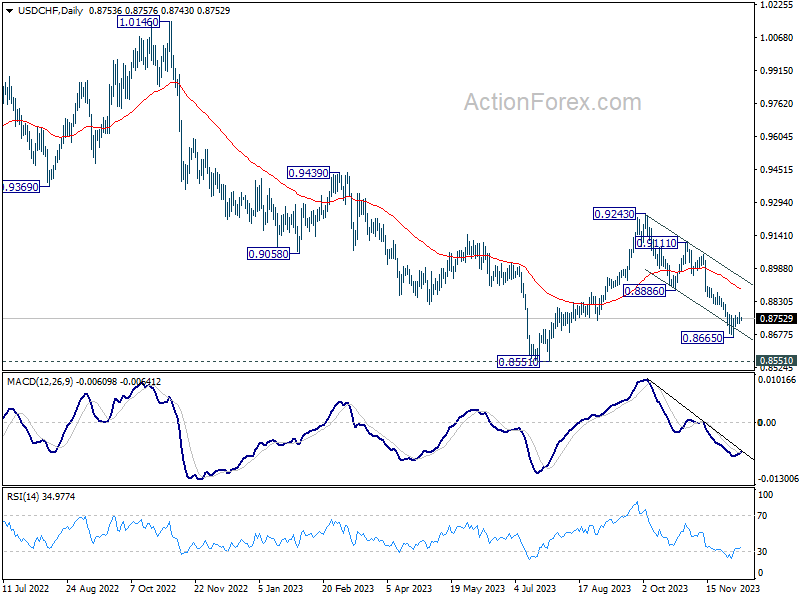
In the bigger picture, price actions from 0.8551 are currently seen as part of a corrective pattern to the decline from 1.0146 (2022 high). Fall from 0.9243 is seen as the second leg for now. Deeper decline could be seen to 0.8551 low but strong support should be seen there to bring rebound. For now, this will remain the favored case as long as 0.8886 support turned resistance holds.
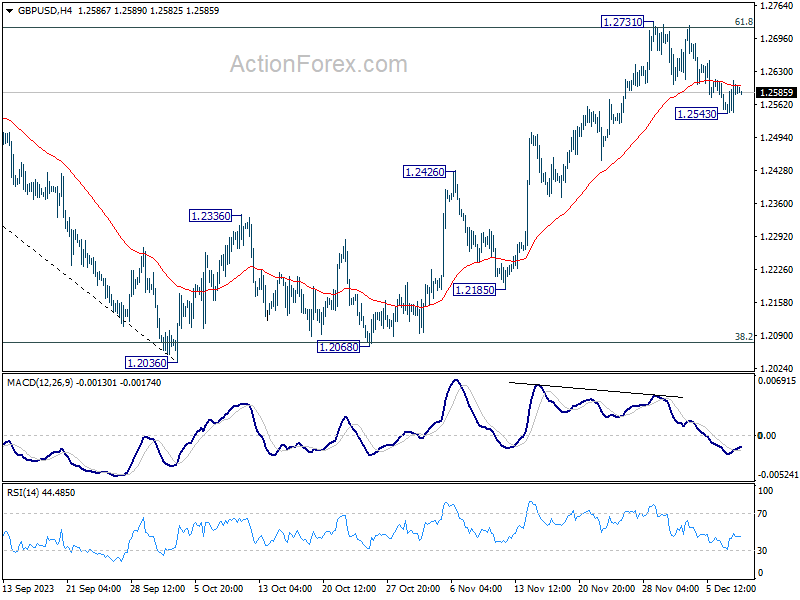
GBP/USD Daily Outlook
Daily Pivots: (S1) 1.2554; (P) 1.2584; (R1) 1.2622; More...
Intraday bias in GBP/USD is turned neutral with current recovery. Risk will stay on the downside as long as 1.2731 resistance holds. Below 1.3543 will resume the fall from 1.2731 to 55 D EMA (now at 1.2437). Nevertheless, firm break of 1.2731 will resume the rise from 1.2036 to retest 1.3141 high instead.
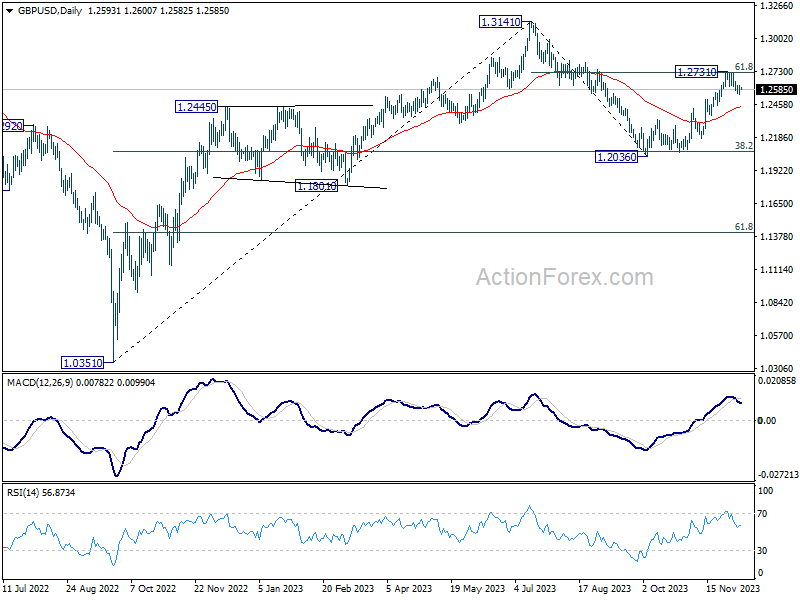
In the bigger picture, price actions from 1.3141 are seen as a corrective pattern to rise from 1.0351 (2022 low). Strong rebound from 38.2% retracement of 1.0351 (2022 low) to 1.3141 at 1.2075 suggests that current rise from 1.2036 is already the second leg. However, while further rally could be seen, upside should be limited by 1.3141 to bring the third leg of the pattern.
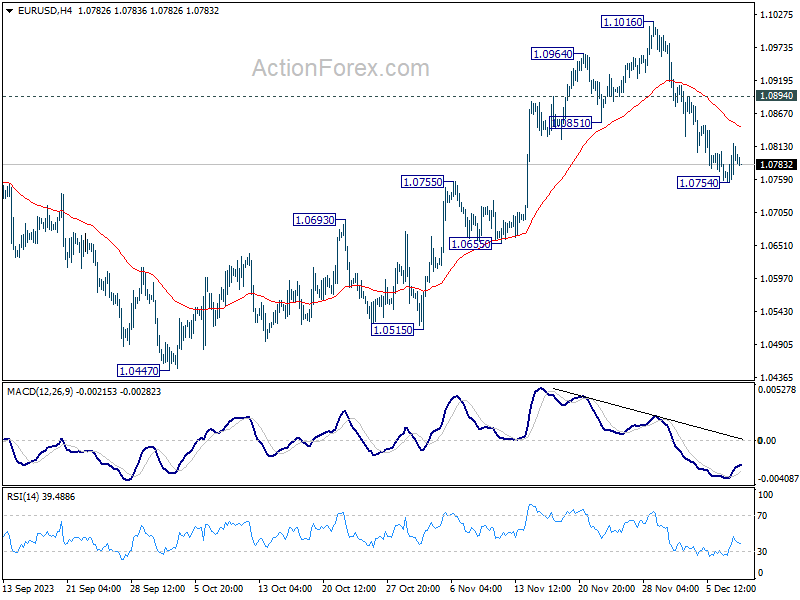
EUR/USD Daily Outlook
Daily Pivots: (S1) 1.0760; (P) 1.0788; (R1) 1.0822; More...
EUR/USD recovered after falling to 1.0754, and drew support from 55 D EMA (now at 1.0770). Intraday bias is turned neutral for consolidations. But another fall is in favor as long as 1.0894 minor resistance holds. Break of 1.0754 and sustained trading below 55 D EMA will pave the way to retest 1.0447 support. Nevertheless, break of 1.0894 will turn bias back to the upside for 1.1016 resistance instead.
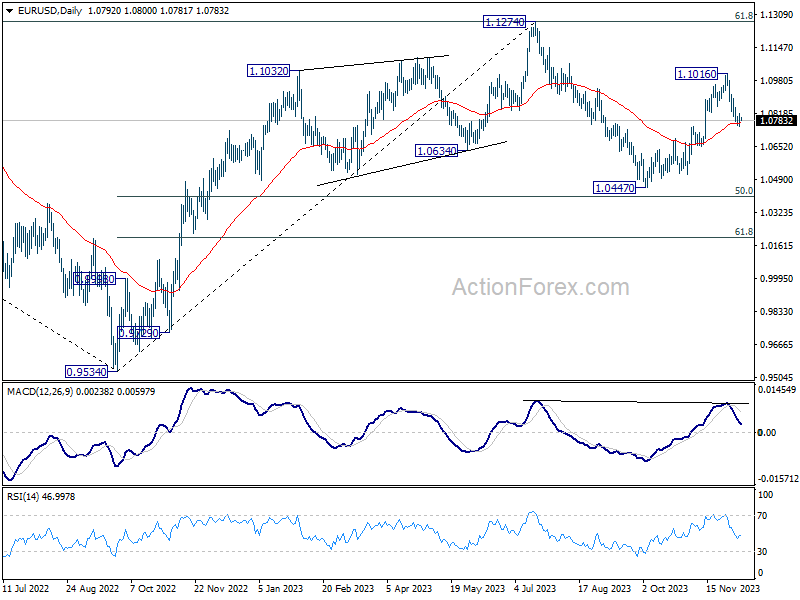
In the bigger picture, price actions from 1.1274 are viewed as a corrective pattern to rise from 0.9534 (2022 low). Rise from 1.0447 is tentatively seen as the second leg. Hence while further rally could be seen, upside should be limited by 1.1274 to bring the third leg of the pattern. Meanwhile, sustained break of 55 D EMA will argue that the third leg has already started for 1.0447 and below.
Yen Robust on Strong Wage Growth Data, NFP to Determine Dollar’s Path
Japanese Yen continues to dominate as the strongest currency for the week, finding additional support from Japan's unexpectedly robust wage growth data. However, its rally is currently pausing, with global financial markets redirecting their focus towards the impending US non-farm payroll data.
Dollar, currently ranking as the second strongest currency, faces a critical test with the release of the job data. Its ability to maintain this position is contingent on how the markets react to NFP. This anticipated reaction is multifaceted, encompassing not just individual financial instruments, but also the collective responses across various sectors, including stocks, bonds, and currencies. The interconnectedness of these financial markets would play a crucial role in Dollar's performance post-data release.
European currencies are lagging in performance, with Sterling experiencing the most significant downturn, closely followed by Euro. Swiss Franc, while also soft, is faring slightly better than its European peers. Australian Dollar remains weak despite recovery in today's trading. Meanwhile, Canadian and New Zealand Dollars are displaying mixed performance.
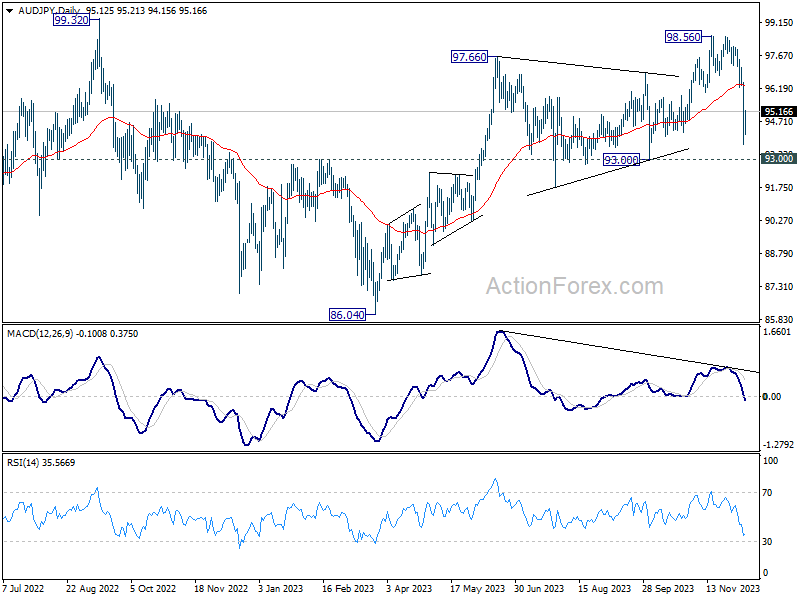
Technically, AUD/JPY recovered after diving to 93.70. Some consolidations could be seen first, but risk will stay on the downside as long as 55 D EMA (now at 96.28 holds). Rise from 86.04, as the second leg of the corrective pattern from 99.32, should have completed at 98.56. Break of 93.00 support will confirm that the third leg has starts, and target 86.04 support.
In Asia, at the time of writing, Nikkei is down -1.90%. Hong Kong HSI is up 0.10%. China Shanghai SSE is up 0.22%. Singapore Strait Times is up 1.02%. Japan 10-year JGB yield is up 0.0123 at 0.769. Overnight, DOW rose 0.17%. S&P 500 rose 0.80%. NASDAQ jumped 1.37%. 10-year yield rose 0.008 to 4.129.
US NFP in spotlight: A crucial test for soft-landing hypothesis
Today's primary focus in the financial markets is US Non-Farm Payrolls report, which is keenly anticipated by investors assessing the "soft landing" scenario in the economy. The soft landing hypothesis implies that labor market is cooling sufficiently to reduce inflation and pave the way for Fed to start lowering interest rates next year, without posing a significant threat to the overall economy.
Non-Farm Payrolls report is expected to indicate that job growth reaccelerated to 190k in November, up from October's 150k. Unemployment rate is projected to remain steady at 3.9%, and average hourly earnings are anticipated to show 0.3% mom increase.
Recent labor market data has shown signs of cooling. ISM Manufacturing Employment index dropped from 46.8 to 45.8, while ISM Services Employment index saw a slight improvement from 50.2 to 50.7. ADP Employment growth recorded 103k, nearly unchanged from the previous month's 106k. The four-week moving average of initial jobless claims rose from 213k to 221k. Additionally, the latest JOLTs reported a drop in the ratio of job openings to number of unemployed workers to 1.34, the lowest since August 2021.
A "goldilocks" Non-Farm Payrolls report, signifying a balanced labor market condition, could reignite bull runs in the stock markets and subsequently exert renewed selling pressure on the Dollar. However, market reactions to deviations from this ideal scenario are difficult to predict.
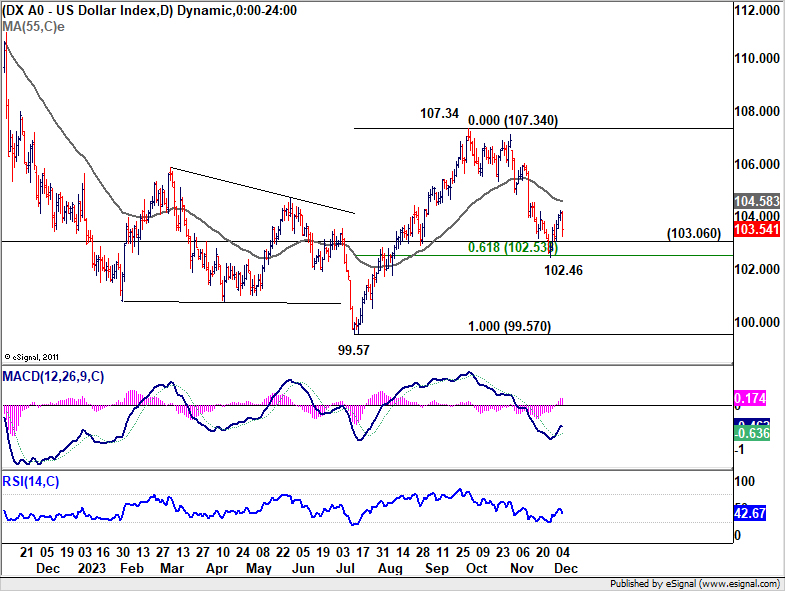
Regarding the Dollar index, recovery from 102.46 was interrupted after reaching 104.23, largely due to the steep selloff in USD/JPY. For now, further rise is mildly in favor as long as 103.06 minor support holds, towards 55 D EMA (now at 103.54).
But the index could start to struggle above there, unless EUR/USD could extended its near term decline through 55 D EMA decisively, while USD/JPY could stabilize at 142.45 fibonacci support.
Japan's nominal pay rises 1.5% yoy, but fail to keep pace with inflation, consumer spending drops
Japan's nominal pay growth rose by 1.5% yoy, surpassing the expected 1.0% yoy increase. This marked the fastest rate of increase since June. Regular or base salaries contributed to this increase with a 1.4% yoy rise. However, overtime pay slightly decreased by -0.1% yoy. Special payments, a variable component of wages, saw a significant jump of 7.5% yoy.
However, the positive trend in nominal pay was offset by the continued decline in inflation-adjusted real wages, which fell for the 19th consecutive month, dropping by -2.3% yoy. A labor ministry official commented, "Price increases have outpaced wage growth." This situation is exacerbated by the consumer inflation rate, which includes fresh food prices but excludes owner's equivalent rent, re-accelerating to 3.9% after a brief two-month slowdown.
Alongside wage trends, household spending in Japan also experienced a downturn, decreasing by -2.5% yoy in October. This decline, while still significant, was less severe than the anticipated 3.0% yoy drop. The continued decrease in household spending, which has now extended to eight consecutive months, reflects ongoing challenges in the domestic consumption sector.
BoC's Gravelle elaborates on holding interest rates steady amid balanced economy
In a speech overnight, BoC Deputy Governor Toni Gravelle said the decision to maintain policy interest rate at 5% this week was an effort to "balance the risks of over- and under-tightening." BoC aims to avoid excessively slowing down the economy, while also alleviating the burden of high inflation on Canadians.
Gravelle observed that the Canadian economy "no longer looks to be in excess demand", a shift that has contributed to reducing price pressures across a wide array of goods and services. He added said, "The economy is now roughly in balance.
He also emphasized that BoC is closely monitoring several key economic indicators, such as inflation expectations, wage growth, and corporate pricing behavior. These factors are crucial in determining whether inflation is on a consistent path towards the 2% target.
Despite the current state of balance in the economy, Gravelle stated, "Given the risks to the inflation outlook, we remain prepared to increase the policy rate further if needed."
Elsewhere
Germany CPI final is the main feature in European session. Later in the day, US will release U of Michigan consumer sentiment after non-farm payrolls.
EUR/USD Daily Outlook
Daily Pivots: (S1) 1.0760; (P) 1.0788; (R1) 1.0822; More...
EUR/USD recovered after falling to 1.0754, and drew support from 55 D EMA (now at 1.0770). Intraday bias is turned neutral for consolidations. But another fall is in favor as long as 1.0894 minor resistance holds. Break of 1.0754 and sustained trading below 55 D EMA will pave the way to retest 1.0447 support. Nevertheless, break of 1.0894 will turn bias back to the upside for 1.1016 resistance instead.
In the bigger picture, price actions from 1.1274 are viewed as a corrective pattern to rise from 0.9534 (2022 low). Rise from 1.0447 is tentatively seen as the second leg. Hence while further rally could be seen, upside should be limited by 1.1274 to bring the third leg of the pattern. Meanwhile, sustained break of 55 D EMA will argue that the third leg has already started for 1.0447 and below.
Economic Indicators Update
| GMT | Ccy | Events | Actual | Forecast | Previous | Revised |
|---|---|---|---|---|---|---|
| 21:45 | NZD | Manufacturing Sales Q3 | -2.80% | 0.20% | -0.80% | |
| 23:30 | JPY | Labor Cash Earnings Y/Y Oct | 1.50% | 1.00% | 1.20% | |
| 23:30 | JPY | Overall Household Spending Y/Y Oct | -2.50% | -3.00% | -2.80% | |
| 23:50 | JPY | Bank Lending Y/Y Nov | 2.80% | 2.80% | 2.80% | 2.70% |
| 23:50 | JPY | GDP Q/Q Q3 F | -0.70% | -0.50% | -0.50% | |
| 23:50 | JPY | GDP Deflator Y/Y Q3 | 5.30% | 5.10% | 5.10% | |
| 23:50 | JPY | Current Account (JPY) Oct | 2.62T | 1.85T | 2.01T | |
| 05:00 | JPY | Eco Watchers Survey: Current Nov | 49.5 | 49.2 | 49.5 | |
| 07:00 | EUR | Germany CPI Y/Y Nov F | 3.20% | 3.20% | ||
| 07:00 | EUR | Germany CPI M/M Nov F | -0.40% | -0.40% | ||
| 09:30 | GBP | Consumer Inflation Expectations | 3.60% | |||
| 13:30 | CAD | Capacity Utilization Q3 | 81.40% | 81.40% | ||
| 13:30 | USD | Nonfarm Payrolls Nov | 190K | 150K | ||
| 13:30 | USD | Unemployment Rate Nov | 3.90% | 3.90% | ||
| 13:30 | USD | Average Hourly Earnings M/M Nov | 0.30% | 0.20% | ||
| 15:00 | USD | Michigan Consumer Sentiment Index Dec P | 61.7 | 61.3 |
Will NFP Be Positive for the US Dollar?
As the US Non-Farm Payrolls (NFP) take center stage, this month's data gains special attention, particularly after the unemployment rate took a concerning turn in the previous month. The US ADP Employment Change reveals a significant decline, with the economy adding 298K new jobs in the last three months, marking a 68% drop from the robust 947K new jobs in the preceding quarter. While the official NFP data indicates the addition of 150K new jobs in November, following a strong October reading of 336K, the disparity between ADP and NFP figures raises questions about the reliability of the latter.
Market sentiment leans towards trusting the ADP data more, considering the potential for substantial revisions in the NFPs.
The recent uptick in the unemployment rate, reaching 3.9% from a multi-year low of 3.4% at the beginning of 2023, aligns with the anticipated weakening of the labor market, a trend acknowledged by both the Federal Reserve and investors.
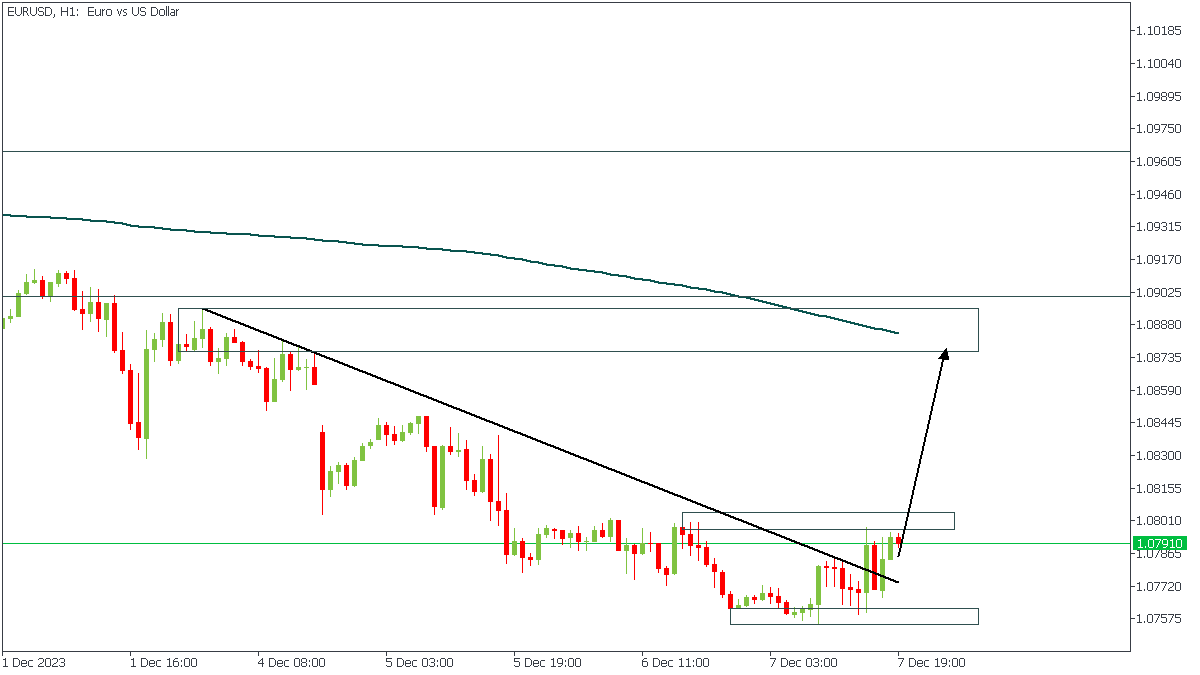
EURUSD - H1 Timeframe
EURUSD has recently broken above the trendline resistance as a result of the pressure from its rejection from the daily demand zone. On this basis, and considering the fact that the RSI (Relative Strength Index) on the Daily timeframe is oversold at the moment, it appears to me that there would be a temporary bullish impulse on EURUSD in the meantime.
Analyst’s Expectations:
- Direction: Bullish
- Target: 1.08340
- Invalidation: 1.07540
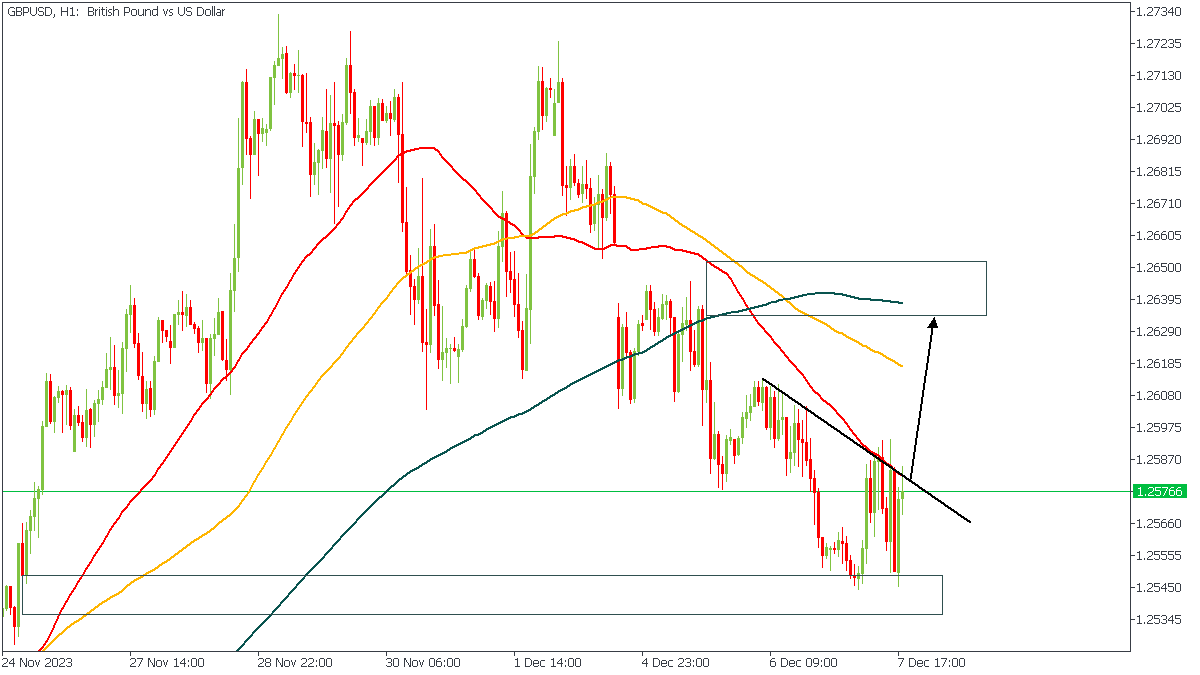
GBPUSD - H1 Timeframe
GBPUSD on the hourly timeframe has broken and retested the resistance trendline, leading me to believe that a bullish impulse could be in motion. The fact that the demand zone on the daily timeframe was the origin of the bullish impulse can also be considered a confluence in support of the bullish sentiment.
Analyst’s Expectations:
- Direction: Bearish
- Target: 1.26024
- Invalidation: 1.25467
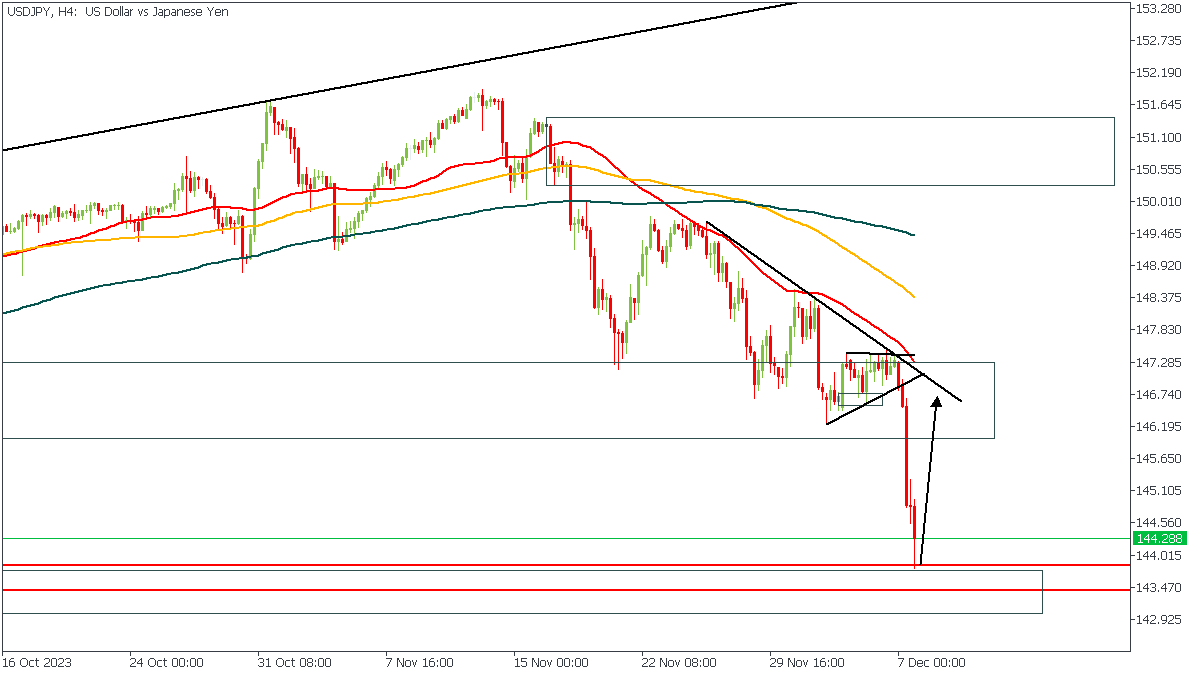
USDJPY - H4 Timeframe
USDJPY seems to be reacting off the demand zone on the daily timeframe, however, I have reason to believe that this movement could be price’s way of letting off some steam after the impulsive drop over the past week. In this regard, it would be best, however, to seek further confluences on the lower timeframes before taking an entry.
Analyst’s Expectations:
- Direction: Bullish
- Target: 145.914
- Invalidation: 143.300
CONCLUSION
The trading of CFDs comes at a risk. Thus, to succeed, you have to manage risks properly. To avoid costly mistakes while you look to trade these opportunities, be sure to do your due diligence and manage your risk appropriately.
Technical Outlook and Review
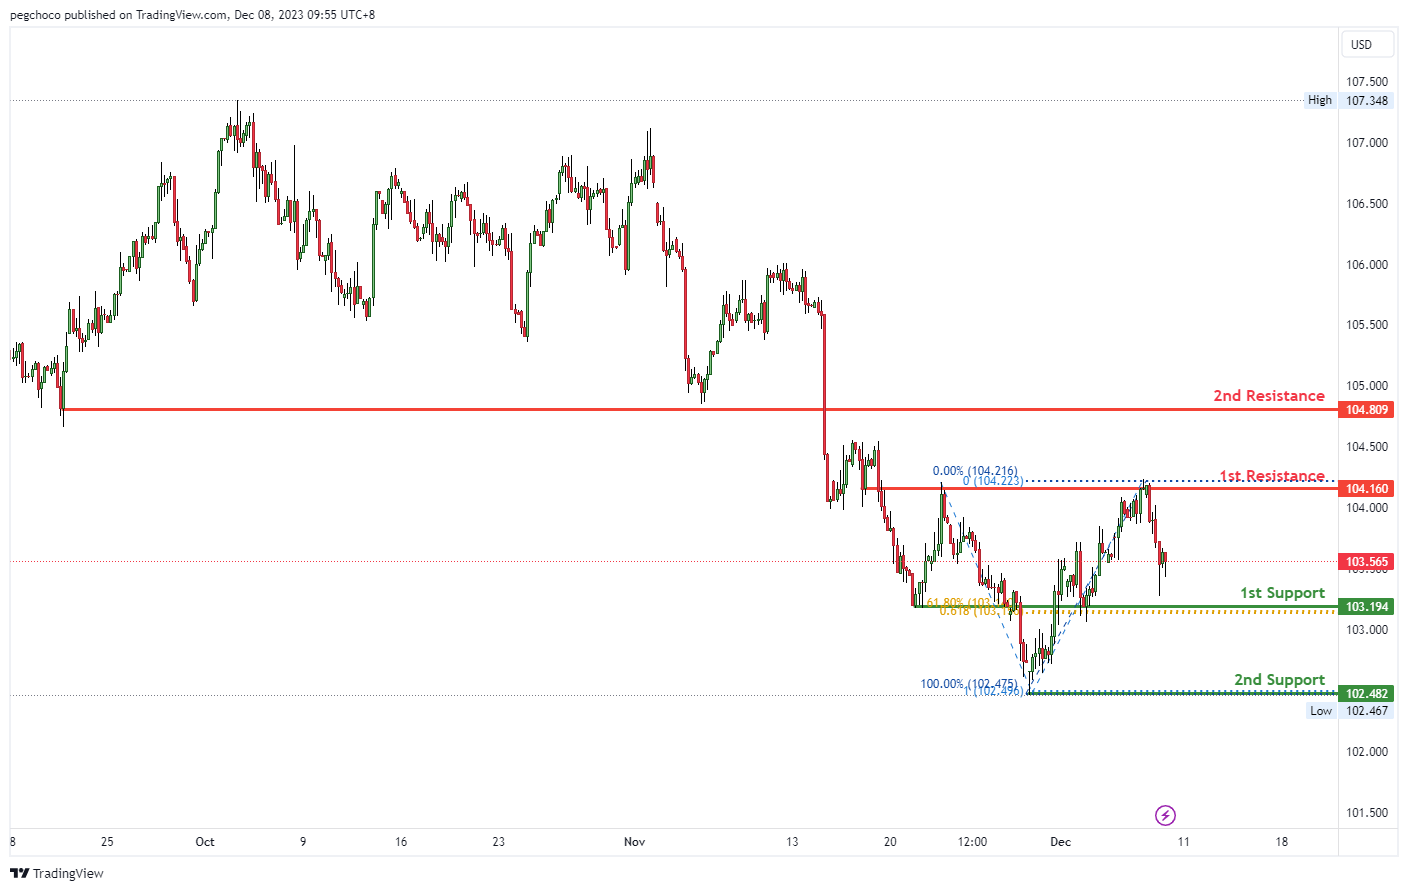
DXY:
The DXY chart currently shows a bearish overall momentum, indicating a potential for a bearish continuation in the price action.
The 1st support level at 103.19 is considered an overlap support. This level holds significance as it aligns with both the 61.80% Fibonacci Retracement and the 61.80% Fibonacci Projection, indicating a Fibonacci confluence. This confluence suggests that 103.19 could be a strong support level where buyers may step in.
The 2nd support at 102.48 is identified as a swing low support. Swing lows often serve as areas of potential buying interest, and this level reinforces the significance of 102.48 as a potential support zone.
On the resistance side, the 1st resistance at 104.16 is classified as an overlap resistance. Overlap resistances are historical levels where selling interest may intensify, potentially limiting upward price movements.
The 2nd resistance at 104.81 is categorized as a pullback resistance. This suggests that it is a level where selling pressure could increase, making it a potential barrier to further bullish movements.
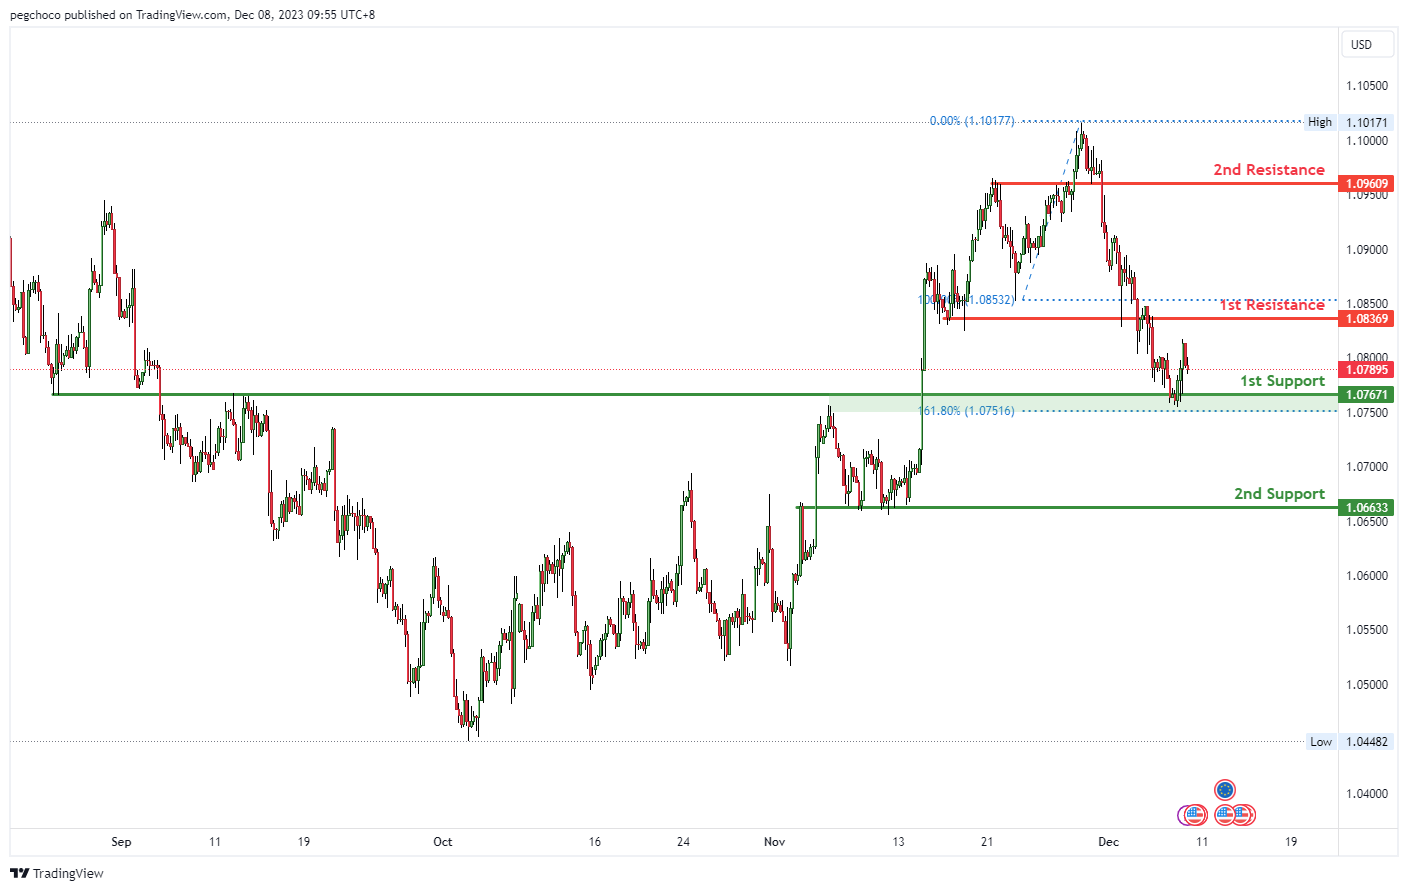
EUR/USD:
The EUR/USD chart currently exhibits a bearish overall momentum, suggesting a potential bearish reaction off the 1st resistance level.
The 1st support at 1.0767 is categorized as a pullback support and is also associated with the 161.80% Fibonacci Extension level. This confluence of technical factors suggests that 1.0767 could be a significant support level where buyers might step in, potentially providing support for the EUR/USD pair.
The 2nd support at 1.0663 is identified as an overlap support. Overlap supports are historical levels where buying interest may emerge, reinforcing the significance of this support level.
On the resistance side, the 1st resistance at 1.0836 is noted as an overlap resistance. Overlap resistances are historical levels where selling interest may intensify, potentially leading to a bearish reaction from this level.
The 2nd resistance at 1.0960 is categorized as a pullback resistance, indicating that it could be a level where selling pressure may increase, potentially limiting bullish movements.
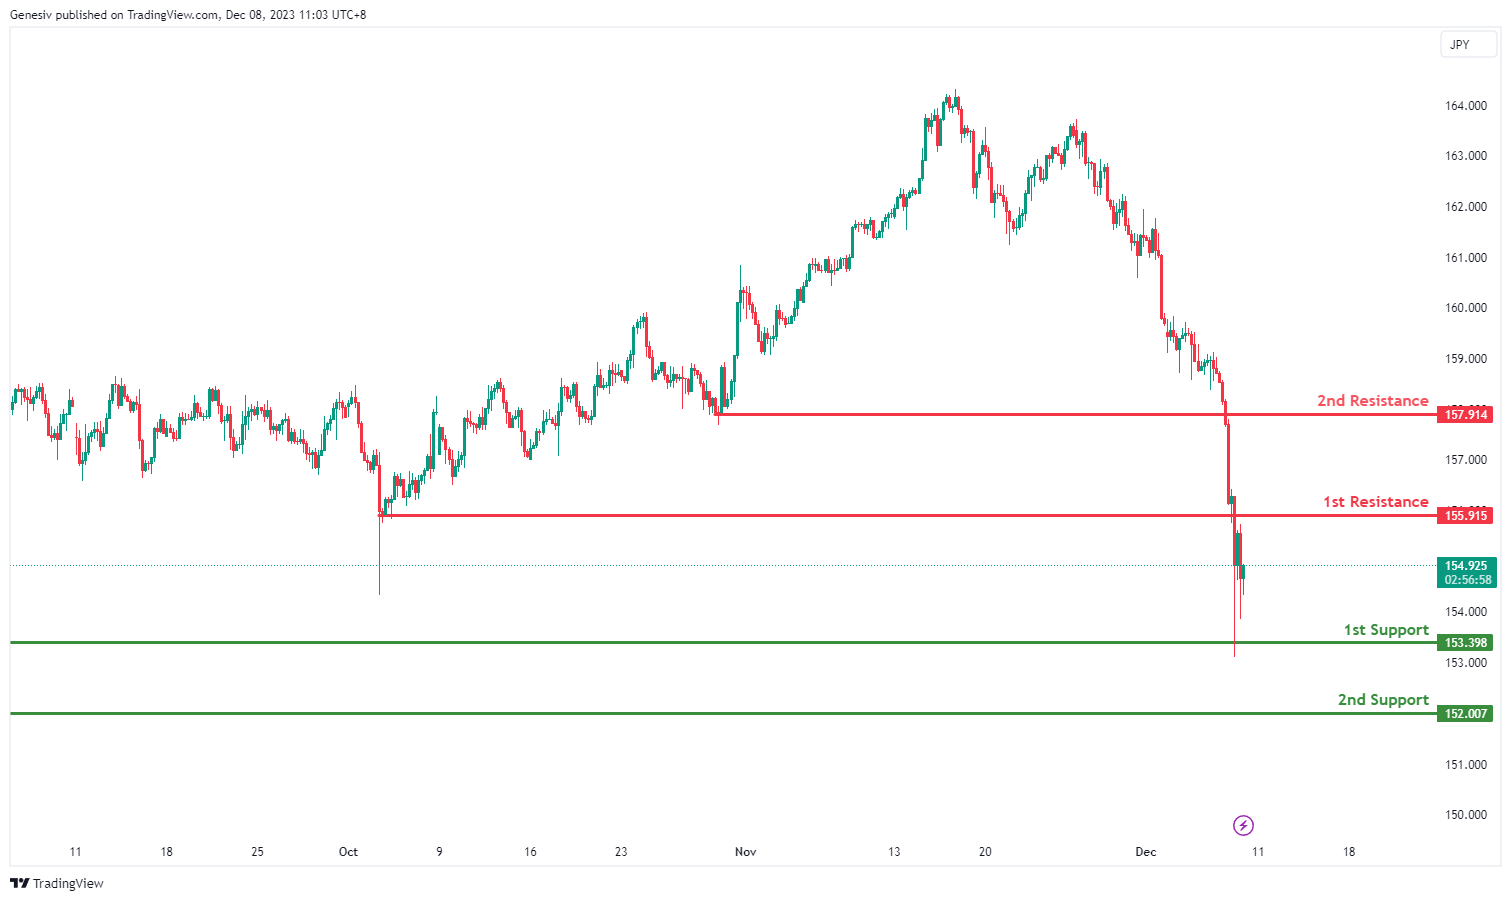
EUR/JPY:
The EUR/JPY chart currently has bearish overall momentum, suggesting a potential bearish continuation towards the first support.
1st Support at 153.40: This level is identified as a pullback support, indicating a potential area where buying interest might emerge, contributing to a stabilization in the price.
2nd Support at 152.01: The second support is described as a swing low support, reinforcing the notion that this level has historical significance as a support zone.
1st Resistance at 155.92: The first resistance is recognized as a pullback resistance, suggesting a level where selling interest might be observed, acting as a hurdle to further upward movement.
2nd Resistance at 157.00: The second resistance is noted as a pullback resistance, indicating a level where selling interest might be encountered, potentially acting as an additional barrier to the bearish trend.
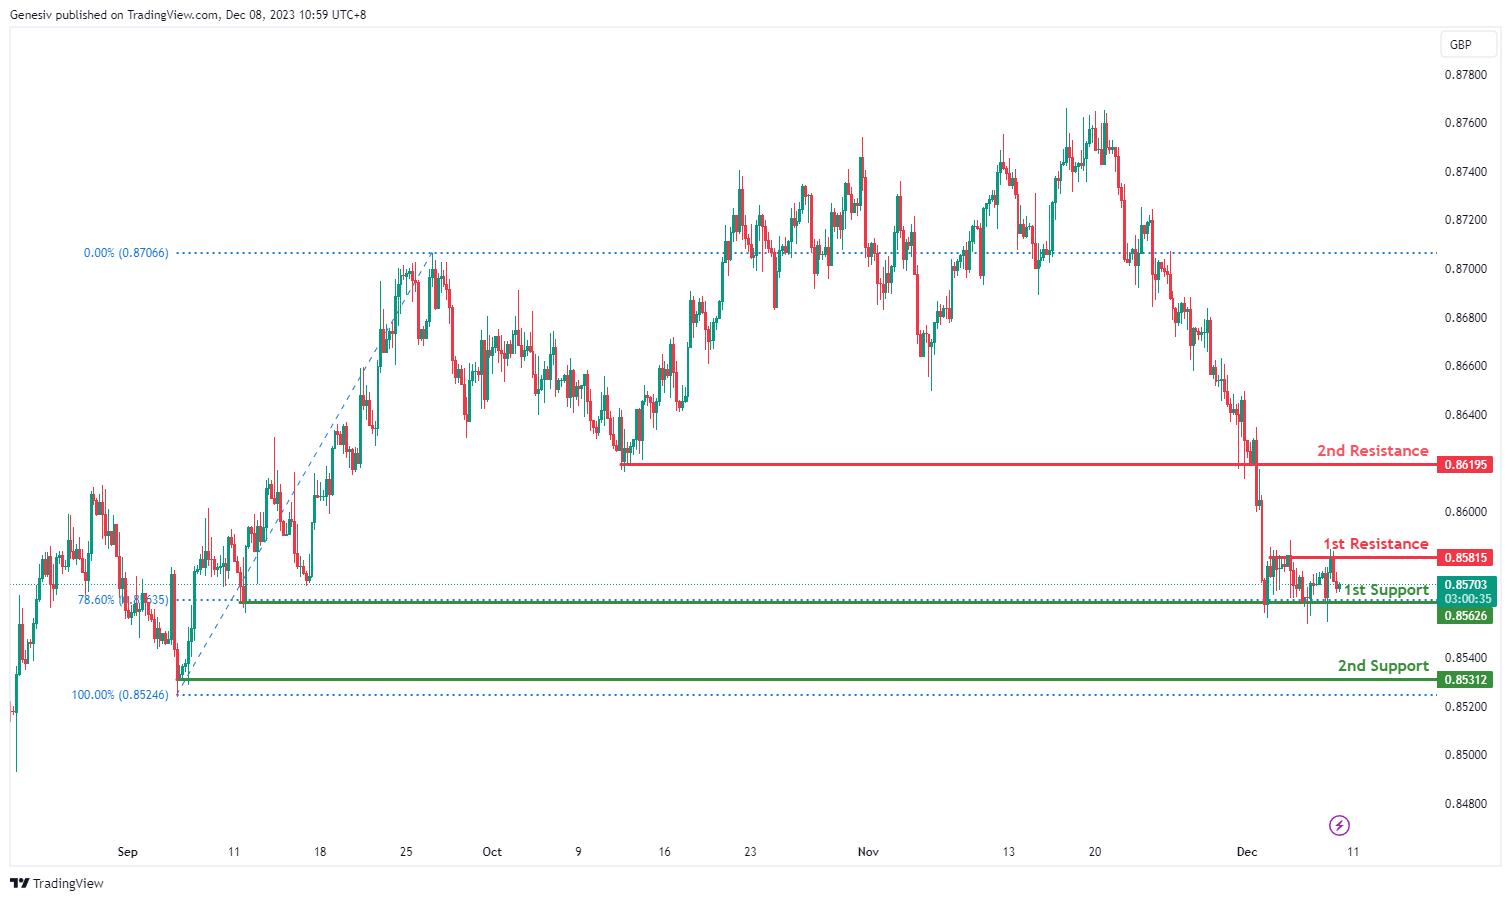
EUR/GBP:
The EUR/GBP currency pair exhibits a a weak bearish momentum with low confidence, suggesting a potential bearish continuation towards the first support.
1st Support at 0.8563: This level is identified as a multi-swing low support, indicating historical significance as a level where the price has found support. Additionally, it coincides with the 78.60% Fibonacci retracement, adding to its potential strength as a support zone.
2nd Support at 0.8531: The second support is described as a pullback support, reinforcing the notion that buyers might show interest at this level, potentially leading to a stabilization in price.
1st Resistance at 0.8582: The first resistance is recognized as a multi-swing high resistance, suggesting historical points where the price faced obstacles and potential reversals. This level may act as a barrier to upward movement.
2nd Resistance at 0.8620: The second resistance is noted as a pullback resistance, indicating a level where selling interest might be observed, potentially acting as an obstacle to the bearish trend.
GBP/USD:
The GBP/USD chart currently exhibits a bearish overall momentum, indicating potential for a bearish continuation towards the 1st support level.
The 1st support at 1.2535 is categorized as an overlap support. Overlap supports are historical levels where buying interest may emerge, potentially providing support for the GBP/USD pair.
The 2nd support at 1.2446 is also identified as an overlap support, reinforcing its significance as a potential level where buyers might become active.
On the resistance side, the 1st resistance at 1.2604 is noted as an overlap resistance. Overlap resistances are historical levels where selling interest may intensify, potentially limiting upward movements.
The 2nd resistance at 1.2679 is categorized as an overlap resistance, further indicating its potential significance as a level where selling pressure may increase.

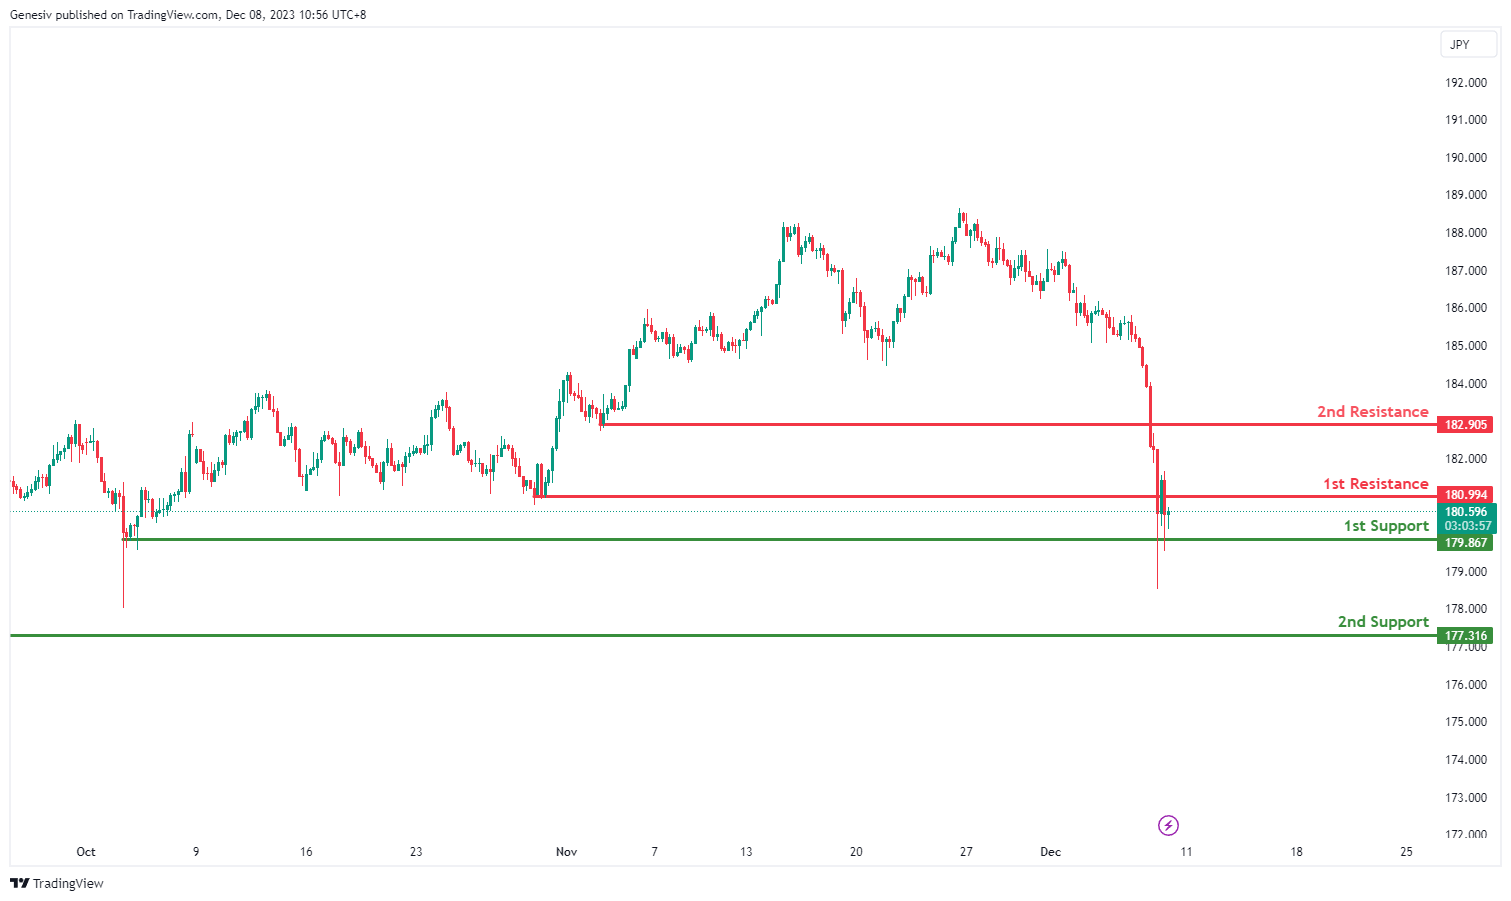
GBP/JPY:
The GBP/JPY currency pair is currently experiencing a bearish momentum, indicating a potential bearish continuation towards the first support.
1st Support at 179.87: This level is identified as a swing low support, suggesting historical significance as a level where the price has found support in the past.
2nd Support at 177.32: The second support is described as a pullback support, indicating a level where buyers might show interest, potentially leading to price stabilization.
1st Resistance at 180.99: The first resistance is recognized as a pullback resistance, suggesting a level where selling interest might be observed, acting as a hurdle to further downward movement.
2nd Resistance at 182.91: The second resistance is noted as a pullback resistance, reinforcing the potential for selling interest and acting as an additional obstacle to the bearish trend.
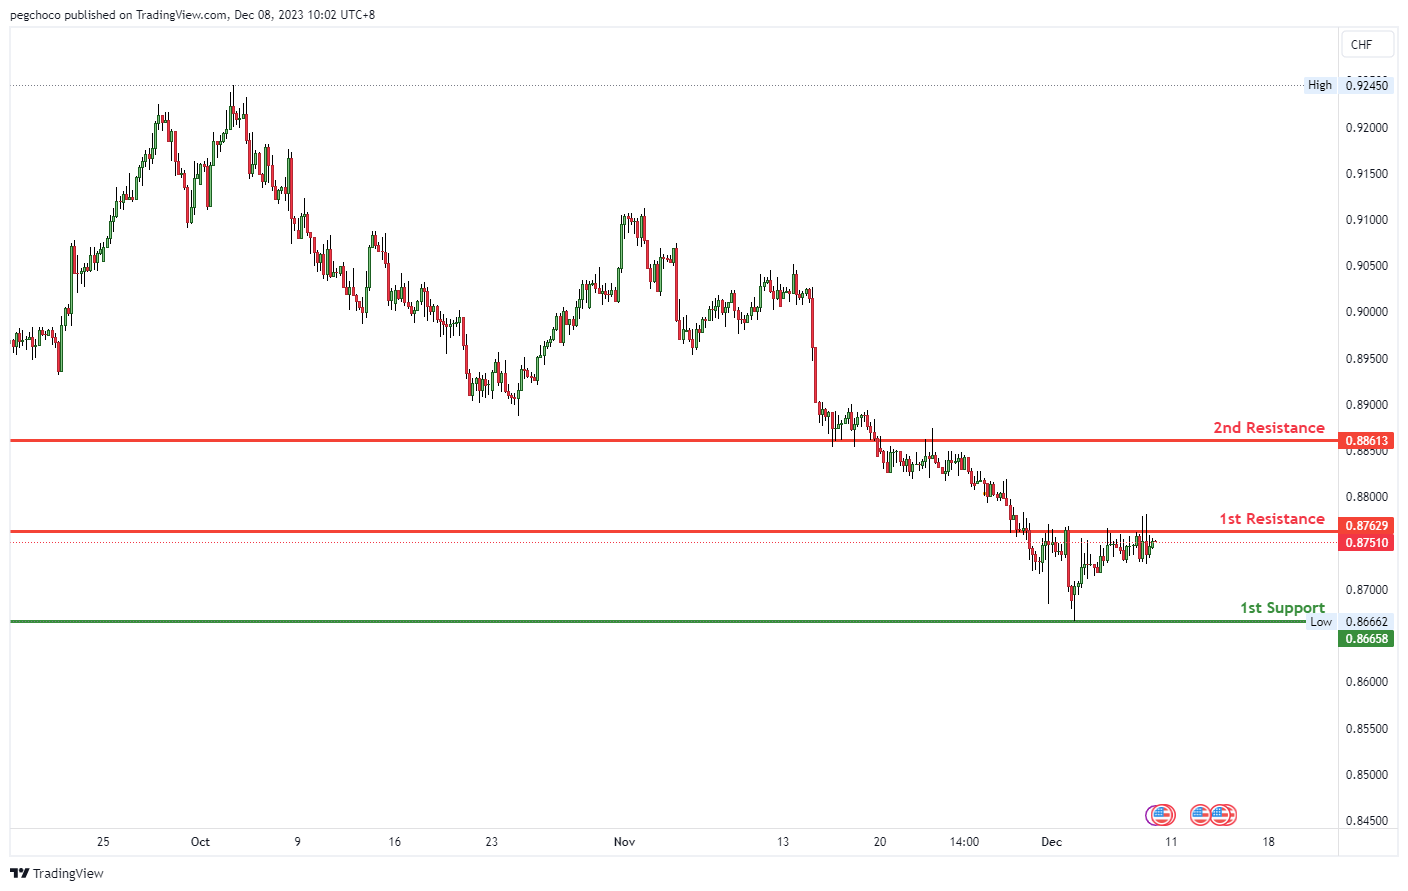
USD/CHF:
The analysis for the USD/CHF currency pair is as follows:
The USD/CHF chart currently displays a neutral overall momentum, suggesting that price could potentially fluctuate between the 1st resistance and 1st support levels.
The 1st support at 0.8665 is categorized as a multi-swing low support. Multi-swing low supports are historical levels where buying interest may emerge, potentially providing support for the USD/CHF pair.
On the resistance side, the 1st resistance at 0.8762 is identified as an overlap resistance. Overlap resistances are historical levels where selling interest may intensify, potentially limiting upward movements.
The 2nd resistance at 0.8861 is also categorized as an overlap resistance, reinforcing its significance as a potential level where selling pressure may increase.
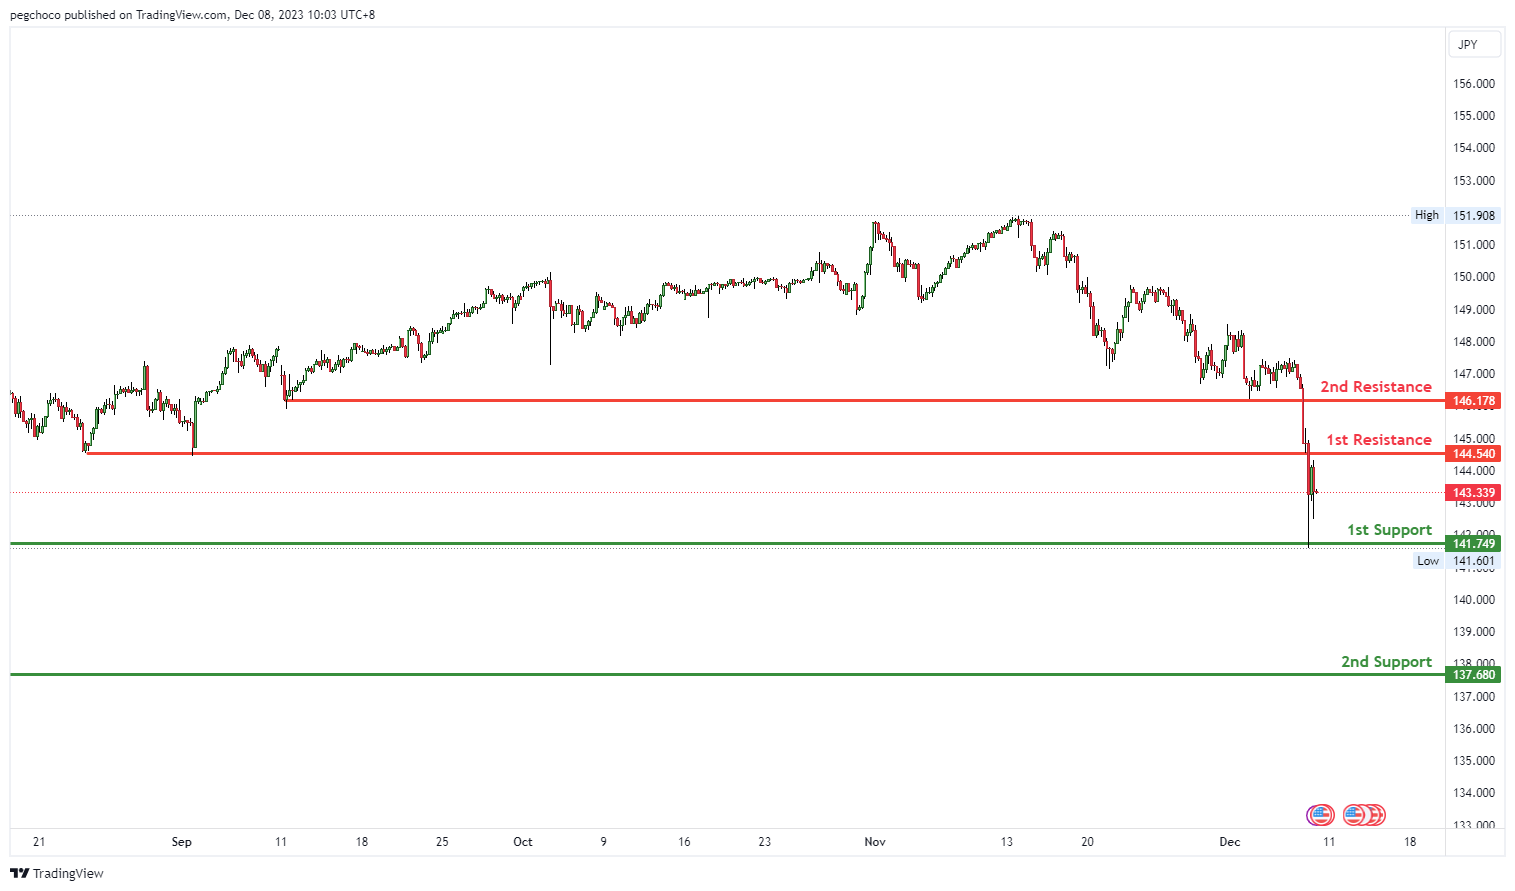
USD/JPY:
The USD/JPY chart currently exhibits a bearish overall momentum, suggesting the potential for a bearish continuation towards the 1st support level.
The 1st support at 141.74 is categorized as an overlap support. Overlap supports are historical levels where buying interest may emerge, potentially providing support for the USD/JPY pair.
Further down, there is a 2nd support at 137.68, also identified as an overlap support. This reinforces the significance of this support level, suggesting it as a potential area where buyers might become active.
On the resistance side, the 1st resistance at 144.74 is noted as a pullback resistance, implying that it’s a substantial barrier where selling interest could intensify, potentially triggering a bearish continuation.
The 2nd resistance at 146.17 is also identified as a pullback resistance, further indicating its potential significance as a level where selling pressure may increase.
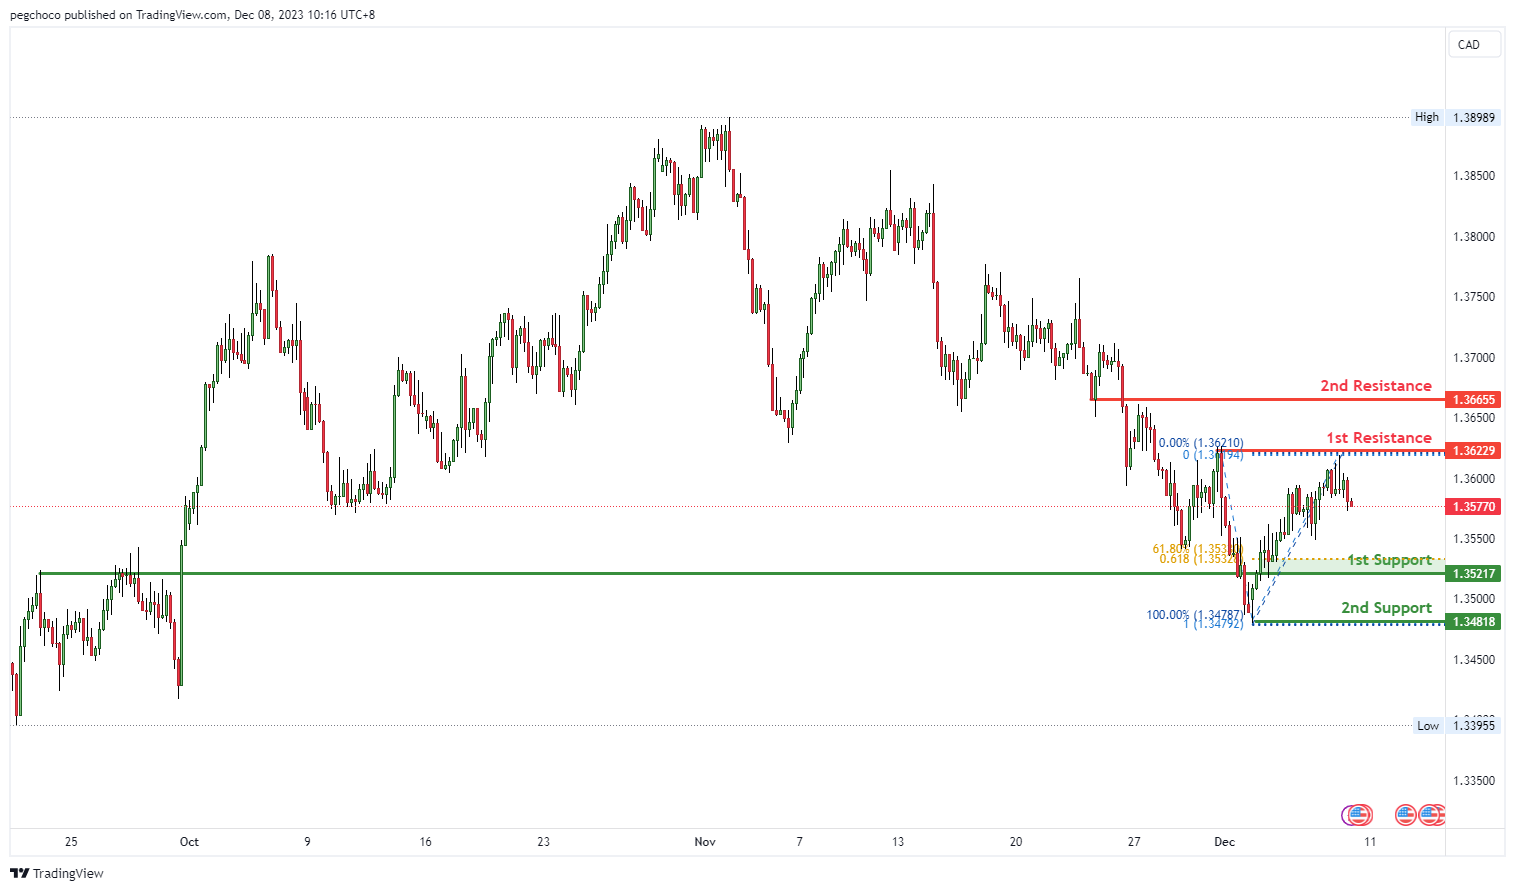
USD/CAD:
The USD/CAD chart currently has a bearish overall momentum, and there’s potential for a bearish continuation towards the 1st support level.
The 1st support at 1.3521 is categorized as an overlap support. This level is significant because it indicates a confluence of technical factors, including the 61.80% Fibonacci Retracement and the 61.80% Fibonacci Projection. This suggests that it could be a strong level where buying interest may emerge, potentially providing support for the USD/CAD pair.
The 2nd support at 1.3481 is identified as a swing low support, further reinforcing its significance as a potential level where buyers might become active. Additionally, it is associated with the 100% Fibonacci Projection, making it a notable level.
On the resistance side, the 1st resistance at 1.3622 is noted as a swing high resistance. This implies that it’s a substantial barrier where selling interest could intensify, potentially limiting upward movements.
The 2nd resistance at 1.3666 is categorized as an overlap resistance, indicating its potential significance as a level where selling pressure may increase.
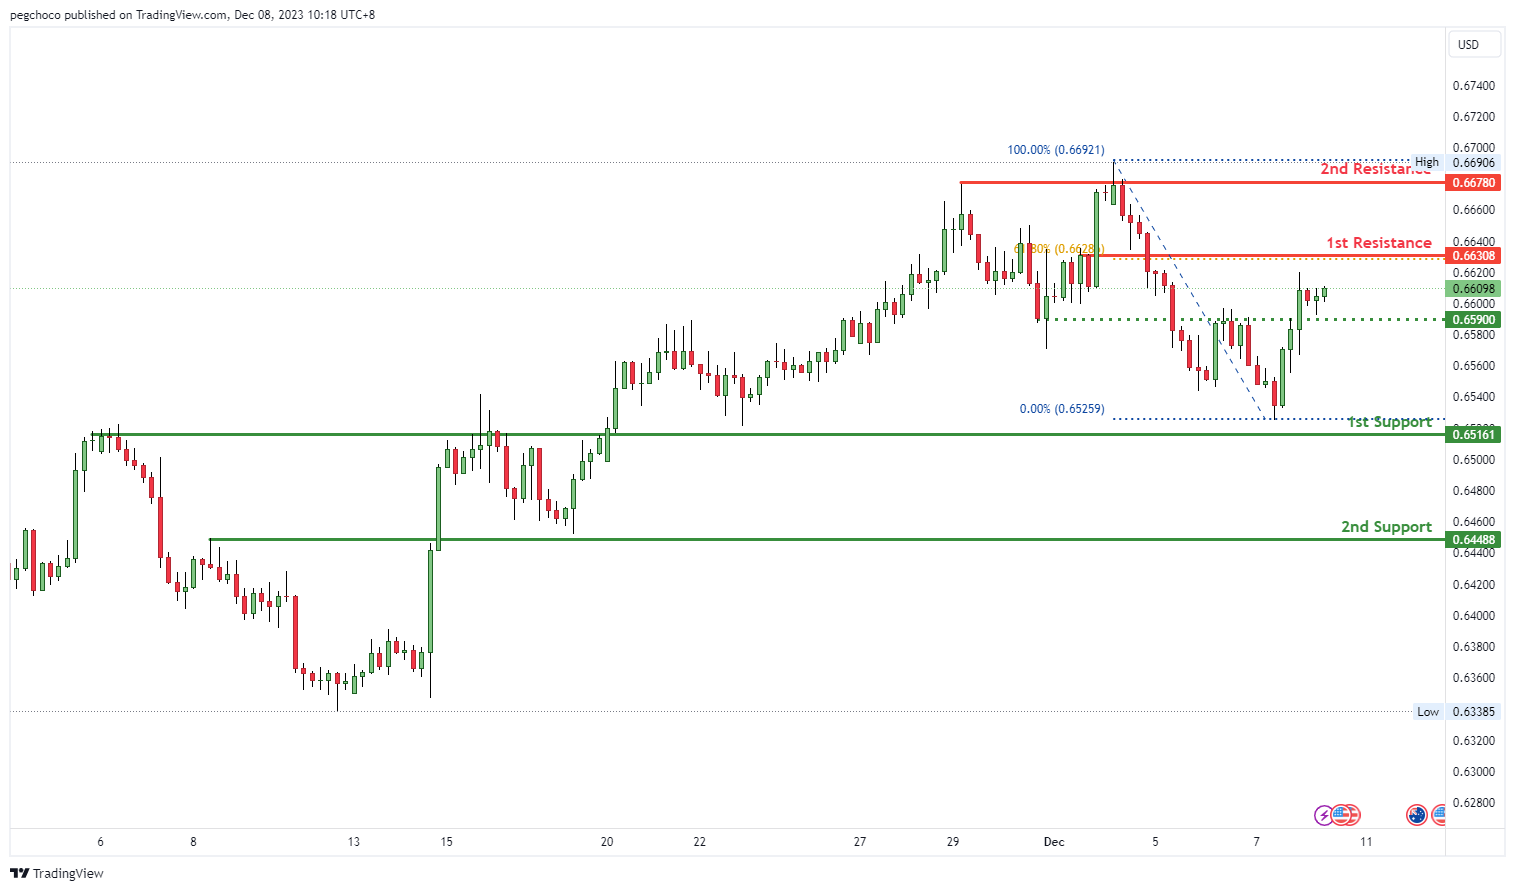
AUD/USD:
The AUD/USD chart currently exhibits a bearish overall momentum, and there’s potential for a bearish reaction off the 1st resistance level with a subsequent drop towards the 1st support.
The 1st support at 0.6516 is categorized as a pullback support, indicating it could be a significant level where buying interest may emerge, potentially providing support for the AUD/USD pair.
The 2nd support at 0.6448 is also identified as a pullback support, reinforcing the significance of this support level as a potential area where buyers might become active.
On the resistance side, the 1st resistance at 0.6630 is noted as a pullback resistance and is associated with the 61.80% Fibonacci Retracement level. This suggests it as a substantial barrier where selling interest could intensify, potentially leading to a bearish reaction.
The 2nd resistance at 0.6678 is categorized as a multi-swing high resistance, indicating another level where selling pressure may increase.
Additionally, there is an intermediate support at 0.6590, categorized as an overlap support, suggesting it as a level where buyers could also provide support.
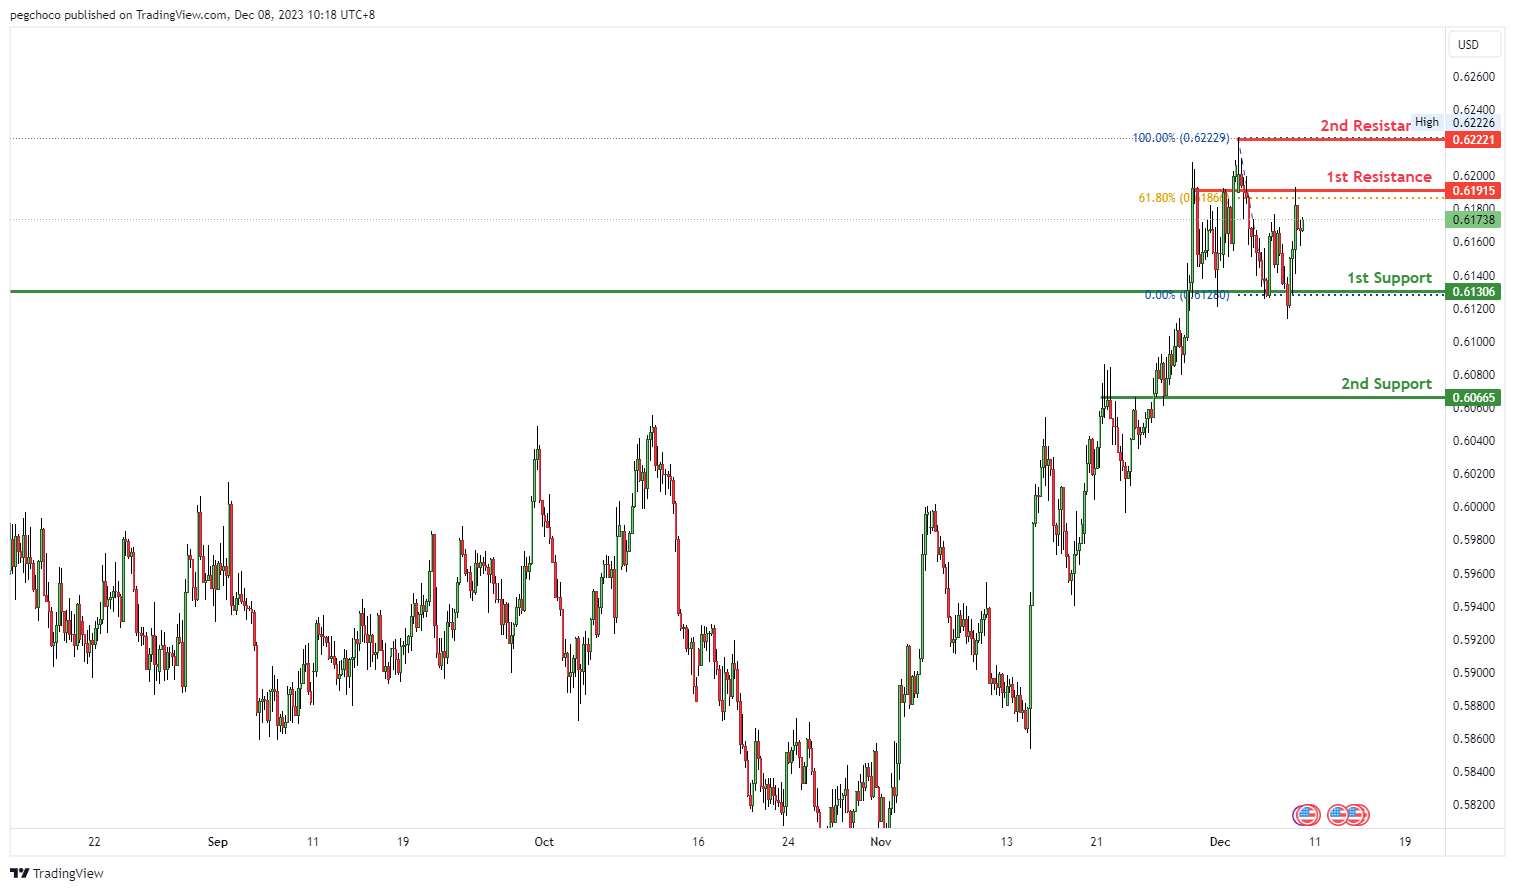
NZD/USD
The NZD/USD chart currently has a bearish overall momentum, and there’s potential for a bearish reaction off the 1st resistance level with a subsequent drop towards the 1st support.
The 1st support at 0.6130 is categorized as an overlap support, indicating that it could be a significant level where buying interest may emerge, potentially providing support for the NZD/USD pair.
The 2nd support at 0.6066 is also identified as an overlap support, reinforcing the significance of this support level as a potential area where buyers might become active.
On the resistance side, the 1st resistance at 0.6191 is noted as an overlap resistance and is also associated with the 61.80% Fibonacci Retracement level. This suggests it as a substantial barrier where selling interest could intensify, potentially leading to a bearish reaction.
The 2nd resistance at 0.6222 is categorized as a swing high resistance, indicating another level where selling pressure may increase.
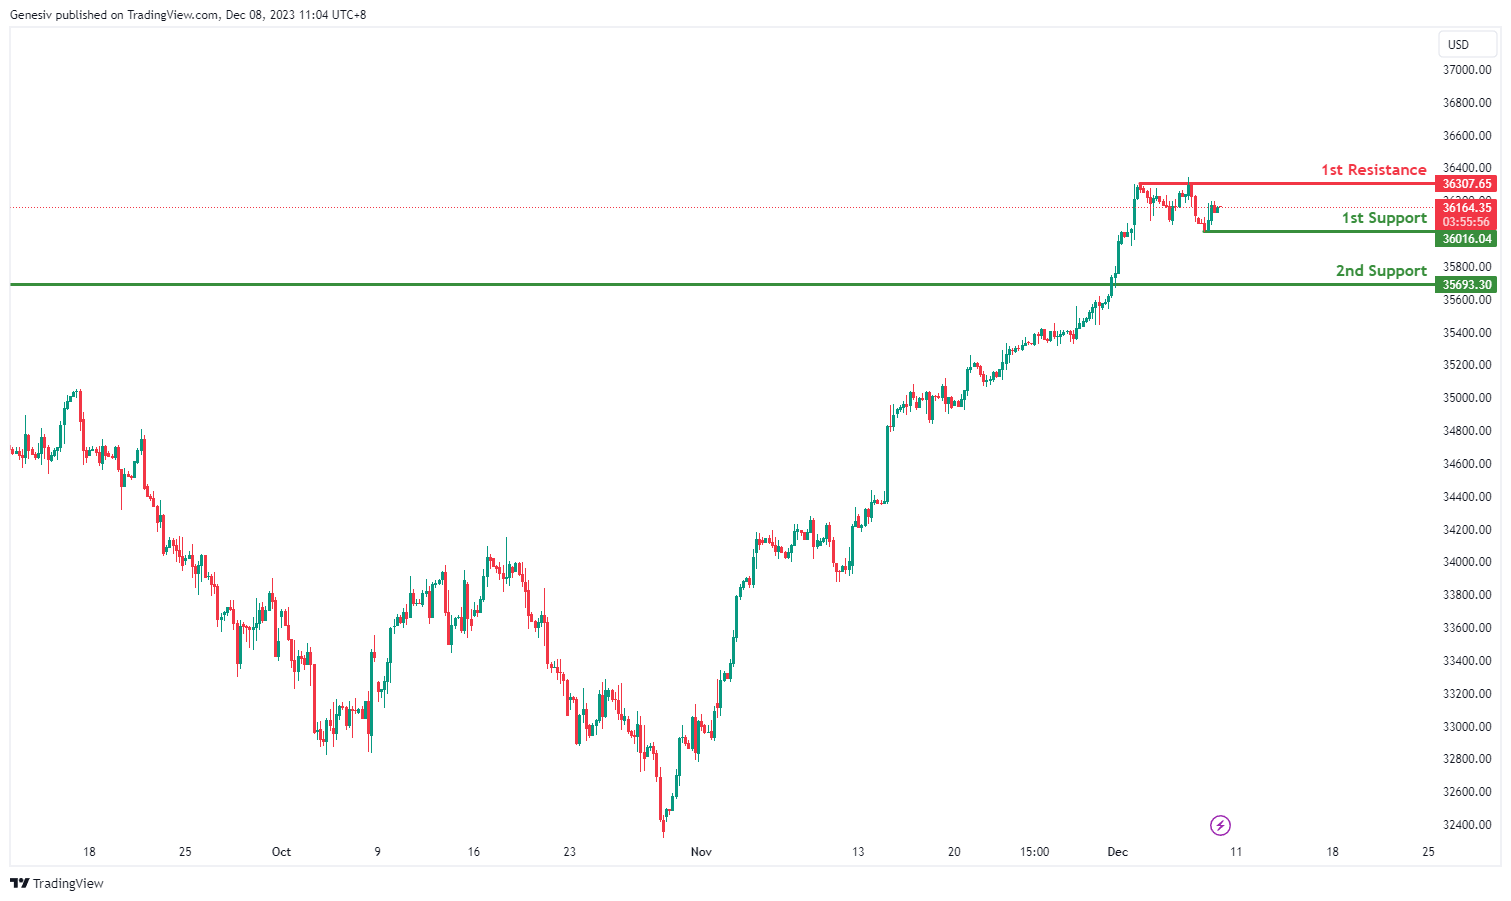
DJ30:
The DJ30 shows a neutral overall momentum, indicating a lack of a clear bullish or bearish trend. The potential price movement suggests a scenario in which the price could fluctuate between the first resistance and the first support levels. Overall Momentum: Neutral
1st Support at 36016.04: This level is identified as a swing low support, suggesting historical significance as a level where the price has found support in the past.
2nd Support at 35693.30: The second support is described as a pullback support, indicating a level where buyers might show interest, potentially stabilizing the price.
1st Resistance at 36307.65: This level is recognized as a swing high resistance, representing a historical point where the price has faced obstacles and potential reversals.
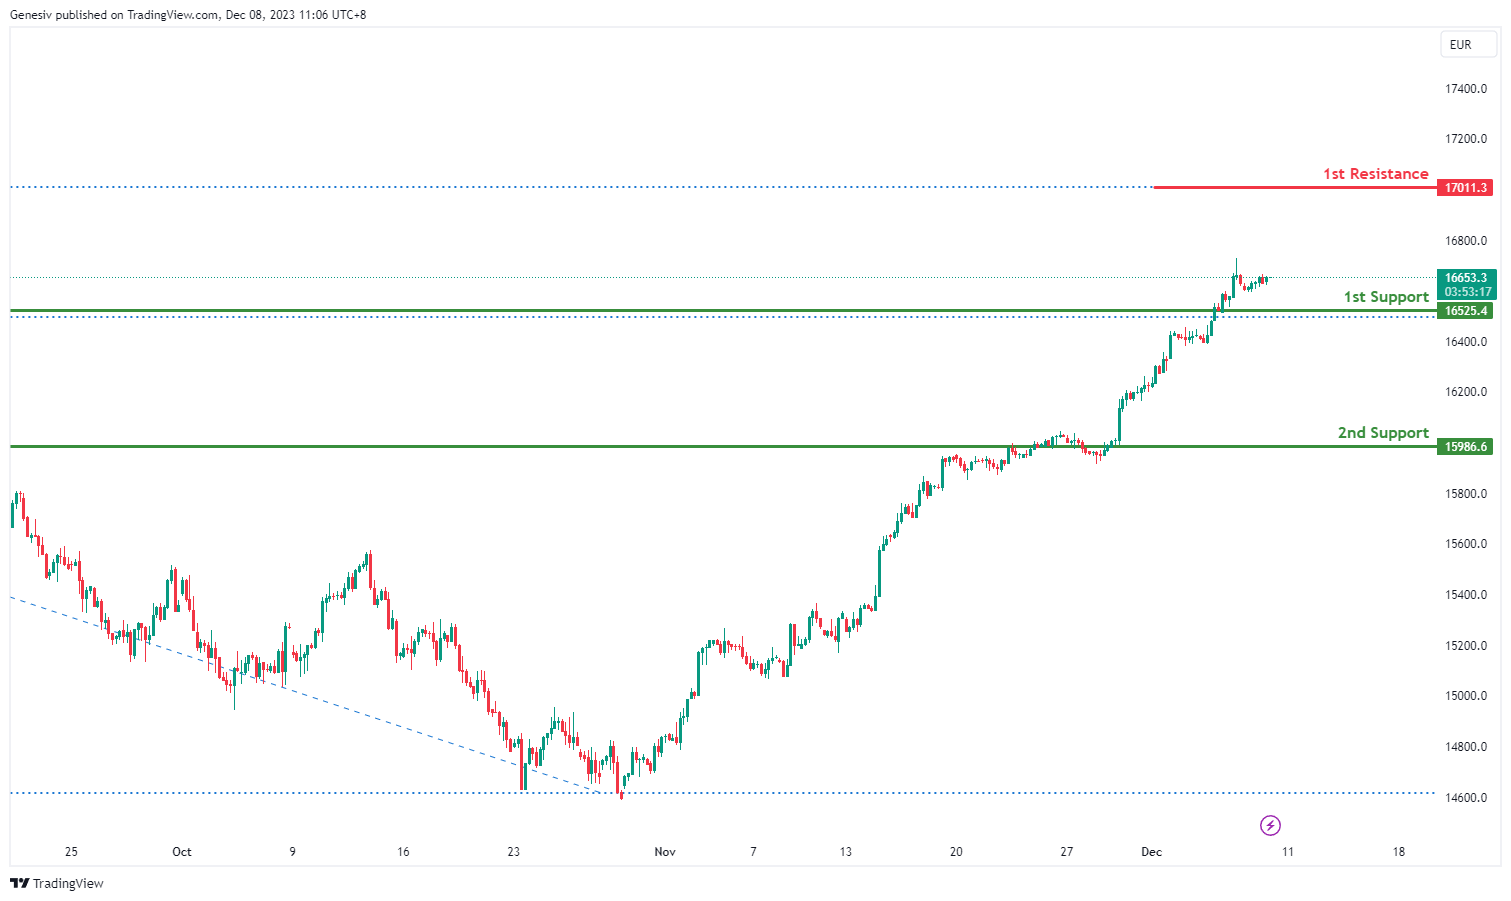
GER40:
The GER40 indicates a llish overall momentum, suggesting a potential continuation towards the first resistance.
1st Support at 16524.4: This level is identified as a pullback support, indicating a potential area where buying interest might emerge, contributing to price stabilization.
2nd Support at 15986.6: The second support is also described as a pullback support, reinforcing the notion that buyers could be interested in this level, potentially providing strong support.
1st Resistance at 17009.4: The first resistance is noted as being at the 127.20% Fibonacci Extension level, signifying a potential barrier where the price might face selling pressure or a reversal within its bullish trend.
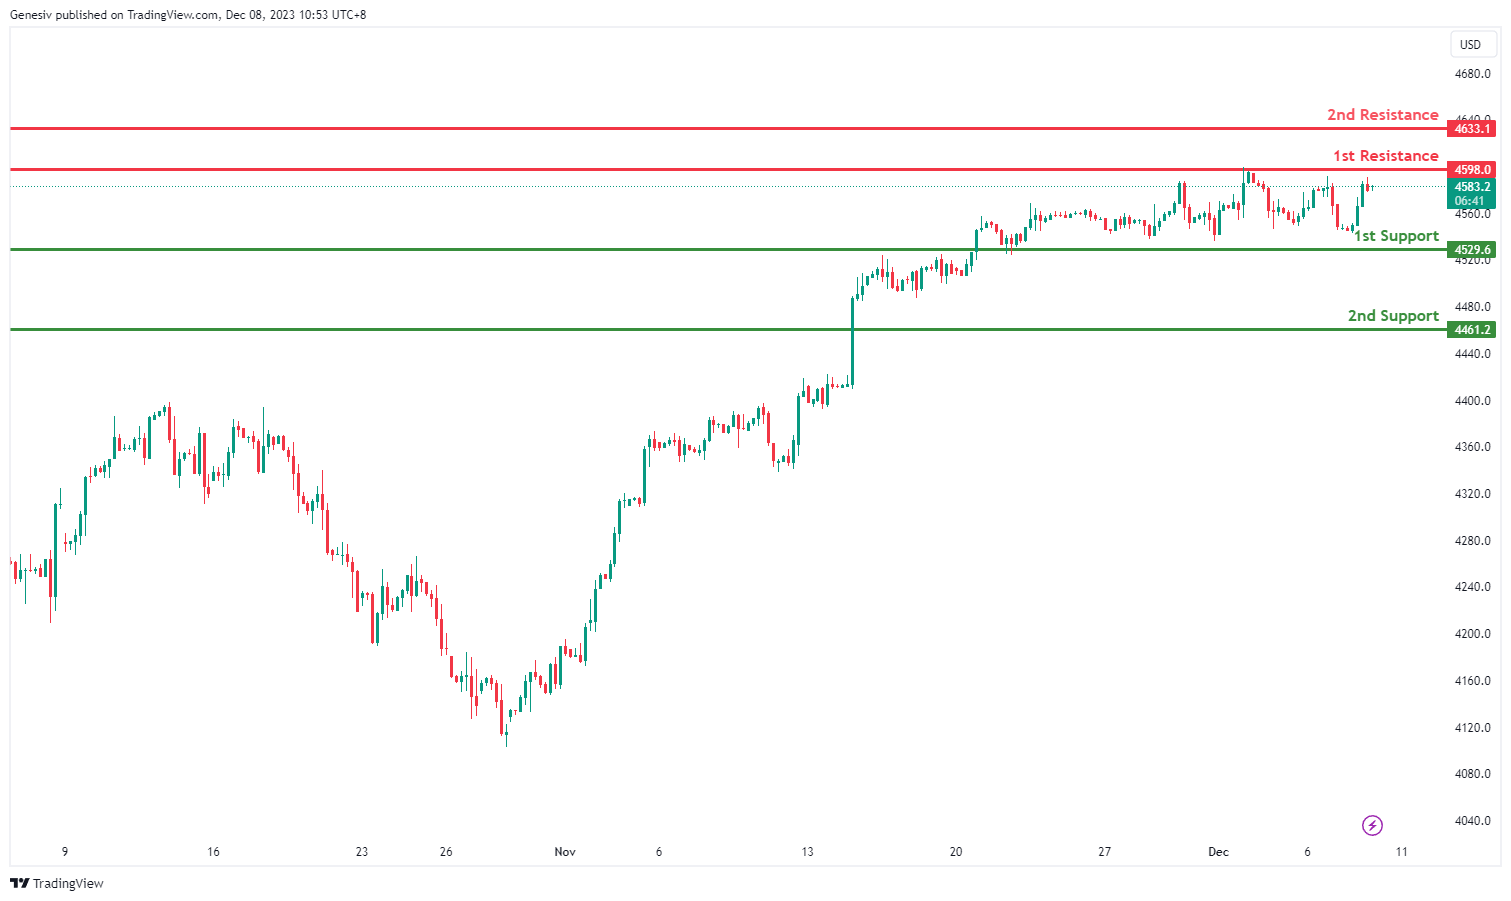
US500:
The chart of US500 indicates a bullish overall momentum, suggesting a potential continuation towards the first resistance.
1st Support at 4529.6: This level is identified as an overlap support, indicating historical significance as a level where the price has found support in the past.
2nd Support at 4461.2: The second support is described as a pullback support, suggesting a level where buyers might show interest, potentially leading to price stabilization.
1st Resistance at 4598.0: The first resistance is recognized as a multi-swing high resistance, signifying a historical point where the price faced obstacles and potential reversals in its upward movement.
2nd Resistance at 4633.1: The second resistance is noted as a pullback resistance, indicating a level where selling interest might be observed, potentially acting as a hurdle to further bullish movement.
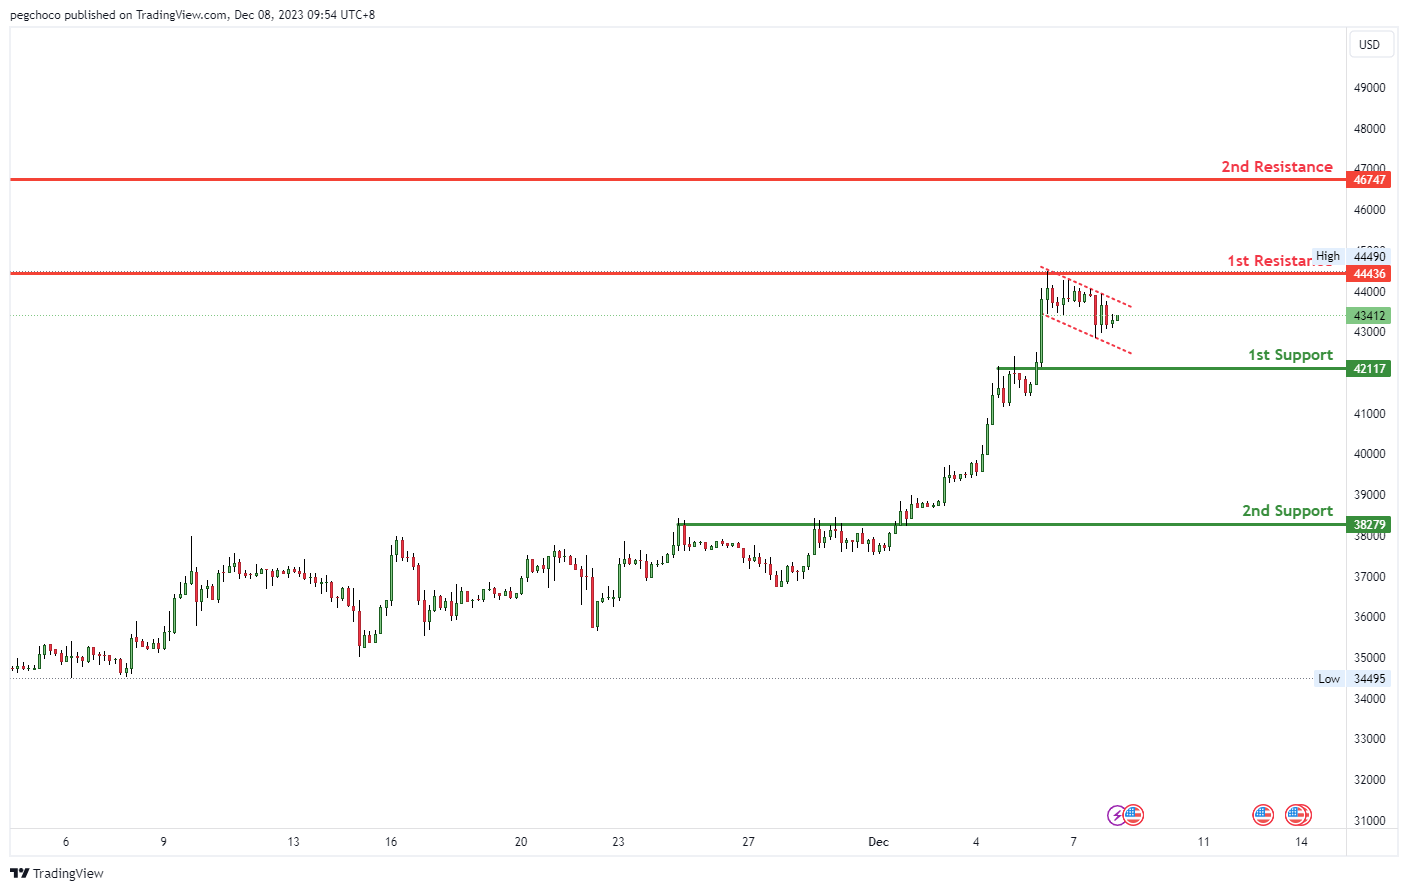
BTC/USD:
The BTC/USD chart currently exhibits a bullish overall momentum, and there’s potential for a bullish bounce off the 1st support level, signaling a potential upward movement towards the 1st resistance.
The 1st support at 42117 is categorized as an overlap support, indicating that it could be a significant level where buying interest may emerge, potentially providing support for the BTC/USD pair.
Further reinforcing this potential bullish scenario, there is a 2nd support at 38283, also identified as an overlap support. This additional support level adds to the significance of the potential bounce.
On the resistance side, the 1st resistance at 44436 is noted as a pullback resistance. This suggests that it’s a substantial barrier where selling interest could intensify, potentially causing a temporary pause in the bullish movement.
The 2nd resistance at 46747 is categorized as an overlap resistance, further indicating its potential significance as a level where selling pressure may increase.
Additionally, a “Bullish Flag” pattern is observed. Bullish flag patterns are common in equities that are in a sustained rally and are regarded as strong continuation patterns. This pattern often indicates that after a brief consolidation or pullback (the “flag”), there’s a potential for the previous upward trend to continue.
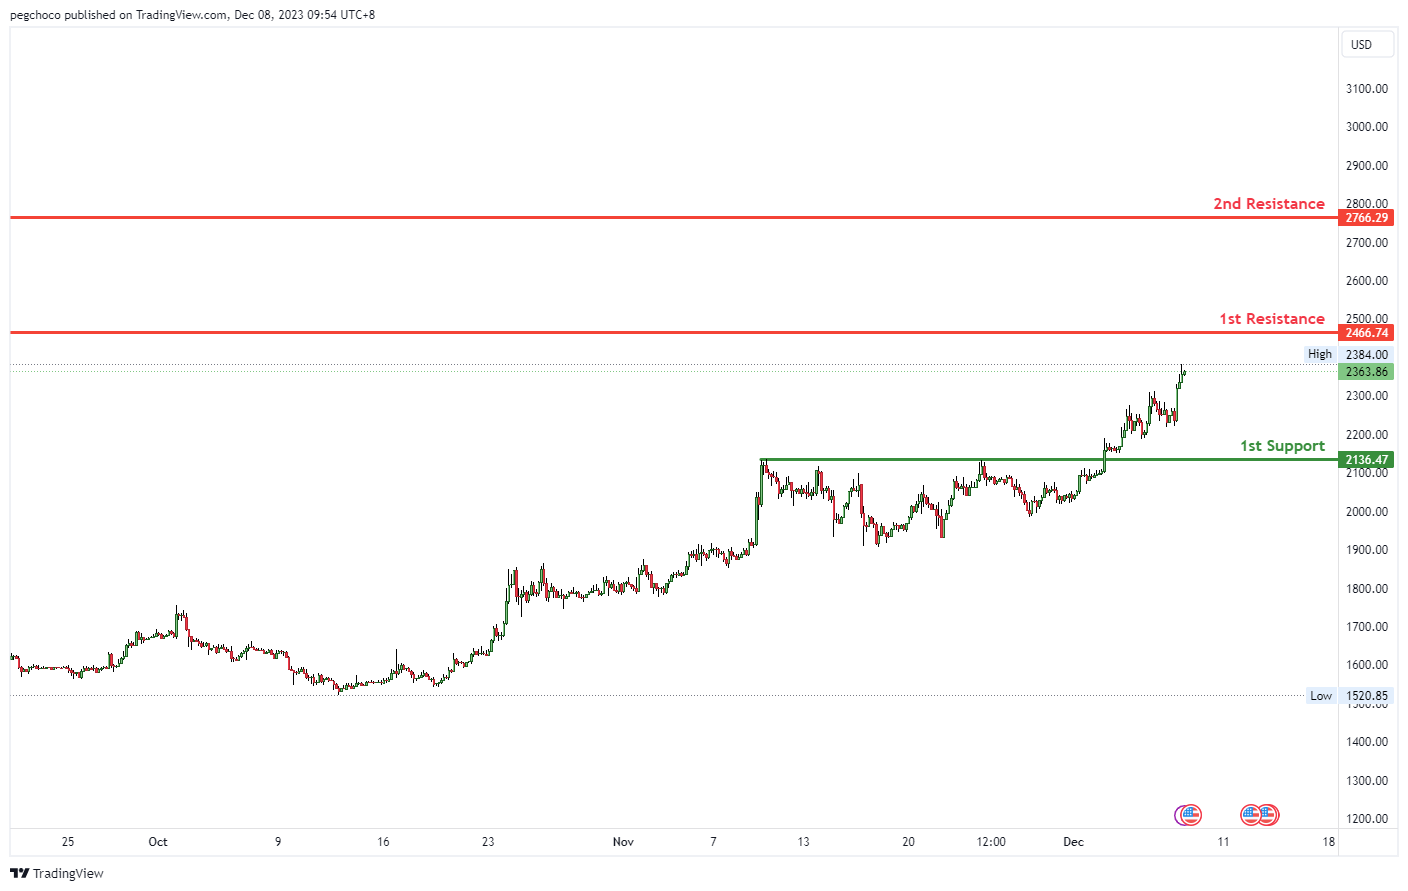
ETH/USD:
The ETH/USD chart currently exhibits a bullish overall momentum, and there’s potential for a bullish continuation towards the 1st resistance level.
The 1st support at 2136.47 is categorized as a pullback support. This level might act as a significant support zone where buying interest may emerge, potentially providing support for the Ethereum/US Dollar pair.
On the resistance side, the 1st resistance at 2466.74 is identified as an overlap resistance. This suggests that it’s a substantial barrier where selling interest could intensify, potentially limiting further upward movements.
The 2nd resistance at 3766.29 is categorized as a pullback resistance, indicating another level where selling pressure may increase.
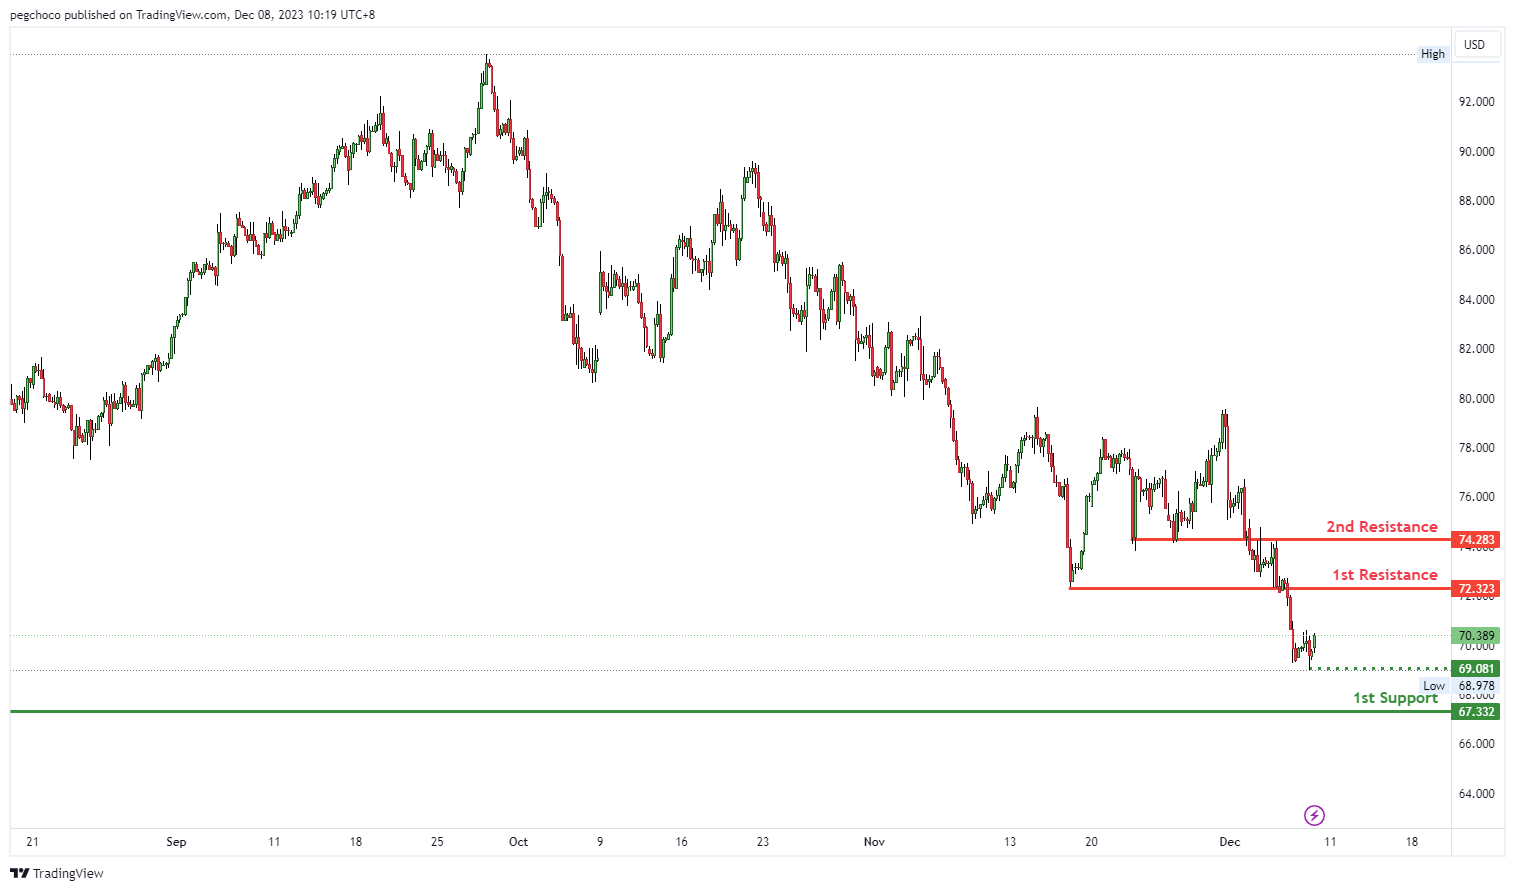
WTI/USD:
The WTI chart currently has a bearish overall momentum, and there’s potential for a bearish reaction off the 1st resistance level with a subsequent drop towards the 1st support.
The 1st support at 67.33 is categorized as a multi-swing low support, indicating that it could be a significant level where buying interest may emerge, potentially providing support for the WTI price.
Intermediate support is noted at 69.08, which is identified as a swing low support. This adds to the significance of potential support in this area.
On the resistance side, the 1st resistance at 72.32 is categorized as a pullback resistance, implying that it’s a substantial barrier where selling interest could intensify, potentially leading to a bearish reaction.
The 2nd resistance at 74.28 is identified as an overlap resistance, indicating another level where selling pressure may increase.
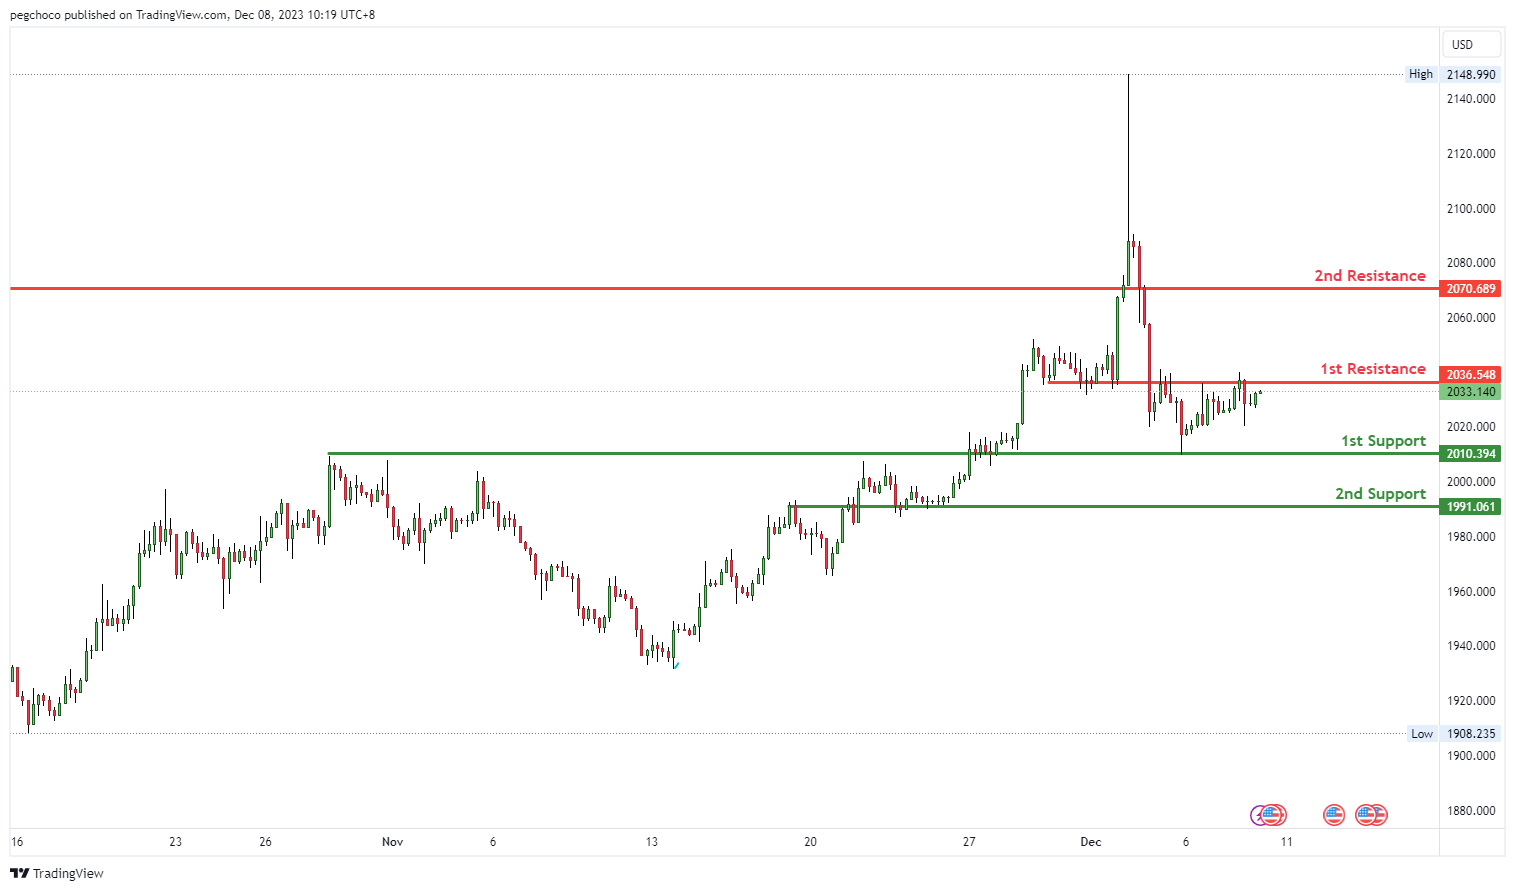
XAU/USD (GOLD):
The XAU/USD chart currently exhibits a neutral overall momentum, suggesting the potential for price to fluctuate between the 1st resistance and 1st support levels.
The 1st support at 2010.39 is categorized as an overlap support. Overlap supports are historical levels where buying interest may emerge, potentially providing support for the XAU/USD pair.
Further down, there is a 2nd support at 1991.06, also identified as an overlap support. This reinforces the significance of this support level, suggesting it as a potential area where buyers might become active.
On the resistance side, the 1st resistance at 2036.54 is noted as an overlap resistance, implying that it’s a substantial barrier where selling interest could intensify, potentially limiting upward movements.
The 2nd resistance at 2070.68 is categorized as a pullback resistance, further indicating its potential significance as a level where selling pressure may increase.
US NFP in spotlight: A crucial test for soft-landing hypothesis
Today's primary focus in the financial markets is US Non-Farm Payrolls report, which is keenly anticipated by investors assessing the "soft landing" scenario in the economy. The soft landing hypothesis implies that labor market is cooling sufficiently to reduce inflation and pave the way for Fed to start lowering interest rates next year, without posing a significant threat to the overall economy.
Non-Farm Payrolls report is expected to indicate that job growth reaccelerated to 190k in November, up from October's 150k. Unemployment rate is projected to remain steady at 3.9%, and average hourly earnings are anticipated to show 0.3% mom increase.
Recent labor market data has shown signs of cooling. ISM Manufacturing Employment index dropped from 46.8 to 45.8, while ISM Services Employment index saw a slight improvement from 50.2 to 50.7. ADP Employment growth recorded 103k, nearly unchanged from the previous month's 106k. The four-week moving average of initial jobless claims rose from 213k to 221k. Additionally, the latest JOLTs reported a drop in the ratio of job openings to number of unemployed workers to 1.34, the lowest since August 2021.
A "goldilocks" Non-Farm Payrolls report, signifying a balanced labor market condition, could reignite bull runs in the stock markets and subsequently exert renewed selling pressure on the Dollar. However, market reactions to deviations from this ideal scenario are difficult to predict.
Regarding the Dollar index, recovery from 102.46 was interrupted after reaching 104.23, largely due to the steep selloff in USD/JPY. For now, further rise is mildly in favor as long as 103.06 minor support holds, towards 55 D EMA (now at 103.54).
But the index could start to struggle above there, unless EUR/USD could extended its near term decline through 55 D EMA decisively, while USD/JPY could stabilize at 142.45 fibonacci support.
Japan’s nominal pay rises 1.5% yoy, but fail to keep pace with inflation, consumer spending drops
Japan's nominal pay growth rose by 1.5% yoy, surpassing the expected 1.0% yoy increase. This marked the fastest rate of increase since June. Regular or base salaries contributed to this increase with a 1.4% yoy rise. However, overtime pay slightly decreased by -0.1% yoy. Special payments, a variable component of wages, saw a significant jump of 7.5% yoy.
However, the positive trend in nominal pay was offset by the continued decline in inflation-adjusted real wages, which fell for the 19th consecutive month, dropping by -2.3% yoy. A labor ministry official commented, "Price increases have outpaced wage growth." This situation is exacerbated by the consumer inflation rate, which includes fresh food prices but excludes owner's equivalent rent, re-accelerating to 3.9% after a brief two-month slowdown.
Alongside wage trends, household spending in Japan also experienced a downturn, decreasing by -2.5% yoy in October. This decline, while still significant, was less severe than the anticipated 3.0% yoy drop. The continued decrease in household spending, which has now extended to eight consecutive months, reflects ongoing challenges in the domestic consumption sector.
BoC’s Gravelle elaborates on holding interest rates steady amid balanced economy
In a speech overnight, BoC Deputy Governor Toni Gravelle said the decision to maintain policy interest rate at 5% this week was an effort to "balance the risks of over- and under-tightening." BoC aims to avoid excessively slowing down the economy, while also alleviating the burden of high inflation on Canadians.
Gravelle observed that the Canadian economy "no longer looks to be in excess demand", a shift that has contributed to reducing price pressures across a wide array of goods and services. He added said, "The economy is now roughly in balance.
He also emphasized that BoC is closely monitoring several key economic indicators, such as inflation expectations, wage growth, and corporate pricing behavior. These factors are crucial in determining whether inflation is on a consistent path towards the 2% target.
Despite the current state of balance in the economy, Gravelle stated, "Given the risks to the inflation outlook, we remain prepared to increase the policy rate further if needed."