Sample Category Title
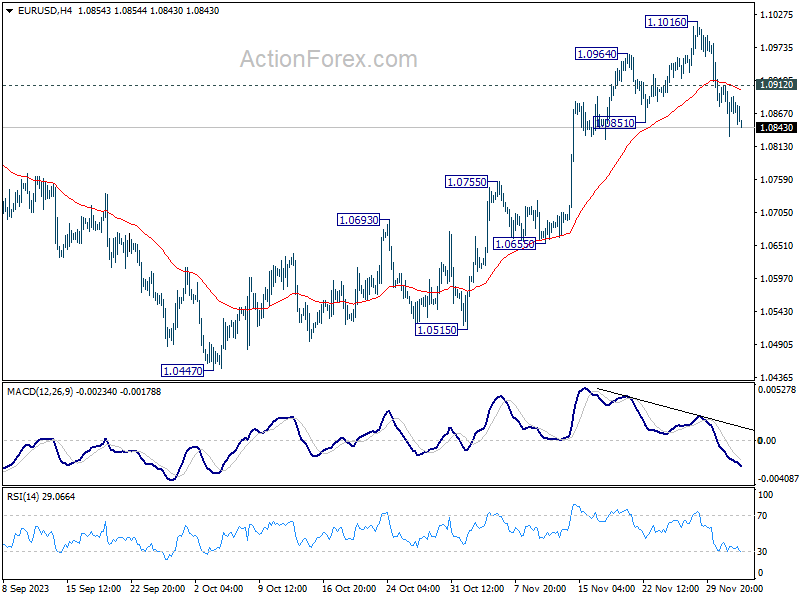
EUR/USD Mid-Day Outlook
Daily Pivots: (S1) 1.0838; (P) 1.0875; (R1) 1.0922; More...
EUR/USD's fall from 1.1016 is in progress and intraday bias remains on the downside. Deeper decline would be seen to 55 D EMA (now at 1.0766). On the upside, above 1.0912 minor resistance will turn intraday bias neutral again first. Further break of 1.1016 will resume the rise from 1.0447 to retest 1.1274 high instead.
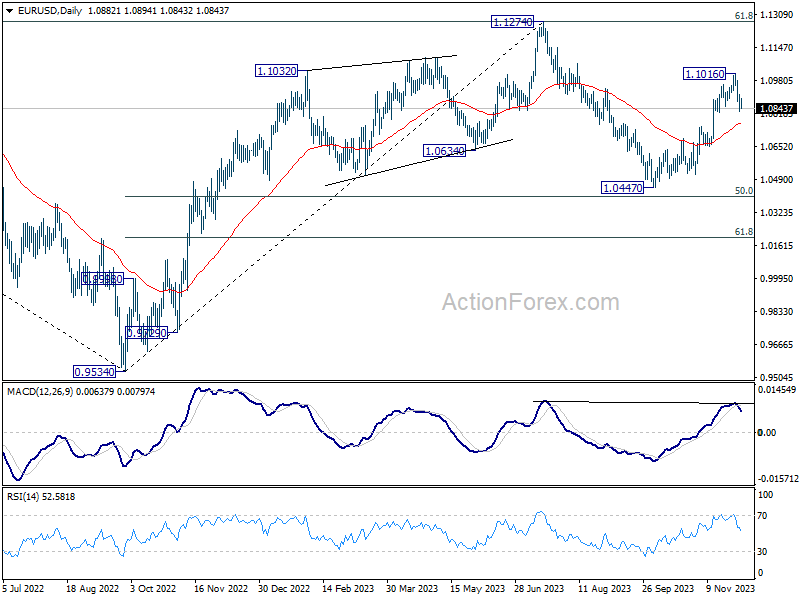
In the bigger picture, price actions from 1.1274 are viewed as a corrective pattern to rise from 0.9534 (2022 low). Rise from 1.0447 is tentatively seen as the second leg. Hence while further rally could be seen, upside should be limited by 1.1274 to bring the third leg of the pattern. Meanwhile, sustained break of 55 D EMA will argue that the third leg has already started for 1.0447 and below.
GBP/USD Mid-Day Outlook
Daily Pivots: (S1) 1.2645; (P) 1.2680; (R1) 1.2747; More...
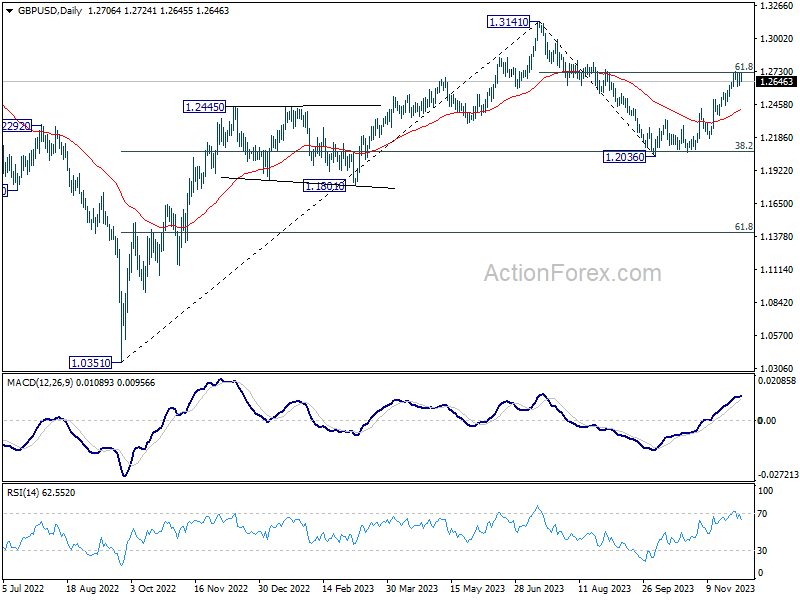
GBP/USD is still bounded in consolidation from 1.2731 and intraday bias stays neutral. But further rally is expected as long as 1.2590 minor support holds. On the upside, decisive break of 1.2731 will resume the rally from 1.2036 for retesting 1.3141 high next.
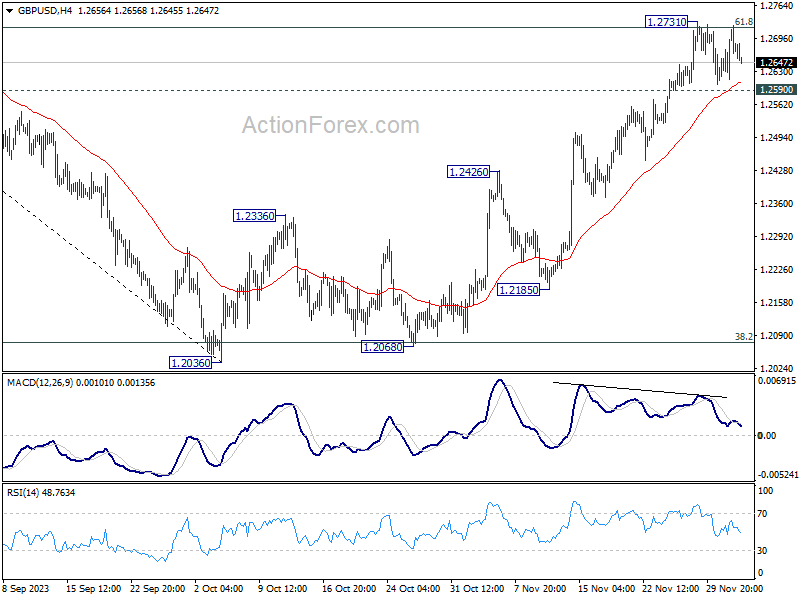
In the bigger picture, price actions from 1.3141 are seen as a corrective pattern to rise from 1.0351 (2022 low). Strong rebound from 38.2% retracement of 1.0351 (2022 low) to 1.3141 at 1.2075 suggests that current rise from 1.2036 is already the second leg. However, while further rally could be seen, upside should be limited by 1.3141 to bring the third leg of the pattern.
USD/JPY Mid-Day Outlook
Daily Pivots: (S1) 146.20; (P) 147.27; (R1) 147.88; More...
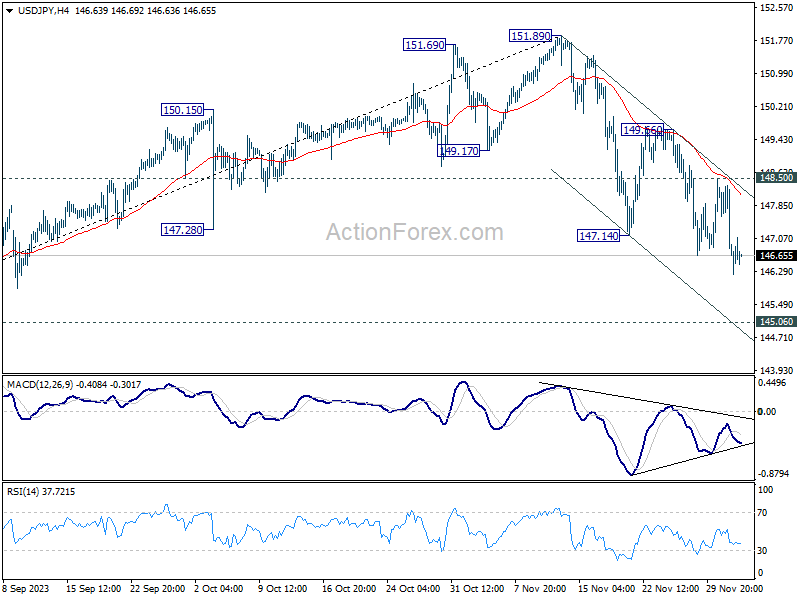
Intraday bias in USD/JPY stays on the downside at this point. Fall from 151.89 is in progress and should target 145.06 key support level. On the upside, break of 148.50 resistance is needed to indicate short term bottoming. Otherwise, further decline with remain in favor in case of recovery.
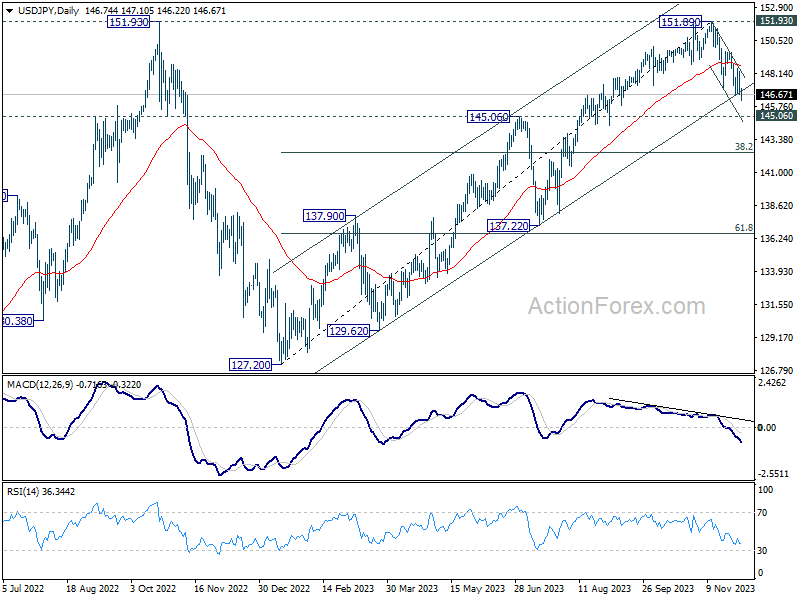
In the bigger picture, rise from 127.20 (2023 low) is seen as the second leg of the pattern from 151.93 (2022 high). Decisive break of 145.06 resistance turned support will confirm that this second leg has completed, after rejection by 151.93. Deeper fall would be seen through 38.2% retracement of 127.20 to 151.89 at 142.45 to 61.8% retracement at 136.63. Nevertheless strong bounce from 145.06 will retain medium term bullishness for another test on 151.93 at a later stage.
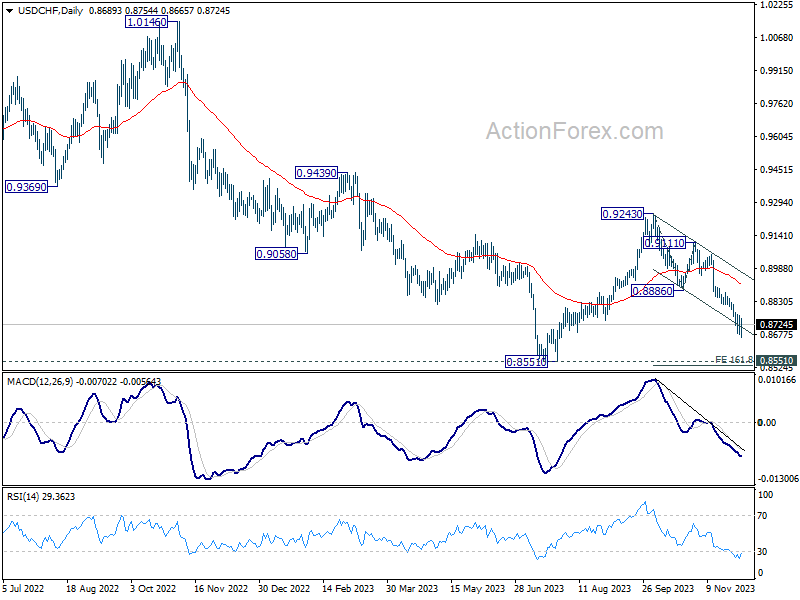
USD/CHF Mid-Day Outlook
Daily Pivots: (S1) 0.8657; (P) 0.8713; (R1) 0.8746; More....
Intraday bias in USD/CHF remains neutral for the moment. Another fall is in favor as long as 0.8769 minor resistance holds. Below 0.8665 will resume the decline from 0.9243 to 161.8% projection of 0.9243 to 0.8886 from 0.9111 at 0.8533, which is close to 0.8551 low. However, break of 0.8769 minor resistance should indicate short term bottoming, and turn bias back to the upside for stronger recovery.
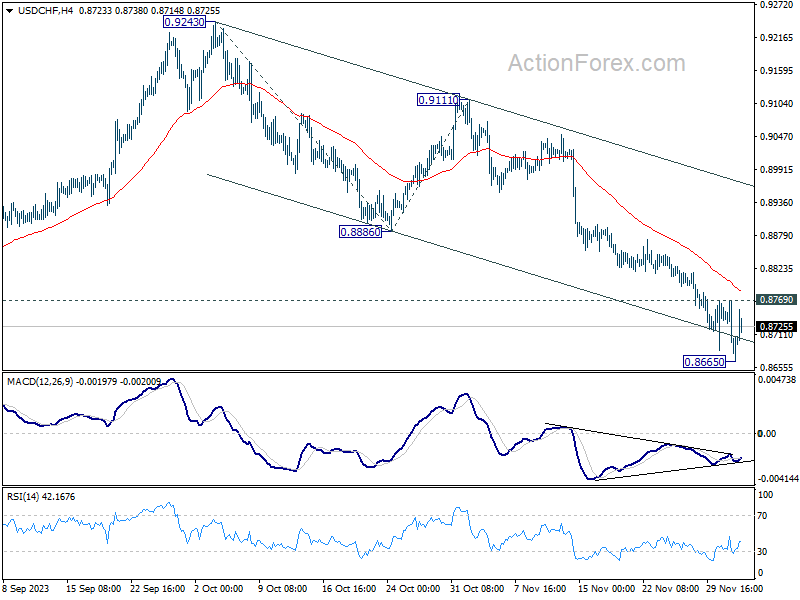
In the bigger picture, price actions from 0.8551 are currently seen as part of a corrective pattern to the decline from 1.0146 (2022 high). Fall from 0.9243 is seen as the second leg for now. Deeper decline could be seen to 0.8551 low but strong support should be seen there to bring rebound. For now, this will remain the favored case as long as 0.8886 support turned resistance holds.
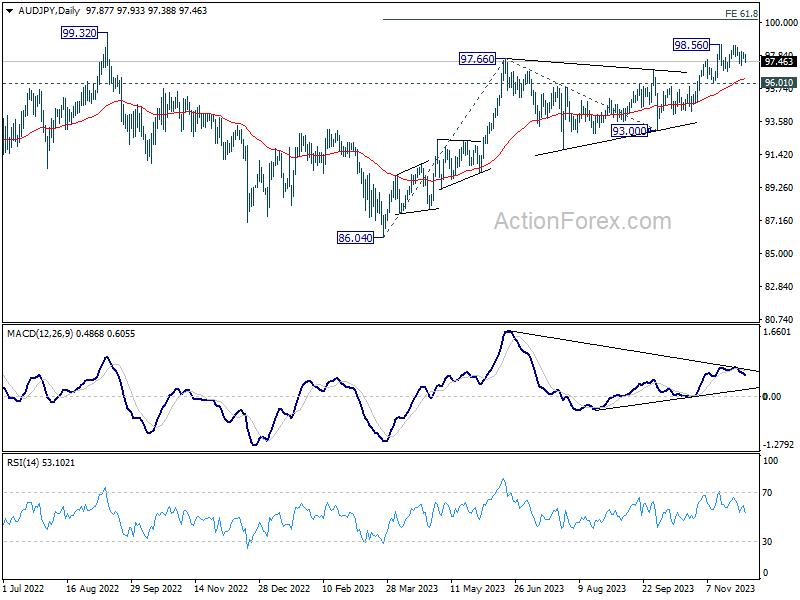
Yen Strengthens, Aussie Falls in Anticipation of Tokyo CPI and RBA
Today's markets are characterized by a sense of caution, with most major pairs and crosses gyrating inside Friday's range. Japanese Yen is an exception as a stronger performer, although it has not yet seen significant follow-through buying. Dollar and the Euro are currently in a consolidation phase, with traders adopting a 'wait and see' approach. Australian Dollar, alongside other commodity-linked currencies, exhibits a softer tone. Swiss Franc is also trending on the softer side, while Sterling is mixed.
The upcoming Asian session is set to feature several key economic indicators that are likely to influence market movements. Japan's Tokyo CPI, China's Caixin PMI Services, and RBA rate decision are among the key events. RBA is expected to maintain the interest rate at 4.35%. It is anticipated that RBA will refrain from making any significant policy announcements or giving clear forward guidance until Q4 inflation data is thoroughly analyzed. This approach suggests that the upcoming meeting will likely be procedural.
Technically, there is prospect of some volatility in AUD/JPY ahead. The cross turned into sideway consolidation after hitting 98.56 last month. For now, near term outlook will stay bullish as long as 96.01 support holds. Firm break of 98.56 will resume the rise from 86.04 to 61.8% projection of 86.04 to 97.66 from 93.00 at 100.18. Let's see if the upside breakout would happen this week.
In Europe, at the time of writing, FTSE is down -0.48%. DAX is up 0.10%. CAC is down -0.29%. Germany 10-year yield is down -0.004 at 2.356. Earlier in Asia, Nikkei fell -0.60%. Hong Kong HSI fell -1.09%. China Shanghai SSE fell -0.29%. Singapore Strait Times fell -0.20%. Japan 10-year JGB yield fell -0.0095 to 0.691.
ECB's de Guindos warns against early celebration of inflation slowdown
ECB Vice-President Luis de Guindos acknowledged the recent slowdown in CPI, which eased to 2.4% last month, describing it as "a positive surprise." However, he cautioned that it was "too early to declare victory."
De Guindos emphasized the influence of factors on slowing inflation like "base effect" and warned the potential inflationary impact of withdrawing government measures.
Additionally, he mentioned that "Unit labor costs are increasing in Europe and that is one of the concerns regarding the future evolution of inflation."
Addressing market expectations, de Guindos observed the anticipation of a soft landing and a prolonged disinflation process in Eurozone. However, he warned, "Such an assumption may not be confirmed in reality due to high uncertainty."
Eurozone Sentix rose to -16.8, cautious optimism amid inflation outlook
Eurozone Sentix Investor Confidence Index's latest update offers a mixed but cautiously optimistic view of the region's economic outlook. In December, the index rose from -18.6 to -16.8, slightly below the expected -16 but marking its highest level since May. Current Situation Index improved from -26.8 to -23.5. More notably, the Expectations Index inched higher from -10.0 to -9.8, reaching its peak since February.
The consecutive rise in the Expectations Index for the third month is a signal that some economists might interpret as the beginning of a trend reversal. However, Sentix cautions against over-optimism, noting "The still weak overall momentum and the lack of a certain amount of international support speak against this."
Despite these reservations, Sentix identifies potential for significant improvement at the start of the new year, largely due to positive shifts in the inflation outlook. The Sentix inflation barometer, which tracks expectations about inflation, has shown improvement for the fifth consecutive time, reaching 16.25.
Sentix elaborated on this, stating, "From this positive view of inflation, investors not only deduce an end to the central banks' prolonged cycle of interest rate hikes, but now also expect positive support from monetary policy." The corresponding theme barometer, reflecting this optimism, has ascended to 14.25, the highest since April 2021.
Swiss CPI slows to 1.4%, import prices turn negative
Swiss CPI fell -0.2 mom in November, below expectation of -0.1% mom. Core CPI (excluding fresh and seasonal products, energy and fuel), was flat at 0.0% mom. Domestic products prices was flat at 0.0% mom. Imported product prices fell -1.1% mom.
Annually, CPI slowed from 1.7% yoy to 1.4% yoy, below expectation of 1.6% yoy. Core CPI slowed from 1.5% yoy to 1.4% yoy. Domestic products prices slowed from 2.2% yoy to 2.1% yoy. Imported product prices turned negative from 0.4% yoy to -0.6% yoy.
BoJ's Noguchi: Just only beginning to envision inflation target achievement
BoJ board member Asahi Noguchi emphasized the need for continuing ultra-loose monetary policy in Japan.
Noguchi acknowledged on Saturday the impact of global inflation on Japan, stating, "It's true the impact of elevated global inflation is reaching Japan's economy with consumer inflation exceeding the BOJ's 2% target since the spring of 2022."
However, Noguchi differentiated the nature of Japan's inflation from that of the West, pointing out that, "the rise is mostly due to cost-push factors amid higher import prices," contrasting with the wage-driven price increases in US and Europe. This distinction is crucial in understanding BoJ's monetary policy approach.
To effectively meet the BoJ's inflation target, Noguchi emphasized "we must see price rises backed by sustained wage increases."
Despite significant wage hikes in this year's spring wage negotiations, Noguchi believes that Japan is only at the beginning of its journey to reach its inflation target, stating, "we've only just reached a stage where the possibility of achieving our target has come into sight."
USD/CHF Mid-Day Outlook
Daily Pivots: (S1) 0.8657; (P) 0.8713; (R1) 0.8746; More....
Intraday bias in USD/CHF remains neutral for the moment. Another fall is in favor as long as 0.8769 minor resistance holds. Below 0.8665 will resume the decline from 0.9243 to 161.8% projection of 0.9243 to 0.8886 from 0.9111 at 0.8533, which is close to 0.8551 low. However, break of 0.8769 minor resistance should indicate short term bottoming, and turn bias back to the upside for stronger recovery.
In the bigger picture, price actions from 0.8551 are currently seen as part of a corrective pattern to the decline from 1.0146 (2022 high). Fall from 0.9243 is seen as the second leg for now. Deeper decline could be seen to 0.8551 low but strong support should be seen there to bring rebound. For now, this will remain the favored case as long as 0.8886 support turned resistance holds.
Economic Indicators Update
| GMT | Ccy | Events | Actual | Forecast | Previous | Revised |
|---|---|---|---|---|---|---|
| 21:45 | NZD | Terms of Trade Index Q3 | -0.60% | -2.10% | 0.40% | 0.30% |
| 23:50 | JPY | Monetary Base Y/Y Nov | 8.90% | 9.50% | 9.00% | |
| 00:00 | AUD | TD Securities Inflation M/M Nov | 0.30% | -0.10% | ||
| 07:00 | EUR | Germany Trade Balance (EUR) Oct | 17.8B | 17.0B | 16.5B | 16.7B |
| 07:30 | CHF | CPI M/M Nov | -0.20% | -0.10% | 0.10% | |
| 07:30 | CHF | CPI Y/Y Nov | 1.40% | 1.60% | 1.70% | |
| 09:30 | EUR | Eurozone Sentix Investor Confidence Dec | -16.8 | -16 | -18.6 | |
| 15:00 | USD | Factory Orders M/M Oct | -2.50% | 2.80% |
ECB’s de Guindos warns against early celebration of inflation slowdown
ECB Vice-President Luis de Guindos acknowledged the recent slowdown in CPI, which eased to 2.4% last month, describing it as "a positive surprise." However, he cautioned that it was "too early to declare victory."
De Guindos emphasized the influence of factors on slowing inflation like "base effect" and warned the potential inflationary impact of withdrawing government measures.
Additionally, he mentioned that "Unit labor costs are increasing in Europe and that is one of the concerns regarding the future evolution of inflation."
Addressing market expectations, de Guindos observed the anticipation of a soft landing and a prolonged disinflation process in Eurozone. However, he warned, "Such an assumption may not be confirmed in reality due to high uncertainty."
December Flashlight for the FOMC Blackout Period
Summary
- We look for the FOMC to keep rates on hold at its December 13 meeting, an expectation that is universally shared. If realized, the third consecutive hold would suggest that, rather than the FOMC merely hiking at a slower pace, the fed funds rate probably has reached its terminal level of this cycle.
- Both sides of the Fed's mandate are moving toward their longer-run estimated levels. The labor market is becoming less tight, and inflation continues to recede.
- That said, inflation has not yet receded all the way back to 2%. Consequently, we expect the post-meeting statement will keep the door open to the possibility of additional tightening this cycle. However, while the statement likely will indicate that further tightening remains possible, we would not be surprised for it to hint that another rate hike is less probable.
- A more benign inflation outlook is the key to what we believe will be a flat-to-modestly-lower "dot plot" in the Summary of Economic Projections released at the conclusion of the meeting on December 13. We expect that the median dot for year-end 2024 will shift down from 5.125% in the September SEP to 4.875%. For 2025 and beyond, we suspect the median dots will be more or less unchanged.
- We look for the FOMC to maintain its current pace of balance sheet runoff (i.e., quantitative tightening).
It Appears That This Tightening Cycle Has Come to an End
Since the summer, the FOMC has been keeping its options open regarding the possibility of additional rate hikes. However, recent economic data and comments suggest less need and desire to exercise that option. We see the Committee leaving the fed funds target range at its current level of 5.25-5.50% at the conclusion of its upcoming meeting on December 13. If realized, the third consecutive hold would suggest that, rather than the FOMC merely hiking at a slower pace, the fed funds rate probably has reached its terminal level of this cycle. With the Committee seeming to settle into a prolonged hold, the conversation around the future policy path will shift toward when—and under what circumstances—the FOMC eventually cuts rates.
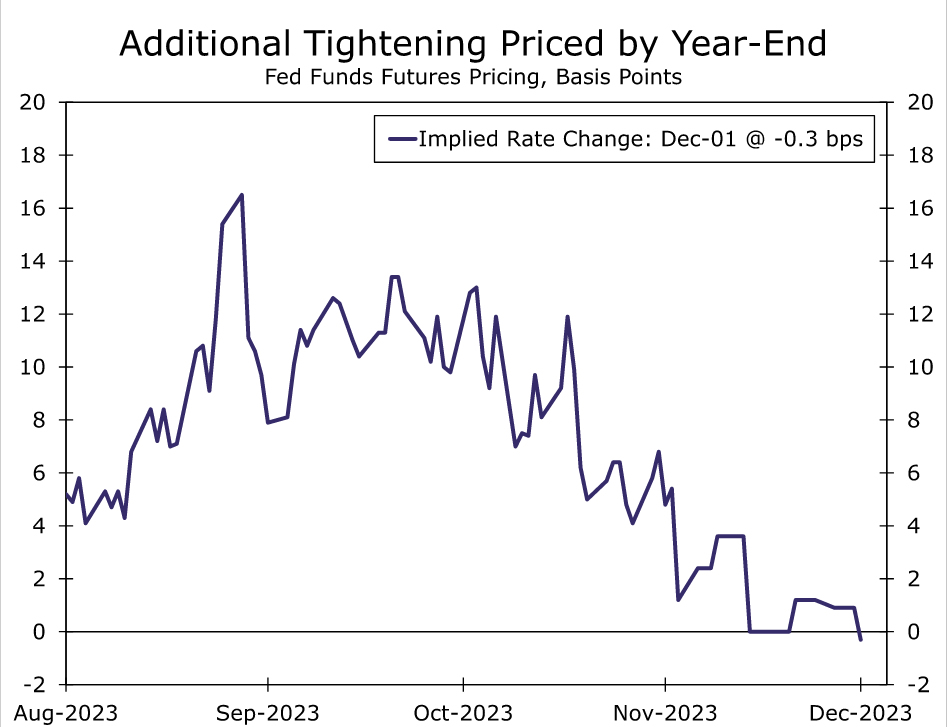
We have maintained since the FOMC last raised the fed funds rate at its July 26 meeting that the increase was likely the last of this hiking cycle, a view not always shared by market participants. As recently as October, market pricing suggested that another 25 bps hike was slightly more likely than not, a bet bolstered in part by Committee members' own projections in September. Yet over the past two months, market pricing for an additional hike before year-end has fallen close to zero (Figure 1).
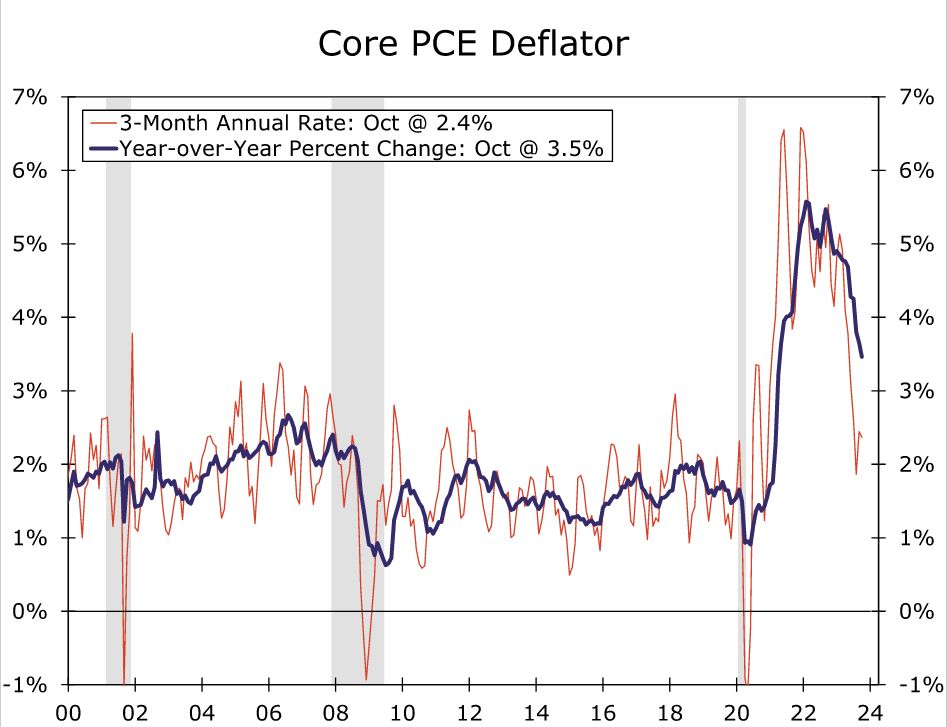
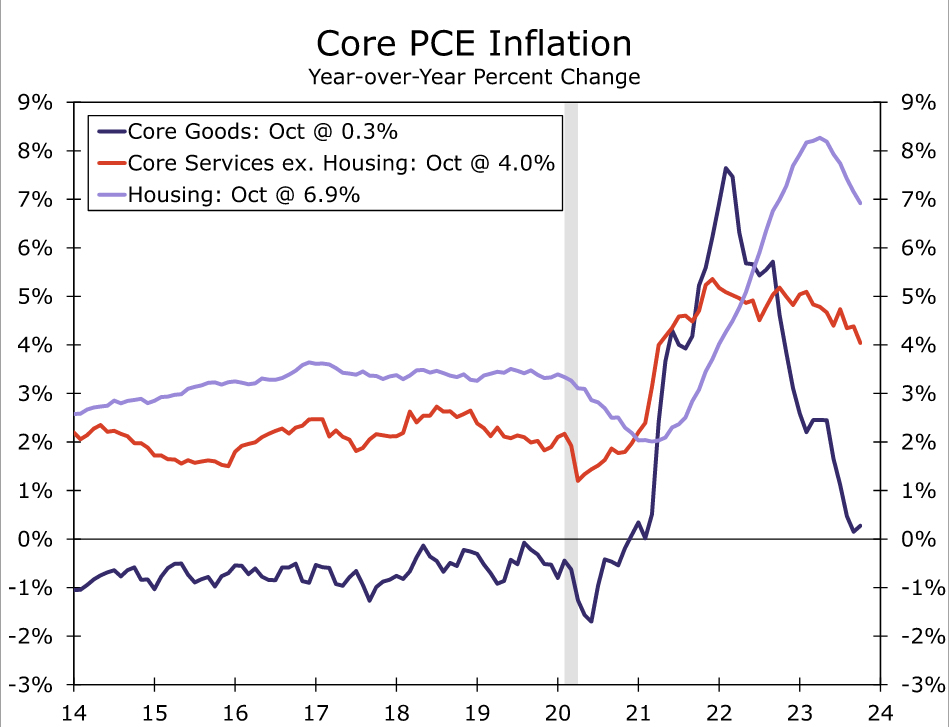
The declining odds of one additional hike this year come as both sides of the Fed's mandate are moving toward their longer-run desired levels. Notably, inflation has made encouraging progress toward returning to the FOMC's 2% target. In October, core PCE inflation, the Fed's preferred benchmark for price growth, fell to 3.5% year-over-year, nearly a two-and-a-half-year low. The latest monthly readings suggest the recent pace has downshifted even further, with core prices in October up at an annualized rate of only 2.4% relative to July (Figure 2). All major categories frequently highlighted by FOMC members have contributed to the slowdown: core goods prices are nearly flat relative to a year ago, housing inflation has rolled over and even "super core" inflation (core services less housing) has come off its recent peak (Figure 3). In addition to softer core inflation, lower energy prices and more modest increases in food costs have helped drive the year-over-year rate of the headline PCE deflator down to the lowest rate since early 2021.
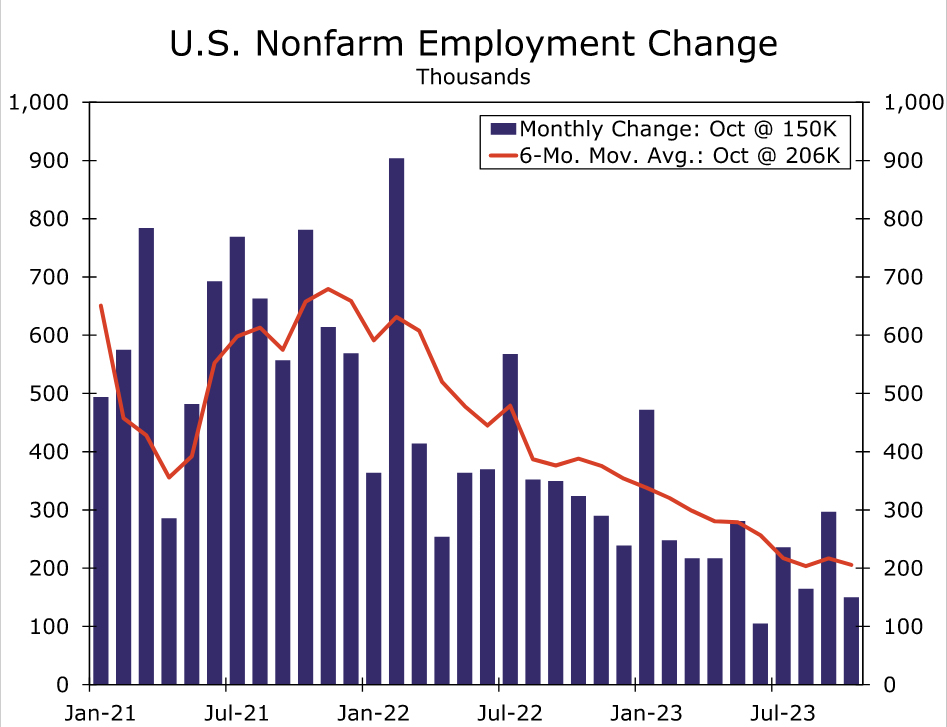
Meantime, the labor market is showing clearer signs of cooling. The share of workers quitting their job is essentially back to pre-COVID levels, which, along with strong growth in the labor supply, has helped to reduce upward pressure on wages. Layoffs remain low, but continuing jobless claims have crept higher in a sign that it is taking displaced workers longer to find new employment. The FOMC will get one more key read on the labor market before its upcoming meeting with the November jobs report to be released on December 8. Although we expect to see a pickup in payroll growth thanks to the conclusions of the United Autoworkers and Hollywood strikes, the overall trend in hiring has downshifted since earlier in the year (Figure 4), while the unemployment rate has drifted up from 3.4% in April to 3.9% in October.
Yet, while inflation is progressing back toward target, it has not yet arrived at 2%. At the same time, financial conditions have eased since the FOMC's last meeting, only partly due to adjusted expectations for the Fed's policy path, in our view. Therefore, we expect the post-meeting statement will keep the door open to the possibility of additional tightening this cycle.
However, while the statement likely will indicate that further tightening remains possible, we would not be surprised for it to hint that another rate hike is less probable. A modestly more dovish outlook could be relayed through adjusting the current statement that "In determining the extent of additional policy firming that may be appropriate..." to verbiage indicating that the risks to the outlook, and therefore the policy path, are becoming more balanced. A slightly less-constructive assessment of recent economic conditions could also suggest that the Committee views additional tightening as less necessary ahead.
SEP: Slower Inflation = Lower Dots?
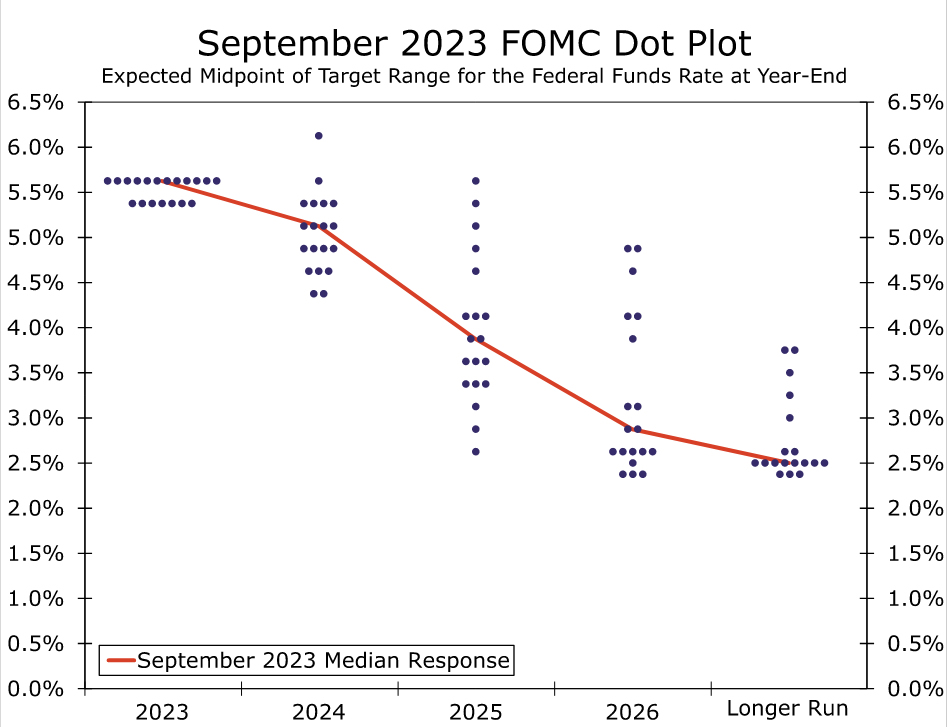
The December FOMC meeting will include an update to the Committee's Summary of Economic Projections (SEP). The last SEP, which was published in September, implied one more 25 bps increase in the target range for the federal funds rate by year-end 2023. Barring a rate hike on December 13, which would come as a major surprise to the vast majority of market participants, the median dot for 2023 will come down to 5.375%, the midpoint of the current target range for the federal funds rate. The September dot plot contained a median projection of 5.125% for the federal funds rate at year-end 2024 (Figure 5). However, the distribution of the 2024 dots was skewed to the downside, with nine submissions below 5.125% and only six above. Given this distribution, and given that inflation has continued to recede faster than the Committee anticipated in September, we expect the median 2024 dot will decline 25 bps to 4.875%. For 2025 and beyond, we suspect the median dots will be more or less unchanged. The distribution of dots for the "longer-run" has an upward bias, and it would not take much to move the median up from its current 2.5%, where it has been since the pandemic began. We have no compelling reason to think an upward revision is coming in December, but the skew and ongoing debate about r-star (i.e., the "equilibrium" real interest rate) suggest that this is something to keep an eye on going forward.
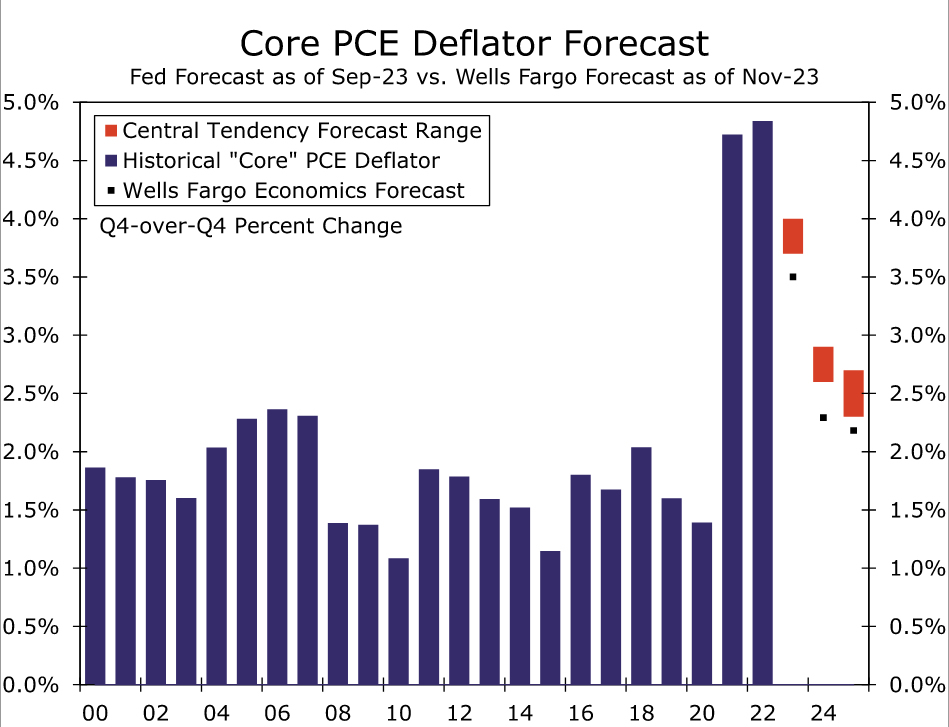
A more benign inflation outlook is the key to a flat-to-modestly-lower dot plot. In September, the FOMC's median inflation projections declined for the first time since 2020. The median submission for core PCE inflation in 2023 fell from 3.9% in June to 3.7% in September. We expect a similar downward revision in the December SEP, as our current forecast for core PCE inflation is 3.5% year-over-year in Q4-2023 (Figure 6). The median projection for headline PCE inflation for 2023 should also fall a few tenths-of-a-percentage point on the back of lower energy prices. For 2024, we think the median inflation forecast may fall a tenth-of-a-percentage point or so, but probably not much more than that. We doubt the FOMC will want to signal an overly optimistic 2024 inflation outlook even with the recent progress.
Real GDP growth projections for 2023 are poised for another upward revision. As recently as June, the median Committee participant expected just 1.0% real GDP growth this year. This estimate was upwardly revised to 2.1% in the September SEP, and another notch higher to 2.5% or so seems likely at the December meeting. We would not be surprised if the Committee's median projection for economic growth in 2024, currently 1.5%, falls slightly to account for a higher base comparison after the faster-than-expected growth in recent months. Accordingly, the median projections for the unemployment rate in 2024 and 2025 may rise by a tick or two but likely will remain close to the longer-run projection of 4.0%.
Quantitative Tightening: Full Steam Ahead
We also expect the FOMC to once again reaffirm its ongoing quantitative tightening (QT) program. The FOMC is currently allowing up to $60 billion of Treasury securities and $35 billion of mortgage-backed securities to roll off of its balance sheet each month. This passive runoff has reduced the size of the Fed's balance sheet from a peak of nearly $9 trillion in Q2-2022 to roughly $7.8 trillion today, and so far there have been few signs of bank reserves becoming scarce. The effective federal funds rate remains comfortably within the FOMC's target range, and other key benchmark rates, such as the Secured Overnight Financing Rate (SOFR), have been relatively stable. As a result, the FOMC likely will reaffirm its intention to continue QT into 2024. We analyzed the outlook for the Fed's balance sheet in 2024 and beyond in a recent special report, which can be found here.
Could BoC Remain Hawkish?
- BoC meets on Wednesday; it could maintain its hawkish stance
- Market is preparing for a series of rate cuts in 2024
- Loonie’s outperformance against the US dollar could pick up speed
Last Bank of Canada meeting for 2023
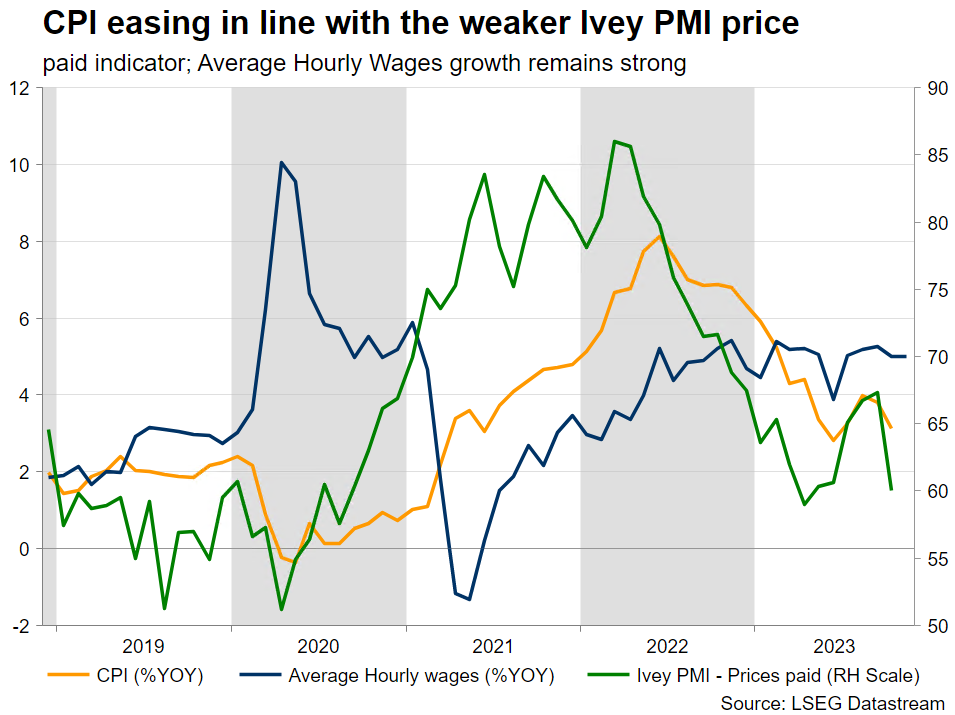
December starts on a high note with the final BoC meeting for 2023 held on Wednesday and the respective Fed and ECB meetings scheduled for next week. It has been a tough year for central bankers, but their efforts appear to be paying dividends as the most recent inflation reports have been showing a significant slowdown. As a result, the market has assumed that the key central banks have probably concluded their current tightening cycle. In addition, in the case of Canada, the BoC’s own quarterly forecasts point to inflation dropping even further to 2.2% by the end of 2025, in line with its remit.
BoC officials worry about the housing sector and wages
However, there are several issues keeping the central bankers up at night. For example, wage increases remain high, and along Canada’s population surge, they support strong consumer demand despite the higher borrowing costs. In addition, the repeated rate increases have failed to dent the housing sector demand, thus keeping prices supported and offering a wealth boost to homeowners. Understandably, the minutes from the October BoC gathering revealed a debate in the policy board about the possibility of another rate hike. Decent data releases, like the ones seen last Friday, are probably going to keep this debate alive at the upcoming meeting.
The BoC could remain hawkish on Wednesday
One could say that the recent RBNZ meeting probably set the scene for this round of gatherings, and hence being hawkish is a win-win situation for the BoC. If inflation edges higher, maybe due to an oil price rally, which in the case of Canada also means stronger GDP growth, then the BoC could go ahead with another rate hike. This might be shocking for current market expectations, but the BoC has been keeping its option open.
On the flip side, staying hawkish at this gathering does not exclude the possibility of reversing stance, adopting a more dovish rhetoric, and even announcing a rate cut during the first quarter of 2024, if needed. In this case, the market will be content as their current scenario of aggressive rate cuts would quickly be confirmed.
In addition, last week’s OPEC+ shenanigans will probably maintain volatility in the oil market, letting most central banks guess its 2024 trend and impact on inflation. The production cuts announced by OPEC+ for the first quarter of 2024 are mostly voluntary, thus increasing the possibility of certain countries ignoring the OPEC+ agreement and aiming for more, much-needed revenues.
Could the loonie enjoy another rally against the US dollar?
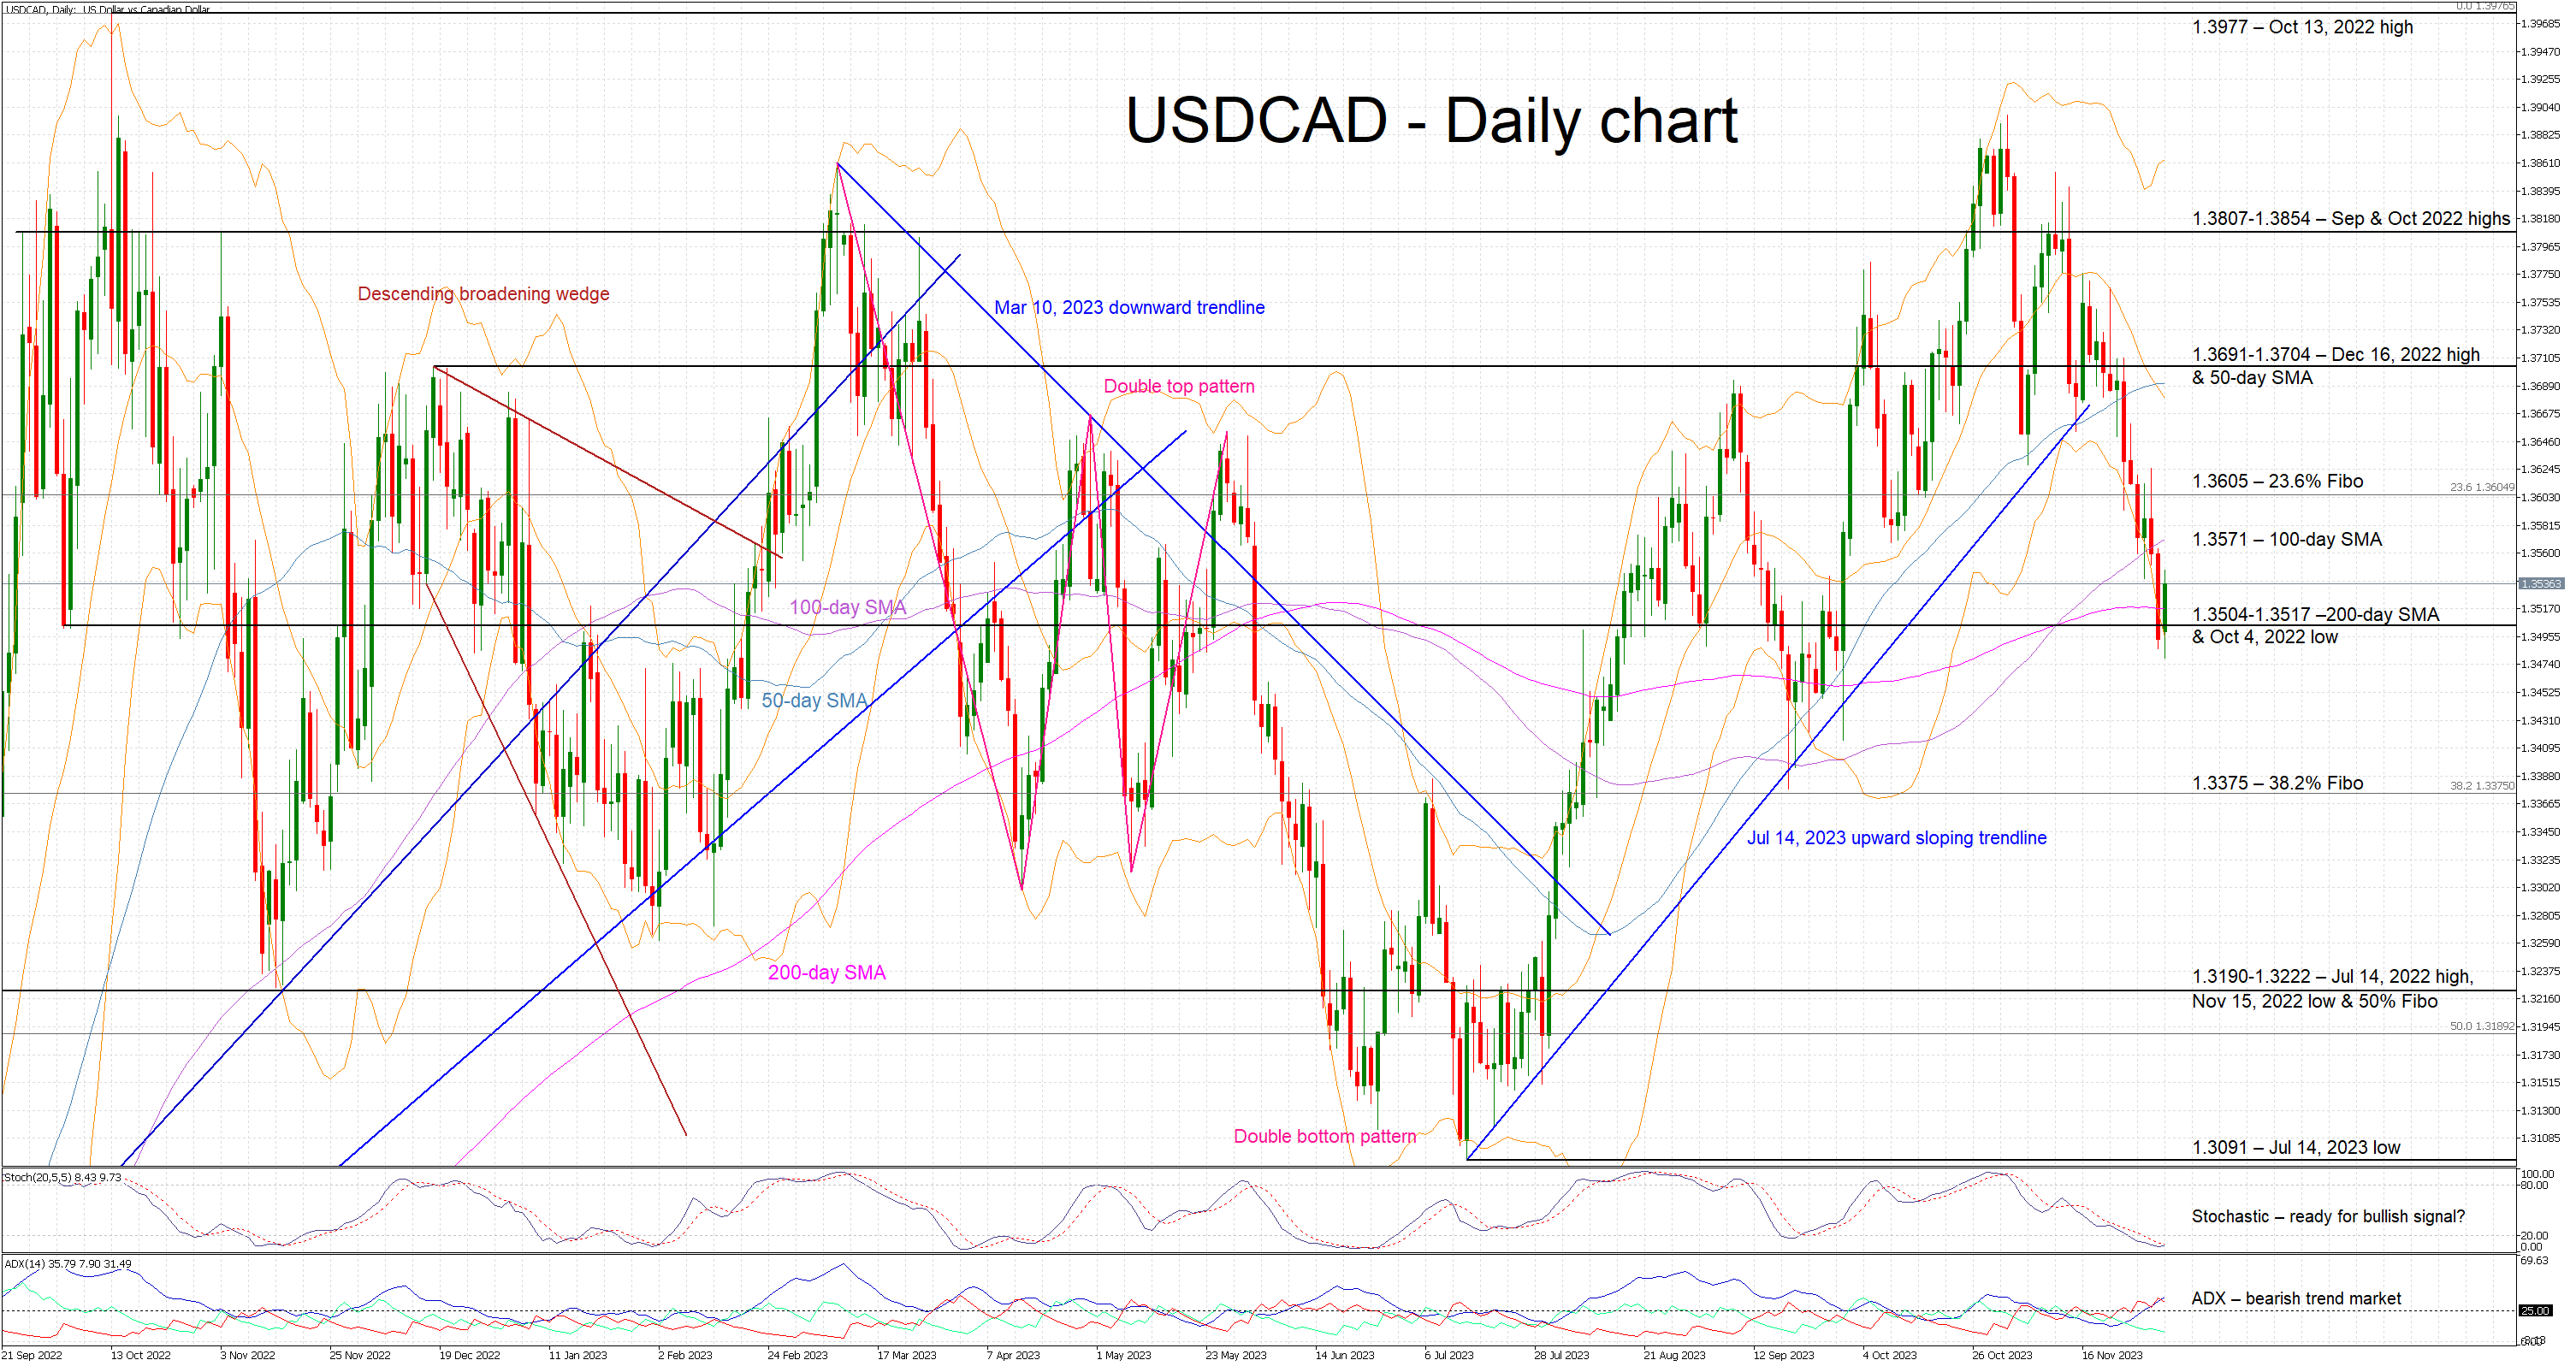
The loonie has managed to outperform the US dollar since the October 25 BoC meeting. This move was predominantly driven by the US leg, but the recent data releases from Canada and the hawkish BoC minutes also played a role. The market expects a quiet and balanced meeting, which if confirmed, will probably allow USD bulls to stage a small upleg above the 100-day SMA at 1.3571.
However, if Macklem et al decide to keep their hawkish stance unchanged and send a message to the market that they could further tighten the current restrictive monetary policy stance, the US dollar-loonie pair could enjoy another sell-off towards the 1.3375 level.
Gold’s Monumental Surge to All-Time Highs
On Friday and Monday, we saw legendary moves in gold. On Friday evening, the price rose to $2075 on the background of risk appetite with reduced liquidity in the instrument. On Monday, the price of gold reached $2145, a new historical price maximum.
The nature of the movement on Friday and Monday morning suggests that we have seen the bears in gold wash out of the market. As liquidity returned, the price pulled back to $2060. This is still extreme territory, as the price only spent a few hours above.
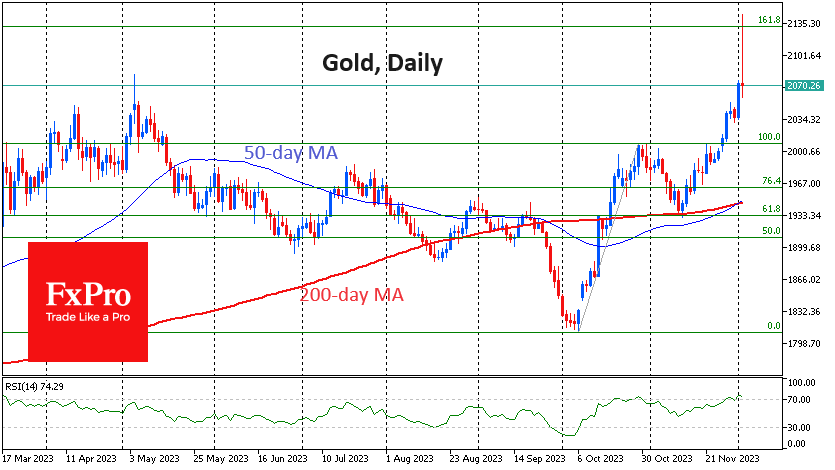
Among the bullish technical signals, we note the Golden Cross formed when the 50-day moving average exceeded the 200-day moving average. In addition, the price is above this crossover, which also strengthens the bullish signal.
Still, joining the upward move in gold may be too dangerous right now. On the daily charts, the RSI is flirting with overbought territory, creating correction risks. The upward movement generally fits into a Fibonacci pattern with an initial impulse from $1810 to $2007, followed by a correction to $1932. The realisation of this pattern suggests a 161.8% retracement of the initial rise to 2129. This is a fairly accurate execution of the pattern, given the low-liquidity trading hours and historical highs.
The next few days for gold are decisive for the subsequent trend. The ability to hold above $2050 will point to continued extreme bullish sentiment in the precious metals market.
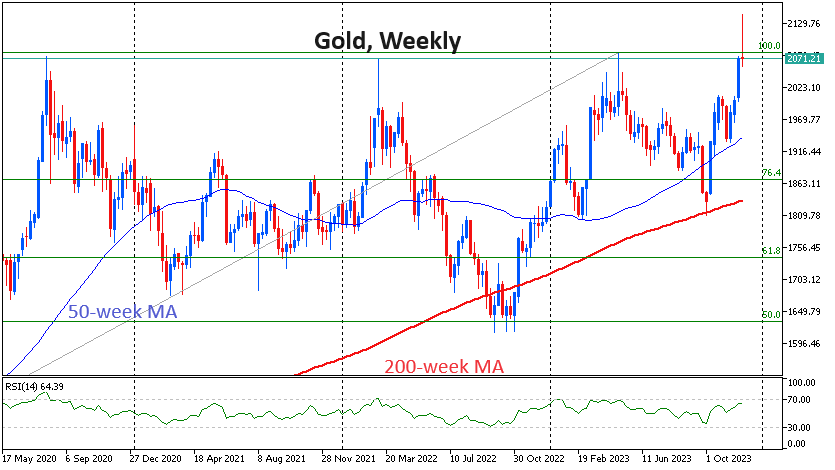
The previous three times that gold made highs – in 2011 and three times in the last three years – it went into a sharp and deep correction that lasted for years in the first case and months in the aftermath of the pandemic.
The latter scenario looks more likely, given lower inflation fears and attractive yields in bonds, gold’s main competitor.
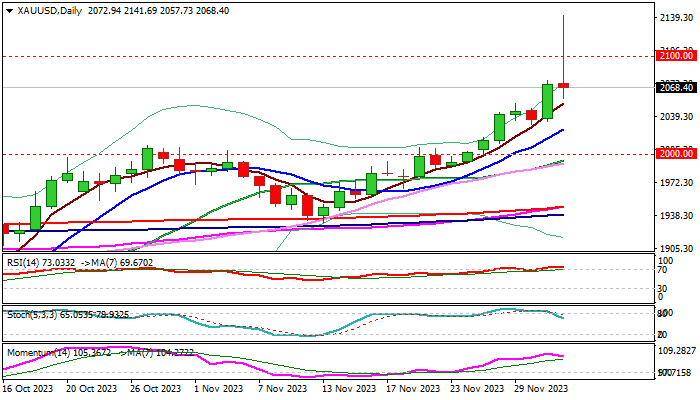
XAU/USD: Gold Hit New All-time High, Bullish Bias Above $2000
Gold spiked to new record high above $2100 in early Monday, in reaction to the comments from Fed Chair Powell on Friday, who said that current level of interest rates is sufficient to complete the task in putting inflation under control and pushing it towards 2% target.
Although the job was not done yet and Powell left the door open for further tightening, as uncertainty in the economic outlook is still elevated, prevailing tone was more dovish and pointing to a likely end of tightening cycle, with growing speculations about rate cuts.
Although the fresh rally which spiked to $2141, was not sustained, as metal’s price subsequently returned below $2100 marks, suggesting that traders may not be fully convinced yet, the upside prospects remain high.
The price holds strong positive momentum and overall picture regarding geopolitical uncertainty and Fed’s rate outlook remains supportive for further advance.
November’s monthly close above $2000 (the first one on record) was initial bullish signal, with rise well above former all-time high, adding to bullish outlook.
Close above former top ($2080) is seen as minimum requirement to keep fresh bulls intact, with deeper dips to hold above rising 10DMA ($2025) and guard lower pivot at $2000, loss of which will be bearish.
Regaining of new record high will open way for extension towards targets at $2177 (Fibo 123.6% projection of the upleg from $1614) and $2200 (psychological barrier).
Res: 2080; 2100; 2141; 2177.
Sup: 2057; 2025; 2009; 2000.