Sample Category Title
EUR/CHF Weekly Outlook
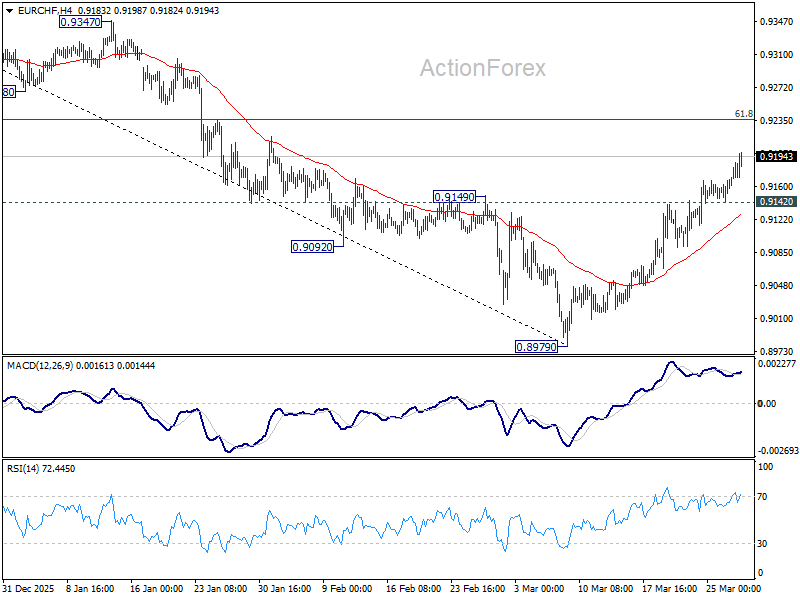
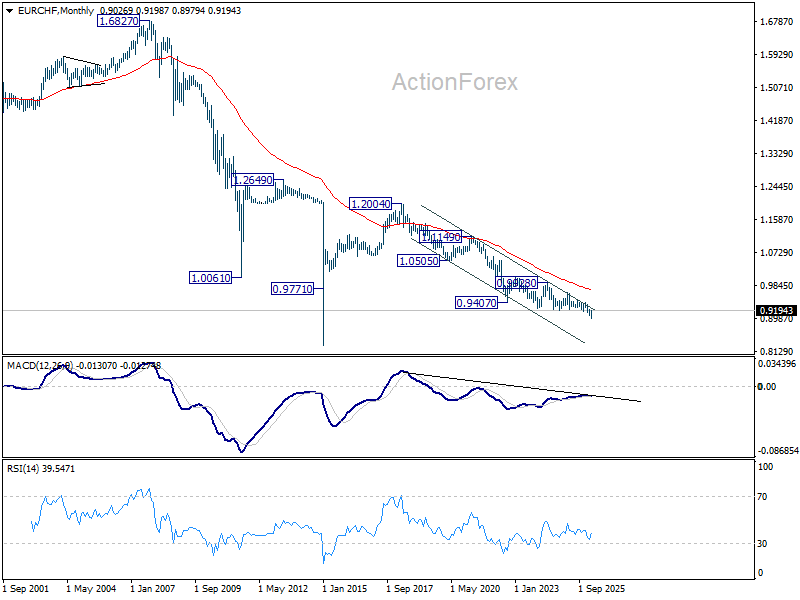
EUR/CHF's rebound from 0.8979 short term bottom last week. Initial bias stays on the upside this week for 61.8% retracement of 0.9394 to 0.8979 at 0.9235 Sustained break there will pave the way to 0.9394 key resistance next. On the downside, below 0.9142 minor support will turn intraday bias neutral again first.
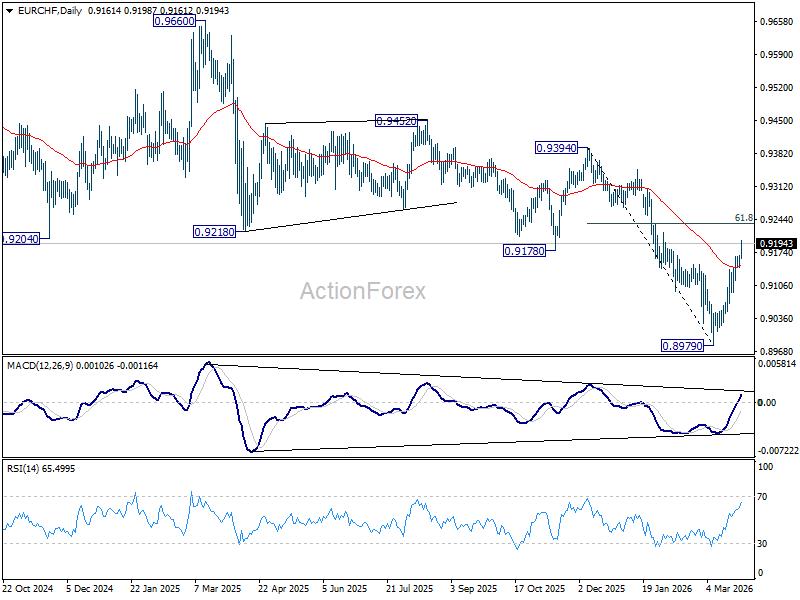
In the bigger picture, as long as 55 W EMA (now at 0.9290) holds, the larger down trend from 0.9928 (2024 high) is still expected to continue through 0.8979 at a later stage. However, sustained break of 55 W EMA should confirm medium term bottoming, and bring stronger rise through 0.9394 resistance, even as a corrective move.
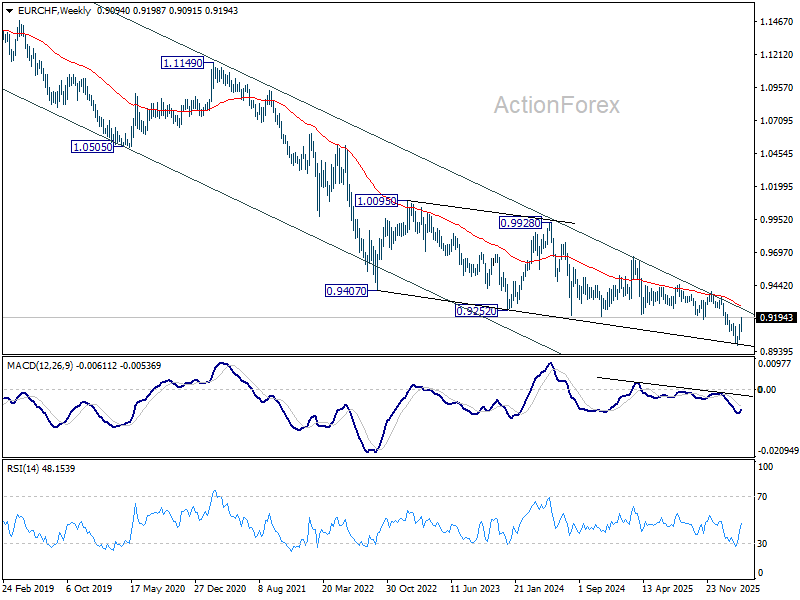
In the long term picture, EUR/CHF is holding well inside long term falling trend channel. Down trend from 1.2004 (2018 high) is still in progress. Outlook will continue to stay bearish as long as falling 55 M EMA (now at 0.9711) holds.
Markets Weekly Outlook – Middle East Uncertainty to Dominate Ahead of Jobs Report, Nasdaq 100 at 6-month Lows
- Middle East uncertainty dominated the week, sending the Nasdaq into official correction territory (down >10%)
- The US Dollar is eyeing its strongest monthly gain since July 2025
- The week ahead is anchored by crucial US data, including the Non-Farm Payrolls/Jobs Report and Retail Sales, as well as Eurozone inflation figures.
Another week dominated by the happenings in the Middle East. The uncertainty around whether or not a deal would materialize between the US, Israel and Iran kept markets on edge and hanging on the words of President Trump.
Markets hovered between brief bouts of risk-on sentiment but the risk off environment dominated the majority of the time. As I write this, the US is waiting for troops to land in the Middle East with about 3,000 troops from the Army’s 82nd Airborne Division expected to land Friday.
This was followed by a Wall Street Journal report later in the day that the Pentagon is looking at sending up to 10,000 additional ground troops to the Middle East to give President Donald Trump more military options. This comes as President Trump weighs peace talks with Tehran, citing Department of Defense officials with knowledge of the planning.
Heading into the weekend, the S&P 500 and the Nasdaq retreated to six-month lows on Friday, as a sell-off in technology stocks weighed heavily on the broader market. While the Dow Jones Industrial Average remained relatively flat for the period, both the S&P 500 and the Nasdaq are now pacing toward their fifth consecutive week of losses.
This downturn highlights a period of extreme uncertainty, evidenced by the CBOE Volatility Index (VIX) climbing 1.57 points to 29.01, a clear sign that investor anxiety is reaching a fever pitch.
The Nasdaq’s recent performance officially confirms a move into correction territory, ending Thursday more than 10% below its record close. It follows in the footsteps of the Russell 2000, which was the first major index to signal a correction last week.
Meanwhile, the commodities complex has faced its own share of volatility. After hitting a four-month low of $4,097.99 on Monday, spot gold staged a recovery to trade above $5,300/oz for much of the week. Despite this bounce, the precious metal remains under significant pressure as markets continue to price in a more hawkish outlook for interest rates.
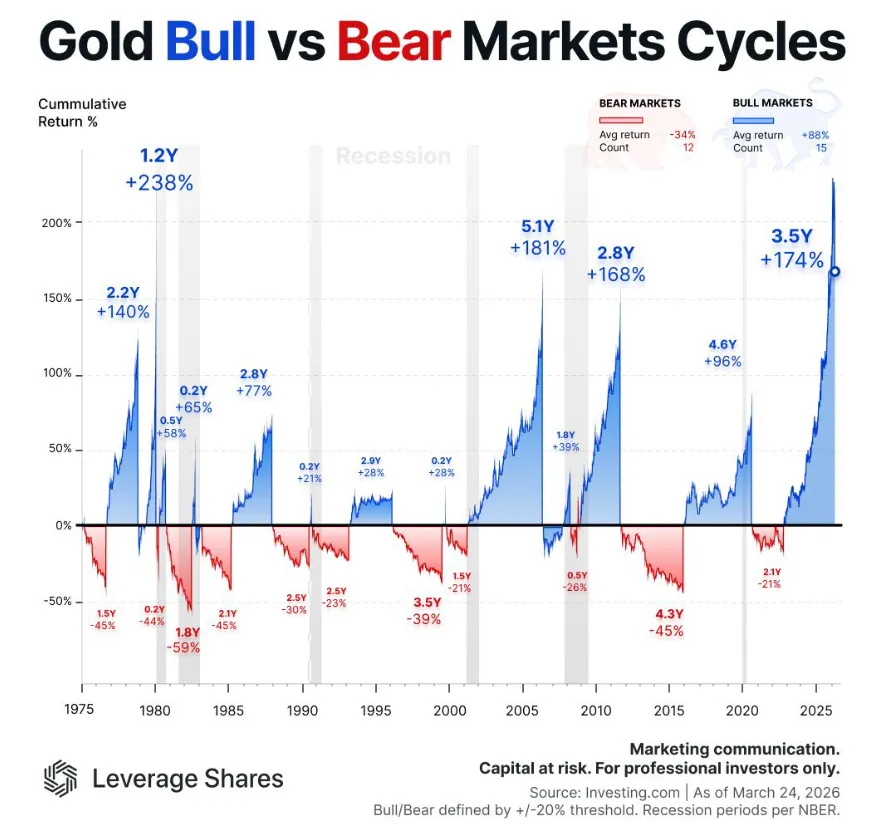
Source: Investing.com
Silver and PGMs (platinum group metals) saw a reprieve on Friday, with spot silver gaining 4.4% to reach $71.01 per ounce, while platinum and palladium rose by 3% and 3.7%, respectively.
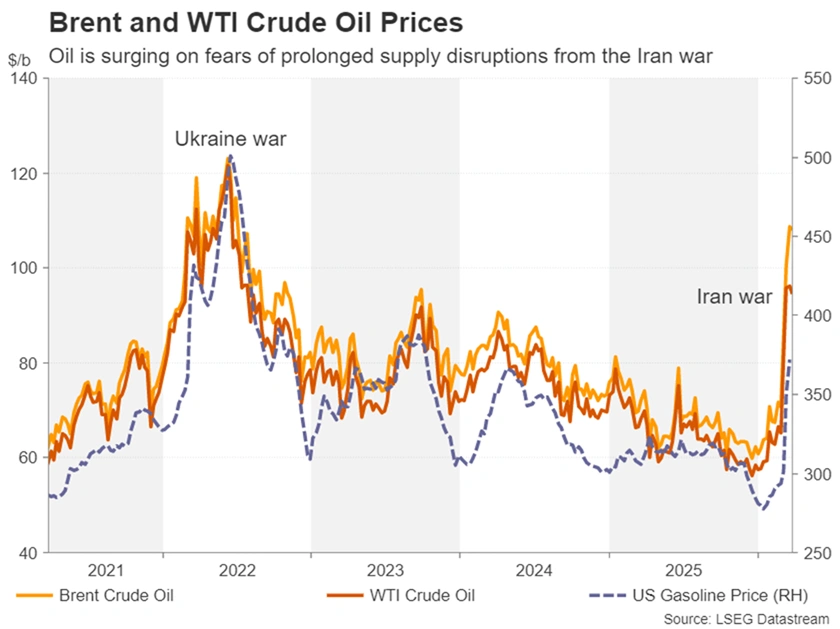
In the energy sector, oil prices edged higher on Friday, though Brent crude is still eyeing its first weekly decline since early February.
This comes amid shifting geopolitical headlines, President Trump indicated that talks with Iran were progressing, though he offered little in the way of specifics. The underlying supply crunch remains severe, however, as the conflict has sidelined roughly 11 million barrels per day. The International Energy Agency has characterized the current situation as a supply crisis more severe than the combined impact of the dual oil shocks of the 1970s.
How did FX markets perform?
The US Dollar is eyeing its strongest monthly gain since July 2025, fueled by safe-haven demand and rising expectations for a domestic rate hike. The Dollar Index (DXY) rose to 99.973 on Friday, up 2.4% for March.
This strength has pushed the Yen toward the critical 160.00 level, a threshold widely seen as a trigger for potential BoJ intervention. Despite rising Japanese bond yields and hawkish signals from policymakers, the Yen remains pressured by Japan’s high sensitivity to energy import costs.
Elsewhere, the Euro held steady at $1.1529, while Sterling marked its fourth straight decline to $1.3311.
Risk-sensitive currencies also struggled; the Australian Dollar touched a two-month low of $0.6887, having shed 3% since the start of the conflict. This leaves the Aussie as the second-worst major performer this month, trailing only the Indian Rupee, which has dropped nearly 4%.
Markets are currently focused on whether central banks will hike interest rates in April following energy price spikes caused by conflict in the Middle East. While markets are pricing in a high probability of hikes, I think this may be premature.
The Week Ahead
Here is the summary of key events for next week in the US, Eurozone (EU), and UK:
United States
Retail Sales (Wednesday): Expected to be lifted by strong auto sales, but there is concern that rising energy costs are becoming "demand-destructive," leaving consumers with less money for discretionary spending.
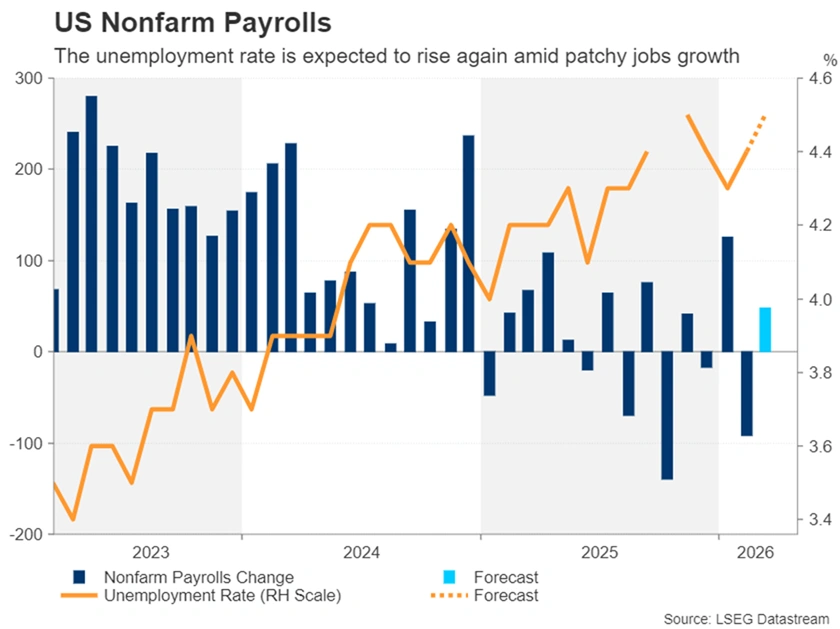
Non-Farm Payrolls / Jobs Report (Friday): This is the marquee event. While a rebound to around +60,000 jobs is expected (following a weak February impacted by strikes and weather), the underlying trend is described as "low-hire, low-fire," with most sectors outside of government and healthcare actually losing workers over the past year.
ISM Manufacturing Index: Likely to show strength as customers rush orders to get ahead of potential price hikes in manufactured goods.
Eurozone (EU)
Economic Sentiment (Monday): Sentiment is expected to drop significantly. Consumer confidence has already "taken a nosedive" due to the dual fears of geopolitical turmoil and higher prices.
Inflation Data (Tuesday): Preliminary March readings are expected to show a sharp increase in headline inflation driven by surging petrol and diesel prices at the pump.
Manufacturing vs. Services: Analysts will be looking at the European Commission's data to see how energy-intensive industries are holding up compared to the services sector, which has recently seen a drop in activity.
United Kingdom (UK)
BoE Decision Maker Panel (DMP) Survey: This survey of CFOs will be closely watched for wage expectations. While wage growth has been falling, "hawks" at the Bank of England are concerned that expectations remain higher than desired.
Inflation Expectations: There is specific concern regarding consumer perceptions of inflation, which have spiked alongside petrol prices. This is noted as one of the few data points that might "panic" the Bank of England into a rate hike.
Rate Hike Speculation: Despite market pricing of three hikes this year, ING notes reports that BoE Governor Bailey was "infuriated" by the hawkish repricing, suggesting the bank is further from hiking than investors believe.
China
PMI Data (Tuesday/Wednesday): The focus is on whether manufacturing returns to expansionary territory.
Official NBS PMI (Tuesday): Expected to rise to 50.0 (up from 49.0 in February). This would be a significant milestone as the index has been in contraction for 10 of the last 11 months.
Caixin (RatingDog) Manufacturing PMI (Wednesday): Expected to continue its trend of outperforming the official NBS indicator.
Japan
Tokyo CPI (Friday): Markets will closely watch inflation data for the capital. Both headline and core inflation are expected to remain stable in March, as rising gasoline prices are likely offset by government utility subsidies and steady food costs.
Economic Activity Data: February figures for Industrial Production and Retail Sales are expected to decline, partially reversing the strong gains seen in January.
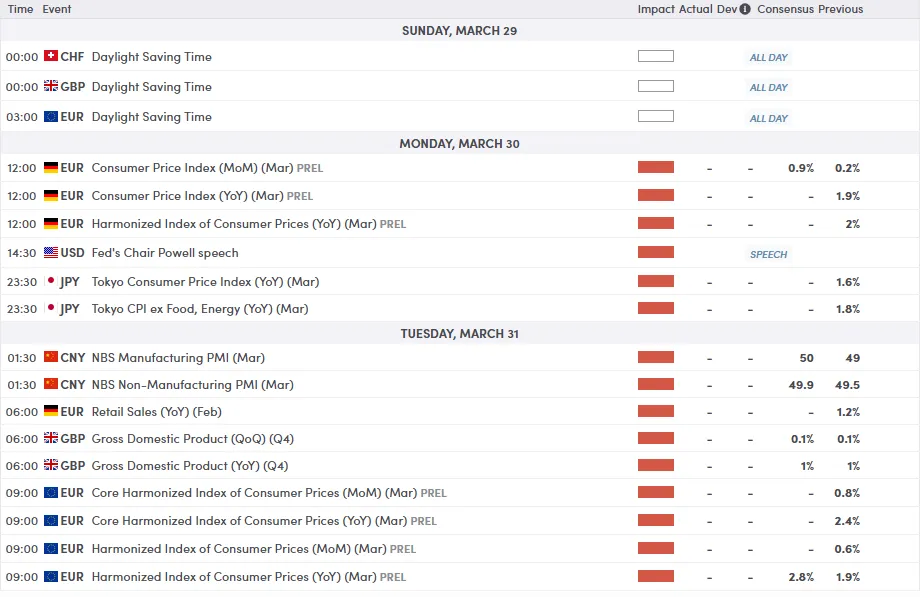
For all market-moving economic releases and events, see the MarketPulse Economic Calendar. (click to enlarge)
Chart of the Week - US Dollar Index (DXY)
The US Dollar Index (DXY) is currently testing a critical juncture as it battles a confluence of technical resistance levels.
After a sharp recovery from the January lows, price action has carved out an ascending channel, but the bullish momentum is now stalling near the 100.617 handle.
While the index remains above its key SMAs (20, 50, and 200), a failure to break and hold above the psychological 100.00 level could trigger a retracement toward the 98.72 support zone.
The RSI is currently hovering around 61, indicating that while bulls maintain control, the window for a sustained breakout is narrowing.
Traders should watch for a decisive daily close above the channel for continuation, or a breakdown below 99.57 to confirm a short-term reversal.
US Dollar Index (DXY) Chart, March 27, 2026
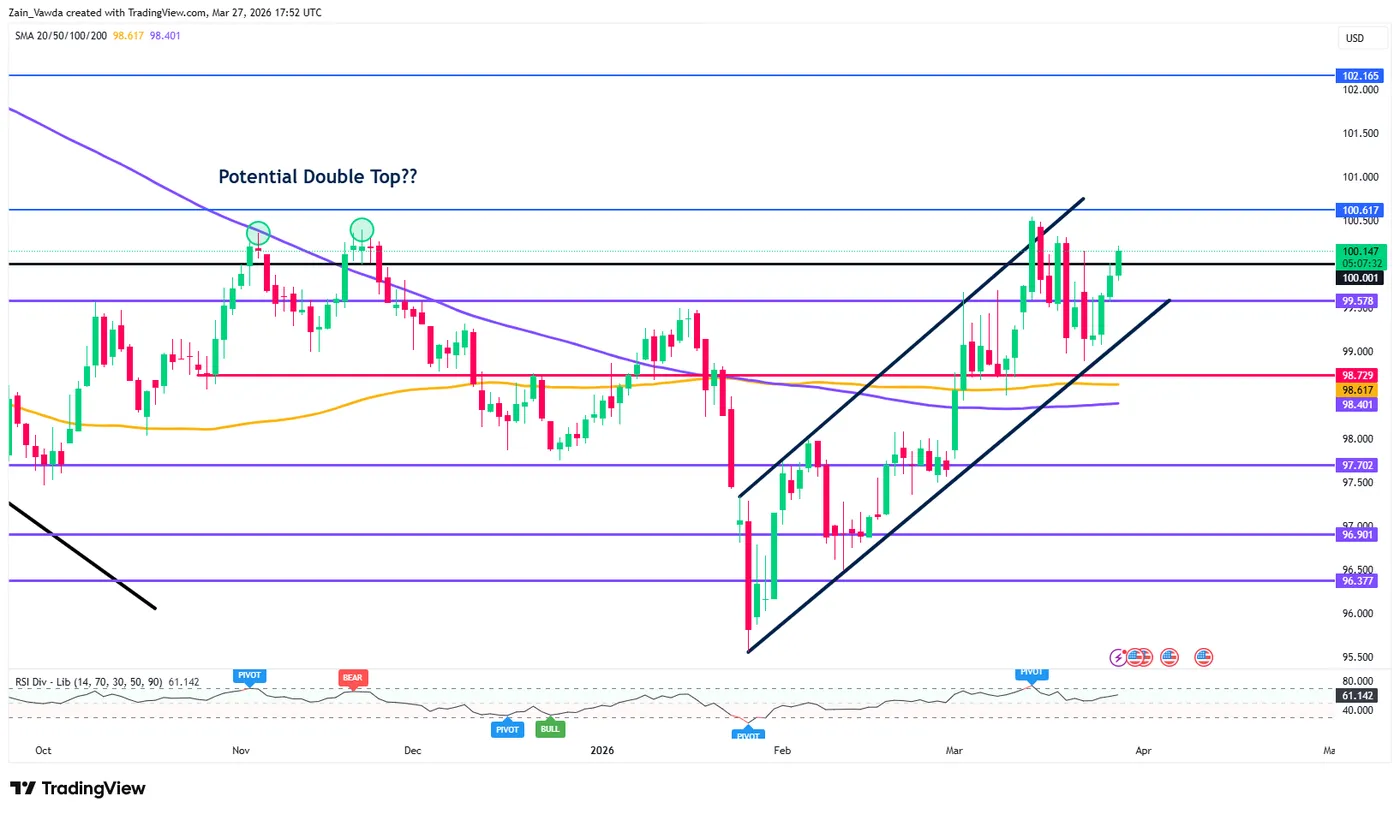
Source:TradingView.Com (click to enlarge)
The Weekly Bottom Line: The Fed Pauses, Inflation Persists
Canadian Highlights
- The outlook is now clouded by the Iran conflict, overshadowing signs of easing inflation.
- Retail sales showed strong momentum early in the year, but higher energy prices are set to erode real spending in the coming months.
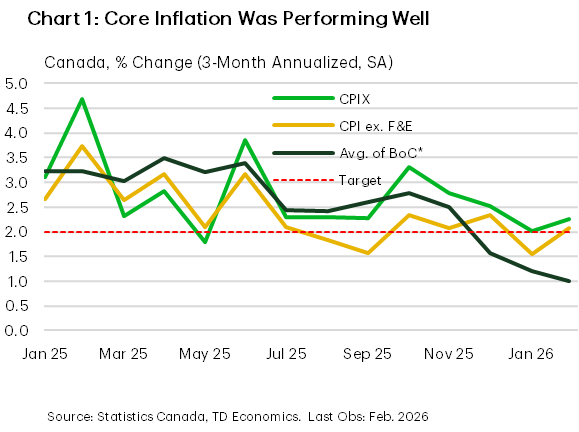
- Core inflation was near target with excess capacity in the economy, giving the BoC some buffer as the energy shock hits.
U.S. Highlights
- Energy markets remain volatile as physical damage and data opacity deepen uncertainty around the Middle East conflict.
- The Fed held rates steady, emphasizing caution as higher oil prices complicate the inflation outlook.
- Softer housing data underscore growing sensitivity to higher yields and tighter financial conditions.
Canada – What Might Have Been
This week’s data releases and Bank of Canada (BoC) statement describe a world that could have been, with a domestic backdrop that showed signs of easing inflation. The war in Iran has upended that. With escalatory strikes on energy infrastructure this week, WTI oil prices are holding at $94 (as of the time of writing). All the focus is now on how big and persistent the energy shock will be – with the prospect of stagflation looming.
It is unfortunate that households and businesses will face this new pinch, because this morning’s retail sales data sent some positive signals. Real volumes posted a solid gain in January, taking the three-month gain to 7.7% (annualized) and February’s preliminary estimate of the nominal figure showed another solid month could be expected. After a year of fits and starts, it looks like things were just starting to turn a corner. The expected surged in gasoline and energy prices in March will muddy the picture and likely eat into the real spending figures in the months ahead.
On the path of future inflation, this week’s economic news came as a silver lining. First off, it looks like inflation is going to be starting this shock from a pretty good place. Measures of near-term core inflation all showed signs of softening price momentum. The main measures were all roughly in line with the 2% target rate on a three-month annualized basis (Chart 1). Moreover, this trend has been building for a while – the rate of annualized change over the past six months showed the average of the BoC’s measures (1.7%), CPIX (2.5%) and CPI excluding food and energy (2.1%) all roughly in line with target. The positive progress suggests that officials were well on track to meet the 2% target before the most recent shock. These subdued near-term price changes despite the disruptions to supply chains from tariffs suggest that the economy is operating with some excess capacity.
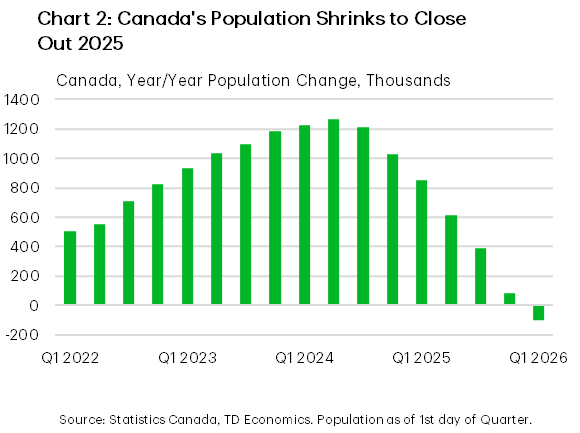
Another major development happening in the background is the country’s population turning modestly lower in 2025 (Chart 2). On the surface, declining population should help to relieve pressure on housing markets and weigh on rental growth, putting further downward pressure on shelter inflation. However, it is also leading to some tightening in labour supply, limiting spare capacity. On balance, we don’t see labour demand improving much in the coming months, but tighter labour supply will help to offset some rise in the unemployment rate.
A solid starting point for inflation and domestic excess capacity give the BoC some wiggle room to deal with the evolving energy shock. As a result, we see core measures of inflation moving only modestly higher in the coming months, before moderating into 2027. Absent a more meaningful softening in the economy, this is likely to keep the BoC on hold indefinitely.
U.S. – The Fed Pauses, Inflation Persists
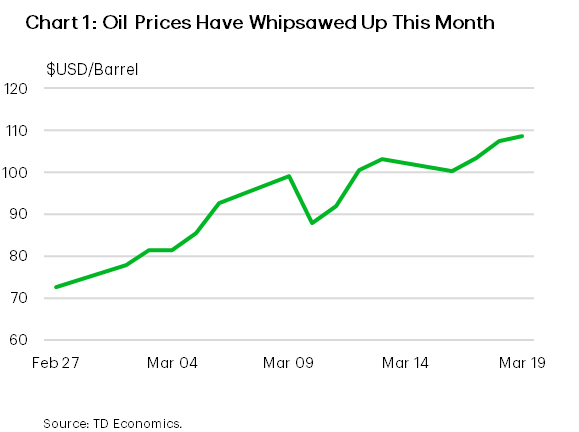
Financial markets remained on edge this week as the conflict in the Middle East escalated, with uncertainty expanding into physical energy supply rather than just shipping disruptions. Reports of damage to key oil and LNG facilities in the Gulf, including infrastructure that could take months—if not longer—to repair, have injected a persistent risk premium into energy markets. Oil prices have swung sharply day‑to‑day and remain well above pre‑conflict levels (Chart 1). This dynamic remains consistent with the base case in our Quarterly Economic Forecast, but risks of even higher prices are growing. Higher gasoline prices hurt consumer spending and the prolonged uncertainty raises downside risks in energy‑importing regions. We flagged these concerns this week in our State Economic Forecast, especially for states with higher exposure to transportation, manufacturing, and energy‑intensive industries.
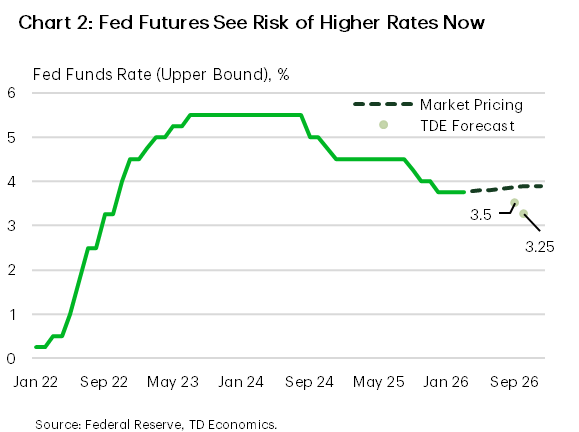
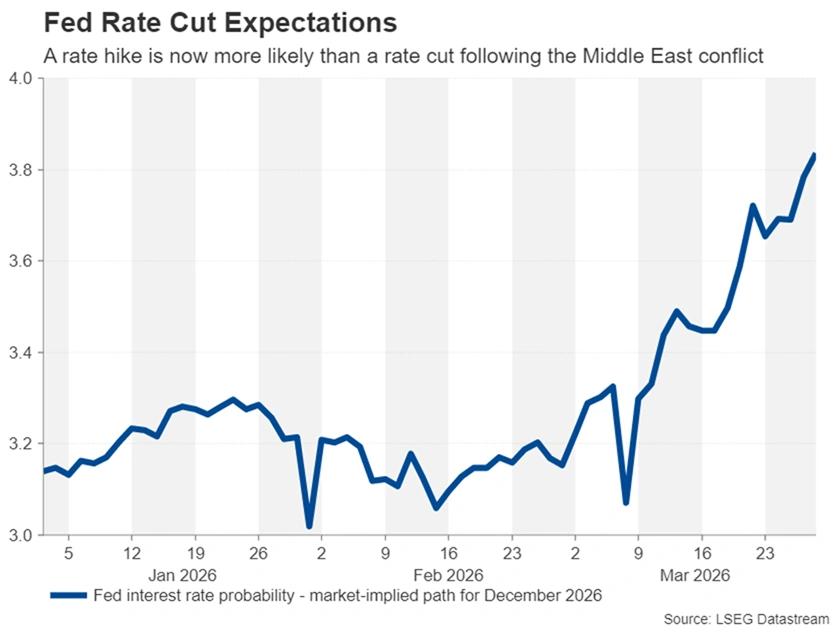
Against this backdrop, the Federal Reserve held its policy rate steady this week, as expected, but the statement was cautious. Chairman Powell acknowledged the heightened uncertainty stemming from the Middle East conflict, and revised projections showed higher inflation relative to December. The Fed continues to signal just one rate cut this year, reflecting concern that higher energy prices could slow the disinflation process at a time when core inflation is already proving sticky. Market reaction reinforced inflation concerns, with fed funds futures beginning to price a non‑trivial risk that the next move in rates may not be lower (Chart 2). Our commentary noted that the Fed appears intent on preserving flexibility, particularly given the risk that a prolonged energy shock could push the economy toward an uncomfortable mix of slower growth and firmer inflation.
Against this backdrop, markets continued to reprice risk this week in response to higher energy prices and a more cautious Federal Reserve. Equity markets struggled to find footing, while Treasury yields pushed higher as inflation risks moved back to the foreground. Incoming economic data offered a mixed picture. New home sales fell sharply in January, a reminder that interest‑rate‑sensitive sectors remain vulnerable to higher yields, though weather effects likely exaggerated the weakness. More broadly, the data flow reinforces that financial conditions are doing more of the near‑term adjustment work as the economy absorbs another external shock.
Looking ahead to next week, attention will undoubtedly remain on developments in the Middle East. Beyond the headlines, investors will also be watching how Fed officials are responding to the evolving situation and also the University of Michigan Consumer Sentiment Survey, a widely followed gauge of household confidence and inflation expectations. With energy prices and volatility high, these data could offer early signs of whether the current shock is beginning to weigh more materially on sentiment—or inflation expectations—an outcome that would further complicate the policy backdrop.
Summary 3/31 – 4/3
Monday, Mar 30, 2026
| GMT | Ccy | Events | Cons | Prev |
|---|---|---|---|---|
| 23:50 | JPY | BoJ Summary of Opinions | ||
| 07:00 | CHF | KOF Leading Indicator Feb | 100.6 | 104.2 |
| 08:30 | GBP | Mortgage Approvals Feb | 61K | 60K |
| 08:30 | GBP | M4 Money Supply M/M Feb | 0.10% | -0.10% |
| 09:00 | EUR | Eurozone Economic Sentiment Indicator Mar | 96.5 | 98.3 |
| 09:00 | EUR | Eurozone Industrial Confidence Mar | -9 | -7.1 |
| 09:00 | EUR | Eurozone Services Sentiment Mar | 4 | 5 |
| 09:00 | EUR | Eurozone Consumer Confidence Mar F | -16.3 | -16.3 |
| 12:00 | EUR | Germany CPI M/M Mar P | 0.90% | 0.20% |
| 12:00 | EUR | Germany CPI Y/Y Mar P | 2.70% | 1.90% |
| 23:50 | JPY |
| BoJ Summary of Opinions | |
| Consensus | |
| Previous | |
| 07:00 | CHF |
| KOF Leading Indicator Feb | |
| Consensus | 100.6 |
| Previous | 104.2 |
| 08:30 | GBP |
| Mortgage Approvals Feb | |
| Consensus | 61K |
| Previous | 60K |
| 08:30 | GBP |
| M4 Money Supply M/M Feb | |
| Consensus | 0.10% |
| Previous | -0.10% |
| 09:00 | EUR |
| Eurozone Economic Sentiment Indicator Mar | |
| Consensus | 96.5 |
| Previous | 98.3 |
| 09:00 | EUR |
| Eurozone Industrial Confidence Mar | |
| Consensus | -9 |
| Previous | -7.1 |
| 09:00 | EUR |
| Eurozone Services Sentiment Mar | |
| Consensus | 4 |
| Previous | 5 |
| 09:00 | EUR |
| Eurozone Consumer Confidence Mar F | |
| Consensus | -16.3 |
| Previous | -16.3 |
| 12:00 | EUR |
| Germany CPI M/M Mar P | |
| Consensus | 0.90% |
| Previous | 0.20% |
| 12:00 | EUR |
| Germany CPI Y/Y Mar P | |
| Consensus | 2.70% |
| Previous | 1.90% |
Tuesday, Mar 31, 2026
| GMT | Ccy | Events | Cons | Prev |
|---|---|---|---|---|
| 23:01 | GBP | BRC Shop Price Index Y/Y Mar | 1.20% | 1.10% |
| 23:30 | JPY | Tokyo CPI Y/Y Mar | 1.60% | |
| 23:30 | JPY | Tokyo CPI Core Y/Y Mar | 1.80% | 1.80% |
| 23:30 | JPY | Tokyo CPI Core-Core Y/Y Mar | 2.50% | |
| 23:30 | JPY | Unemployment Rate Feb | 2.70% | 2.70% |
| 23:50 | JPY | Industrial Production M/M Feb P | -2.10% | 4.30% |
| 23:50 | JPY | Retail Trade Y/Y Feb | 0.80% | 1.80% |
| 00:00 | NZD | ANZ Business Confidence Mar | 59.2 | |
| 00:00 | NZD | ANZ Activity Outlook Mar | 52.6 | |
| 00:30 | AUD | RBA Minutes | ||
| 00:30 | AUD | Private Sector Credit M/M Feb | 0.60% | 0.50% |
| 01:30 | CNY | NBS Manufacturing PMI Mar | 50.3 | 49 |
| 01:30 | CNY | NBS Non-Manufacturing PMI Mar | 49.9 | 49.5 |
| 05:00 | JPY | Housing Starts Y/Y Feb | -4.40% | -0.40% |
| 06:00 | EUR | Germany Import Price M/M Feb | 0.70% | 1.10% |
| 06:00 | EUR | Germany Retail Sales M/M Feb | 0.30% | -0.90% |
| 06:00 | GBP | GDP Q/Q Q4 F | 0.10% | 0.10% |
| 06:00 | GBP | Current Account (GBP) Q4 | -23.3B | -12.1B |
| 07:55 | EUR | Germany Unemployment Change Feb | 4K | 1K |
| 07:55 | EUR | Germany Unemployment Rate Feb | 6.30% | 6.30% |
| 09:00 | EUR | Eurozone CPI Y/Y Mar P | 2.50% | 1.90% |
| 09:00 | EUR | Eurozone Core CPI Y/Y Mar P | 2.40% | 2.40% |
| 12:30 | CAD | GDP M/M Jan | 0.10% | 0.20% |
| 13:00 | USD | S&P/CS Composite-20 HPI Y/Y Jan | 1.50% | 1.40% |
| 13:00 | USD | Housing Price Index M/M Jan | 0.10% | 0.10% |
| 13:45 | USD | Chicago PMI Mar | 55.6 | 57.7 |
| 14:00 | USD | Consumer Confidence Mar | 88.3 | 91.2 |
| 23:01 | GBP |
| BRC Shop Price Index Y/Y Mar | |
| Consensus | 1.20% |
| Previous | 1.10% |
| 23:30 | JPY |
| Tokyo CPI Y/Y Mar | |
| Consensus | |
| Previous | 1.60% |
| 23:30 | JPY |
| Tokyo CPI Core Y/Y Mar | |
| Consensus | 1.80% |
| Previous | 1.80% |
| 23:30 | JPY |
| Tokyo CPI Core-Core Y/Y Mar | |
| Consensus | |
| Previous | 2.50% |
| 23:30 | JPY |
| Unemployment Rate Feb | |
| Consensus | 2.70% |
| Previous | 2.70% |
| 23:50 | JPY |
| Industrial Production M/M Feb P | |
| Consensus | -2.10% |
| Previous | 4.30% |
| 23:50 | JPY |
| Retail Trade Y/Y Feb | |
| Consensus | 0.80% |
| Previous | 1.80% |
| 00:00 | NZD |
| ANZ Business Confidence Mar | |
| Consensus | |
| Previous | 59.2 |
| 00:00 | NZD |
| ANZ Activity Outlook Mar | |
| Consensus | |
| Previous | 52.6 |
| 00:30 | AUD |
| RBA Minutes | |
| Consensus | |
| Previous | |
| 00:30 | AUD |
| Private Sector Credit M/M Feb | |
| Consensus | 0.60% |
| Previous | 0.50% |
| 01:30 | CNY |
| NBS Manufacturing PMI Mar | |
| Consensus | 50.3 |
| Previous | 49 |
| 01:30 | CNY |
| NBS Non-Manufacturing PMI Mar | |
| Consensus | 49.9 |
| Previous | 49.5 |
| 05:00 | JPY |
| Housing Starts Y/Y Feb | |
| Consensus | -4.40% |
| Previous | -0.40% |
| 06:00 | EUR |
| Germany Import Price M/M Feb | |
| Consensus | 0.70% |
| Previous | 1.10% |
| 06:00 | EUR |
| Germany Retail Sales M/M Feb | |
| Consensus | 0.30% |
| Previous | -0.90% |
| 06:00 | GBP |
| GDP Q/Q Q4 F | |
| Consensus | 0.10% |
| Previous | 0.10% |
| 06:00 | GBP |
| Current Account (GBP) Q4 | |
| Consensus | -23.3B |
| Previous | -12.1B |
| 07:55 | EUR |
| Germany Unemployment Change Feb | |
| Consensus | 4K |
| Previous | 1K |
| 07:55 | EUR |
| Germany Unemployment Rate Feb | |
| Consensus | 6.30% |
| Previous | 6.30% |
| 09:00 | EUR |
| Eurozone CPI Y/Y Mar P | |
| Consensus | 2.50% |
| Previous | 1.90% |
| 09:00 | EUR |
| Eurozone Core CPI Y/Y Mar P | |
| Consensus | 2.40% |
| Previous | 2.40% |
| 12:30 | CAD |
| GDP M/M Jan | |
| Consensus | 0.10% |
| Previous | 0.20% |
| 13:00 | USD |
| S&P/CS Composite-20 HPI Y/Y Jan | |
| Consensus | 1.50% |
| Previous | 1.40% |
| 13:00 | USD |
| Housing Price Index M/M Jan | |
| Consensus | 0.10% |
| Previous | 0.10% |
| 13:45 | USD |
| Chicago PMI Mar | |
| Consensus | 55.6 |
| Previous | 57.7 |
| 14:00 | USD |
| Consumer Confidence Mar | |
| Consensus | 88.3 |
| Previous | 91.2 |
Wednesday, Apr 1, 2026
| GMT | Ccy | Events | Cons | Prev |
|---|---|---|---|---|
| 23:50 | JPY | Tankan Large Manufacturing Index Q1 | 16 | 15 |
| 23:50 | JPY | Tankan Non - Manufacturing Index Q1 | 33 | 34 |
| 23:50 | JPY | Tankan Large All Industry Capex Q1 | 3.00% | 12.60% |
| 00:30 | AUD | Building Permits M/M Feb | 6.20% | -7.20% |
| 00:30 | JPY | Manufacturing PMI Mar F | 51.4 | 51.4 |
| 01:45 | CNY | RatingDog Manufacturing PMI Mar | 51.8 | 52.1 |
| 06:30 | CHF | Real Retail Sales Y/Y Feb | 0.90% | -1.10% |
| 07:30 | CHF | Manufacturing PMI Mar | 47.1 | 47.4 |
| 07:50 | EUR | France Manufacturing PMI Mar F | 50.2 | 50.2 |
| 07:55 | EUR | Germany Manufacturing PMI Mar F | 51.7 | 51.7 |
| 08:00 | EUR | Eurozone Manufacturing PMI Mar F | 51.4 | 51.4 |
| 08:30 | GBP | Manufacturing PMI Mar F | 51.4 | 51.4 |
| 09:00 | EUR | Eurozone Unemployment Rate Feb | 6.10% | 6.10% |
| 12:15 | USD | ADP Employment Change Mar | 42K | 63K |
| 12:30 | USD | Retail Sales M/M Feb | 0.40% | -0.20% |
| 12:30 | USD | Retail Sales ex Autos M/M Feb | 0.30% | 0.00% |
| 13:30 | CAD | Manufacturing PMI Mar | 51 | |
| 13:45 | USD | Manufacturing PMI Mar F | 52.4 | 52.4 |
| 14:00 | USD | ISM Manufacturing PMI Mar | 52.3 | 52.4 |
| 14:00 | USD | ISM Manufacturing Prices Paid Mar | 72.5 | 70.5 |
| 14:00 | USD | ISM Manufacturing Employment Index Mar | 48.8 | |
| 14:00 | USD | Business Inventories Jan | 0.20% | 0.10% |
| 14:30 | USD | Crude Oil Inventories (Mar 27) | 2.0M | 6.9M |
| 23:50 | JPY |
| Tankan Large Manufacturing Index Q1 | |
| Consensus | 16 |
| Previous | 15 |
| 23:50 | JPY |
| Tankan Non - Manufacturing Index Q1 | |
| Consensus | 33 |
| Previous | 34 |
| 23:50 | JPY |
| Tankan Large All Industry Capex Q1 | |
| Consensus | 3.00% |
| Previous | 12.60% |
| 00:30 | AUD |
| Building Permits M/M Feb | |
| Consensus | 6.20% |
| Previous | -7.20% |
| 00:30 | JPY |
| Manufacturing PMI Mar F | |
| Consensus | 51.4 |
| Previous | 51.4 |
| 01:45 | CNY |
| RatingDog Manufacturing PMI Mar | |
| Consensus | 51.8 |
| Previous | 52.1 |
| 06:30 | CHF |
| Real Retail Sales Y/Y Feb | |
| Consensus | 0.90% |
| Previous | -1.10% |
| 07:30 | CHF |
| Manufacturing PMI Mar | |
| Consensus | 47.1 |
| Previous | 47.4 |
| 07:50 | EUR |
| France Manufacturing PMI Mar F | |
| Consensus | 50.2 |
| Previous | 50.2 |
| 07:55 | EUR |
| Germany Manufacturing PMI Mar F | |
| Consensus | 51.7 |
| Previous | 51.7 |
| 08:00 | EUR |
| Eurozone Manufacturing PMI Mar F | |
| Consensus | 51.4 |
| Previous | 51.4 |
| 08:30 | GBP |
| Manufacturing PMI Mar F | |
| Consensus | 51.4 |
| Previous | 51.4 |
| 09:00 | EUR |
| Eurozone Unemployment Rate Feb | |
| Consensus | 6.10% |
| Previous | 6.10% |
| 12:15 | USD |
| ADP Employment Change Mar | |
| Consensus | 42K |
| Previous | 63K |
| 12:30 | USD |
| Retail Sales M/M Feb | |
| Consensus | 0.40% |
| Previous | -0.20% |
| 12:30 | USD |
| Retail Sales ex Autos M/M Feb | |
| Consensus | 0.30% |
| Previous | 0.00% |
| 13:30 | CAD |
| Manufacturing PMI Mar | |
| Consensus | |
| Previous | 51 |
| 13:45 | USD |
| Manufacturing PMI Mar F | |
| Consensus | 52.4 |
| Previous | 52.4 |
| 14:00 | USD |
| ISM Manufacturing PMI Mar | |
| Consensus | 52.3 |
| Previous | 52.4 |
| 14:00 | USD |
| ISM Manufacturing Prices Paid Mar | |
| Consensus | 72.5 |
| Previous | 70.5 |
| 14:00 | USD |
| ISM Manufacturing Employment Index Mar | |
| Consensus | |
| Previous | 48.8 |
| 14:00 | USD |
| Business Inventories Jan | |
| Consensus | 0.20% |
| Previous | 0.10% |
| 14:30 | USD |
| Crude Oil Inventories (Mar 27) | |
| Consensus | 2.0M |
| Previous | 6.9M |
Thursday, Apr 2, 2026
| GMT | Ccy | Events | Cons | Prev |
|---|---|---|---|---|
| 23:50 | JPY | Monetary Base Y/Y Mar | -10.40% | -10.60% |
| 00:30 | AUD | Trade Balance (AUD) Feb | 2.55B | 2.63B |
| 06:30 | CHF | CPI M/M Mar | 0.50% | 0.60% |
| 06:30 | CHF | CPI Y/Y Mar | 0.50% | 0.10% |
| 12:30 | USD | Initial Jobless Claims (Mar 27) | 215K | 210K |
| 12:30 | USD | Trade Balance (USD) Feb | -59.2B | -54.5B |
| 12:30 | CAD | Trade Balance (CAD) Feb | -1.8B | -3.65B |
| 14:30 | USD | Natural Gas Storage (Mar 27) | 38B | -54B |
| 23:50 | JPY |
| Monetary Base Y/Y Mar | |
| Consensus | -10.40% |
| Previous | -10.60% |
| 00:30 | AUD |
| Trade Balance (AUD) Feb | |
| Consensus | 2.55B |
| Previous | 2.63B |
| 06:30 | CHF |
| CPI M/M Mar | |
| Consensus | 0.50% |
| Previous | 0.60% |
| 06:30 | CHF |
| CPI Y/Y Mar | |
| Consensus | 0.50% |
| Previous | 0.10% |
| 12:30 | USD |
| Initial Jobless Claims (Mar 27) | |
| Consensus | 215K |
| Previous | 210K |
| 12:30 | USD |
| Trade Balance (USD) Feb | |
| Consensus | -59.2B |
| Previous | -54.5B |
| 12:30 | CAD |
| Trade Balance (CAD) Feb | |
| Consensus | -1.8B |
| Previous | -3.65B |
| 14:30 | USD |
| Natural Gas Storage (Mar 27) | |
| Consensus | 38B |
| Previous | -54B |
Friday, Apr 3, 2026
| GMT | Ccy | Events | Cons | Prev |
|---|---|---|---|---|
| 00:30 | JPY | Services PMI Mar F | 52.8 | 52.8 |
| 01:45 | CNY | RatingDog Services PMI Mar | 53.7 | 56.7 |
| 12:30 | USD | Nonfarm Payrolls Mar | 48K | -92K |
| 12:30 | USD | Unemployment Rate Mar | 4.40% | 4.40% |
| 12:30 | USD | Average Hourly Earnings M/M Mar | 0.30% | 0.40% |
| 13:45 | USD | Services PMI Mar F | 51.1 | 51.1 |
| 00:30 | JPY |
| Services PMI Mar F | |
| Consensus | 52.8 |
| Previous | 52.8 |
| 01:45 | CNY |
| RatingDog Services PMI Mar | |
| Consensus | 53.7 |
| Previous | 56.7 |
| 12:30 | USD |
| Nonfarm Payrolls Mar | |
| Consensus | 48K |
| Previous | -92K |
| 12:30 | USD |
| Unemployment Rate Mar | |
| Consensus | 4.40% |
| Previous | 4.40% |
| 12:30 | USD |
| Average Hourly Earnings M/M Mar | |
| Consensus | 0.30% |
| Previous | 0.40% |
| 13:45 | USD |
| Services PMI Mar F | |
| Consensus | 51.1 |
| Previous | 51.1 |
Canadian GDP Growth Stalled in January But Expect a Partial February Rebound
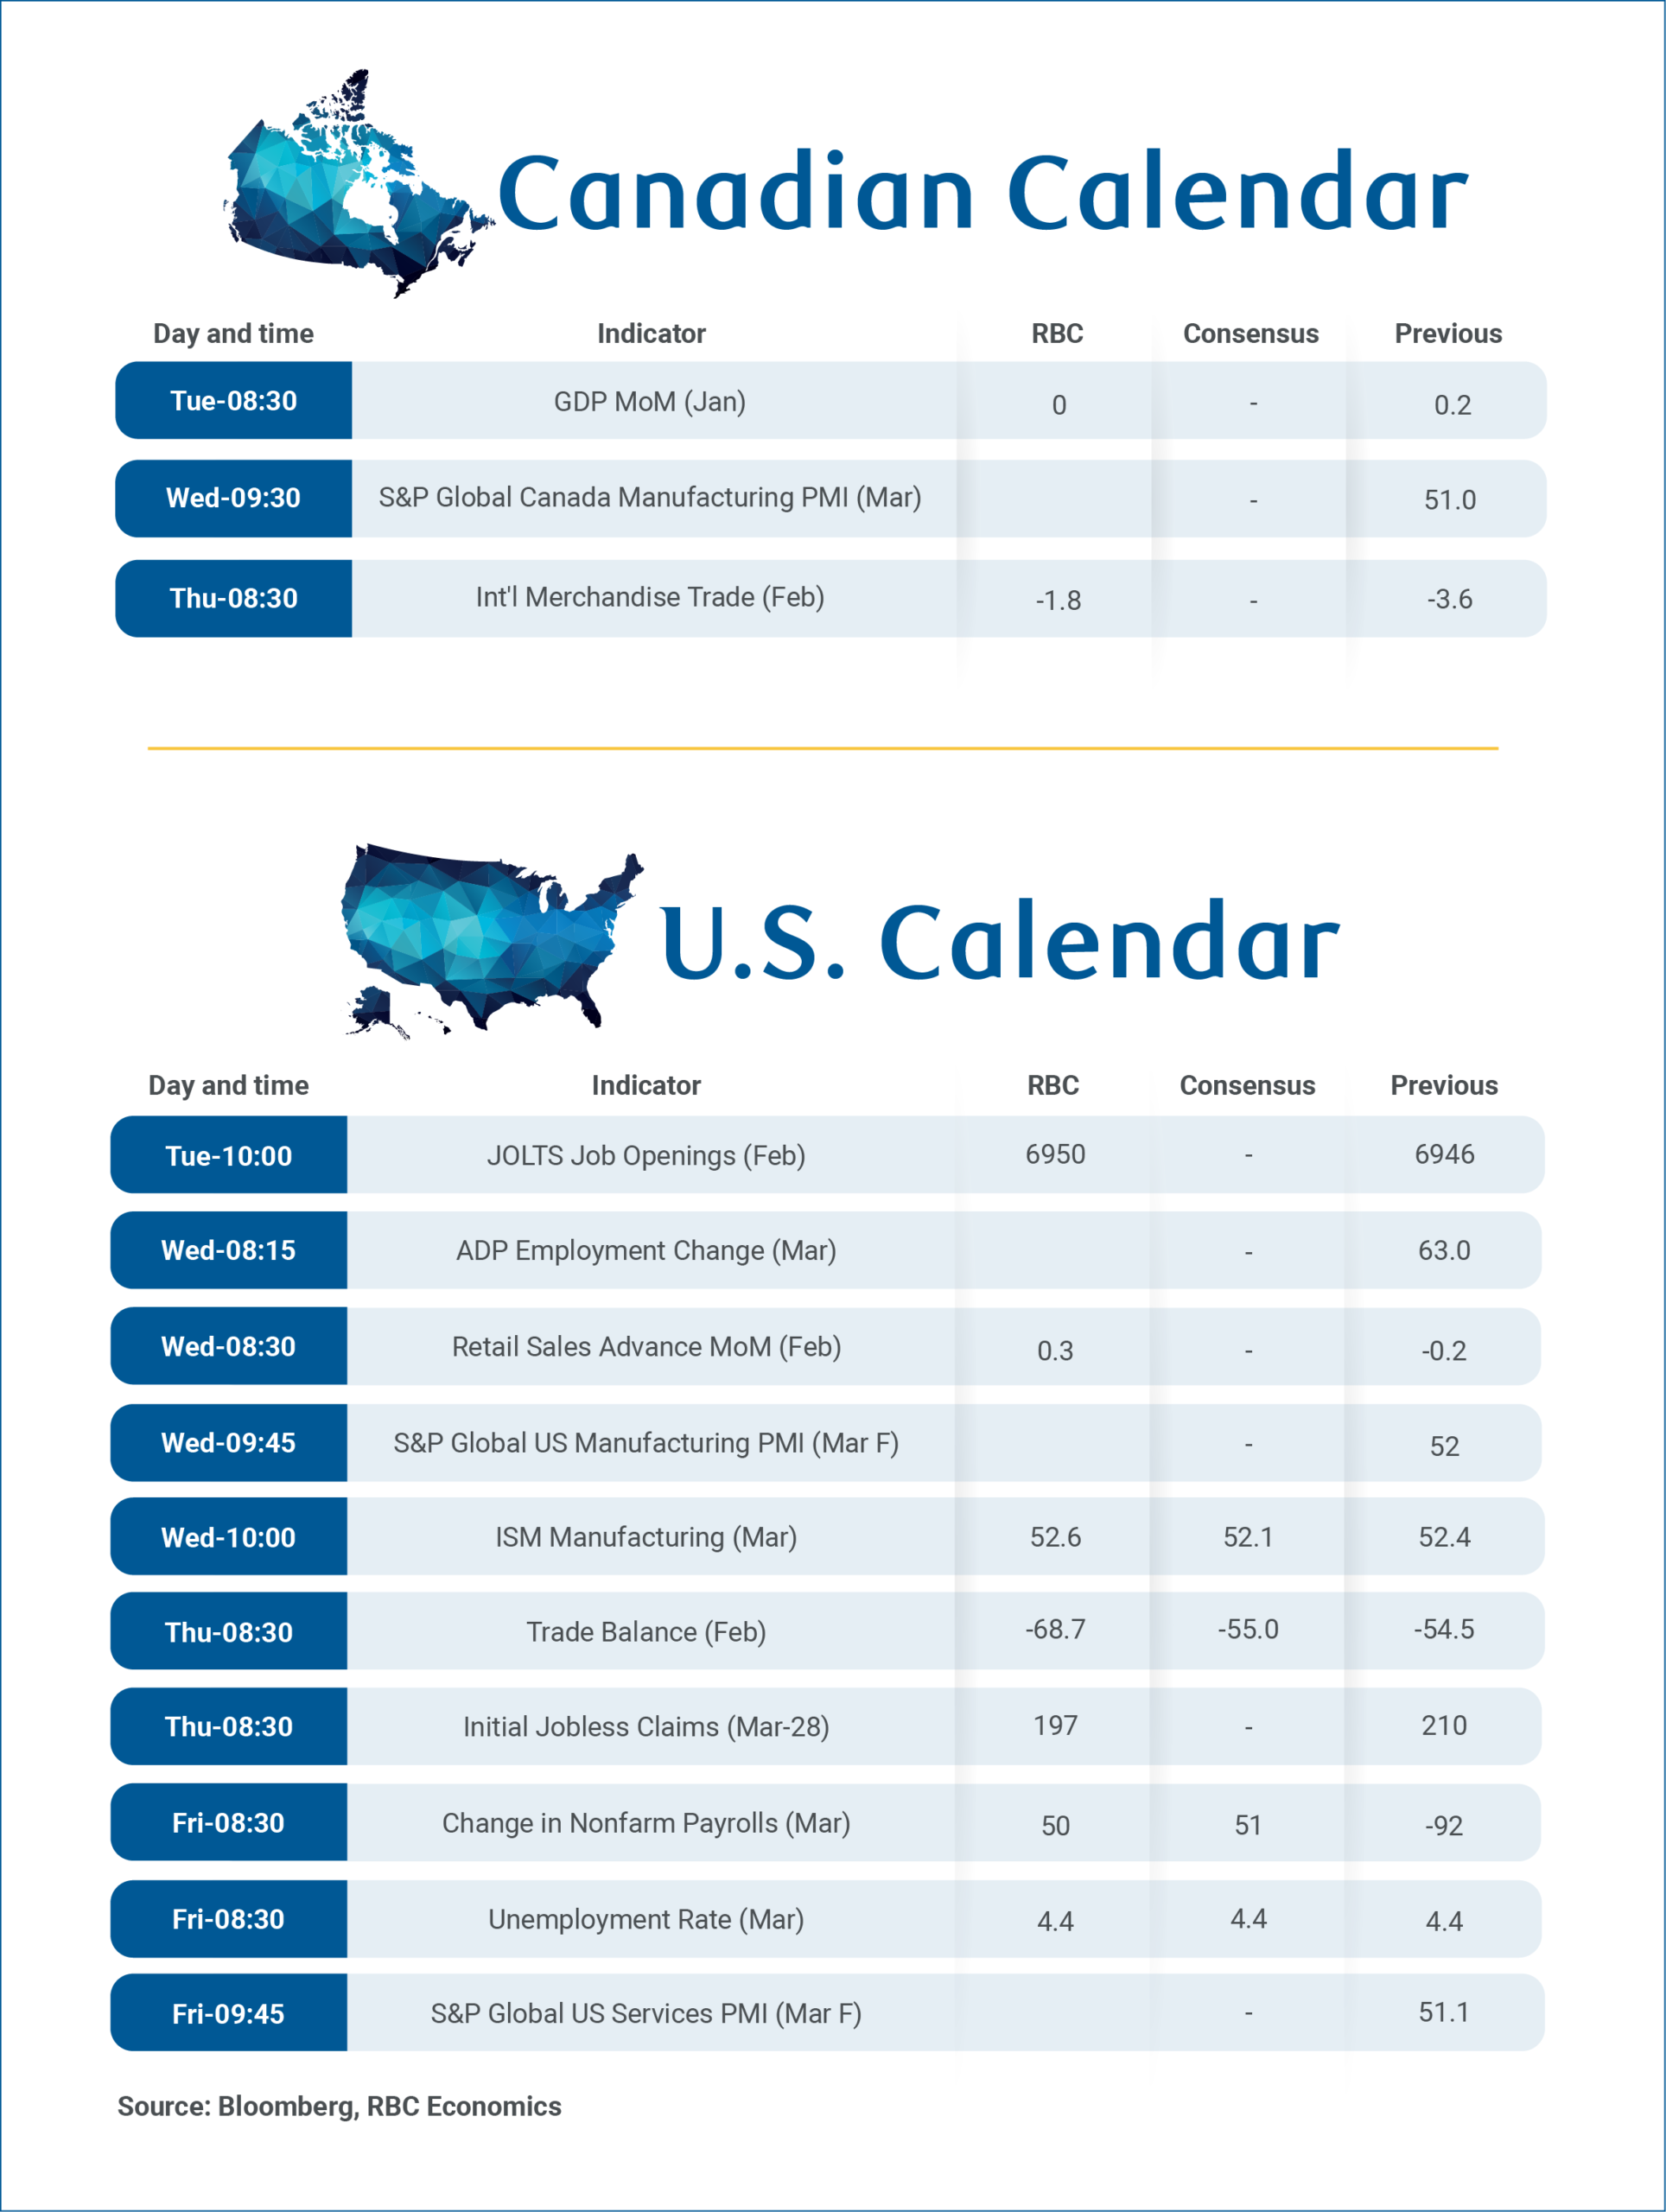
Canada’s gross domestic product for January on Tuesday, and February trade data on Thursday will provide more clues on the economy’s trajectory in early 2026.
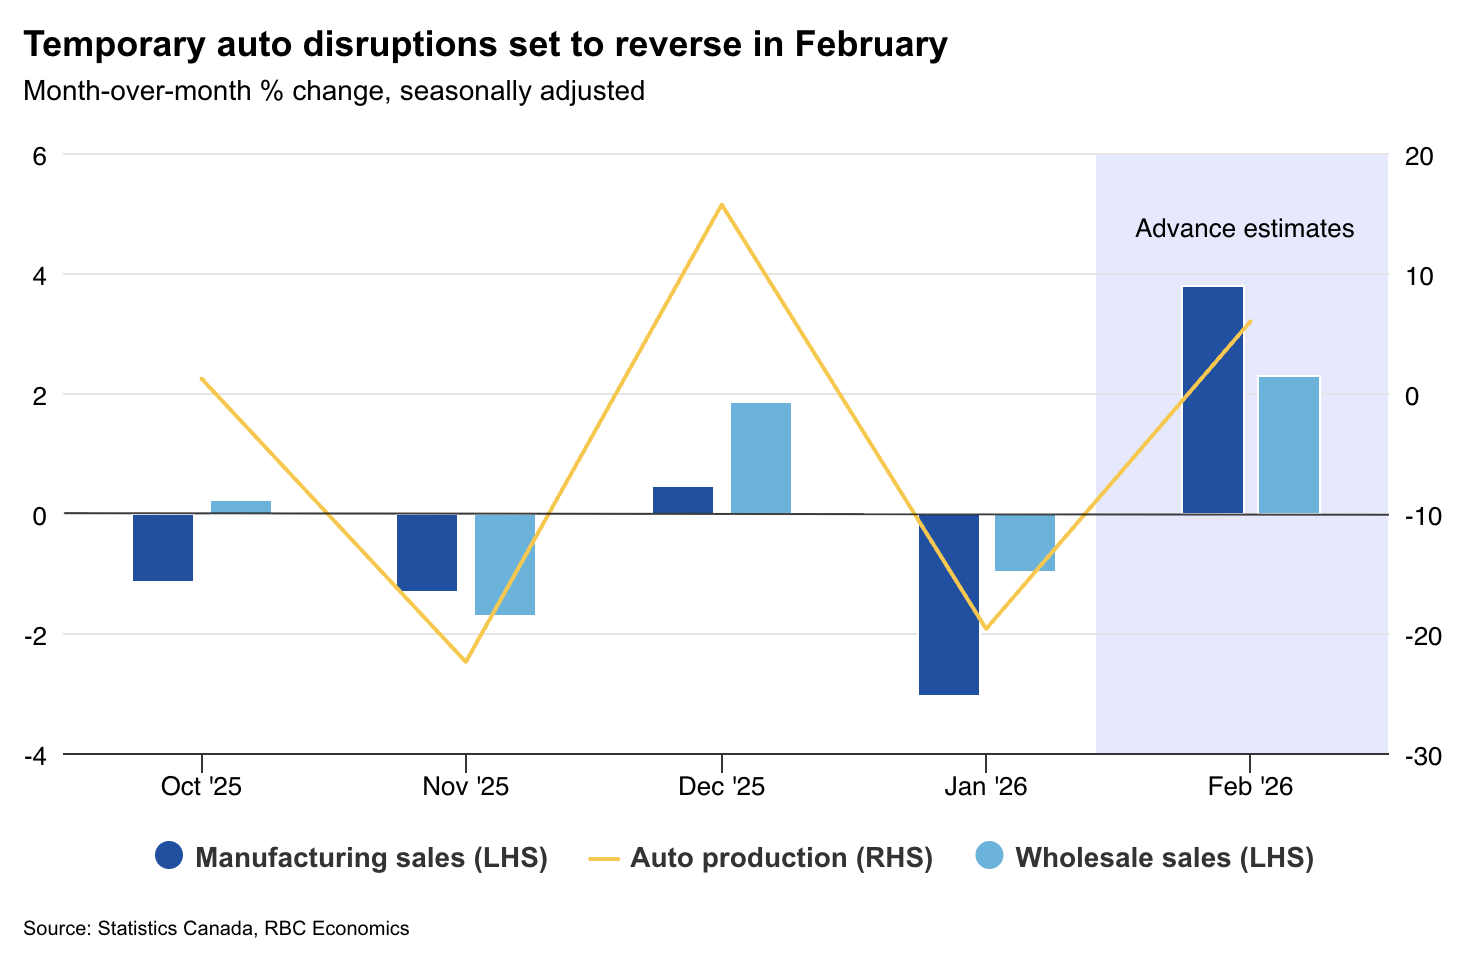
In line with Statistics Canada’s advance estimate, we expect GDP growth to have slowed to essentially flat in January after rising 0.2% in December.
Weakness was concentrated in the auto sector, where production disruptions at Ontario plants drove manufacturing and wholesale sales down 3.9% and 1.5%, respectively. Early indicators, however, point to a partial rebound in February as disruptions unwound.
Real estate agents and broker services also weakened, as unusually harsh weather dampened home resales in January. Strength in energy sectors offset these declines with Alberta’s non-conventional oil production and mining (excluding oil and gas) both rising modestly after contracting in December. Retail sales increased 1%, reflecting resilient household spending.
February indicators point to partial rebound
Spending resilience appears to have extended into February. Early indicators including our tracking of RBC card spending data , as well as Statistics Canada’s advance retail sales estimate (a 0.9% nominal increase) all point to improvement.
Other advance industry estimates also showed recovery. Manufacturing sales rose 3.8% in nominal terms, according to Statistics Canada, driven by strength in transportation equipment and food product manufacturing. Wholesale sales increased 2.3%, lifted similarly by higher auto and parts sales. Housing-related activity likely remained soft in February as home resales remained soft.
The Bank of Canada flagged downside risks to their 1.8% annualized GDP growth forecast for Q1 at the March meeting. After a weak January, improvements in activities in February and March as auto disruptions eased should still leave growth on balance in line with our forecast for a modest increase.
For February’s international trade data, we expect a narrowing in Canada’s trade deficit from $3.6 billion to $1.8 billion driven by a partial rebound in auto exports and higher oil prices. The deficit should continue to narrow in March after the Middle East conflict drove oil prices sharply higher.
We expect next week’s U.S. March payroll report to show a 50,000 increase in employment, partly driven by the end of the nurses’ strike. The unemployment rate is expected to remain steady at 4.4%, given subdued layoffs and stable initial jobless claims.
Week Ahead – US Jobs Report Eyed as Iran War Wipes Out Fed Rate Cut Bets
- Middle East conflict to remain primary driver amid peace efforts.
- US payrolls report in focus as Fed rate cut hopes fade.
- Other US data, including ISM PMIs, to shed further light on US economy.
- Eurozone and Japanese inflation also on tap ahead of Easter break.
Iran turmoil clouds outlook
Despite contradictory reports, a quick resolution to the Iran war doesn’t appear to be on the near-term horizon, heightening the uncertainty over the global economic outlook. Most importantly, oil and gas prices remain elevated, even if they haven’t been scaling new highs lately.
Thus, for central banks, the inflation threat has far from receded and the growing realisation of this is being reflected across all asset classes, with equities and bonds being sold off and the US dollar standing tall. The latter’s popularity coupled with gold’s unusual lack of safe-haven appeal indicates that investors have preferred to hold cash during this conflict.
That’s not to say that there is no prospect of the US and Iran agreeing to hold face-to-face talks aimed at ending the hostilities. After all, President Trump’s repeated insistence that America is winning the war and that Tehran is desperate to make a deal suggests he is seeking a way out.
With the US midterm elections approaching, it does not bode well for the Republican party for gasoline prices to be this high, as both the party’s and Trump’s popularity have plummeted since the start of the US-Israeli strikes.
However, markets are becoming increasingly wary of the peace efforts, as Iran has repeatedly rejected the White House’s 15-point plan and especially as there are equally strong signals of an escalation, amid the buildup of US troops in the region.
Nevertheless, any meaningful progress to begin ceasefire talks would boost risk appetite as well as divert more attention towards economic events.
From rate cuts to rate hikes
The highlight on the economic front will be the nonfarm payrolls in the United States. Most Fed policymakers continue to downplay the risks to the labour market while highlighting the inflation risks. Moreover, markets are now on board with the Fed’s hawkish stance. Investors have not only priced out any rate cuts for the foreseeable future, but they’ve also priced in around 18 basis points of rate increases by year-end.
If the incoming data reinforces the view of a resilient economy and sticky inflation, then it won’t take much for a full 25-bps hike to be baked in.
And there’s plenty of releases on the agenda that could shape those expectations, starting with the Chicago PMI and consumer confidence index for March, and the JOLTS job openings for February on Tuesday. February retail sales and the ISM manufacturing PMI for March will grab the spotlight on Wednesday, together with the ADP employment numbers. There will be more labour market indicators on Thursday with the Challenger Layoffs for March.
Will there be a jobs bounce in March?
But the main highlight as always will be Friday’s official NFP figures and the ISM services PMI. The US economy unexpectedly shed 92k jobs in February so the focus in the March data will not only be whether there was a rebound, but also if the prior month’s print will be revised higher.
The consensus estimate for March is a gain of 48k, but the unemployment rate is forecast to have edged up from 4.4% to 4.5%.
The ISM’s services activity gauge will be watched too, particularly the employment and prices paid components.
Any signs that the US jobs market is not in as good a shape as the Fed currently thinks it is, could revive rate cut expectations, but probably only mildly, unless there’s a massive drop in payrolls for the second straight month. The US dollar is likely to take a knock in such a scenario. But stocks would be in greater danger if a worsening economic picture is only partially offset by a very modest boost to rate cut bets.
Eurozone CPI eyed as ECB ponders rate hike
Across the pond, there’s been an even sharper repricing for rate expectations. Both the European Central Bank and Bank of England are seen to be raising interest rates at least twice this year, probably three times. Europe is much more reliant on oil and gas imports from the Middle East, unlike the US, which is far less energy dependent, and so the ECB and BoE have little option but to contain the fallout from the energy price shock that the Iran crisis has unleashed.
Revised estimates of Q4 GDP growth out of the UK on Tuesday are unlikely to have much bearing on BoE rate hike expectations as it’s now outdated, but the Eurozone’s flash inflation readings on the same day will be monitored quite closely.
There was a small uptick in all Eurozone CPI measures in February, including the two core rates. A further acceleration in March could make policymakers more inclined to vote for a rate hike sooner rather than later.
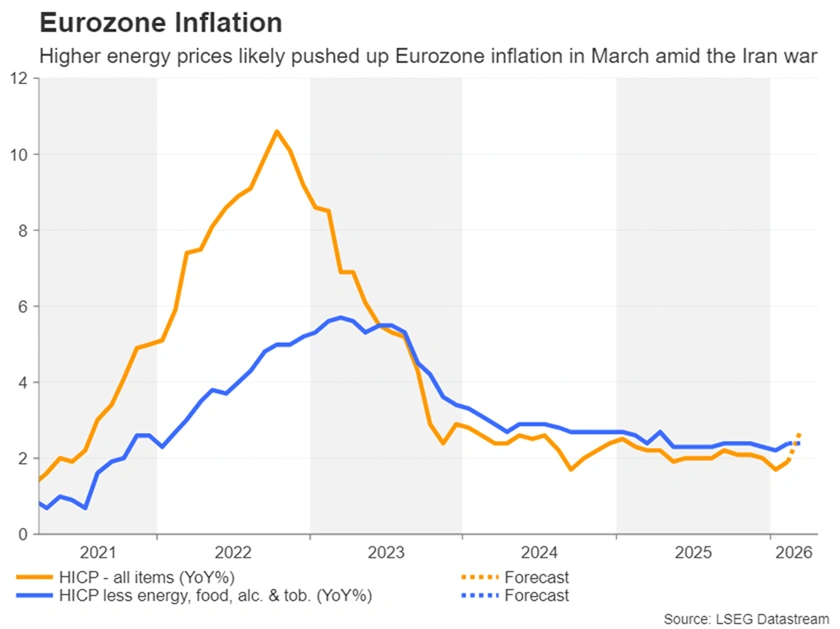
Investors see around a two-thirds probability of a 25-bps increase at the April meeting, but it’s unclear if a majority of Governing Council members are ready to back an early move. Still, if the March CPI numbers are hotter than expected, those odds would likely increase, lifting the euro somewhat.
Can Tokyo CPI shift BoJ hike expectations?
Interestingly, tightening expectations for the Bank of Japan have been less dramatic, despite the significant upside risk to Japanese inflation from the Iran conflict. Japan imports almost 90% of its oil from the Middle East and faces potential energy shortages if the blockage of the Strait of Hormuz doesn’t end soon.
The government has resorted to releasing some of its strategic oil reserves and there’s even reports it is thinking about buying Iranian oil in Chinese yuan, to evade US sanctions.
For Japan, the jump in crude oil prices poses a dual risk to inflation – first directly via higher fuel costs and indirectly via the weaker yen, which itself is coming under pressure due to the strain of the oil crisis on the country’s current account balance.
Yet, markets continue to price in just two 25-bps rate rises for 2026. Worries about the impact of higher energy costs on growth are likely dampening the more hawkish bets. But the Bank of Japan doesn’t seem too phased just yet, keeping the option of an April rate hike firmly on the table.
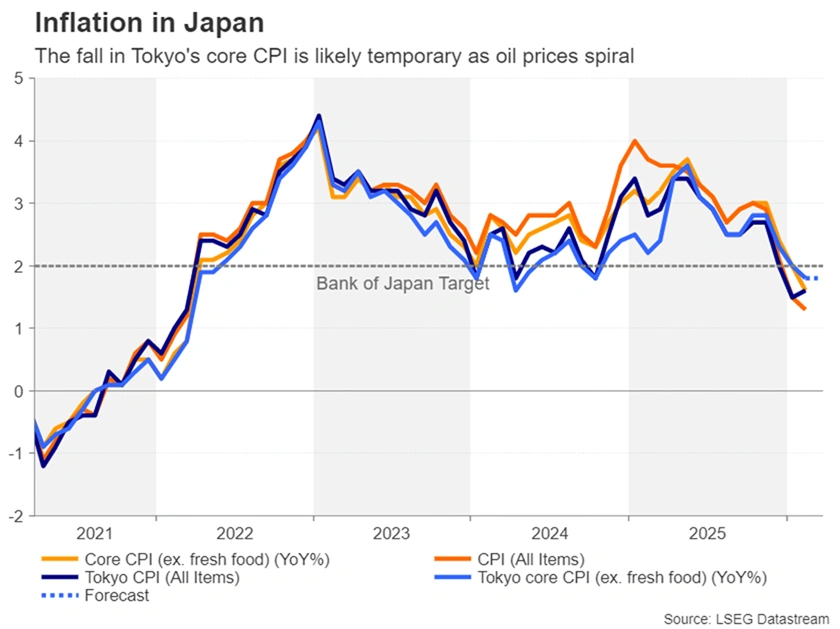
If preliminary March CPI numbers for the Tokyo district out on Tuesday show inflation heading back above the BoJ’s 2.0% target, tightening odds for April could climb higher from around 62% currently, offering some support to the beleaguered yen, as it inches ever closer to the critical 160.00 intervention mark.
Also out on Tuesday are industrial production and retail sales figures for February, followed by the BoJ’s quarterly Tankan business survey on Wednesday.
Weekly Focus – ECB on Course for Rate Hikes
We have changed our ECB call and now expect two 25bp hikes delivered in April and June, respectively, bringing the deposit rate to 2.50%. The comments from the ECB's GC members have been significantly more hawkish compared to Lagarde's view at the last monetary policy meeting. This makes the call for a total of 50bp hikes by YE 2026 more likely than ECB remaining at 2.00% although the latter can certainly not be ruled out. Our call is highly contingent on the developments of the war in Iran, so we present three scenarios for the ECB's deposit rate path in 2026 and 2027 in Reading the Markets EUR - New call: two 25bp hikes in April and June, 27 March.
This week provided the first hints that US President Donald Trump is starting to look for an exit of the Iran war. But also, that he is still considering "a final decisive blow". The mixed news left markets in another rollercoaster pattern. Trump said on Monday, US would not hit Iranian energy infrastructure for five days and was talking with Iran, which caused oil prices to drop below USD100 per barrel after hitting close to USD120 per barrel last week. On Thursday he prolonged the deadline by 10 days referring to good talks. Axios reported during the week that US is weighing options for a "final blow" in Iran that may include ground forces and a major bombing campaign. However, WSJ also reported that Trump had told advisers he wanted an end to the war soon, and he announced new dates for his trip to China, 14-15 May. The trip was supposed to take place next week but was delayed due to the war. Trump's approval rating is declining by the day, and high gasoline prices is starting to hurt. Even if Trump is looking for an exit and does not escalate further it is not clear that Iran is willing to back down and reopen the Strait of Hormuz. And should Trump decide on putting 'boots on the ground' the probability of escalation goes up significantly.
We see a risk that the conflict drags out beyond the 4-6 weeks that Trump has aimed for from the outset. Uncertainty is of course unusually high, and many scenarios are in play, both for the war and the global economy. Oil markets are currently priced for a fairly quick resolution of the war with oil futures pricing a decline from just below USD110 per barrel at the time of writing to USD 90 by late summer and USD85 by the end of the year.
Financial markets have generally followed the ebbs and flows in the Iran war with equities higher on Monday when oil prices dropped but moving broadly sideways in a see-saw pattern for the rest of the week. Bond yields and the USD have followed a similar pattern.
On the data front PMIs for March were in the spotlight, not least as a first sign of the impact of the Iran war. Euro PMIs were mixed with manufacturing holding up well while services took a hit with a decline from 51.9 to 50.1. The price indices moved sharply higher lifted by the rise in energy prices.
Next week, developments in the Iran war will continue to be the main market driver but we also get key US labour market data with the JOLTS job openings, Challenger job cuts ahead of the main release, non-farm payrolls on Friday. In the euro zone, Flash CPI for March, released Tuesday, will be in focus. Germany will publish March CPI numbers on Monday.
EUR/USD Mid-Day Outlook
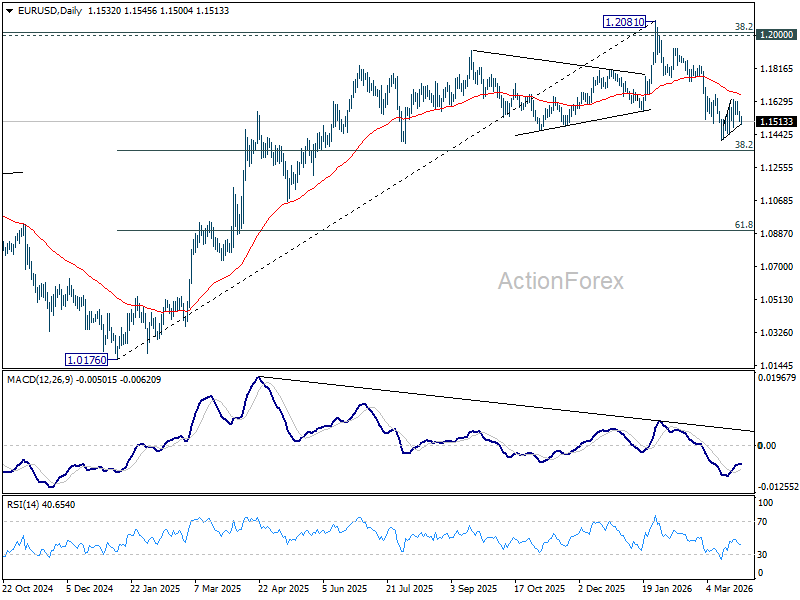
Daily Pivots: (S1) 1.1508; (P) 1.1541; (R1) 1.1562; More….
EUR/USD dips lower today but stays in range above 1.1408 low. Intraday bias remains neutral at this point. With 1.1666 cluster resistance (38.2% retracement of 1.2081 to 1.1408 at 1.1665) intact, further decline is in favor. On the downside, below 1.1408 will resume the fall from 1.2081 to 38.2% retracement of 1.0176 to 1.2081 at 1.1353. However, decisive break of 1.1666 will argue that the fall from 1.2081 has completed, and turn bias back to the upside for 61.8% retracement of 1.2081 to 1.1408 at 1.1824.
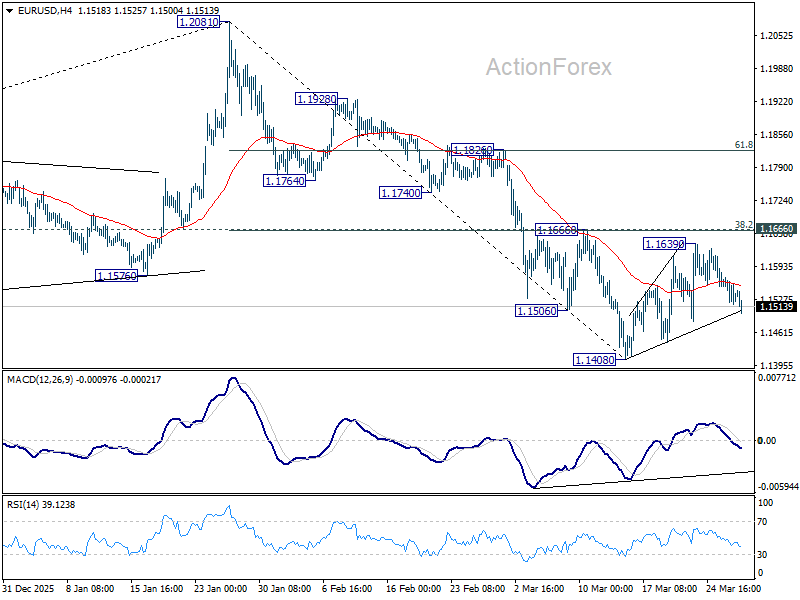
In the bigger picture, prior break of 55 W EMA (now at 1.1501) should confirm rejection by 1.2 key cluster resistance level. The whole up trend from 0.9534 (2022 low) might have completed as a three wave corrective rise too. Deeper fall is expected to long term channel support (now at 1.0528). Meanwhile, risk will stay on the downside as long as 1.2081 holds, even in case of strong rebound.
GBP/USD Mid-Day Outlook
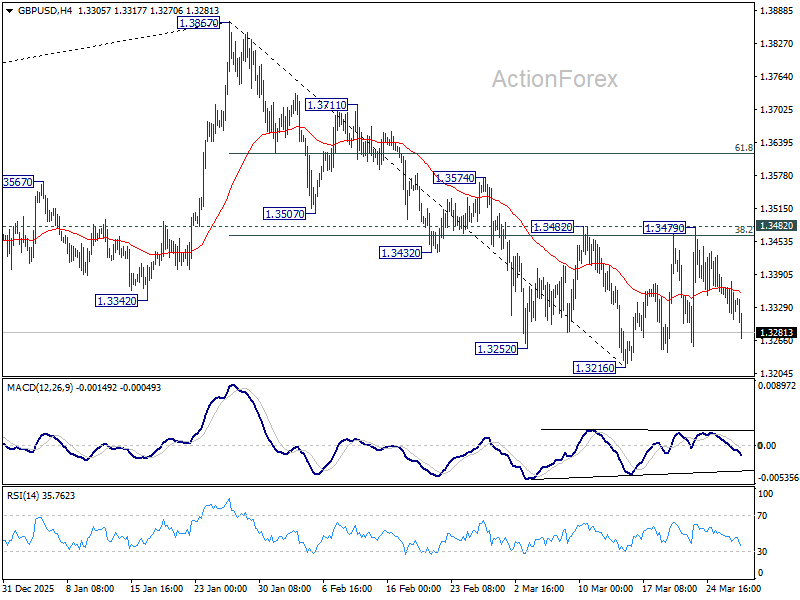
Daily Pivots: (S1) 1.3301; (P) 1.3340; (R1) 1.3369; More...
GBP/USD accelerates lower today but it's still holding above 1.3216 support. Intraday bias remains neutral at this point. With 1.3482 resistance intact, further decline is in favor. On the downside, below 1.3216 will resume the fall from 1.3867 to 1.3008 structural support. However, decisive break of 1.3482 will argue that the fall from 1.3867 has completed, and turn bias back to the upside for 61.8% retracement of 1.3867 to 1.3216 at 1.3618.
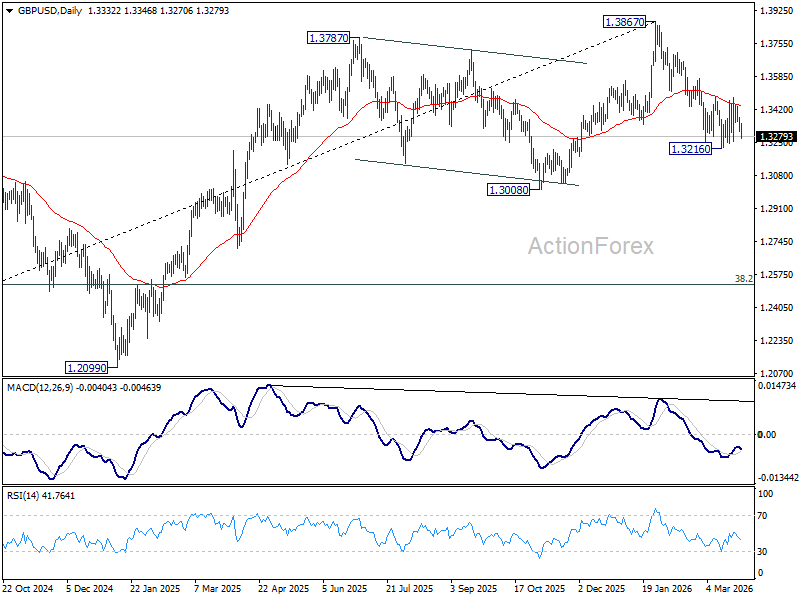
In the bigger picture, considering bearish divergence condition in both D and W MACD, a medium term top should be in place at 1.3867. Firm break of 1.3008 support will argue that fall from 1.3867 is at least correcting the rise from 1.0351 (2022 low) with risk of bearish reversal. That would open up further decline to 38.2% retracement of 1.0351 to 1.3867 at 1.2524. For now, medium term outlook will be neutral at best as long as 1.3867 resistance holds, or until further development.
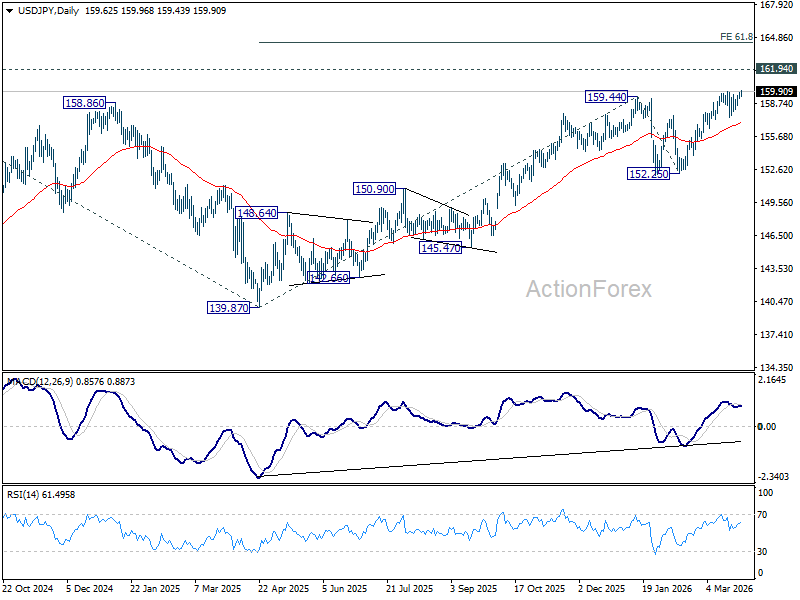
USD/JPY Mid-Day Outlook
Daily Pivots: (S1) 159.42; (P) 159.64; (R1) 159.98; More...
Intraday bias in USD/JPY is back on the upside with breach of 159.88 resistance. Rise from 152.52 is resuming and further rally should be seen to retest 161.94 high. For now, outlook will remain bullish as long as 157.49 support holds, in case of retreat.
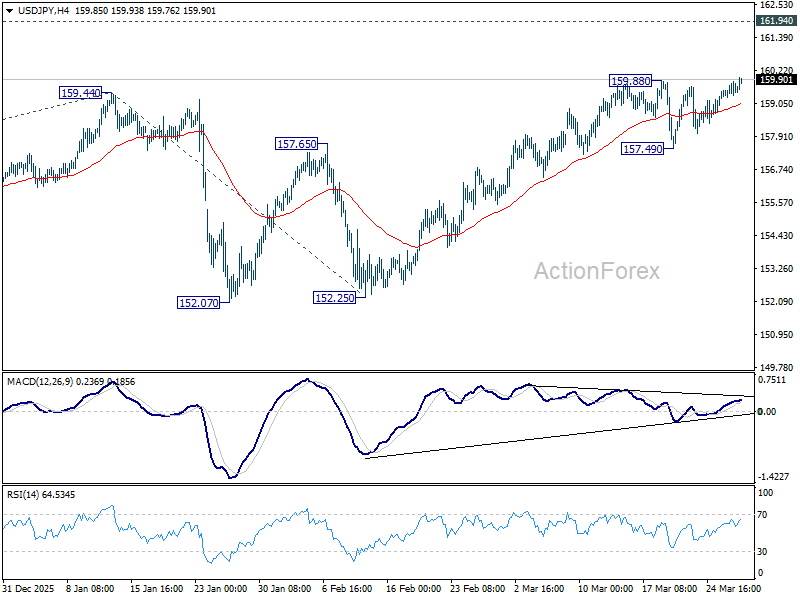
In the bigger picture, outlook is unchanged that corrective pattern from 161.94 (2024 high) should have completed with three waves at 139.87. Larger up trend from 102.58 (2021 low) could be ready to resume through 161.94. This will remain the favored case as long as 55 W EMA (now at 152.70) holds. Firm break of 161.94 will pave the way to 61.8% projection of 102.58 to 161.94 from 139.87 at 176.75.