Sample Category Title
USD/CHF Mid-Day Outlook
Daily Pivots: (S1) 0.7924; (P) 0.7942; (R1) 0.7972; More….
USD/CHF's break of 0.7957 suggests that rebound from 0.7603 is resuming. Intraday bias is now the upside. As a correction to the whole down trend from 0.9200, next target is 38.2% retracement of 0.9200 to 0.7603 at 0.8213. For now, further rise is expected as long as 0.7833 support holds, in case of retreat.
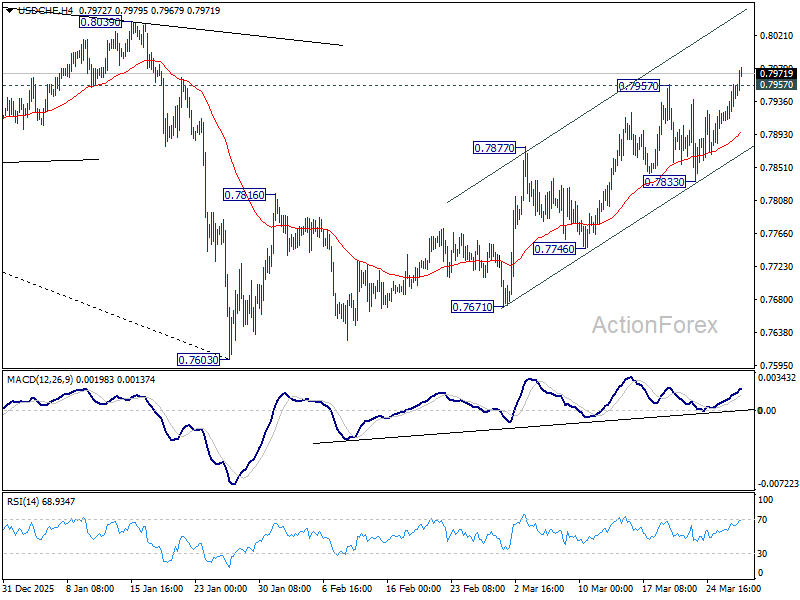
In the bigger picture, a medium term bottom should be in place at 0.7603 on bullish convergence condition in D MACD. Rebound from there is seen as correcting the fall from 0.9200 only. However, decisive break of 55 W EMA (now at 0.8085) will suggest that it's probably correcting the larger scale down trend from 1.0146 (2022 high). On the other hand, rejection by the 55 W EMA will setup down trend resumption to 100% projection of 1.0146 (2022 high) to 0.8332 from 0.9200 at 0.7382 at a later stage.
Dollar Breakout as Markets Front-Run Weekend Escalation Wildcard Risks
Risk-off sentiment has returned to the fore as the US session approaches, with Dollar breaking out against Yen and Swiss Franc while Brent crude rebounds to $108. While US President Donald Trump has extended the Iran strike pause to April 6, markets are increasingly viewing this as a "thin veil" for a tactical realignment rather than true de-escalation.
A key concern is that the “pause” does not cover several major escalation channels. Traders are actively positioning for a high-risk weekend characterized by "Wildcard" threats—specifically unilateral Israeli strikes and Trump's own "Pearl Harbor" obsession with surprise. This front-running suggests a growing belief that the diplomatic window could be scrapped well before the Monday open.
The most immediate risk comes from Israel, which is not bound by the US framework and has signaled intentions to escalate operations. Any strike that impacts high-value infrastructure or strategic assets could quickly invalidate the pause and trigger retaliation from Iran.
Beyond that, the buildup of US ground capabilities suggests a broader strategic shift. Markets are increasingly considering scenarios where the US could move to secure key chokepoints such as the Strait of Hormuz or seize strategic islands if diplomacy fails. While these actions may not occur immediately, the preparation itself raises the probability of a larger conflict.
At the same time, Iran’s response function is evolving. As pressure intensifies, the risk is shifting from controlled proxy actions to more direct and asymmetric strikes, including potential attacks on US military assets in the region. Such a move would likely trigger a rapid escalation, bypassing the current pause framework entirely.
Regional spillover risks are also rising. Interceptions of drones over Saudi Arabia and the UAE, along with warnings issued by Iranian forces, point to an increasingly fragile environment where miscalculations could draw additional players into the conflict. A single incident involving a neutral or regional actor could quickly broaden the scope of the war.
Adding to the uncertainty is the risk tied to strategic unpredictability. Trump’s recent comparisons of his strategy to "the element of surprise" at Pearl Harbor signal that he views diplomatic pauses as tools to keep an enemy off-balance. The risk is that the administration, sensing Iranian stalling, could unilaterally scrap the April 6 deadline this weekend to order a "shock and awe" strike on Iran's power grid. While a tail-risk, it is something that the markets wouldn't ignore.
In currency markets, Dollar is the strongest performer for the week so far, followed by Sterling and Yen. In contrast, growth-sensitive currencies such as the Australian and New Zealand Dollars remain under pressure, while Euro and Canadian Dollar sit in the middle of the pack.
In Europe, at the time of writing, FTSE is down -0.44%. DAX is down -1.43%. CAC is down -0.80%. UK 10-year yield is up 0.103 at 5.019. Germany 10-year yield is up 0.038 at 3.114. Earlier in Asia, Nikkei fell -0.43%. Hong Kong HSI rose 0.38%. China Shanghai SSE rose 0.63%. Singapore Strait Times rose 0.21%. Japan 10-year JGB yield rose 0.106 to 2.380.
UK Retail Sales Slip -0.4% as Discount-Driven Demand Fades
UK retail sales slipped -0.4% in February after a strong January, as earlier discount-driven demand faded. Spending appears to have been pulled forward, leaving softer activity in the latest data. While three-month growth remains positive, the figures highlight uneven consumer momentum and sensitivity to pricing. Read More
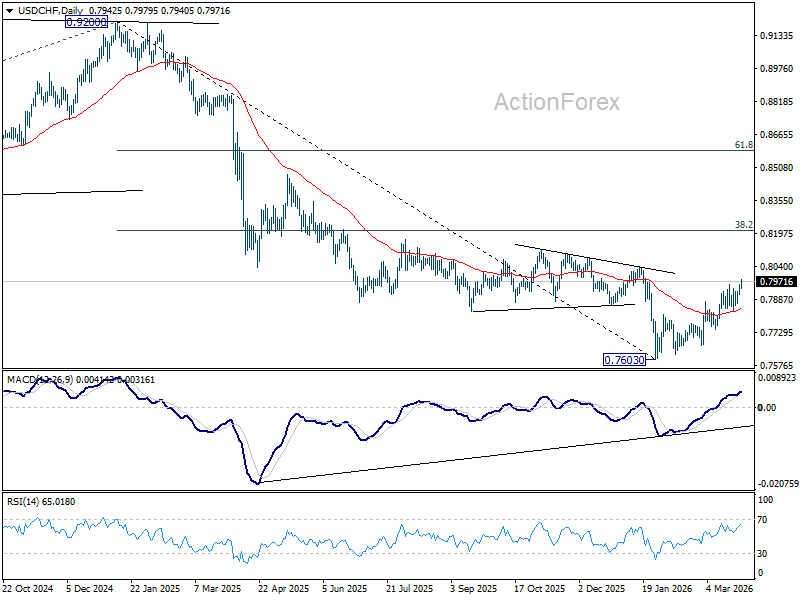
USD/CHF Mid-Day Outlook
Daily Pivots: (S1) 0.7924; (P) 0.7942; (R1) 0.7972; More….
USD/CHF's break of 0.7957 suggests that rebound from 0.7603 is resuming. Intraday bias is now the upside. As a correction to the whole down trend from 0.9200, next target is 38.2% retracement of 0.9200 to 0.7603 at 0.8213. For now, further rise is expected as long as 0.7833 support holds, in case of retreat.
In the bigger picture, a medium term bottom should be in place at 0.7603 on bullish convergence condition in D MACD. Rebound from there is seen as correcting the fall from 0.9200 only. However, decisive break of 55 W EMA (now at 0.8085) will suggest that it's probably correcting the larger scale down trend from 1.0146 (2022 high). On the other hand, rejection by the 55 W EMA will setup down trend resumption to 100% projection of 1.0146 (2022 high) to 0.8332 from 0.9200 at 0.7382 at a later stage.
Chart Alert: WTI Crude Oil Minor Pullback Over, Start of New Bullish Leg for Breakout Above $102.25
Key takeaways
- Pullback complete, bullish structure emerging: WTI corrected 17% from $102.25 to $85.50 but has stabilised above its 20-day moving average, reclaimed $93.70, and is now positioned to retest the $102.25 resistance.
- Fundamentals support upside pressure: Deepening backwardation (-21.74) signals tightening near-term supply amid escalating US–Iran tensions, reinforcing upward pressure on crude prices.
- Breakout levels to watch: A sustained move above $102.25 could trigger a fresh bullish leg toward $111–$124, while a break below $85.50 would invalidate the bullish view and expose downside toward the $81–$73 zone.
The price actions of the West Texas Oil CFD (a proxy of the WTI crude oil futures) have staged the expected minor corrective pullback of 17% from its key $102.25 near-term range resistance after a retest on Monday, 23 March 2026, at the start of the London session to hit an intraday low of $85.50 at mid-London session on the same day due US President Trump’s “optimistic claims” that US and Iran are in the process of negotiating an immediate ceasefire deal.
Thereafter, the West Texas Oil CFD traded sideways above its 20-day moving average as Iran rejected the US’s ceasefire proposal and continued to strike the Gulf states’ key installations as the US-Iran war entered its 28th day.
In addition, conflicting messages are being sent out from the US White House Administration. US President Trump has extended by 10 days his pledge to refrain from attacks on Iranian energy-producing sites and added that the “negotiation talks are going very well”.
On the other hand, the Wall Street Journal has reported that the Pentagon is considering sending additional troops, as many as 10,000, to the Middle East, on top of the already deployed 2,000 soldiers from the 82nd Airborne Division. Hence, increasing the odds of a US ground invasion into Iranian soil as soon as this weekend.
Right now, several technical factors are suggesting the potential start of a new bullish up move sequence for West Texas crude oil at this juncture.
WTI calendar spread remains in negative territory
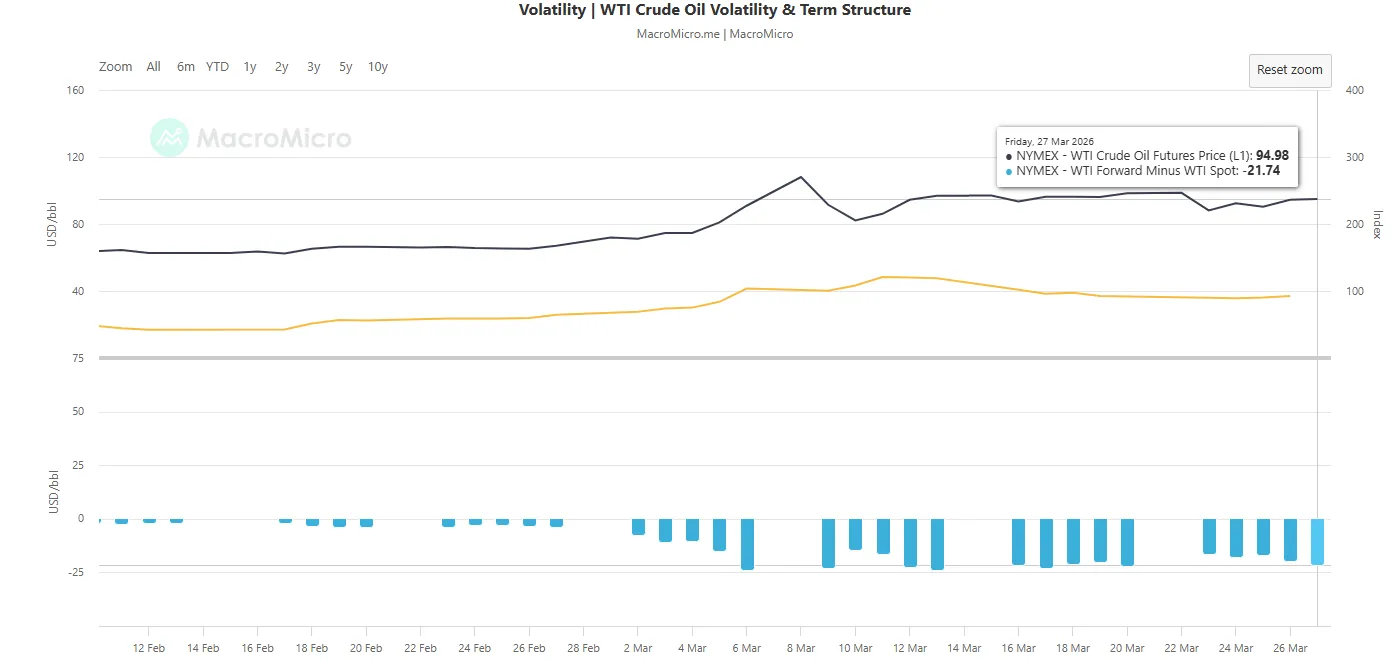
Fig. 1: WTI crude oil term structure (12-month forward minus spot rate) as of 27 Mar 2026 (Source: MacroMicro)
The WTI crude oil calendar spread, defined as the difference between the 12-month forward price and the spot price, serves as a gauge of the market’s structural conditions.
A positive spread (contango) reflects a typical environment where futures trade at a premium to spot, factoring in storage and transportation costs.
In contrast, a negative spread (backwardation) signals near-term supply tightness, with strong prompt demand pushing spot prices above futures.
At the time of writing, the spread has deepened into backwardation at -21.74, marking its most negative level since 6 March 2026 (-23.92) on the onset of the ongoing US-Iran war (see Fig. 1).
Hence, near-term prices of WTI crude oil are likely to face further upside pressure.
Let’s switch our attention to the potential short-term trajectory (1 to 3 days) of WTI crude oil.
WTI Crude Oil – Imminent potential bullish breakout above $102.25 minor range top
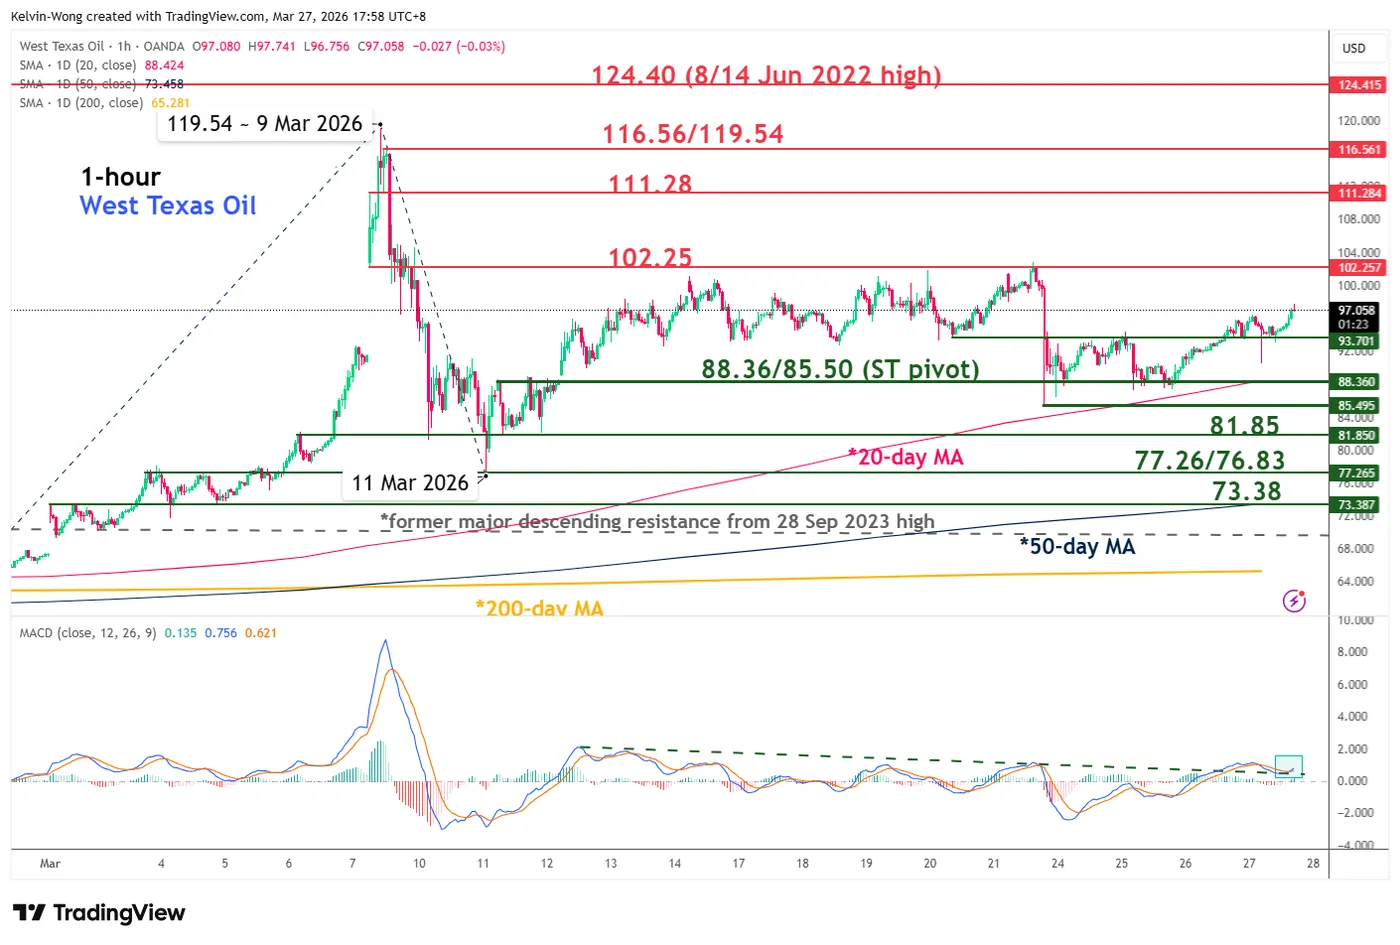
Fig. 2: West Texas Oil CFD minor trend as of 27 Mar 2026 (Source: TradingView)
The minor price structure of the West Texas Oil CFD (a proxy for WTI crude oil futures) has turned more constructive over the past four sessions, supported by its ability to hold above a rising 20-day moving average.
On Thursday, 26 March 2026, it has cleared above its $93.70 near-term resistance and is en route to retest its $102.25 minor range resistance in place since 16 March 2026.
Watch the $88.36/85.50 key short-term pivotal support to maintain the current bullish momentum, and a clearance above $102.25 increases the odds of a fresh bullish impulsive up move sequence to seek out the next intermediate resistances at $111.28, $116.56/119.54, and $124.40 (see Fig. 2).
However, a break and an hourly close below $85.50 invalidates the bullish scenario for an extension of the minor corrective decline to expose the next intermediate supports at $81.85, $77.26/76.83, and $73.38 (also the 50-day moving average).
Key elements to support the bullish bias on WTI crude oil
- Price actions remain above its rising 20-day and 50-day moving averages, which indicates that the medium-term uptrend phase remains intact.
- The hourly MACD trend indicator has just flashed out a bullish crossover condition above its centreline. This latest positive observation has occurred above its prior bullish breakout above its former key descending resistance on Thursday, 26 March 2026. An indication of a change of trend in the West Texas Oil CFD, from sideways to a minor bullish trend.
ECB Rate Hikes May Backfire on Europe
- Japan is exploring options for intervening in the oil market.
- The OECD considers the risks of stagflation in the eurozone to be higher than in the US.
Christine Lagarde’s statement that the ECB is ready to raise interest rates should, in theory, support the euro. However, a tightening of monetary policy could shock the eurozone. The surge in energy prices raises short-term inflation risks but deteriorates the medium-term growth outlook, potentially forcing the ECB to shift towards policy easing.
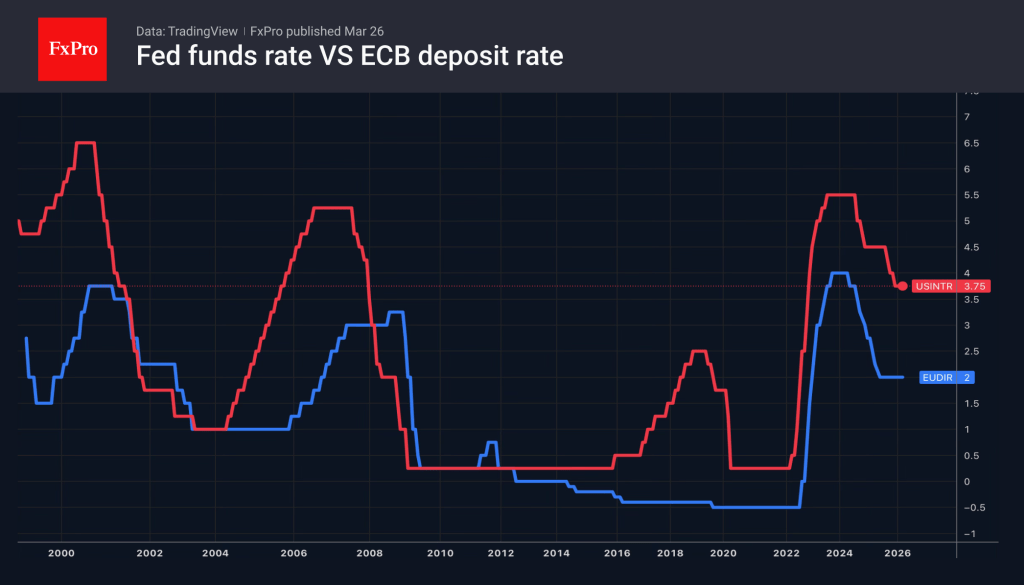
The OECD sees a higher risk of stagflation in the eurozone than in the US. The Paris-based organisation has revised its GDP forecast for the United States this year upwards from 1.7% to 2% and lowered its forecast for the eurozone from 1.2% to 0.8%. Inflation estimates have been increased by 1.2 percentage points and 0.7 percentage points, respectively. They also suggest that the market’s expectations of 2-3 ECB rate hikes this year are overstated, whilst investors are justified in expecting more from the Fed than merely pausing the rate-cut cycle.
According to Federal Reserve Vice-Chair Philip Jefferson, the duration of the conflict in the Middle East and its impact on energy prices will be decisive for the central bank’s future decisions. His FOMC colleague, Lisa Cook, believes that the war in Iran and the associated oil market shock make fighting inflation the Fed’s top priority, requiring rates to remain on hold for longer.
Meanwhile, markets have raised the probability of a Fed rate hike in 2026 from 20% to 45%, signalling confidence in the US economy’s resilience. Alongside the OECD’s revised forecasts and geopolitical tensions in the Middle East, this is contributing to downward pressure on EURUSD.
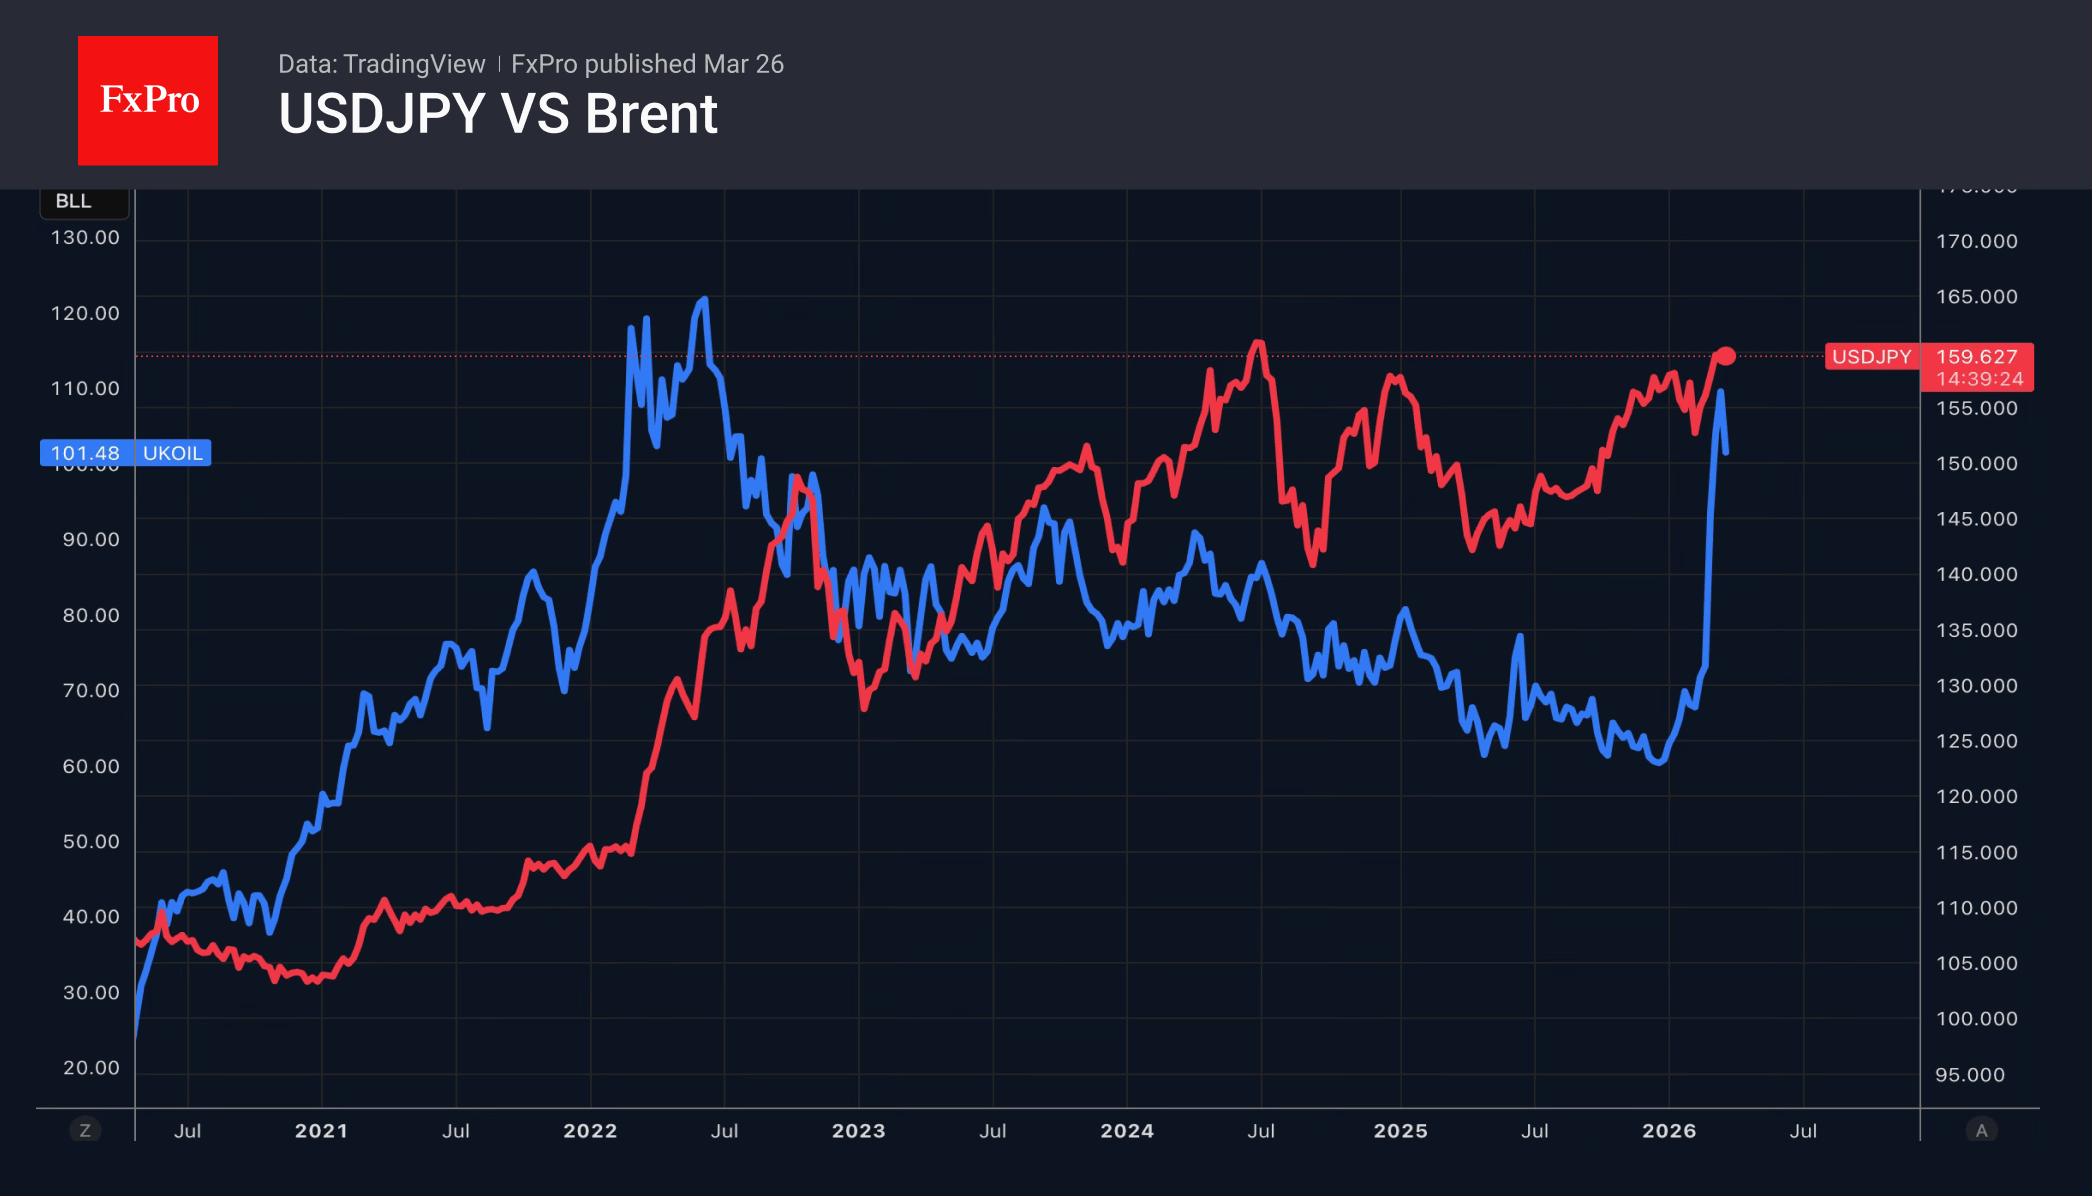
The approach of USDJPY to the psychologically significant 160 level is prompting the Japanese government to intensify its verbal interventions. According to Finance Minister Satsuki Katayama, the time has come for bold action. In 2024, Tokyo intervened in the forex market near current levels. However, this time, the US dollar’s strength may act as a limiting factor.
The rise in the USD is supported by the surge in Brent. Rumours are circulating that Japan has decided to address the root cause of the USDJPY rally. Using $1.4 trillion in reserves to intervene in the oil futures market could help ease pressure on both the economy and financial markets by lowering prices.
Crypto Has Pulled Back, But Appears Stronger Than Stocks
Market Overview
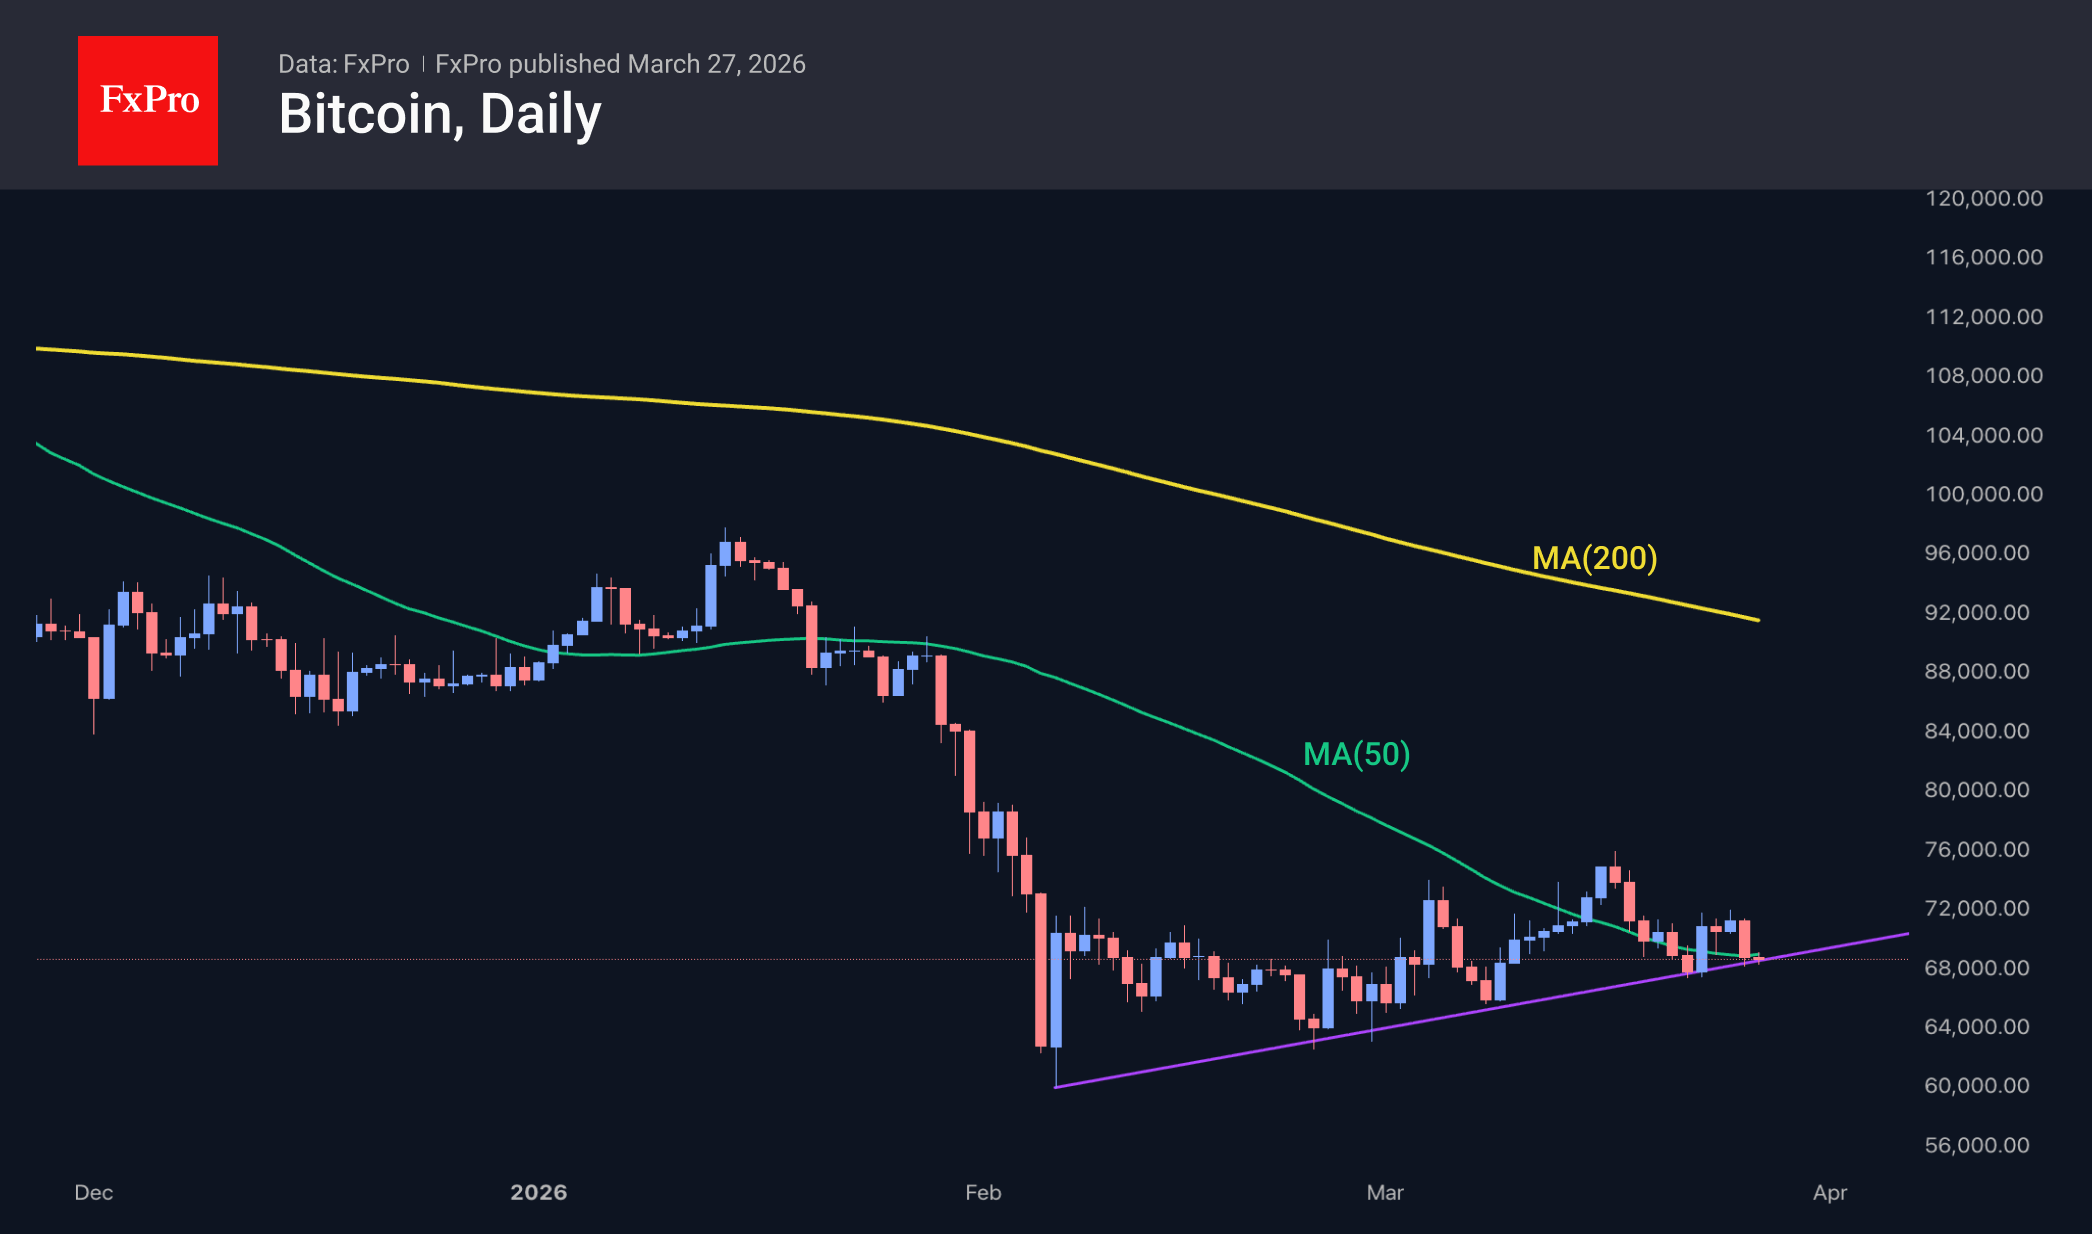
The crypto market’s capitalisation fell by 3.4% over the past 24 hours to $2.36 trillion, remaining close to the uptrend line. The downward momentum was once again driven by stock indices, which returned to their lows at the start of the week. However, whilst the Nasdaq 100 has shown a steady downward trend on weekly charts since late January, cryptocurrencies have been forming a sequence of higher local lows since early February, when the market touched the 200-week moving average – a key long-term trend line.
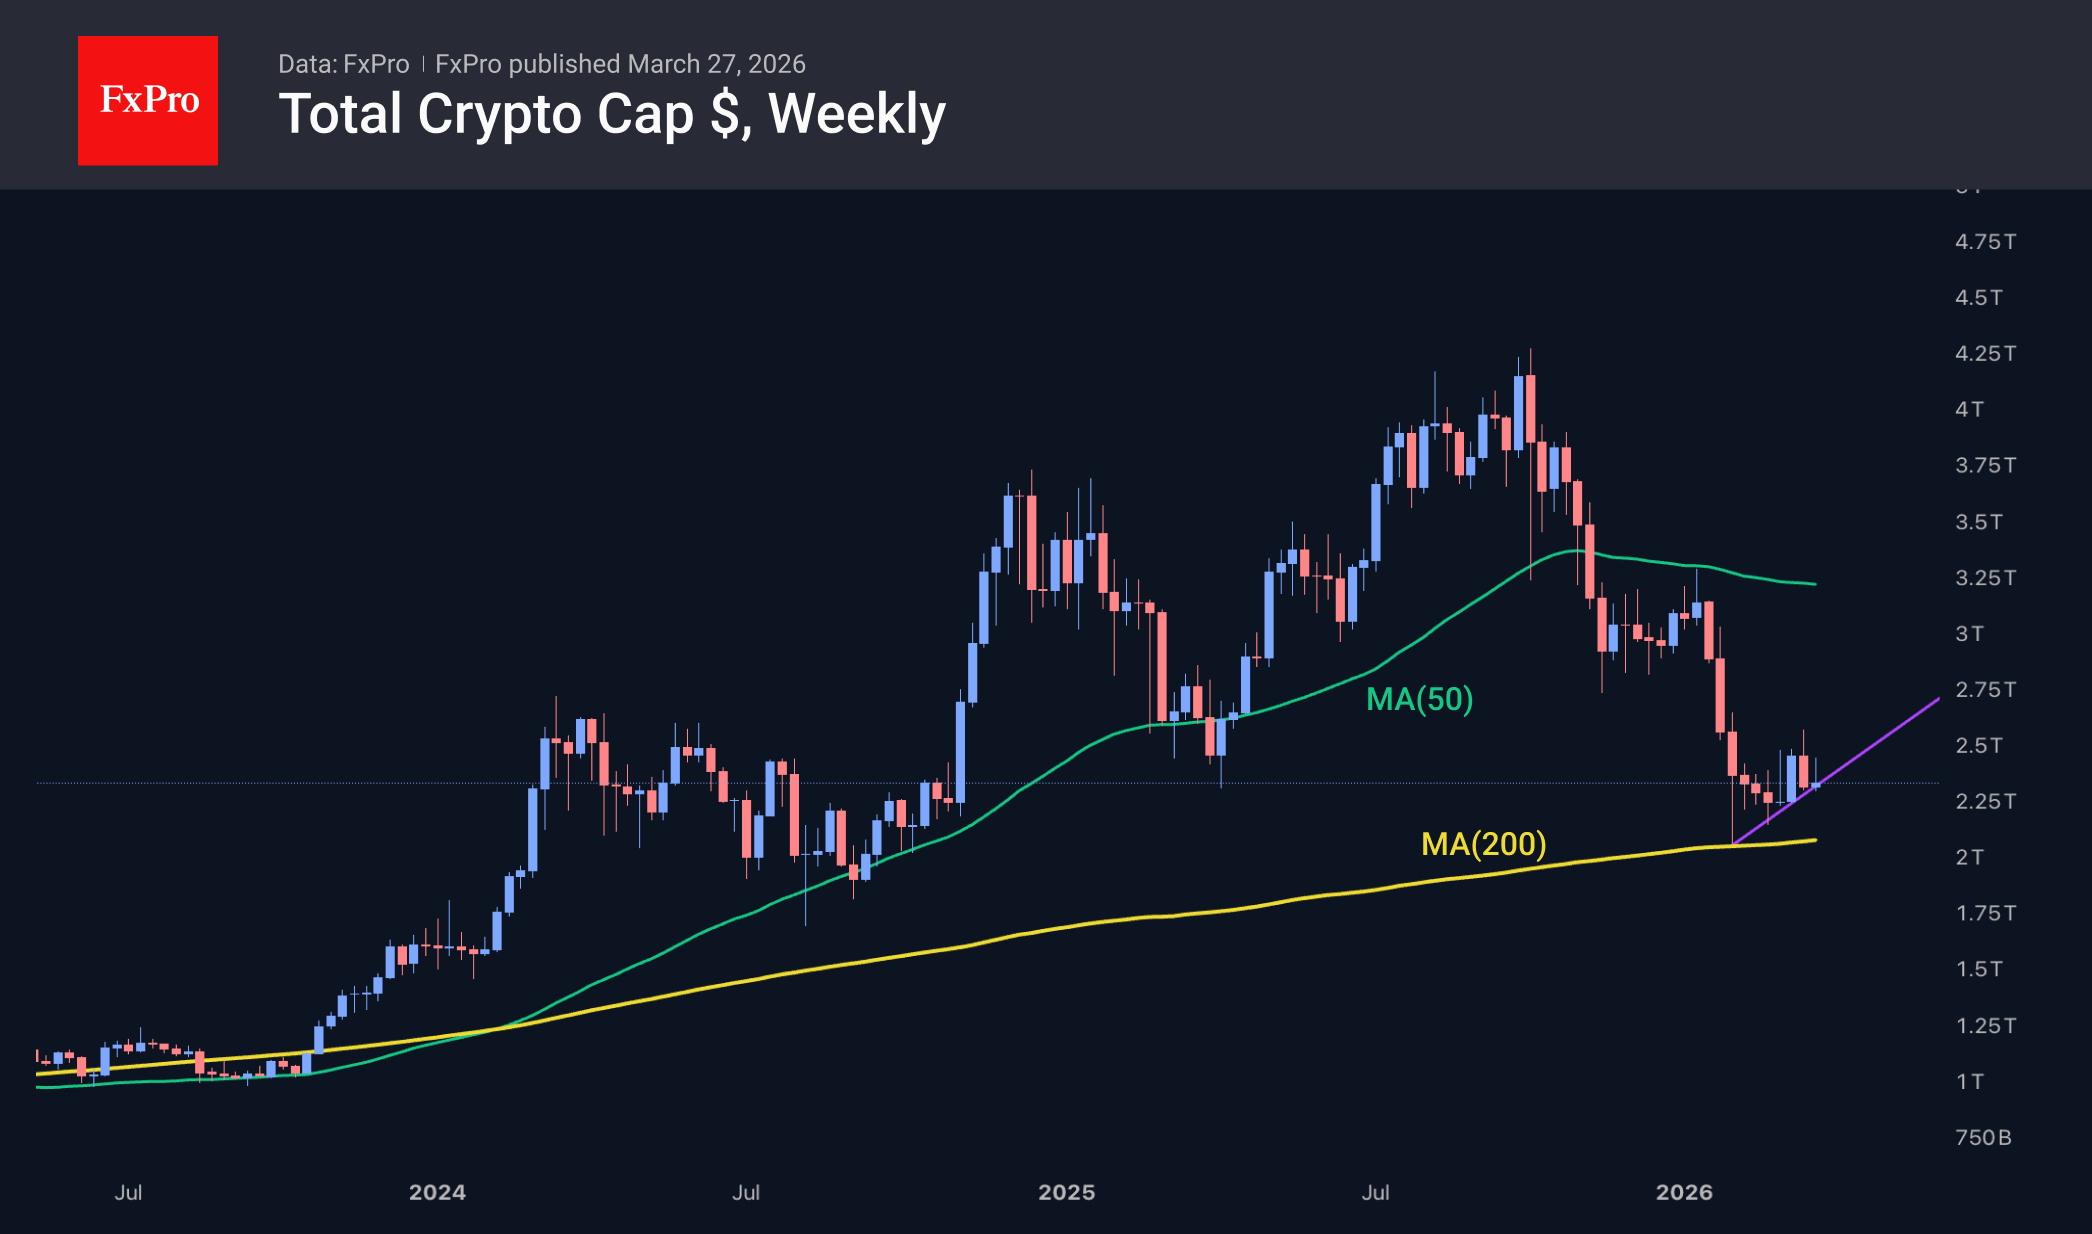
Bitcoin has fallen below $69K, testing the strength of the 50-day MA and the support of the upward trend of the last two months. The nervous mood in the financial markets makes cryptocurrencies, and Bitcoin in particular, vulnerable in the event of a large-scale sell-off. For BTC, the 200-week MA has historically been the most important long-term support level. It currently sits near $60K. However, it is worth remembering that in 2022–2023, the price fell more than 30% below this line before finding structural support for many weeks.
News Background
Bitcoin miner MARA has sold 15,133 BTC for $1.1 billion since the start of the month. The company intends to use the proceeds to buy back its own bonds. The miner’s remaining reserves are estimated at 38,689 BTC.
The cost of Bitcoin mining for public companies has reached $80K and, for some miners, exceeded $100K, according to CoinShares. The fourth quarter of 2025 has been the most challenging for Bitcoin miners since the last halving. The US (38%), Russia (17%), and China (12%) continue to dominate global Bitcoin mining, collectively accounting for around 68% of the world’s hash rate.
Adam Livingston, an analyst and author of the book ‘The Great Harvest: AI, Labor, and the Bitcoin Lifeline’, believes the risk of a Bitcoin crash, as seen in 2022, is minimal due to the market’s more mature structure. According to his calculations, BTC volatility has been steadily declining over the past 11 years.
US investment firm Franklin Templeton, in partnership with Ondo Finance, will launch tokenised versions of its ETFs, accessible directly via crypto wallets.
Gold Steadies After Declines: Strait of Hormuz Back in Focus
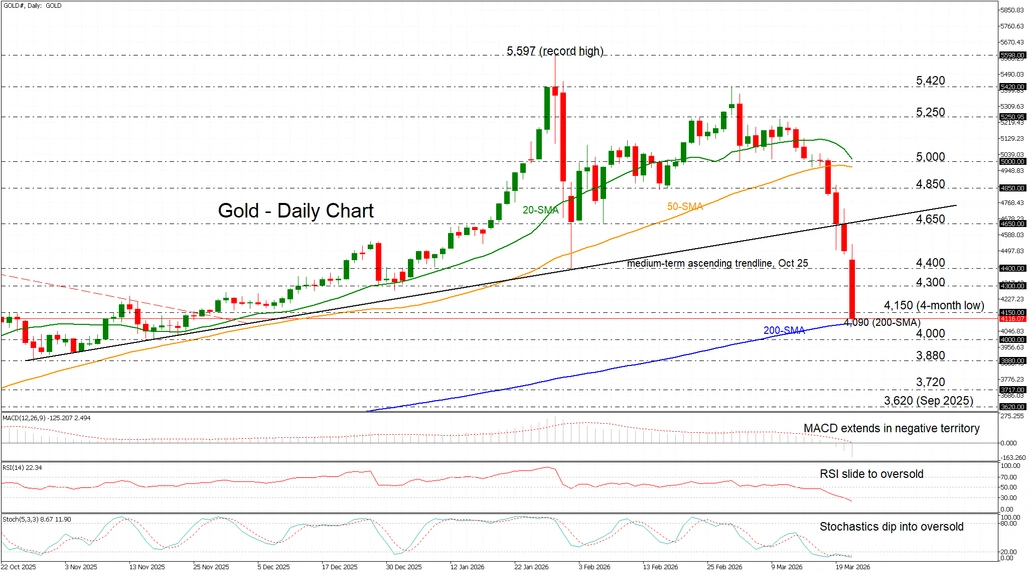
Gold prices stabilised near 4,400 USD per ounce on Friday following a sharp decline the previous day. The market found support from Donald Trump's decision to postpone the deadline for reaching a deal with Iran to end the conflict.
The US has pledged to hold off on striking Iran's energy infrastructure until 6 April, offering some relief to market tensions. Trump also stated that Iran had allowed 10 oil tankers to pass through the Strait of Hormuz as a gesture towards the US.
Meanwhile, Tehran confirmed it had rejected the 15-point plan proposed by the US and put forward its own conditions, including recognition of its control over the Strait of Hormuz.
Gold lost nearly 3% the previous day amid doubts over the prospects for an imminent truce. Overall, the metal remains under pressure, with rising energy prices continuing to heighten inflationary risks and reinforce expectations of tighter policy from major central banks.
Technical Analysis
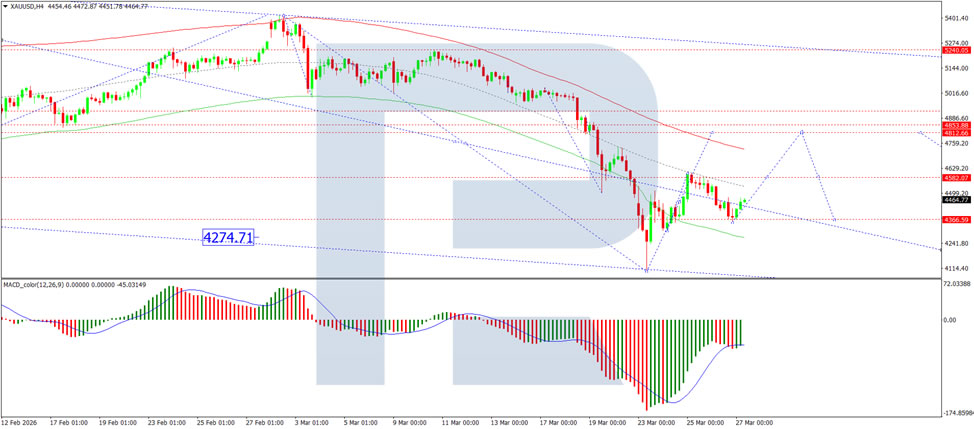
On the H4 XAU/USD chart, the market is forming a consolidation range around 4,353 USD. An upside breakout would pave the way for a correction to 4,820 USD, while a downside breakout could extend the downward wave to 4,272 USD. The MACD indicator confirms the current momentum, with its signal line currently below the centre line but pointing firmly upwards.
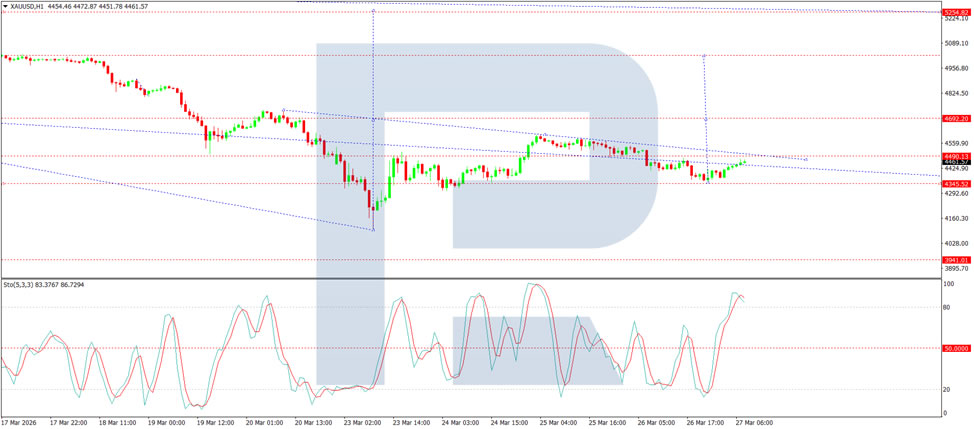
On the H1 chart, the market broke above 4,414 USD and completed a wave to 4,474 USD. Looking ahead, a corrective move back to 4,414 USD is likely, followed by a renewed advance towards 4,690 USD. The Stochastic oscillator supports this scenario, with its signal line remaining above 80 and showing continued upward pressure.
Conclusion
Gold has found a temporary respite following the US decision to delay strikes on Iranian energy infrastructure, easing immediate geopolitical tensions. However, Tehran's rejection of the US proposal and insistence on maintaining control over the Strait of Hormuz underscores how fragile the situation is. While the postponement offers a short-term reprieve, the underlying drivers – elevated energy prices, persistent inflation risks, and expectations of tighter central bank policies – remain. With technical indicators pointing to a potential corrective bounce, gold's broader trajectory will likely hinge on whether diplomatic efforts gain traction or tensions reignite after the 6 April deadline.
GBP/JPY Consolidates Within Ascending Trend Channel Near 212.00
- GBP/JPY’s month‑long sustained upside meets strong resistance.
- Momentum signals reflect signs of bullish exhaustion.
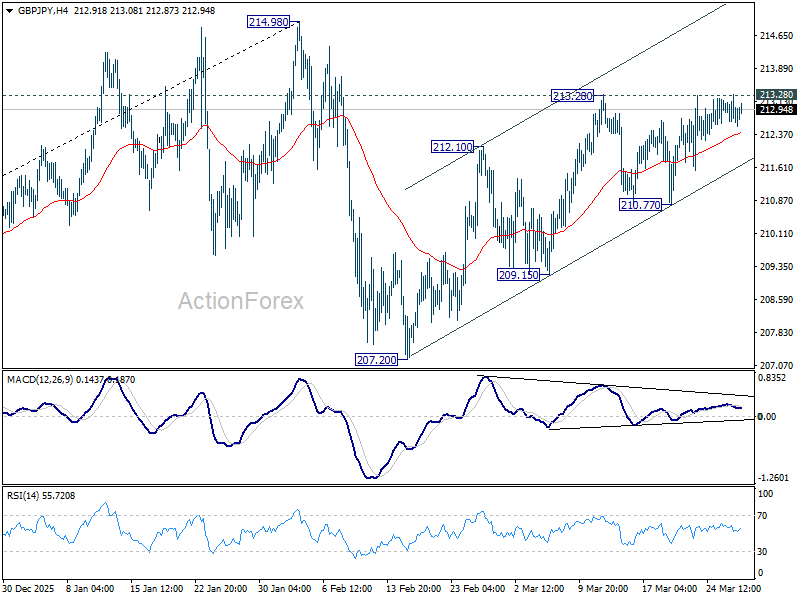
GBP/JPY’s steady ascent within a month‑long upward‑sloping channel is showing signs of stabilisation, with price action repeatedly meeting strong resistance near the upper Bollinger band at 213.30.
The broader bias remains bullish as the pair continues to trade above the long‑term rising support trendline drawn from the April lows. However, the failure to breach the strong resistance area tracking monthly‑highs, combined with softening technical indicators – with the MACD, RSI, and stochastics flattening in positive territory –strengthens the case for a potential bearish correction.
Such a correction would likely materialise if price action breaks below the 20‑ and 50‑day simple moving averages (SMAs) near 212.00-211.20 and breaches the trendline, opening the way toward weekly lows near 210.75. A break there could accelerate declines toward the monthly low near 209.15.
Conversely, a decisive move above 213.30 could target the February highs near 214.20, then 215.00, and ultimately the multi‑year peak near 215.78, tracking the July 20, 2008 high.
All in all, GBP/JPY remains bullish but has so far failed to extend gains back toward the multi‑year highs at the year‑to‑date peak of 215.00, with repeated attempts hitting a wall. The momentum indicators show neither buyers nor sellers firmly in control, suggesting consolidation for now – a backdrop that keeps downside risks contained.
BTC/USD Analysis: Bitcoin Tests Key Support
Today, BTC/USD is trading slightly below the psychological $70k level. Assessing its price action since the panic on 5 February, it is reasonable to suggest that the market is showing signs of range-bound behaviour: sellers tend to emerge near $75k, while buyers become active around $65k.
This balance between supply and demand, where neither side has been able to take control for several weeks, may feel either tiring or calming; however, the price chart suggests there are reasons for concern.
Technical Analysis of BTC/USD
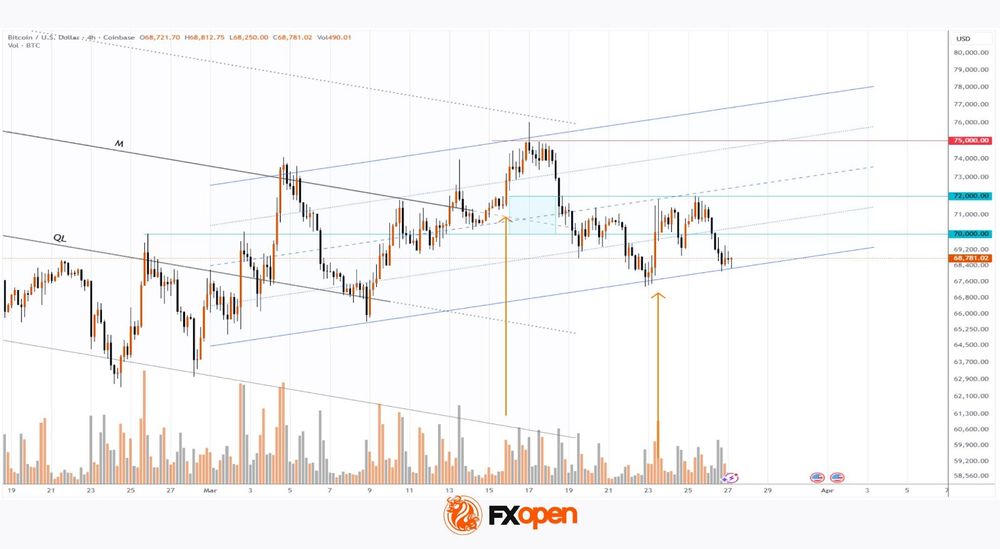
On 18 March, analysing Bitcoin’s price action within a broad descending channel, we:
- → noted signs of buying pressure, which led to the formation of an intermediate ascending channel (shown in blue);
- → suggested that buyers were pushing sellers out of the $70–72k zone, which could act as support.
However, the price soon reversed lower from the psychological $75k level, and the highlighted zone failed to provide support. Bulls retreated and showed an inability to defend the gains marked by the first arrow.
A similar lack of strength was observed later:
- → As indicated by the second arrow, on Monday, 23 March, Bitcoin surged sharply following statements by Donald Trump regarding negotiations with Iran.
- → However, the previously mentioned $72k level acted as resistance, and yesterday’s decline once again reflects a retreat by buyers.
As a result, there are grounds to conclude that bulls are struggling to sustain momentum, increasing the risk of a bearish breakout below the lower boundary of the blue channel. This level is particularly important because:
- → the blue channel may be interpreted as a bearish flag pattern;
- → a breakdown of this pattern could pave the way for a continuation of the prevailing downtrend, which has been in place since autumn 2025.
FXOpen offers the world's most popular cryptocurrency CFDs*, including Bitcoin and Ethereum. Floating spreads, 1:2 leverage — at your service (additional fees may apply). Open your trading account now or learn more about crypto CFD trading with FXOpen.
*Important: At FXOpen UK, Cryptocurrency trading via CFDs is only available to our Professional clients. They are not available for trading by Retail clients. To find out more information about how this may affect you, please get in touch with our team.
This article represents the opinion of the Companies operating under the FXOpen brand only. It is not to be construed as an offer, solicitation, or recommendation with respect to products and services provided by the Companies operating under the FXOpen brand, nor is it to be considered financial advice.
GBP/JPY Daily Outlook
Daily Pivots: (S1) 212.70; (P) 213.01; (R1) 213.31; More...
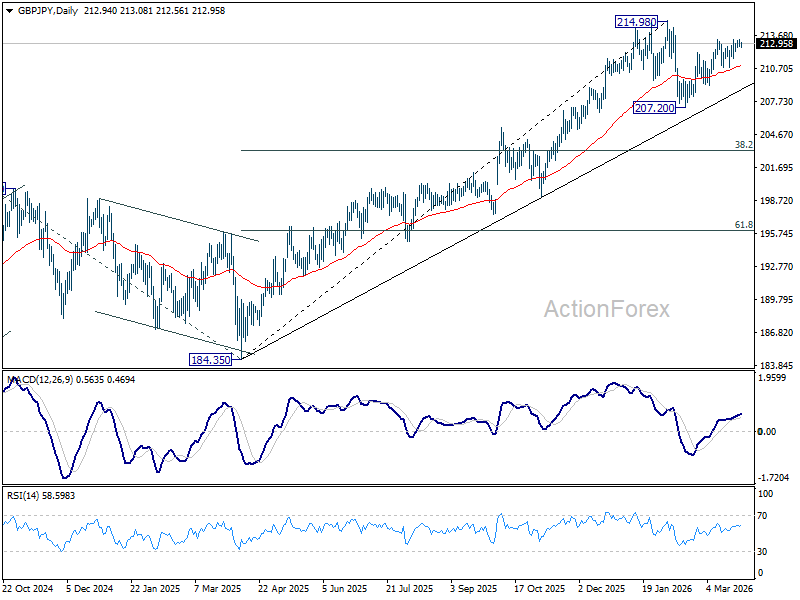
Intraday bias in GBP/JPY is turned neutral first with current retreat. On the upside, firm break of 213.28 resistance will resume the rally from 207.20 and target a retest on 214.98 high. However, break of 210.77 will turn bias back to the downside for 209.15 support.
In the bigger picture, up trend from 123.94 (2020 low) is still in progress. Firm break of 214.98 will target 61.8% projection of 148.93 (2022 low) to 208.09 (2024 high) from 184.35 at 220.90. This will remain the favored case as long as 55 W EMA (now at 203.13) holds, even in case of another deep pullback.
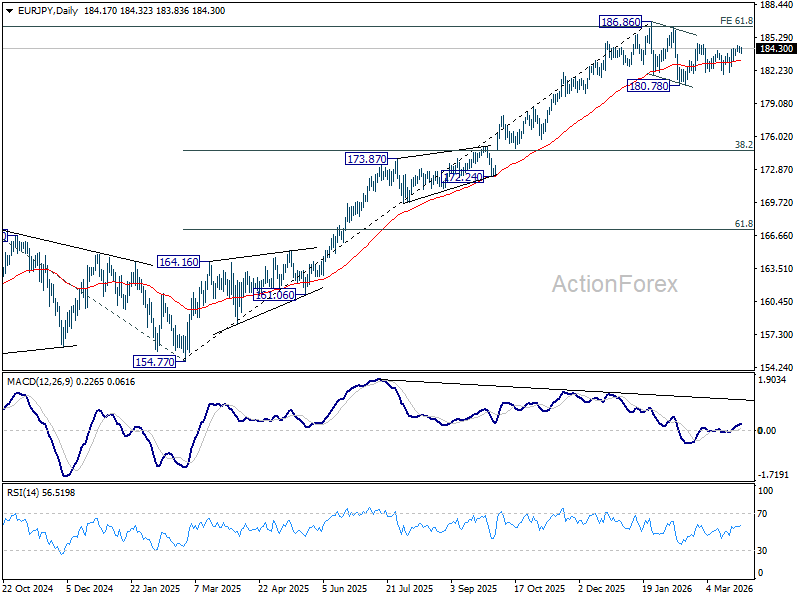
EUR/JPY Daily Outlook
Daily Pivots: (S1) 183.96; (P) 184.22; (R1) 184.49; More...
EUR/JPY retreated ahead of 184.75 resistance and intraday bias is turned neutral first. On the upside, firm break of 184.75 resistance will resume the whole rise from 180.78 and target a retest on 186.86 high. On the downside, break of 182.02 will bring deeper fall back to 180.78 support.
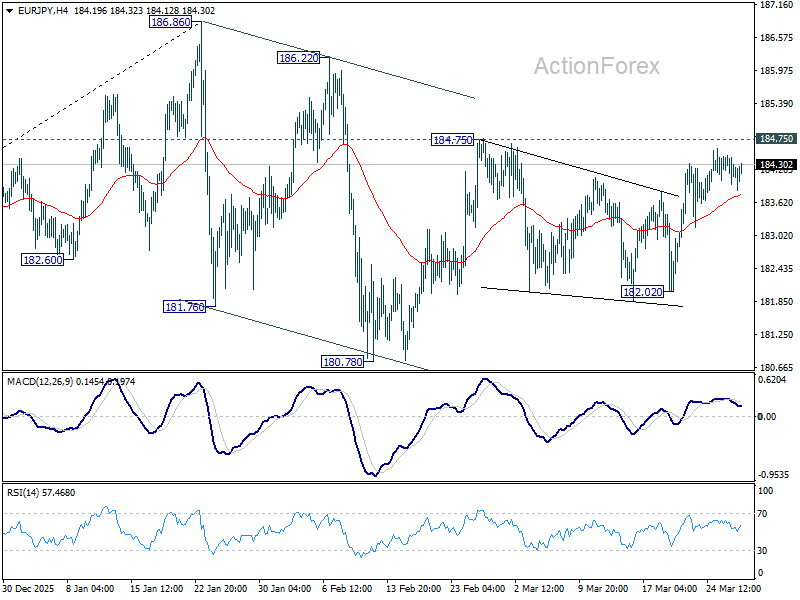
In the bigger picture, a medium term top could be in place at 186.86 and some more consolidations would be seen. Nevertheless, as long as 55 W EMA (now at 175.61) holds, the larger up trend from 114.42 (2020 low) remains intact. Firm break of 186.86 will pave the way to 78.6% projection of 124.37 (2022 low) to 175.41 (2025 high) from 154.77 at 194.88 next.