Sample Category Title
Dollar Extends Gains as Fading Ceasefire Prospects Fuel Risk Aversion
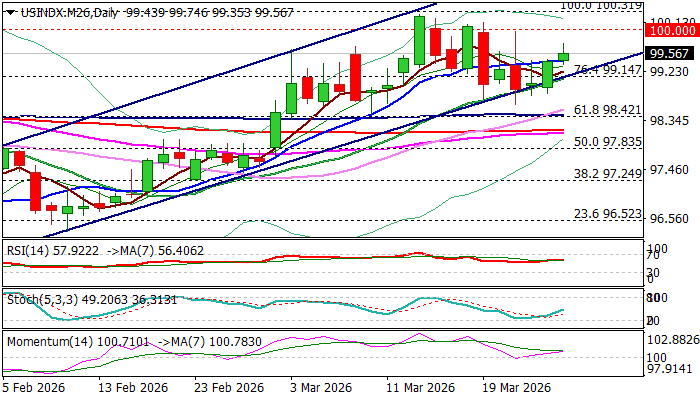
The dollar kept firm tone and rose further against its major counterparts on Thursday, following rise in oil prices (Brent bounces back above $100) that sparked fresh wave of risk aversion and fueled demand for safe-haven greenback.
Fading ceasefire hopes after initial euphoria that pushed the dollar index down over 10% on Monday, revived bulls and kept the index within broader bull-channel after pullback from new 2026 high at $100.26 (on failure to hold gains above $100 breakpoint) was repeatedly contained by rising channel support line.
Daily studies in full bullish configuration (multiple MA bull-crosses / strengthening bullish momentum / today’s rally spiked above Fibo 61.8% retracement of $100.26/$98.63 bear-leg) contribute to positive near term outlook.
Bulls look for fresh attack at psychological $100 barrier (following failures in July / November 2025 and March 2026) with sustained break higher to confirm formation of larger base (weekly & monthly chart) as well as signal break above multi-month range ($95.30/$100.30) and expose initial targets at $100.95 (Fibo 38.2% of $110.00/$95.35) and $101.80 (May 2025 top).
Near-term bias is expected to remain with bulls while the price action holds above strong $99 support zone (bull-channel support line / weekly Ichimoku cloud base).
Res: 100.00; 100.32; 100.94; 101.49
Sup: 99.43; 99.00; 98.63; 98.42
GBP/USD Chart Alert: Bull Flag Pattern in Play Ahead of Retail Sales Data
- GBP/USD is under pressure due to cautious market sentiment, USD strength stemming from Middle East ceasefire strains, and uncertainty following President Trump's delay of Iran's energy plant destruction.
- Technical analysis reveals a bull flag pattern on the H1 chart, suggesting a potential 100-pip rally
- If the price fails to clear the 200 SMA and breaks the 1.3320 support, a move toward the YTD low of 1.3223 is possible.
GBP/USD edged its way lower on Thursday as hopes of a ceasefire in the Middle East came under strain. Mixed reports and comments from both sides saw markets adopt a cautious approach with the USD gaining a bid as a result.
Late in the day President Trump announced the delay of Iran's energy plant destruction by ten days, until April 6 at 08:00 PM Eastern Time. President Trump emphasized that talks between Washington and Tehran are going "very well" and he decided to pause at the request of the Iranian Government. Trump’s previous deadline was Friday, with the question now being whether this is genuine or another ruse ahead of the weekend?
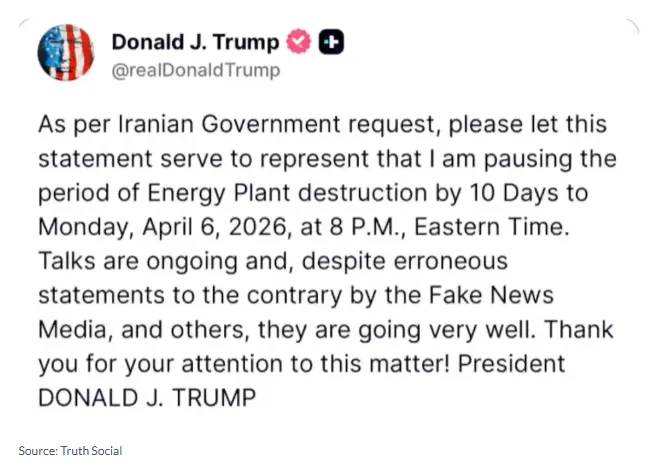
Source: TruthSocial
Markets may remain concerned that the US could mount a ‘sneak attack’ over the weekend with defensive positioning and haven demand likely to catch a bid as a result. Such a scenario could weigh on GBP/USD.
What do the technicals say?
Looking at the technical picture and on the H1 chart below GBP/USD has edged its way lower since printing a fresh high around 1.34800 on March 23.
There is a bull flag pattern in play on the H1 chart with a breakout leading to a potential 100-pip rally to the upside.
Such a move does face challenges though, as price is currently trading near 1.3333, sitting just below the 200-period Simple Moving Average (SMA). There is also the 100 SMA (Blue), which is currently above the 200 SMA (Black) at around the 1.3372 handle.
Both of these MAs will need to be cleared first if a rally higher and breakout of the bull flag pattern is to materialize.
If the price remains below the 200 SMA (Black line) and breaks the 1.3320 support, expect a move toward the YTD low of 1.3223.
GBP/USD Daily Chart, March 26, 2026
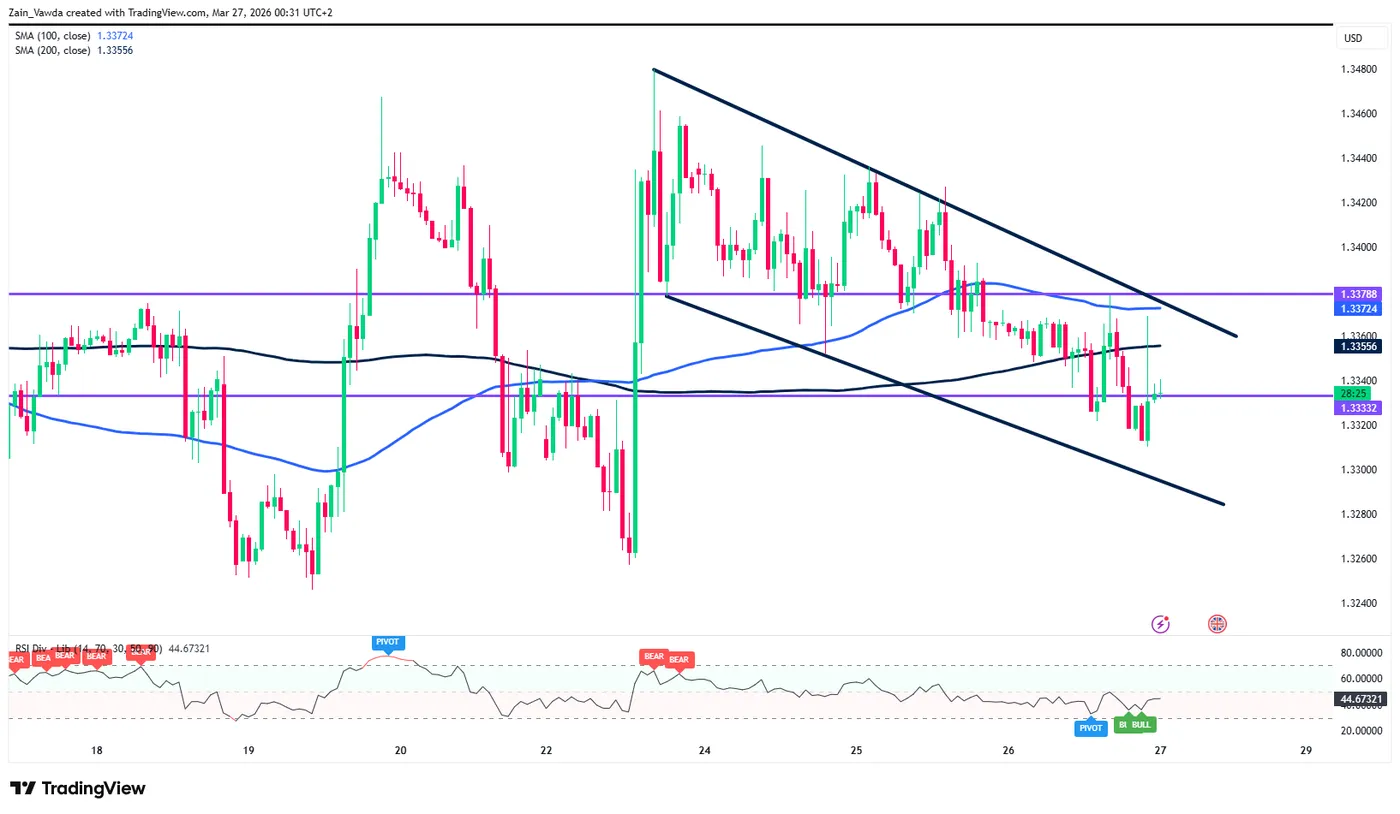
Source: TradingView
UK retail sales to serve as a catalyst?
Early on Friday UK retail sales data is due in what is otherwise a rather quiet day on the economic calendar front. Market consensus is for a print -0.8% MoM print with the YoY print 2.1%.
A better than expected figure may provide a temporary bounce for GBP/USD but is unlikely to inspire a sustained break of the bull flag pattern. Any gains may prove temporary without a material change to overall sentiment which continues to support the greenback.
Too Soon for a Crypto Bounce – Bitcoin (BTC) & Ethereum (ETH) Outlook
It is a year of pump-fakes for all asset classes, and Cryptocurrencies could not sustain the pressure.
Just last week, one could have imagined that Cryptos were isolated from the anxiety dampening global assets – but it was too soon to assume that things were going to be so simple.
Markets are intercorrelated, and depending on where they stand on the risk spectrum, assets can react differently to pessimistic events.
And the bearish turn that took over Markets since the rise of inflationary fears has swept virtually everything on the risk spectrum, from safe havens (as seen in Bonds and Metals) to riskier Equities and Cryptocurrency Markets.
When the common denominator, the US Dollar, shines, everything hurts – With Crude and general energy prices increasingly pressuring all sides of the global economy, it is difficult to find a sustainable hedge.
While Cryptos offer diversification from traditional asset movements, they are also highly sensitive to the gravity of risk aversion – Bitcoin attempted to push above its $75,000 major psychological level shortly after the 20 million BTC issuance, but also dragged the entire asset class down when it failed to form a breakout above.
The issue with today's session, particularly, is that selloffs are gripping higher-beta assets even harder, as seen in the Nasdaq's 2% plunge, and altcoins just can't resist.
Uncertainty should drag into at least tomorrow and, most probably, also towards the weekend.
At least, Crypto markets aren't closed over the weekend, so if the Trump Administration really attempts to end the war, they will be the first to react.
The harder part, however, is that weekend moves, if anything happens during that time, tend to see the largest corrections.
Current Session in Cryptos – March 26, 2026 (14:30). Source: FInviz
As traders brace for uncertain days ahead, let's dive right into the intraday Charts with technical levels for Bitcoin (BTC) and Ethereum (ETH) – Are there interesting spots to trade Cryptos in the event of volatility spikes over the coming days?
Let's discover this now.
Bitcoin (BTC) 4H Chart and Technical Levels
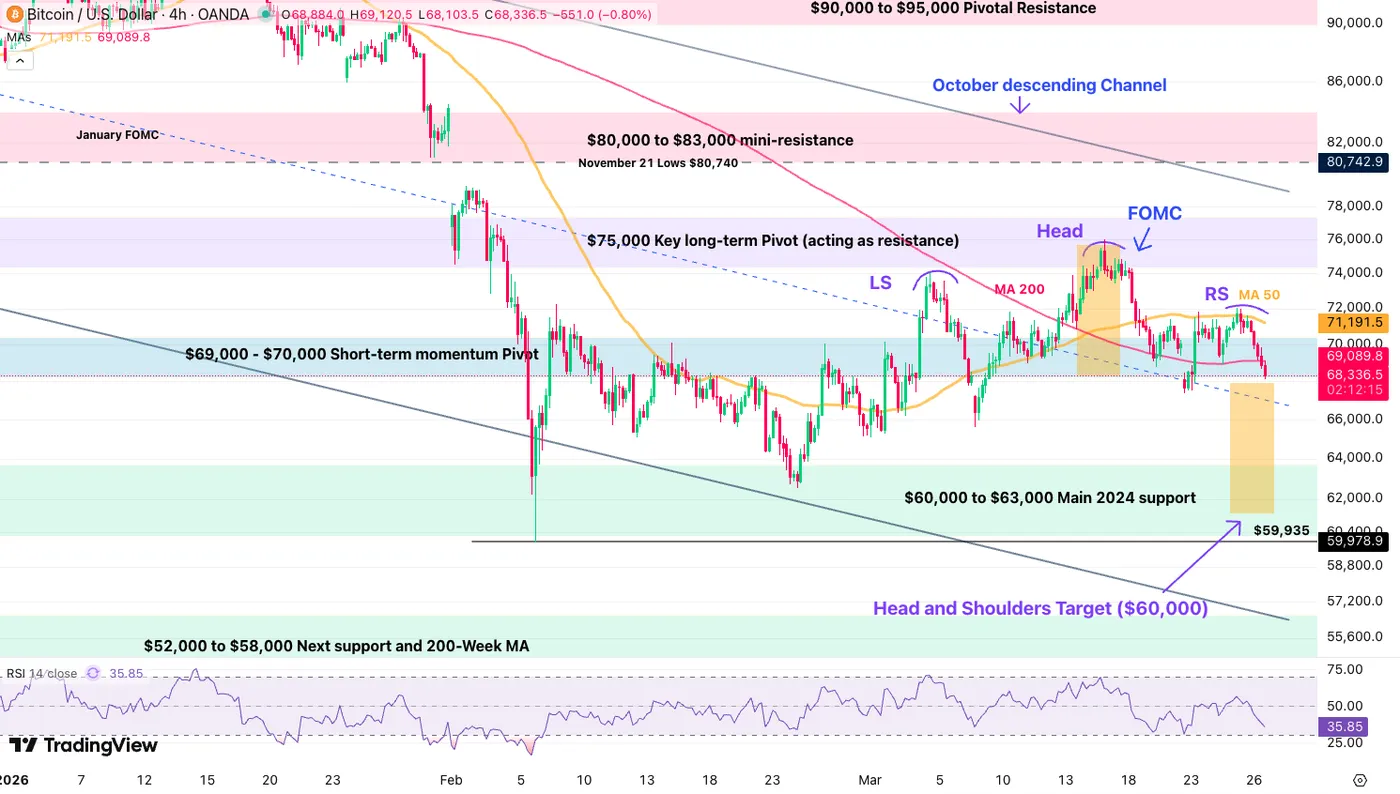
Bitcoin (BTC) 4H Chart, March 26, 2026 – Source: TradingView
After failing to hold above the quintessential $75,000 milestone, pressured by a heavier FOMC, Bitcoin is now forming a clear Head and Shoulders (H&S) pattern.
There is still a possibility that better news prevent the pattern to unfold, but the price action is not on the Bull side for now – At least, it may allow to buy-some dips.
Reactions when we get there will be necessary to estimate if this is indeed a good opportunity, but a return to $60,000 - $61,000 (H&S target), would mark a triple bottom and potentially provide another opportunity to buy a dip.
Keep in mind that a longer-term H&S pointed towards $55,000, so make sure to stagger entries in the event of wider corrections.
Levels of interest for BTC trading:
Support Levels:
- $70,000 Short-term momentum Pivot (50 and 200-4H MA)
- $60,000 to $63,000 Main 2024 support (H&S Target ~$61,500)
- $59,935 February Lows
- $52,000 to $58,000 Next support and 200-Week MA ($55,000 Mid-point)
- $40,000 Mid-2024 breakout support
Resistance Levels:
- $70,000 Short-term momentum Pivot (50 and 200-4H MA)
- March Highs $76,003 (Pre-FOMC highs)
- $75,000 Key long-term Pivot (acting as resistance)
- $80,000 to $83,000 mini-resistance (50-Day MA)
- $90,000 to $95,000 Pivotal Resistance
- Current ATH Resistance $124,000 to $126,000
Ethereum (ETH) 4H Chart and Technical Levels
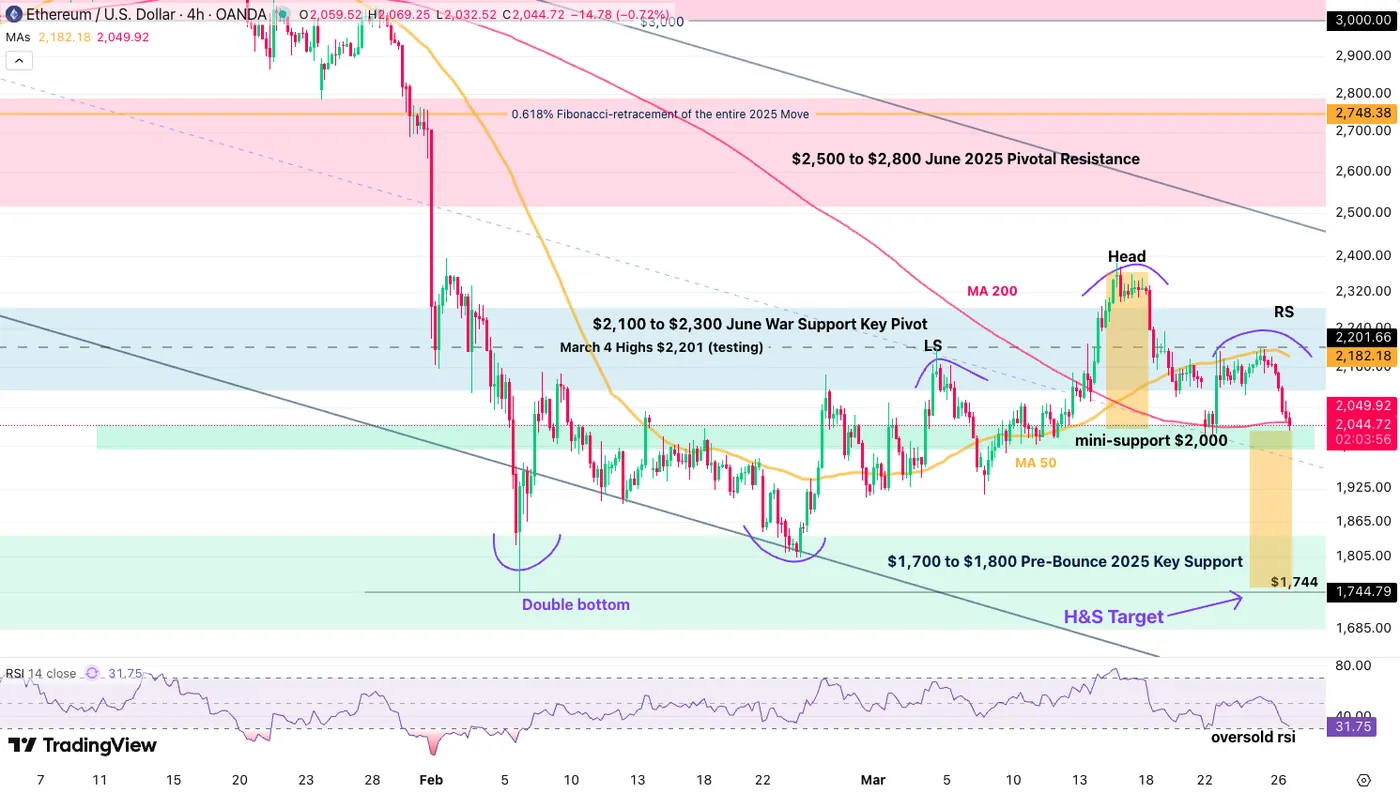
Ethereum (ETH) 4H Chart, March 26, 2026– Source: TradingView
Ethereum is also forming a Head and Shoulders pattern in recent action, pointing to an almost precise test of the $1,750 Major Support (which acted as bottom last time it reached).
To confirm the fall, look for a break and 4H close below the $2,000 Mini-Support; for those only looking for entries, placing orders around the double bottom could be wise.
Keep in mind that ETH is also evolving within a bear channel which sees its bottom around $1,580 in case the selloff extends.
Levels of interest for ETH trading:
Support Levels:
- Mini-support $2,000
- $1,700 to $1,800 Pre-Bounce 2025 Key Support (testing)
- $1,744 February 6 lows (H&S target)
- $1,380 to $1,500 2025 Support
- 2025 Lows $1,384
Resistance Levels:
- March Highs $2,385 (testing)
- $2,100 to $2,300 June War support now Key Pivot
- $2,500 to $2,700 June 2025 Key Support now Resistance (Channel Highs)
- $3,000 to $3,200 Pivotal resistance (Test of the $3,000)
- $4,950 Current new All-time highs
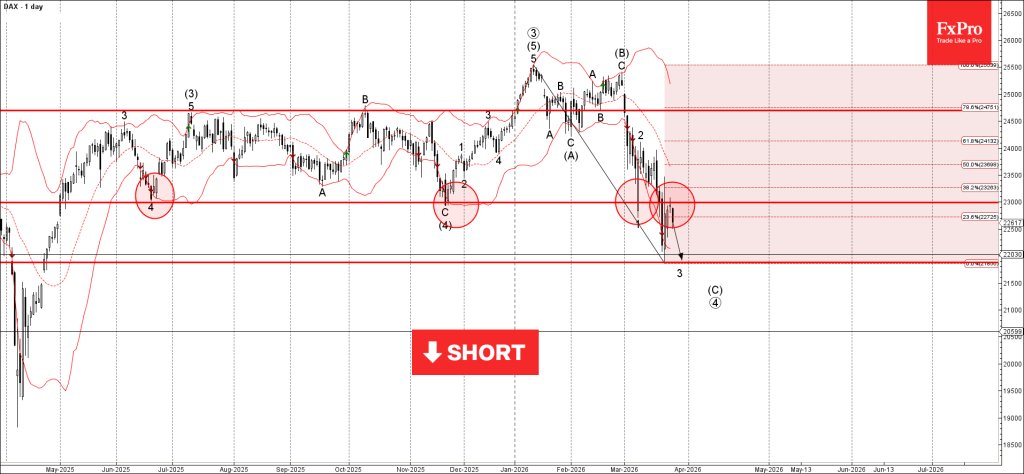
DAX Wave Analysis
DAX: ⬇️ Sell
- DAX reversed from resistance level 23000.00
- Likely to fall to support level 21875.00
DAX index recently reversed from the resistance zone between the resistance level 23000.00 (former support from June and November), 20-day moving average and the 38.2% Fibonacci correction of the downward impulse from January.
The downward reversal from this resistance area continues the active minor impulse wave 3 of the intermediate impulse wave (C).
DAX index can be expected to fall to the next support level 21875 (which reversed the price earlier this month).
Eco Data 3/27/26
| GMT | Ccy | Events | Act | Cons | Prev | Rev |
|---|---|---|---|---|---|---|
| 00:01 | GBP | GfK Consumer Confidence Mar | -21 | -24 | -19 | |
| 07:00 | GBP | Retail Sales M/M Feb | -0.40% | -0.30% | 1.80% | 2.00% |
| 14:00 | USD | UoM Consumer Sentiment Mar F | 53.3 | 55.5 | 55.5 | |
| 14:00 | USD | UoM 1-Yr Inflation Expectations Mar F | 3.80% | 3.40% |
| 00:01 | GBP |
| GfK Consumer Confidence Mar | |
| Actual | -21 |
| Consensus | -24 |
| Previous | -19 |
| 07:00 | GBP |
| Retail Sales M/M Feb | |
| Actual | -0.40% |
| Consensus | -0.30% |
| Previous | 1.80% |
| Revised | 2.00% |
| 14:00 | USD |
| UoM Consumer Sentiment Mar F | |
| Actual | 53.3 |
| Consensus | 55.5 |
| Previous | 55.5 |
| 14:00 | USD |
| UoM 1-Yr Inflation Expectations Mar F | |
| Actual | 3.80% |
| Consensus | |
| Previous | 3.40% |
Sunset Market Commentary
Markets
As was the case already over the previous four weeks, trading is pushed back and forth to the tunes headlines on the latest developments in the Middle East and the many guesstimates what it might mean for the economy, for prices and for (monetary) policy. As always in markets, this has also to be put against what participants assess is already priced after four weeks op ‘position adjustment’. A murky complex. Yesterday headlines on a 15 points US proposal reportedly delivered by Pakistan to Iran, caused markets to err to the side that enough bad news was maybe discounted. 24 hours later, markets see the glass half empty again. The focus (re)turns to headlines of Iran not really considering the US proposals, the country claiming payments for war damages and de facto control over the Strait of Hormuz (including a transit fee) and the US reportedly still moving more troops to the region. Admittedly, most of this news was already available yesterday, but the perspective today is different. US President Trump stepped up pressure on Iran today as he urged the country to better get serious soon (on reaching a deal with the US), before it is too late. Otherwise there is no turning back. This doesn’t sound as parties engaging for serene negotiations. Broad-based risk-off is back. Brent oil trades at $106 p/b. The Eurostoxx 50 cedes 0.75%. The S&P 500 declined about 0.5%. Losses were bigger at the open, but in the current environment, market quotes are always conditional to the next headline on the war. Sentiment during US dealings improved slightly on a report that Iran responded to the US proposal. US yields are rising between 1.5 bps (30-y) and 5 bps (5-y). German yields add between 8.5 bps (5 & 10-y) and 5.5 bps (30 y), the belly of the curve underperforming. So, after recent sharp rise in short-term yields, 5 and 10-y tenors are at least as much affected as the (monetary-policy) related short end of the curve. Interpretation isn’t that evident, but it might suggest that markets feel that, with our without decisive central bank action, risks are growing for inflation to stay higher for longer. A similar pattern today is visible on the UK yield curve (rises between 8 bps (2-y) and 10 bps (5-10-y)). Compared to the swings on other markets, moves in the major currency cross rates remain relatively modest and orderly. DXY gains from 99.64 to 99.80, but stays away from the top since the start of the war (100.54). EUR/USD declines marginally (1.155). USD/JPY (159.55) continues challenging the 160 barrier. Sterling again is holding up fairly well with EUR/GBP even easing slightly (0.864).
News & Views
The Norges Bank left its policy rate unchanged at 4%, but made a U-turn on its forward guidance. In January, they indicated that policy rate would be reduced further this year if the economy evolved as envisaged. Now NB assesses is that the inflation outlook implies a rate hike at one of the forthcoming policy meeting. Inflation has remained above target for several years, and the outlook indicates it will be higher ahead than previously projected. Underlying inflation is projected to average 3.3%, 2.8%, 2.2% and 2.1 over the 2026-2029 policy horizon, up from 2.7%-2.4%-2.2% (2026-2028) in December. The job of tackling inflation has not been fully completed. The policy rate forecast indicates an increase to between 4.25% and 4.50% by eoy 2026 with first rate cuts only seen towards end 2027, depending on uncertain economic developments. Norwegian money market currently attach a 61% probability to a 25 bps hike at the next, May, meeting. The Norwegian swap curve extends its inversion with yields rising by up to 9 bps for the 2-yr tenor. The NOK trades stronger at EUR/NOK 11.13 with higher oil prices helping offset the impact from weaker risk sentiment.
OECD published its interim economic outlook. Global GDP growth is projected broadly stable at 2.9% in 2026 before edging up to 3% in 2027, sustained by robust technology-related investment and gradually lower effective tariff rates. That’s broadly unchanged from the previous projection (2.9%-3%). Projections assume that the current energy market disruption is temporary, with prices easing from mid 2026 onward. Inflation pressures will persist for longer with G20 inflation now expected at 4% this year (from 2.6%) before easing to 2.7% in 2027. Simulations in the report explore a scenario where oil and gas prices rise well above baseline projections - by around a quarter in the first year and remaining elevated thereafter - combined with tighter global financial conditions. In this case, global GDP could be around 0.5% lower by the second year, while inflation would be higher by about 0.7 percentage points in the first year and 0.9 percentage points in the second. Central banks will need to remain vigilant and attentive to shifts in the balance of risks to ensure that underlying inflation pressures remain durably contained.
Logical Skepticism for Peace Pulls the Petrodollar Higher – EUR/USD, AUD/USD and Dollar Index (DXY) Overview
The US Dollar has been in the spotlight over the past two months, after remaining the pet peeve for FX since early 2025.
With wartime, however, things can change fast and decisively: the Global Reserve has risen by 4.40% since its end-January lows in a blink.
The new Fed Chair elect, Hawkish repricings, Petrodollars, and a general backing away from risky trades built up sudden demand, particularly at a time when Asset Managers were the most bearish on the USD in 14 years – and when the Market is stuck on one side of a trade, it often results in huge reversals.
The Petrodollar trade, however, was the fuel for the currency Market throughout this month, and despite what seemed like a relative dissonance this week, as the tone sours again, the correlation is coming right back.
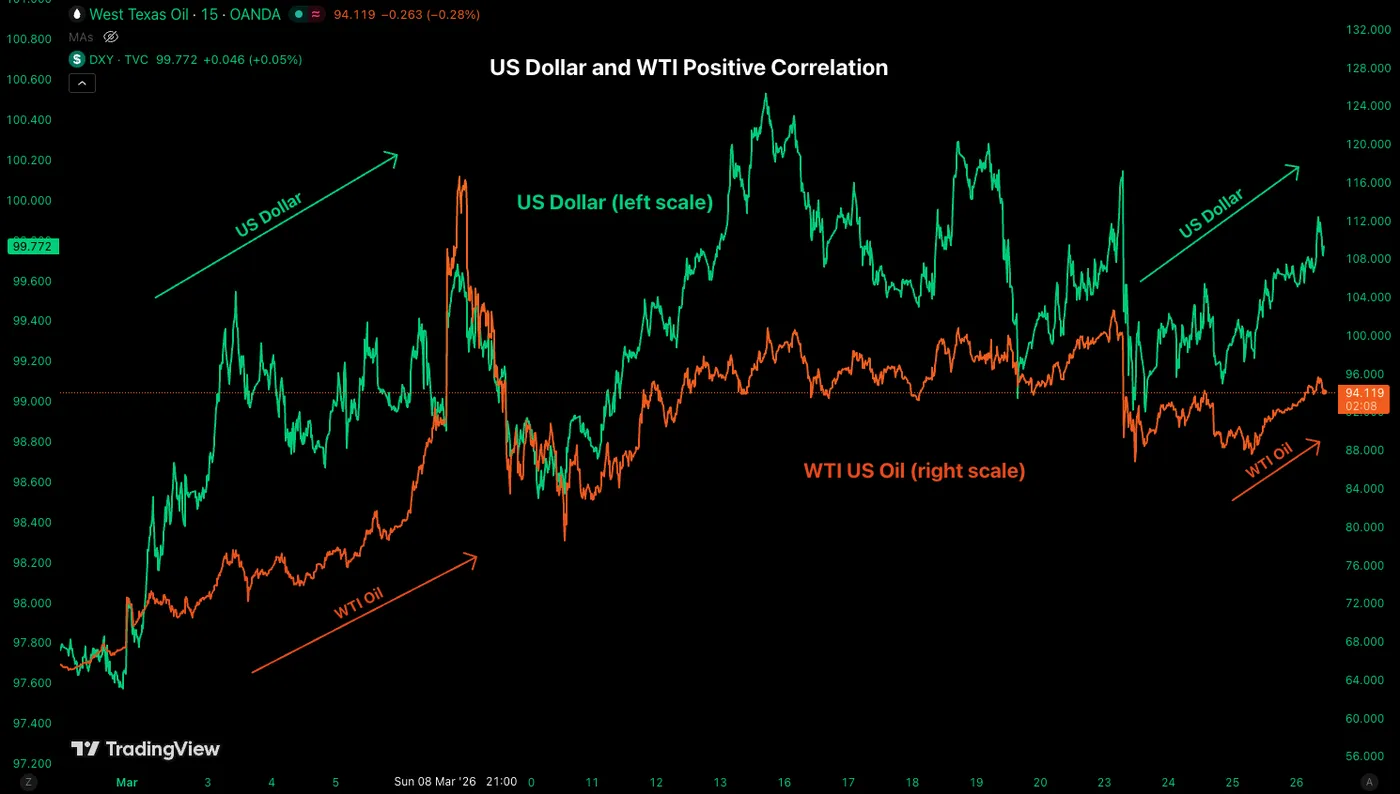
The Petrodollar trade – Oil and US Dollar Correlation. Source: TradingView
Indeed, after cautious optimism throughout this week's trading following the announcement of the US-Iran talks, it seems that Iran is still heavily inclined to maintain its strategic advantage over the Strait of Hormuz and its ballistic missile capabilities, two of the most contentious points in the indirect talks.
But the real issue for Markets is that President Trump's tone has gradually grown more pessimistic, and this coincides with the fact that the huge Marine fleet is arriving in the Arabian Sea in less than a day – so where are these mere distraction tactics?
Good question as War strategy is something that us common mortals cannot fully grasp – the Art of War, legendary treatise, can help in that sort (and is also a great read for traders).
Deception tactics are common, and nobody can really understand what any side has in mind.
What is sure, however, is that WTI is now rebounding toward $95, the higher bound of its momentum pivot, and above the psychological level, sentiment will sour even further.
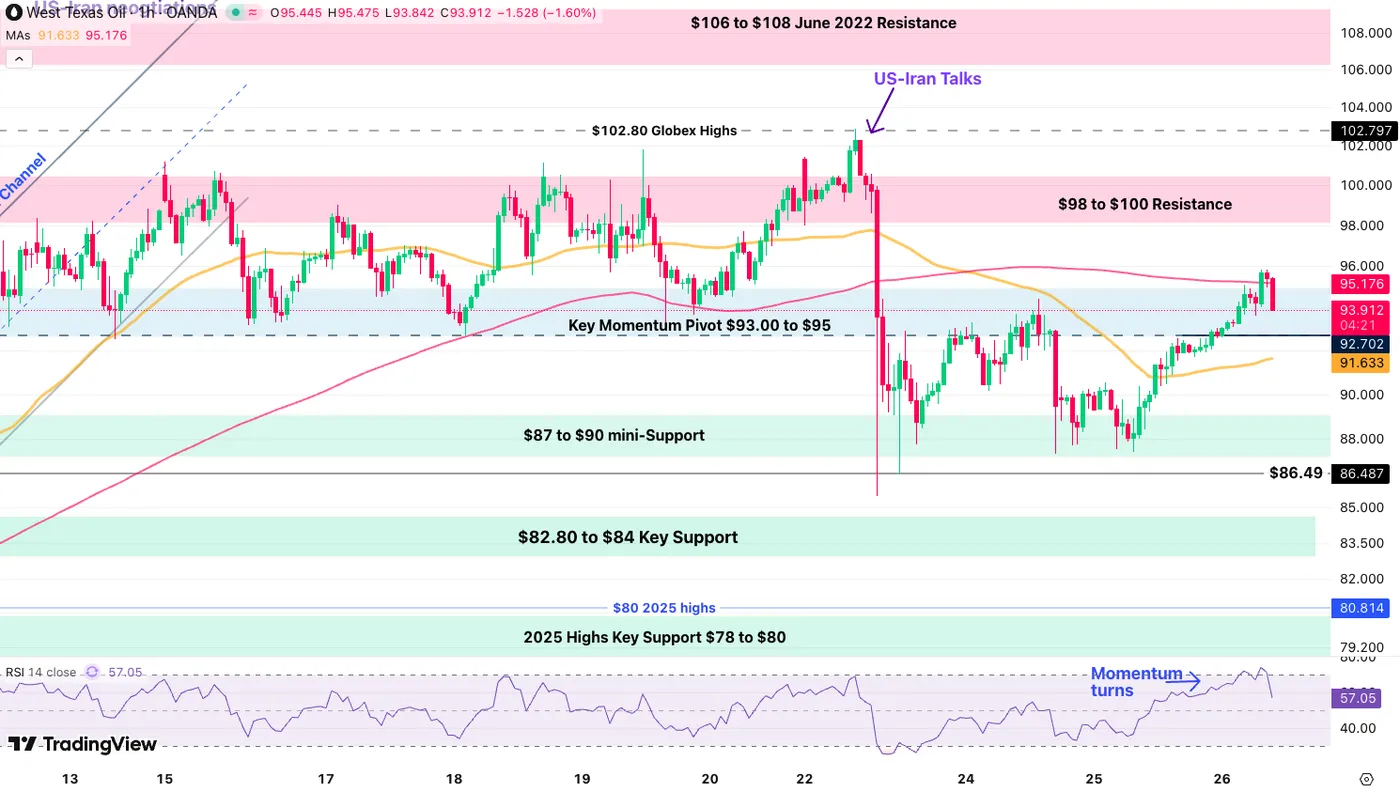
WTI (US) Oil 1H Chart – March 26, 2026. Source: TradingView
At least, the US Dollar is enjoying this move, amid a more hesitant FX session. As further clarity is expected in the next 24 hours, consider current levels as indications of doubtful neutrality amid the ongoing war.
Anything above in Oil and the Dollar implies a worsening in conditions and sentiment, which should drag into next week (+ Pessimistic)
On the other hand, a return below $90 in WTI will be most welcome to investors (+ Optimistic)
We will look at the Dollar Index, EUR/USD, and AUD/USD to assess the current state of the Market and whether more upside is warranted for the Dollar amid resurfacing doubts.
Dollar Index 4H Chart
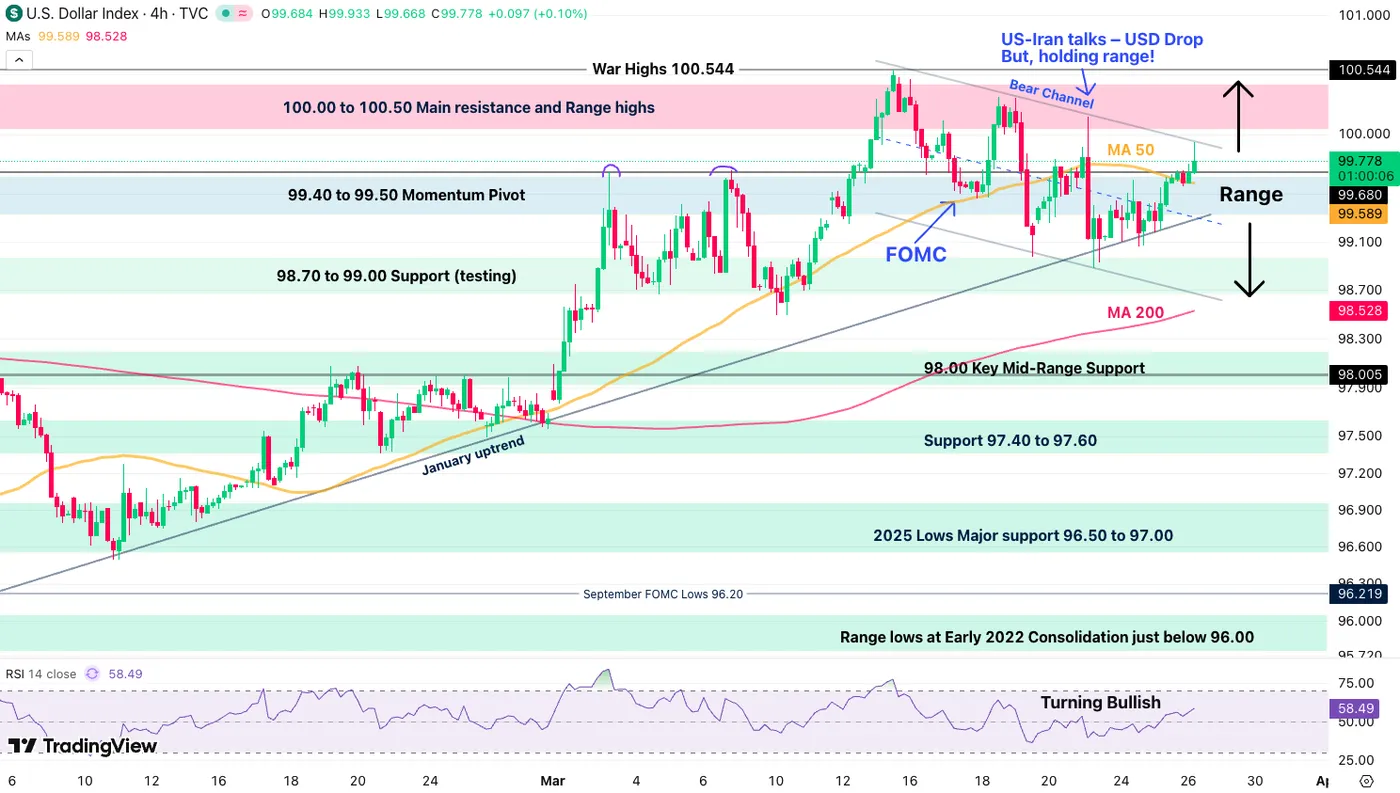
Dollar Index 4H Chart, March 26, 2026 – Source: TradingView
The US Dollar attempted a corrective sequence as the US-Iran talks were announced, but with WTI not correcting much further, the currency still receives fundamental support.
A few technical elements are developing in the Dollar Index which can help to find trades in major FX pairs:
- A short term, relatively flat bear-channel has developed and contained the Index movement. Traders may either use it as points of entry to long and short the US Dollar or as breakout signal – We are currently reaching its highs (99.90).
- Its lows are at around 98.65.
- A more Neutral 99.00 to 100.00 Range is holding for now – It is less responsive but more stable to watch the higher timeframe movement.
Levels of interest for the Dollar Index:
Resistance Levels
- Morning Spike 99.93 and Channel Top
- Weekly range highs 100.00
- 100.00 to 100.50 Main Resistance Zone
- War Highs 100.544
Support Levels
- Intraday micro support 99.30
- 98.70 to 99.00 Support (Mini Range lows)
- 98.00 2025 Support
- Support 97.40 to 97.60
- 2025 Lows 96.40 to 96.80 Support
AUD/USD 4H Chart and Technical Levels
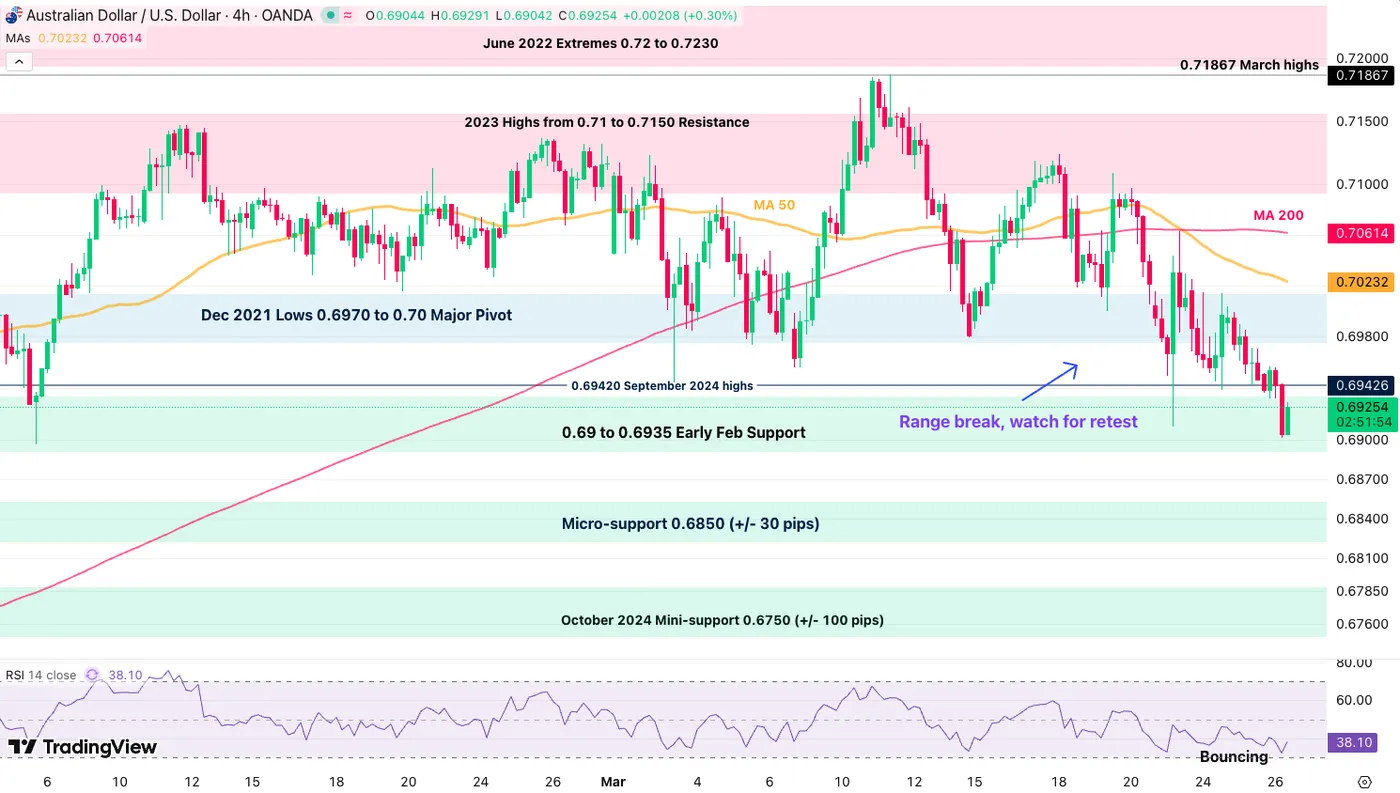
AUD/USD 4H Chart, March 26, 2026 – Source: TradingView
AUD/USD just broke its past month's 0.6970 to 0.7150 Major range to the downside, indicating high potential for a further correction.
Fundamentals are changing for the Aussie dollar after a strong period after two consecutive hikes from the RBA, particularly after Australian CPI surprised to the downside.
Failing to rebound above 0.6980 would hint at more bearish activity in the major pair.
Levels of interest for AUD/USD:
Resistance Levels
- Dec 2021 Lows 0.6970 to 0.70 Major Pivot (broken range holds above)
- Mini Resistance 4H MA 50 – 0.7020; Bullish above
- 2023 Highs from 0.71 to 0.7150 Resistance
- 0.71867 March highs
- June 2022 Extremes 0.72 to 0.7230
Support Levels
- 0.69 to 0.6935 Early Feb Support
- 0.69015 session lows
- Micro-support 0.6850 (+/- 30 pips)
- October 2024 Mini-support 0.6750 (+/- 100 pips)
EUR/USD 4H Chart and Technical Levels
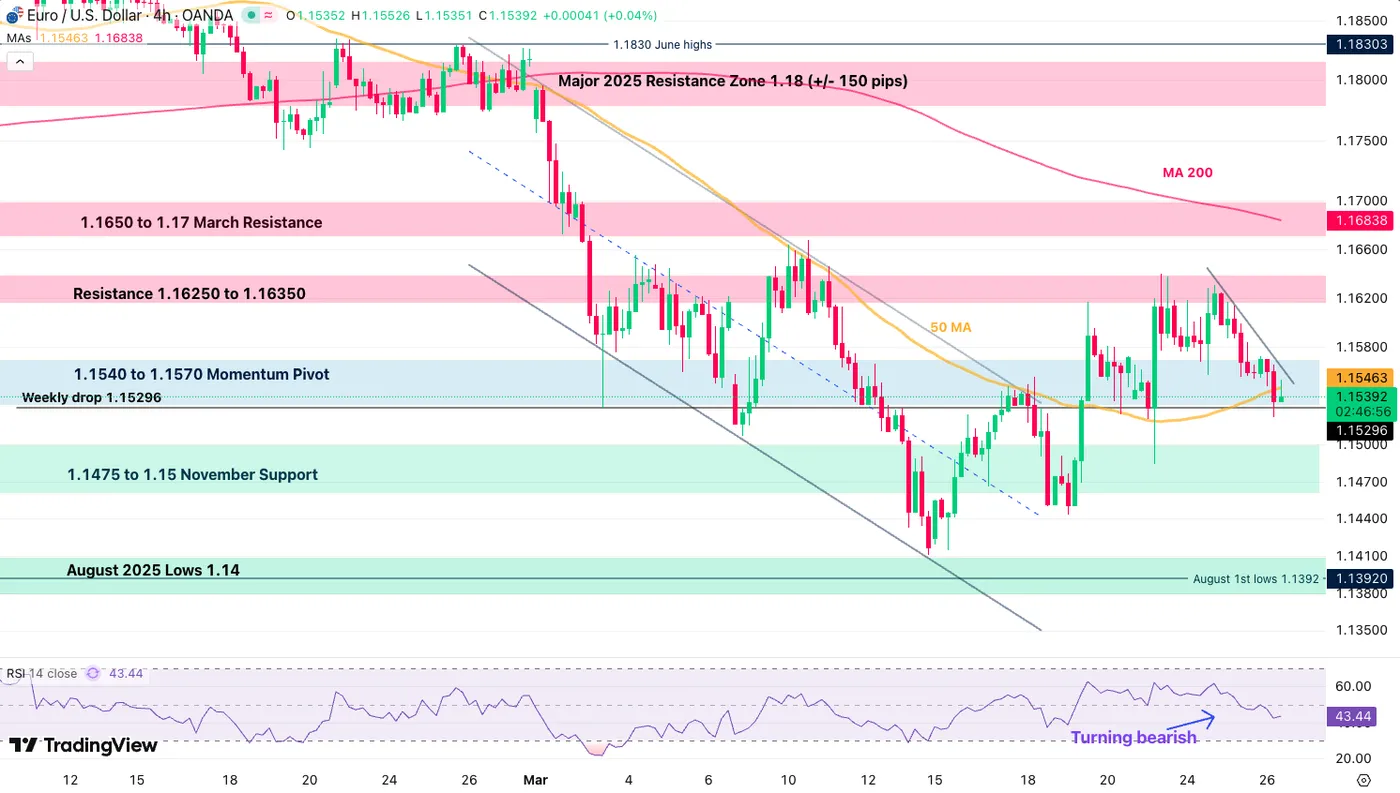
EUR/USD 4H Chart, March 26, 2026 – Source: TradingView
EUR/USD is now turning bearish, breaking its 4H 50-period MA after a double top this week and crossing below its Pivot Zone (1.1540 to 1.1570).
This hints at a test around at least the 1.1475 to 1.15 November Support, which could extend further to the 1.1410 War lows if the situation deteriorates.
Levels to place on your EUR/USD charts:
Resistance Levels
- Immediate resistance 1.1546
- Resistance 1.16250 to 1.16350
- 1.1650 to 1.17 March Resistance
- 1.1750 mini-resistance and Channel Top
- Resistance Zone around 1.18 (+/- 150 pips)
Support Levels
- 1.1475 to 1.15 November Support
- War lows 1.1410
- 1.1350 to 1.14 Support
- 1.12 to 1.13 Next Main Support Zone
Safe Trades and keep a close eye on Middle East developments!
EUR/USD Mid-Day Outlook
Daily Pivots: (S1) 1.1532; (P) 1.1582; (R1) 1.1608; More….
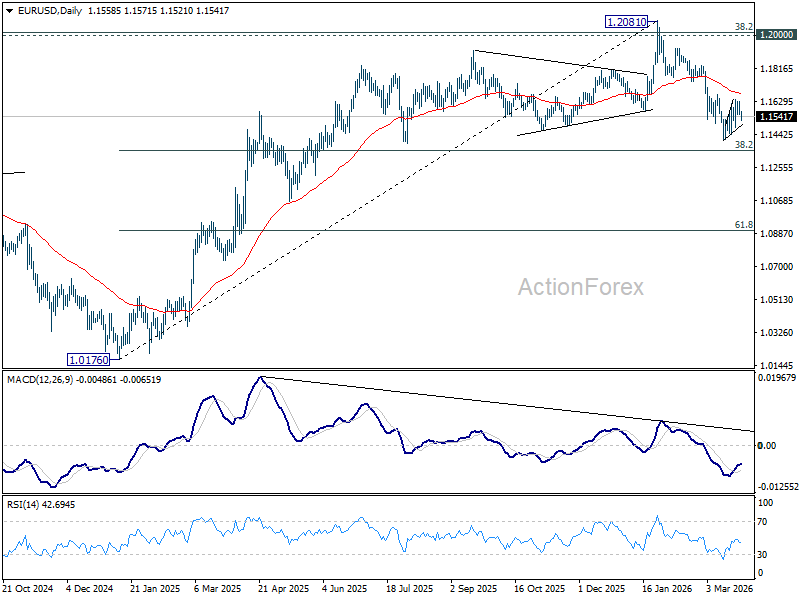
EUR/USD dips mildly today but stays in range above 1.1408. Intraday bias remains neutral. With 1.1666 cluster resistance (38.2% retracement of 1.2081 to 1.1408 at 1.1665) intact, further decline is in favor. On the downside, below 1.1408 will resume the fall from 1.2081 to 38.2% retracement of 1.0176 to 1.2081 at 1.1353. However, decisive break of 1.1666 will argue that the fall from 1.2081 has completed, and turn bias back to the upside for 61.8% retracement of 1.2081 to 1.1408 at 1.1824.
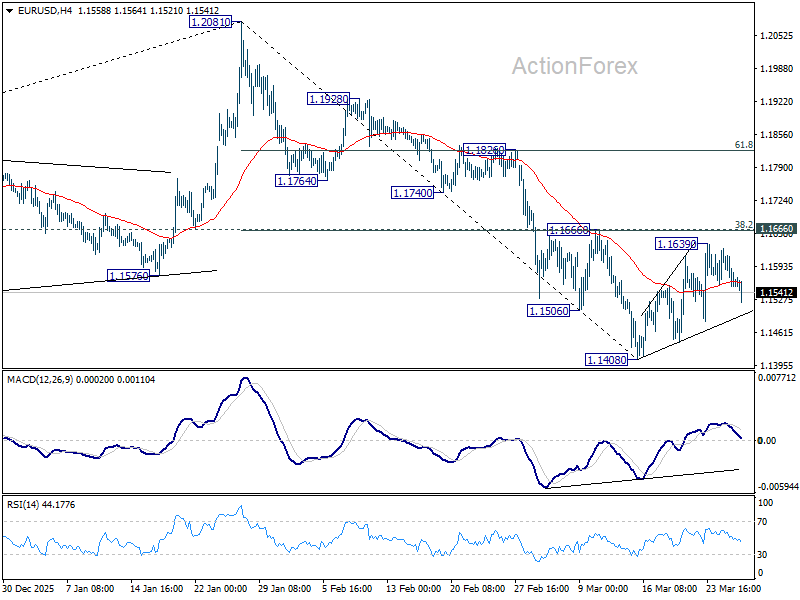
In the bigger picture, prior break of 55 W EMA (now at 1.1501) should confirm rejection by 1.2 key cluster resistance level. The whole up trend from 0.9534 (2022 low) might have completed as a three wave corrective rise too. Deeper fall is expected to long term channel support (now at 1.0528). Meanwhile, risk will stay on the downside as long as 1.2081 holds, even in case of strong rebound.
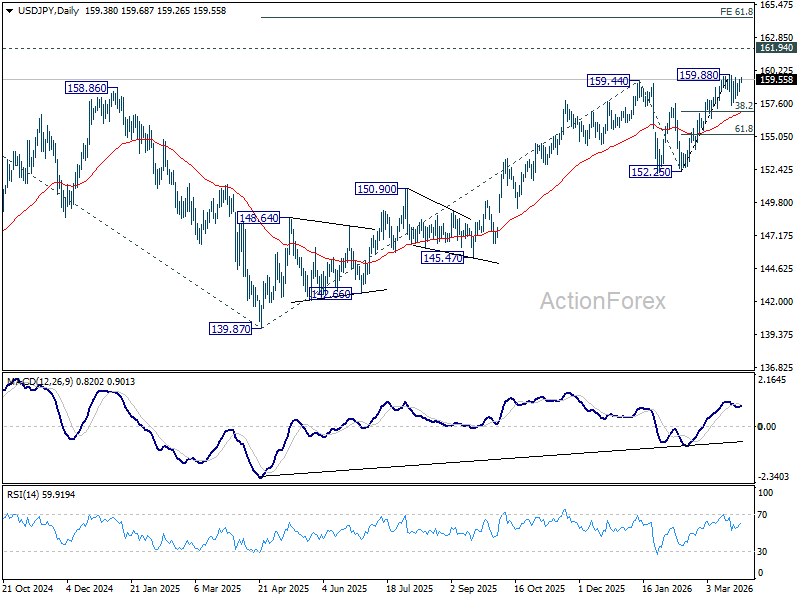
USD/JPY Mid-Day Outlook
Daily Pivots: (S1) 158.80; (P) 159.15; (R1) 159.82; More...
USD/JPY rebounds higher today but stays below 159.88 short term top. Intraday bias remains neutral at this point. In case of another dip, downside should be contained by 38.2% retracement of 152.25 to 159.88 at 156.96 to bring rebound. On the upside, break of 159.88 will target a test on 161.94 high.
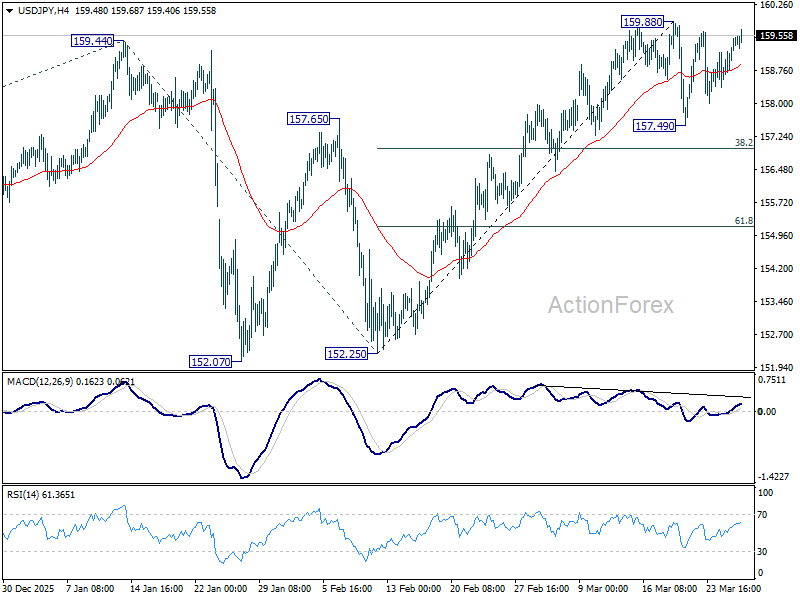
In the bigger picture, outlook is unchanged that corrective pattern from 161.94 (2024 high) should have completed with three waves at 139.87. Larger up trend from 102.58 (2021 low) could be ready to resume through 161.94. This will remain the favored case as long as 55 W EMA (now at 152.70) holds. Firm break of 161.94 will pave the way to 61.8% projection of 102.58 to 161.94 from 139.87 at 176.75.
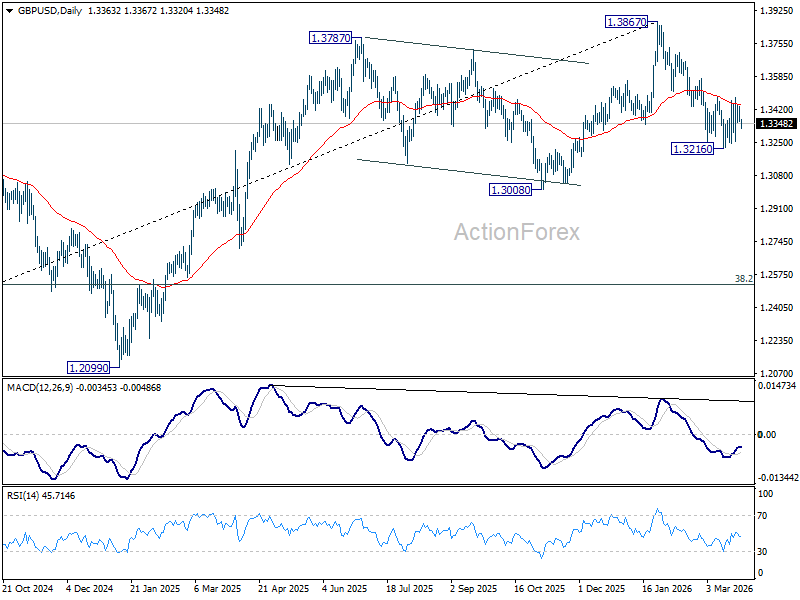
GBP/USD Mid-Day Outlook
Daily Pivots: (S1) 1.3336; (P) 1.3386; (R1) 1.3415; More...
GBP/USD dips mildly today but stays in established range. Intraday bias stays neutral at this point. With 1.3482 resistance intact, further decline is in favor. On the downside, below 1.3216 will resume the fall from 1.3867 to 1.3008 structural support. However, decisive break of 1.3482 will argue that the fall from 1.3867 has completed, and turn bias back to the upside for 61.8% retracement of 1.3867 to 1.3216 at 1.3618.
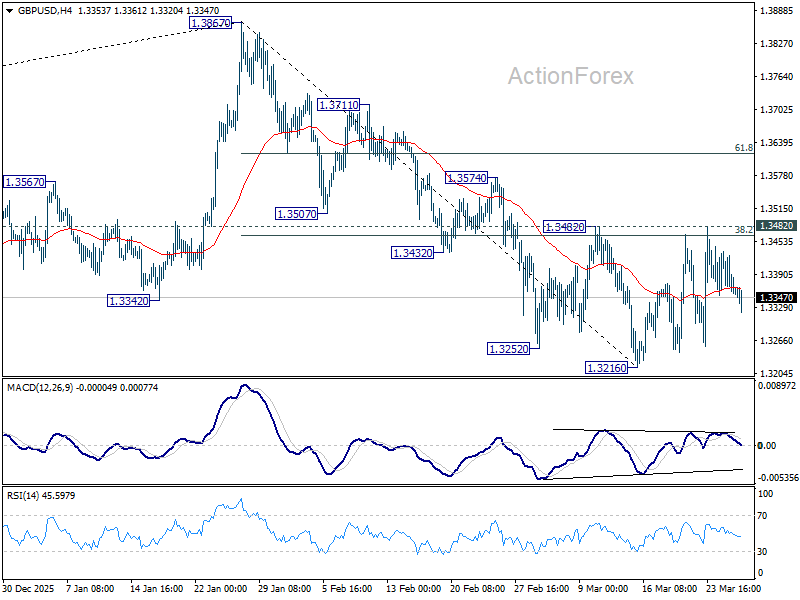
In the bigger picture, considering bearish divergence condition in both D and W MACD, a medium term top should be in place at 1.3867. Firm break of 1.3008 support will argue that fall from 1.3867 is at least correcting the rise from 1.0351 (2022 low) with risk of bearish reversal. That would open up further decline to 38.2% retracement of 1.0351 to 1.3867 at 1.2524. For now, medium term outlook will be neutral at best as long as 1.3867 resistance holds, or until further development.