

Sample Category Title
USD/CHF Mid-Day Outlook
Daily Pivots: (S1) 0.7813; (P) 0.7832; (R1) 0.7851; More….
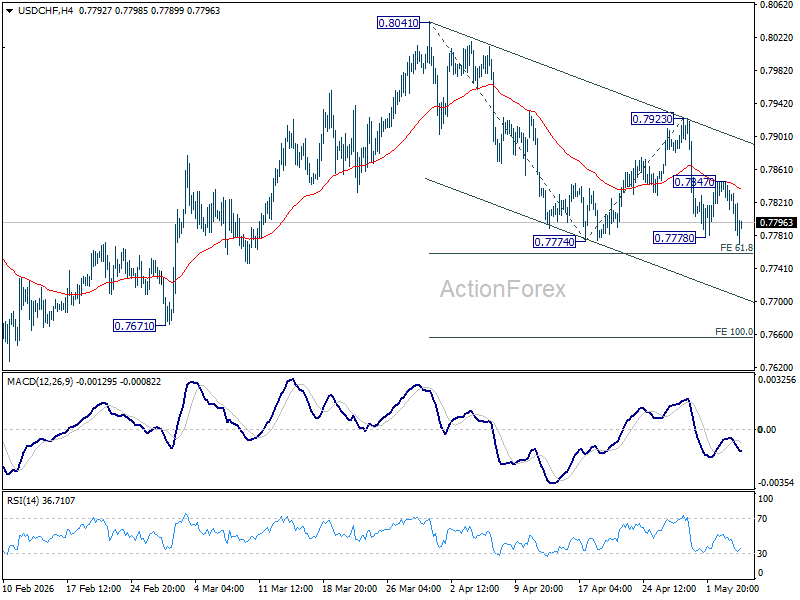
Intraday bias is back on the downside with breach of 0.7774 support, and fall from 0.8041 could be resumption. Firm break of 61.8% projection of 0.8041 to 0.7774 from 0.7923 at 0.7758 will target 100% projection at 0.7656. On the upside, above 0.7847 minor resistance will turn bias neutral again.
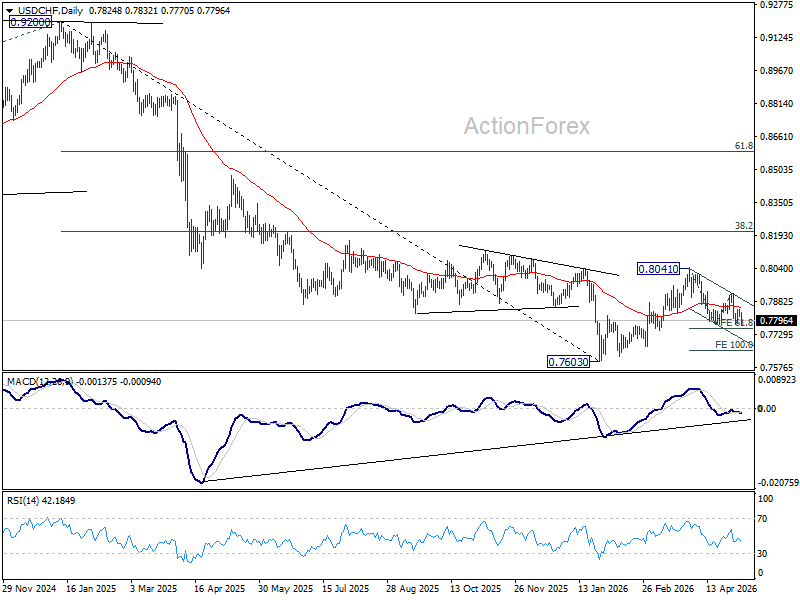
In the bigger picture, rebound from 0.7603 medium term bottom is seen as correcting the fall from 0.9200 only. Rejection by 55 W EMA (now at 0.8042) will affirm this bearish case, and setup down trend resumption to 100% projection of 1.0146 (2022 high) to 0.8332 from 0.9200 at 0.7382 at a later stage. Though, sustained break of 55 W EMA will suggest that it's probably correcting the larger scale down trend from 1.0146 (2022 high).
GBP/USD Mid-Day Outlook
Daily Pivots: (S1) 1.3508; (P) 1.3544; (R1) 1.3574; More...
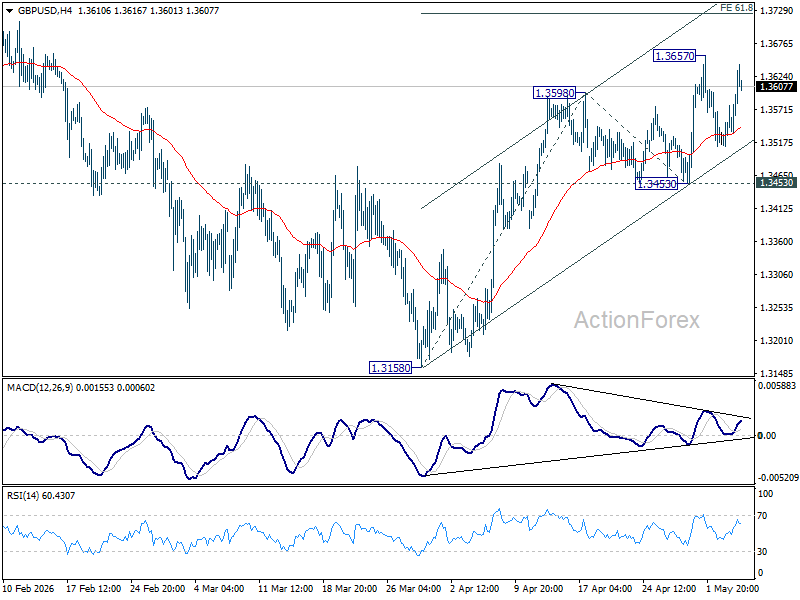
GBP/USD is still staying below 1.3657 despite today's rebound. Intraday bias is remains neutral for the moment. With 1.3453 support intact, further rise is expected. On the upside, above 1.3657 will target 61.8% projection of 1.3158 to 1.3598 from 1.3453 at 1.3725 first. Firm break there will target a retest on 1.3867 high. However, break of 1.3453 will turn bias back to the downside for 1.3158 support instead.
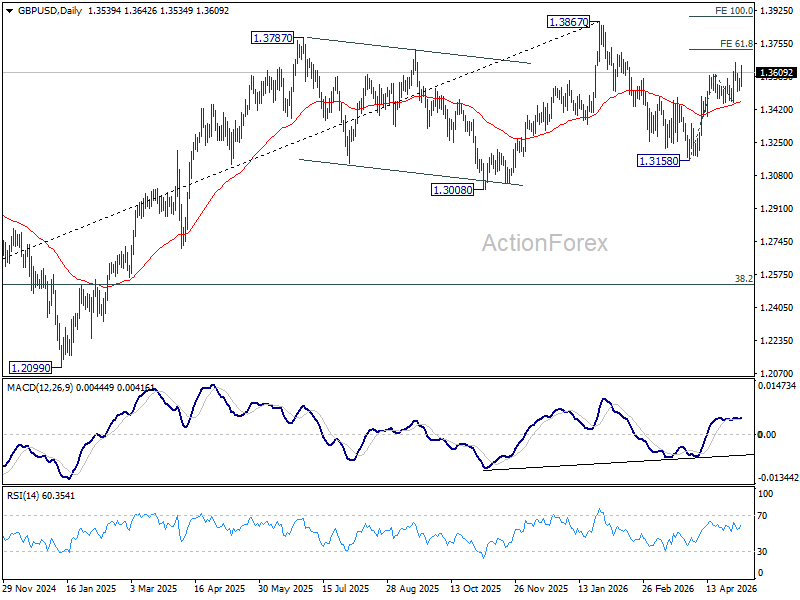
In the bigger picture, current development suggests that price actions from 1.3867 are merely a corrective pattern within the broader up trend from 1.0351 (2022 low). With 1.3008 support intact, medium term bullishness is maintained and break of 1.3867 is in favor for a later stage, towards 1.4248 key resistance (2021 high).
EUR/USD Mid-Day Outlook
Daily Pivots: (S1) 1.1674; (P) 1.1695; (R1) 1.1713; More….
EUR/USD is still bounded below 1.1848 resistance despite today's rebound. Intraday bias remains neutral at this point. With 1.1642 support intact, rise from 1.1408 is expected to continue. On the upside, firm break of 1.1848 will target 1.2081 high next. However, firm break of 1.1662 support will indicate the the rebound from 1.1408 has completed, and bring deeper decline back towards this low instead.
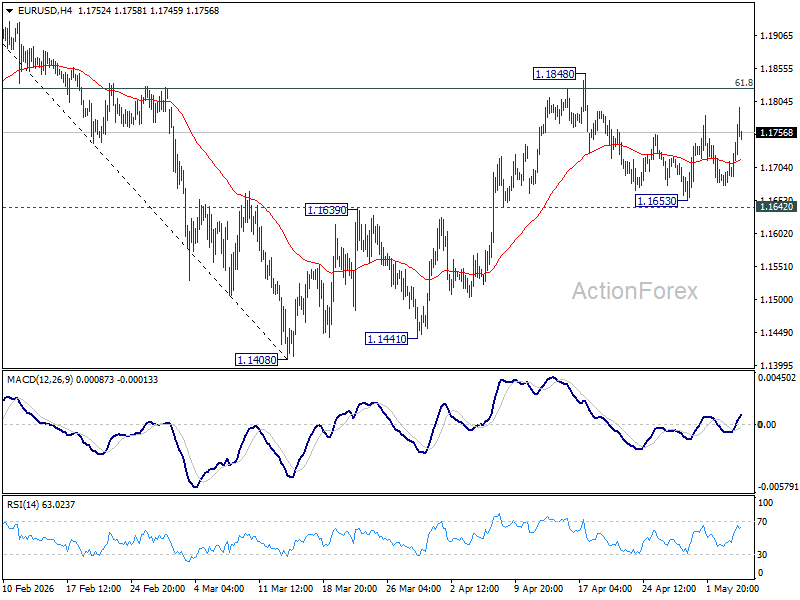
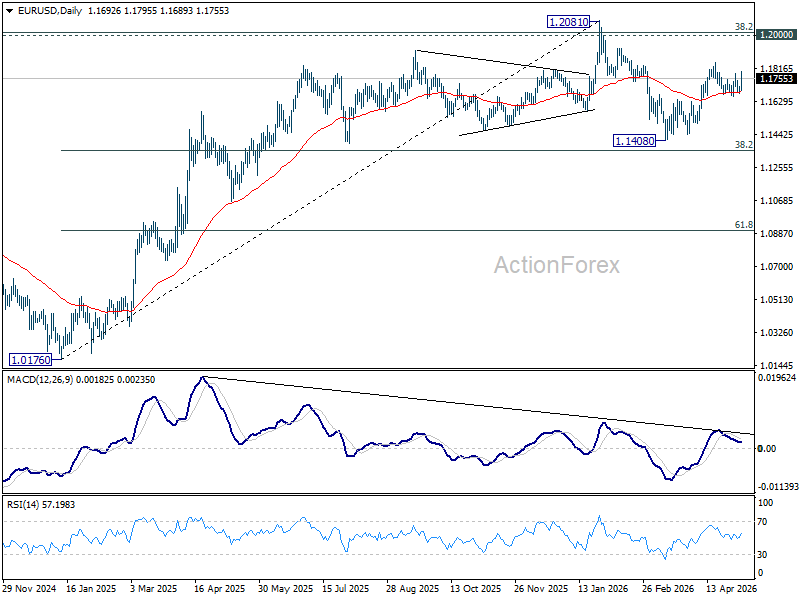
In the bigger picture, the strong support from 38.2% retracement of 1.0176 to 1.2081 at 1.1353 suggests that the pullback from 1.2081 is more likely a corrective move. Strong support was also found in 55 W EMA (now at 1.1537). Focus is back on 1.2 key cluster resistance level. Decisive break there will carry long term bullish implications. Nevertheless, break of 1.1408 support will revive the case of medium term bearish trend reversal.
Peace Deal or Bigger War? Markets Reassess Iran Optimism After Trump Warning
Geopolitics is once again dominating global markets today, with investors rapidly shifting between optimism over a potential US-Iran peace framework and fears of renewed escalation. Earlier in the session, risk appetite improved sharply after reports suggested Washington and Tehran were nearing a one-page, 14-point memorandum of understanding designed to end the war and establish a framework for broader nuclear negotiations.
The initial reaction was significant. Brent crude briefly broke below the psychologically important $100 level as traders aggressively unwound part of the geopolitical risk premium built during weeks of conflict around the Strait of Hormuz. Dollar also came under broad selling pressure, while Gold rebounded strongly. The move was reinforced after a Pakistan government official reportedly said that the prospect of a proposal to end the war was “very likely” in the coming days, while Iran’s foreign ministry confirmed it was “evaluating” the US proposal.
However, market optimism turned into caution after US President Donald Trump sharply raised the stakes later in the day. In a Truth Social post, Trump warned that Iran would face bombing “at a much higher level and intensity than it was before” if Tehran rejected the deal. He simultaneously stated that the war “will be at an end” if Iran accepts the proposals and allows the Strait of Hormuz to reopen “to all.” The rhetoric effectively transformed the market narrative from de-escalation into a binary geopolitical outcome: either a comprehensive peace deal or a renewed escalation cycle.
That shift explains why the earlier market optimism became more restrained as the session progressed. Oil prices recovered part of their losses, while broader risk sentiment turned more cautious. Markets generally dislike uncertainty more than negative outcomes themselves, and Trump’s comments highlighted how fragile the current diplomatic momentum still is.
One key concern is the internal political structure inside Iran. While diplomats and the foreign ministry may be evaluating the proposal, the Islamic Revolutionary Guard Corps still controls much of the military infrastructure surrounding Hormuz, including missile batteries and fast-attack naval units. It is being questioned whether Iran’s diplomatic leadership can actually enforce a ceasefire if elements within the IRGC oppose the proposed framework.
The issue is particularly sensitive because some factions inside Iran could view a broad 14-point agreement as a strategic surrender rather than a negotiated settlement. That creates a significant “veto risk,” where even meaningful diplomatic progress may not guarantee operational de-escalation on the ground.
Another uncertainty surrounds Israel’s position. Any durable US-Iran arrangement has required at least tacit Israeli acceptance. If Israel remains publicly skeptical or openly critical of the proposed framework, traders may quickly reduce confidence that the agreement can stabilize the region sustainably.
For now, markets are clearly trying to price both possibilities simultaneously. Dollar remains the weakest major currency on the day, followed by Loonie and Swiss Franc, while Kiwi, Yen, and Aussie are outperforming on improved risk appetite and falling oil prices. But beneath the surface, while optimism exists, confidence remains conditional.
In Europe, at the time of writing, FTSE is up 2.24%. DAX is up 2.16%. CAC is up 3.11%. UK 10-year yield is down -0.103 at 4.961. Germany 10-year yield is down -0.065 at 2.999. Earlier in Asia, Japan was on holiday. Hong Kong HSI rose 1.22%. China Shanghai SSE rose 1.17%. Singapore Strait Times rose 0.14%.
Gold Roars Back as Peace Hopes Crush Dollar
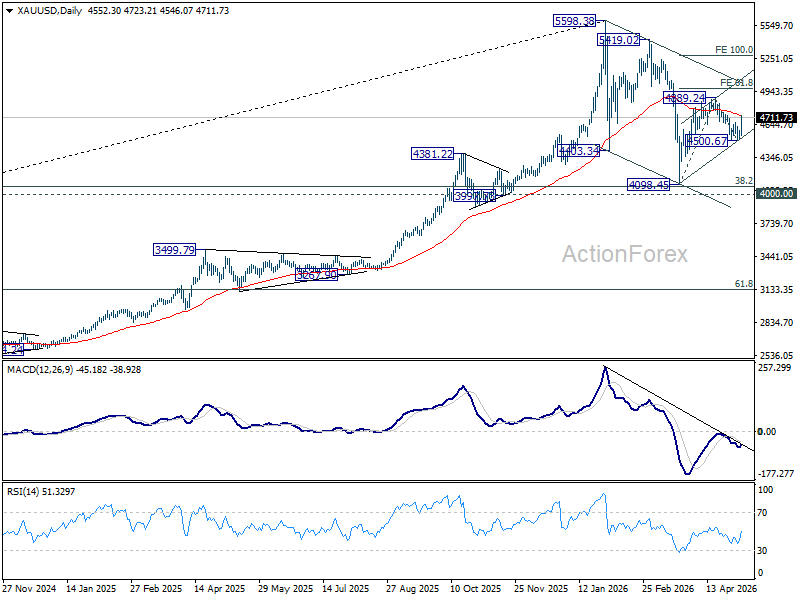
Gold’s rebound is rapidly turning into a breakout story. The metal surged after defending the 4500 level as US-Iran peace hopes triggered aggressive Dollar selling and revived bullish momentum. Read More.
Brent Breaks Below $100 as US and Iran Near Peace MOU to End War
Oil markets are rapidly unwinding the war premium. Brent crude has fallen below $100 after reports that the US and Iran are nearing a peace memorandum to end the conflict and reopen a path toward nuclear negotiations. The geopolitical reversal is now aligning with a major technical breakdown in crude prices. Read More.
Will $80K Become Bitcoin’s New Floor and Trigger Another ETF Buying Wave?
Bitcoin’s break above $80K may be more than a psychological milestone. The rally is now being reinforced by improving technical momentum, record equity markets, and the potential for a fresh wave of ETF inflows. If $80K turns into support, the next move toward $85K could come quickly. Read More.
US ADP Jobs Growth Accelerates to 109k as Hiring Strengthens at Small and Large Firms
US hiring rebounded strongly in April. ADP private payrolls jumped well above expectations, led by gains in services and small businesses, while wage growth continued to cool modestly. The data point to a labor market that remains resilient without showing signs of renewed overheating. Read More.
Eurozone PPI Surges 3.4% mom as Energy Costs Drive Sharp Producer Inflation
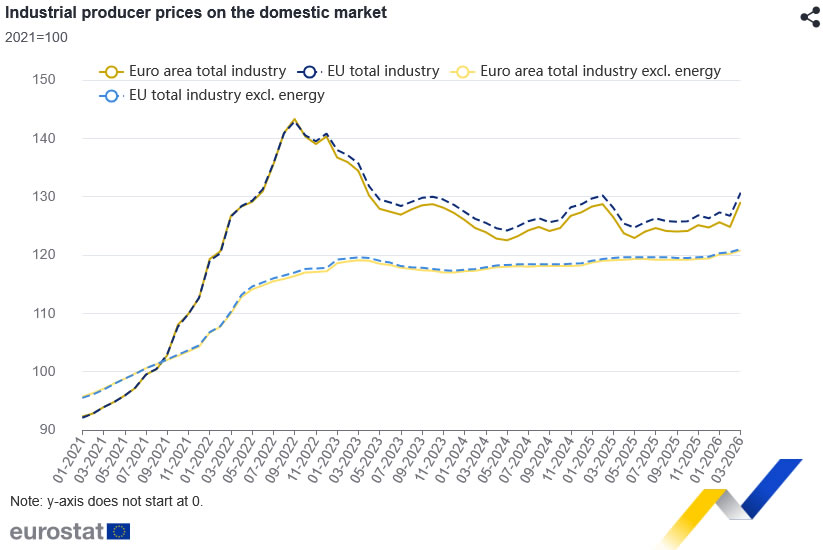
Europe’s energy shock is rapidly feeding into industrial inflation. Eurozone producer prices surged in March as energy costs jumped more than 11%, while broader price pressures continued spreading through supply chains. The data raise fresh concerns about inflation pass-through into consumer prices. Read More.
Eurozone PMI Falls Into Contraction as Energy Shock Hits Services Hard
The Eurozone recovery is losing momentum fast. Services activity collapsed in April as soaring energy prices and travel disruption hit consumer-facing sectors, while inflation pressures surged to their strongest in three years. The data deepen the ECB’s policy dilemma as growth weakens and stagflation risks rise. Read More.
UK PMI Services Climbs to 52.7 as Inflation Signals Strengthen
UK services activity recovered in April, but inflation pressures are building again. Higher fuel and transport costs pushed business expenses sharply higher, while firms increasingly passed those costs onto customers through fuel surcharges. The rebound in growth may prove fragile as geopolitical tensions continue weighing on confidence. Read More.
NZ Labor Data Gives RBNZ Room to Stay on Hold
New Zealand’s labor market is stabilizing—but not overheating. Unemployment unexpectedly fell in Q1, yet wage growth remained subdued and participation slipped slightly. The combination eases pressure on the RBNZ to react aggressively to rising energy-driven inflation risks. Read More.
EUR/USD Mid-Day Outlook
Daily Pivots: (S1) 1.1674; (P) 1.1695; (R1) 1.1713; More….
EUR/USD is still bounded below 1.1848 resistance despite today's rebound. Intraday bias remains neutral at this point. With 1.1642 support intact, rise from 1.1408 is expected to continue. On the upside, firm break of 1.1848 will target 1.2081 high next. However, firm break of 1.1662 support will indicate the the rebound from 1.1408 has completed, and bring deeper decline back towards this low instead.
In the bigger picture, the strong support from 38.2% retracement of 1.0176 to 1.2081 at 1.1353 suggests that the pullback from 1.2081 is more likely a corrective move. Strong support was also found in 55 W EMA (now at 1.1537). Focus is back on 1.2 key cluster resistance level. Decisive break there will carry long term bullish implications. Nevertheless, break of 1.1408 support will revive the case of medium term bearish trend reversal.
AUD/USD: Hits Four-Year High on Fresh Risk Appetite
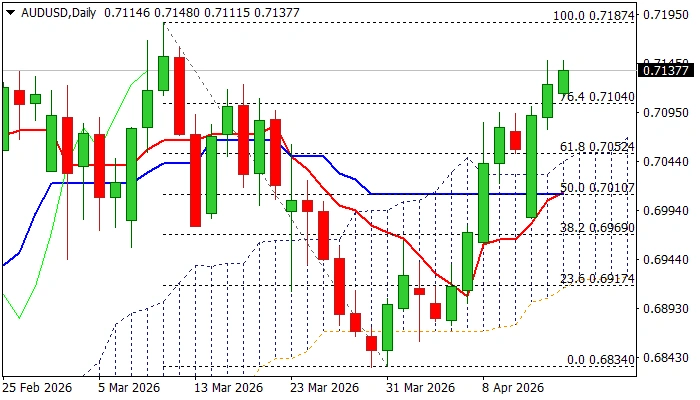
Australian dollar rose 1.2% against its US counterpart on Wednesday and hit the highest since June 2022.
The rally was sparked by the media report signaling that US-Iran war might be near the end that revived demand for riskier assets.
Today’s advance broke about two-week consolidation range (0.7222/27) as well as above upper 20-d Bollinger band (0.7247), on track to generate fresh bullish signal on close above these levels.
Bullish daily studies (the latest contribution was formation of 30/55DMA bull-cross) contribute to improved fundamentals and expected to further lift the price.
Fresh acceleration hit initial target at 0.7271 (Fibo 123.6% projection of the rally from 0.6833), with sustained break here to expose 0.7322 (Fibo 138.2% projection).
Broken range tops reverted to support which should ideally contain and guard ascending 10DMA (0.7176).
Res: 0.7300; 0.7322; 0.7365; 0.7406.
Sup: 0.7221; 0.7176; 0.7154; 0.7105.
US ADP Jobs Growth Accelerates to 109k as Hiring Strengthens at Small and Large Firms
US private sector employment growth accelerated in April, with ADP payrolls rising 109k, well above expectations of 79k and significantly stronger than March’s 61k gain.
Hiring was led by the service sector, which added 94k jobs, while goods-producing industries contributed 15k. By establishment size, small businesses added 65k jobs and large firms contributed 42k, while medium-sized companies showed only modest growth with a 2k increase.
According to ADP Chief Economist Nela Richardson, large firms benefited from stronger resource flexibility, while smaller firms remained nimble in a more complex economic environment.
Despite stronger hiring, wage pressures continued to moderate gradually. Pay growth for job-stayers slowed from 4.5% to 4.4%, while annual pay gains for job-changers held steady at 6.6%.
| Indicator | Previous | Latest | Expectation |
|---|---|---|---|
| ADP Private Employment | 61k | 109k | 79k |
| Sector | Jobs Added |
|---|---|
| Goods-Producing | 15k |
| Service-Providing | 94k |
| Establishment Size | Jobs Added |
|---|---|
| Small Businesses | 65k |
| Medium Businesses | 2k |
| Large Businesses | 42k |
| Indicator | Previous | Latest |
|---|---|---|
| Job-Stayers Pay Growth | 4.5% | 4.4% |
| Job-Changers Pay Growth | 6.6% | 6.6% |
Gold Roars Back as Peace Hopes Crush Dollar
Gold’s rebound is suddenly turning into something much bigger. After defending the 4,500 psychological level earlier this week, the metal has surged sharply as markets aggressively sell Dollar on signs that the US and Iran may be moving toward a formal agreement to end the war.
The first catalyst came when President Donald Trump abruptly paused “Project Freedom,” signaling that Washington was prioritizing diplomacy over military escalation in the Strait of Hormuz. Momentum then accelerated dramatically after reports that the US and Iran are now close to a peace memorandum framework.
Technically, the decisive break above 4,660.21 resistance suggests that the pullback from 4,889.24 has already completed at 4,500.67. The rebound is now expected to extend toward a retest of 4,889.24.
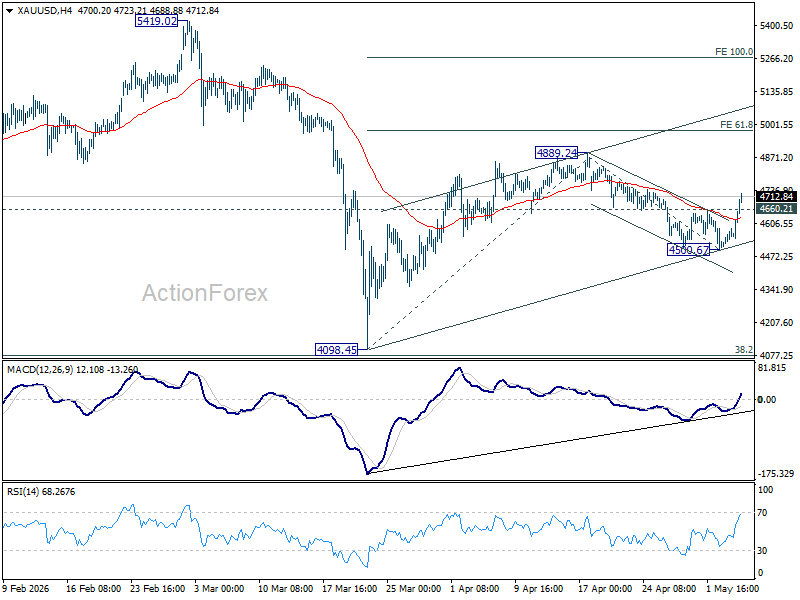
Firm break there would not only resume the broader rally from 4,098.45, but also strengthen the case that the correction from 5,598.38 ended with the three-wave decline into 4,098.45.
Under that scenario, Gold could accelerate further to 61.8% projection of 4,098.45 to 4,889.45 from 4,500.67 at 4,989.37, and then 100% projection at 5,291.46.
Brent Breaks Below $100 as US and Iran Near Peace MOU to End War
Oil prices are falling sharply as markets aggressively unwind the geopolitical risk premium built on tensions in the Strait of Hormuz. Brent crude has now broken below the psychologically important $100 level, while WTI is sliding rapidly toward the $90 area, as diplomacy suddenly replaces disruption as the dominant market narrative.
The catalyst was an Axios report stating that the White House believes the US and Iran are close to finalizing a one-page, 14-point memorandum of understanding designed to formally end the conflict and establish a framework for broader nuclear negotiations. Iranian officials later confirmed they were “evaluating” the US proposal, reinforcing hopes that negotiations are entering a decisive phase.
The development follows President Donald Trump’s abrupt decision earlier to pause “Project Freedom,” the US naval operation aimed at forcing open the Iranian-controlled Strait. That pause was initially interpreted as a tactical de-escalation move, but the Axios report now suggests it may have been part of a broader diplomatic pivot already underway behind the scenes.
Technically, immediate focus is now on 61.8% retracement of 86.09 to 115.30 at 97.25. Firm break there will pave the way back to 86.09 key structural support. Meanwhile, further fall would now be in favor as long as 55 4H EMA (now at 106.89) holds, in case of recovery.
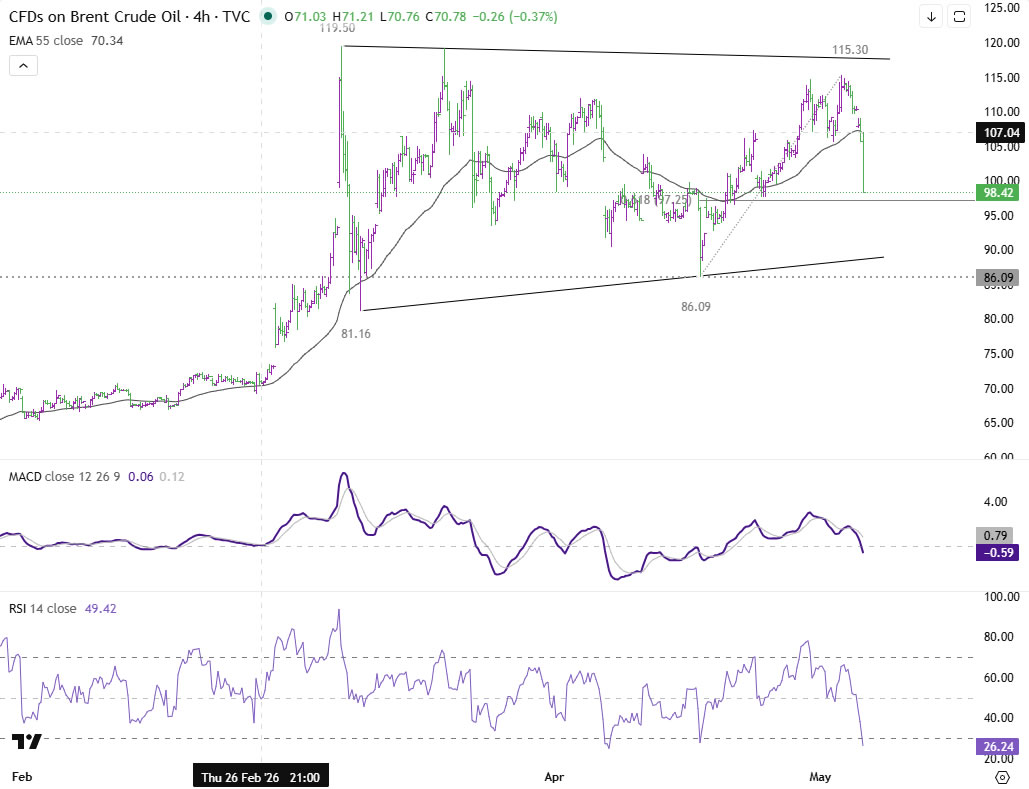
The broader implication is that markets are shifting rapidly from “war pricing” toward “normalization pricing.” That does not mean risks have disappeared completely. The proposed agreement is still preliminary, Iranian internal divisions remain a concern, and negotiations could still break down. But for now, traders appear increasingly convinced that the worst-case supply shock scenario is becoming less likely.
Eurozone PPI Surges 3.4% mom as Energy Costs Drive Sharp Producer Inflation
Eurozone producer price inflation accelerated sharply in March, with PPI rising 3.4% mom and 2.1% yoy, exceeding expectations of 3.3% mom and 1.8% yoy. The increase was driven overwhelmingly by energy costs, highlighting the growing inflationary impact of the Middle East conflict on the region’s industrial sector.
Energy producer prices surged 11.1% in Eurozone on the month, far outpacing other categories. Intermediate goods prices rose 0.7%, while capital goods, durable consumer goods, and non-durable consumer goods all recorded more moderate increases between 0.2% and 0.3%. The data suggest that while the immediate inflation shock is concentrated in energy, price pressures are gradually broadening across the production chain.
| Indicator | Previous | Latest | Expectation |
|---|---|---|---|
| PPI (MoM) | -0.6% | 3.4% | 3.3% |
| PPI (YoY) | -3% | 2.1% | 1.8% |
| Category | March Change |
|---|---|
| Energy | 11.1% |
| Intermediate Goods | 0.7% |
| Capital Goods | 0.2% |
| Durable Consumer Goods | 0.2% |
| Non-Durable Consumer Goods | 0.3% |
Across the broader European Union, PPI rose 3.2% mom and 2.0% yoy. Lithuania, Spain, and Italy recorded the strongest monthly increases, while Estonia and Finland saw sharp declines. The figures reinforce concerns that rising energy costs are feeding more directly into industrial inflation, increasing the risk that producer price pressures could continue passing through into consumer inflation in the coming months.
EUR/USD: US Dollar Weakens Amid Geopolitical Optimism
EUR/USD rose to 1.1717 on Wednesday, snapping a three-day losing streak. Pressure on the US dollar stems from growing expectations that the US will reach a negotiated settlement with Iran, reducing demand for the USD as a safe-haven asset.
US authorities have confirmed that the truce, now in effect for nearly a month, remains intact. Military operations have concluded, and the focus is shifting towards securing shipping lanes in the Strait of Hormuz. Donald Trump also announced a pause in operations to facilitate the extraction of stranded vessels, providing room for negotiations.
Against this backdrop, oil prices have moderated, lowering inflation risks and reducing expectations of further policy tightening by the Federal Reserve.
Investor attention now turns to ADP private-sector employment data for April, which precedes Friday's key labour market report.
Technical Analysis
On the H4 chart of EUR/USD, the pair is trading within a consolidation range around 1.1742, currently extending down to 1.1729. A move lower below this level is likely, with potential downside towards 1.1690 and possibly 1.1636. Technically, this scenario is confirmed by the MACD indicator, with its signal line below zero and pointing firmly downwards, reflecting continued bearish momentum.
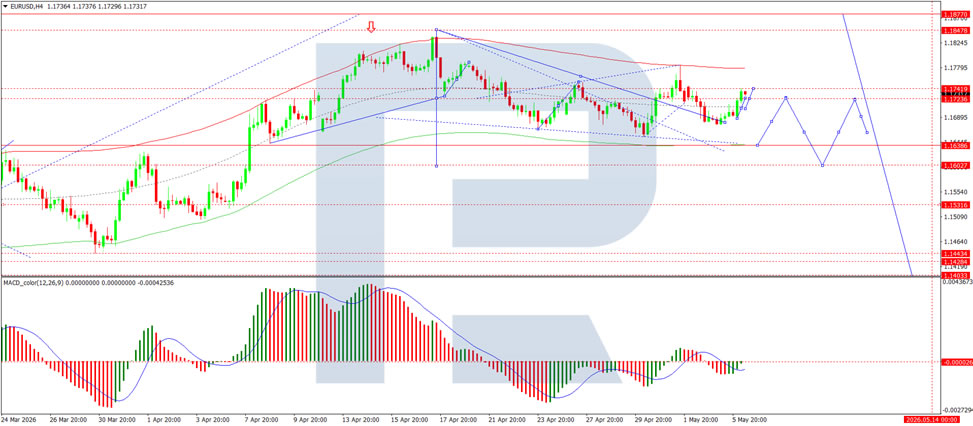
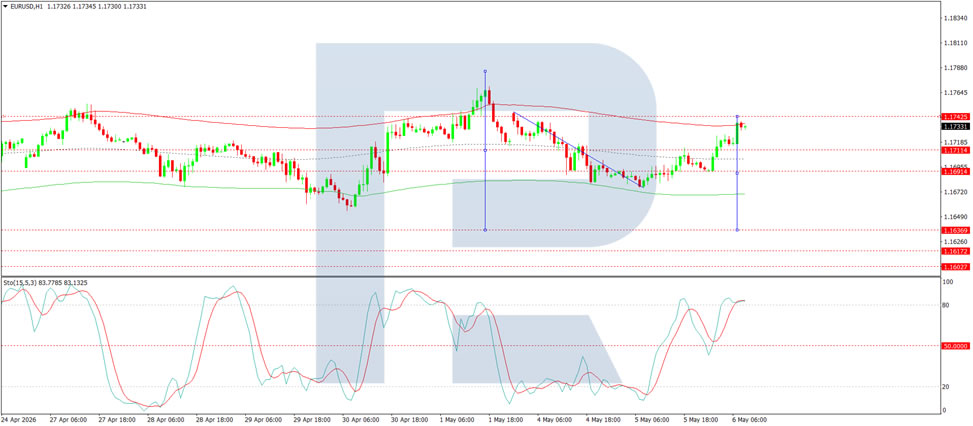
On the H1 chart, EUR/USD has reached the 1.1742 level and is now moving lower. A decline towards 1.1695 is likely, followed by a possible rebound to 1.1711 before a further move lower towards 1.1650 and potentially 1.1636. Technically, this scenario is confirmed by the Stochastic oscillator, with its signal line below 80 and pointing firmly downwards.
Conclusion
The US dollar has lost ground amid rising geopolitical optimism, as markets increasingly price in the likelihood of a negotiated settlement between the US and Iran. With the truce holding for nearly a month and military operations paused, the focus has shifted to securing shipping in the Strait of Hormuz, while moderating oil prices have eased inflation concerns and reduced expectations of Fed tightening. This has supported a rebound in EUR/USD after three days of declines. However, technical indicators suggest the broader bearish momentum for the pair may still be intact, with potential for further downside towards 1.1690 and 1.1636. The near-term direction will likely be influenced by US labour market data due later this week.