Sample Category Title
Is Bitcoin’s (BTC/USD) Second $70k Rejection a “Buy the Dip” Opportunity?
- Bitcoin failed its second attempt at a $70,000 breakout.
- Institutional investors, including Michael Saylor and Anthony Pompliano, are continuing to "buy the dip" and increase their BTC holdings.
- The medium to long-term technical outlook is starkly divided, with forecasts suggesting a painful crash to $40,000–$50,000 or a significant recovery toward $150,000.
Bitcoin finds itself at a crossroads having recorded its second failed attempt at breaking above the $70000 level. Having flirted with the $70000 handle yesterday, Bitcoin has since retraced, trading near $67,800 as investors grapple with the fallout of escalating tensions in the Middle East.
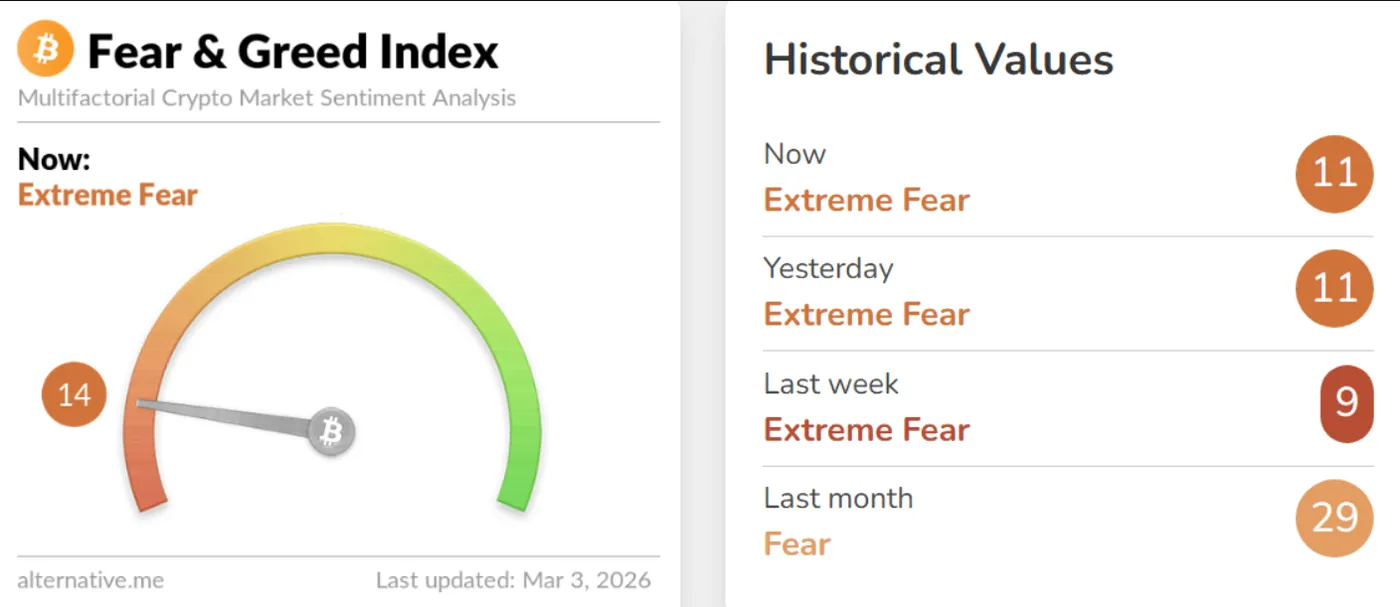
The tensions in the Middle East have seen risk-off sentiment dominate the agenda, while a stronger US Dollar and rate cut expectations being pared back are also weighing on Bitcoin. This concern is echoed when looking at the fear and greed index which is hovering in extreme fear territory at present.
Source: FinancialJuice
The $70,000 rejection and geopolitical headwinds
The primary story for Bitcoin today is the sharp rejection at the $70000 resistance level. After a robust 4% rally on Monday driven by renewed spot ETF inflows and a shift back toward risk-on sentiment in the Asian and European sessions, the momentum hit a wall.
The catalyst for the pullback appears to be the "melt-down" in global stock markets triggered by escalating conflict involving Iran. Traditionally viewed by some as "digital gold," Bitcoin’s behavior today more closely mirrored that of a high-risk asset.
As geopolitical uncertainty spiked, traders moved toward the safety of the US dollar and physical gold (which has climbed toward $5,247 per ounce), although Gold prices saw a selloff today as prices dropped around 5%+.
Can “buy the dip” mentality prove to be the saving grace?
Michale Saylor made his feelings clear today when he announced a fresh Bitcoin purchase. He is not the only one who is involved in institutional buying.
Strategy (formerly MicroStrategy): Led by Michael Saylor, the firm completed its 101st Bitcoin purchase, adding 3,015 BTC for approximately $204 million. This brings their total treasury to a staggering 720,737 BTC.
ProCap Financial: Under Anthony Pompliano, ProCap added 450 BTC to its balance sheet, raising its total holdings to 5,457 coins.
While the "paper price" is suffering due to macro fears, the "on-chain" reality shows long-term holders are not distributing. Instead, the supply of freely circulating coins continues to tighten, which could magnify the next move upward once the geopolitical dust settles.
Technical Outlook: A "Bull Trap" or a Breakout?
The short-term outlook remains neutral with a bearish bias. Technical analysts point to immediate support levels at $66396 (50-day MA) and $65000.
If these fail to hold, a revisit to the $63,000 range is likely.
A break and four-hour candle close above the $70000 mark could open the door for a move toward $71673 before the $75000 handle comes into focus.
Bitcoin (BTC/USD) Four-Hour Chart, March 3, 2026
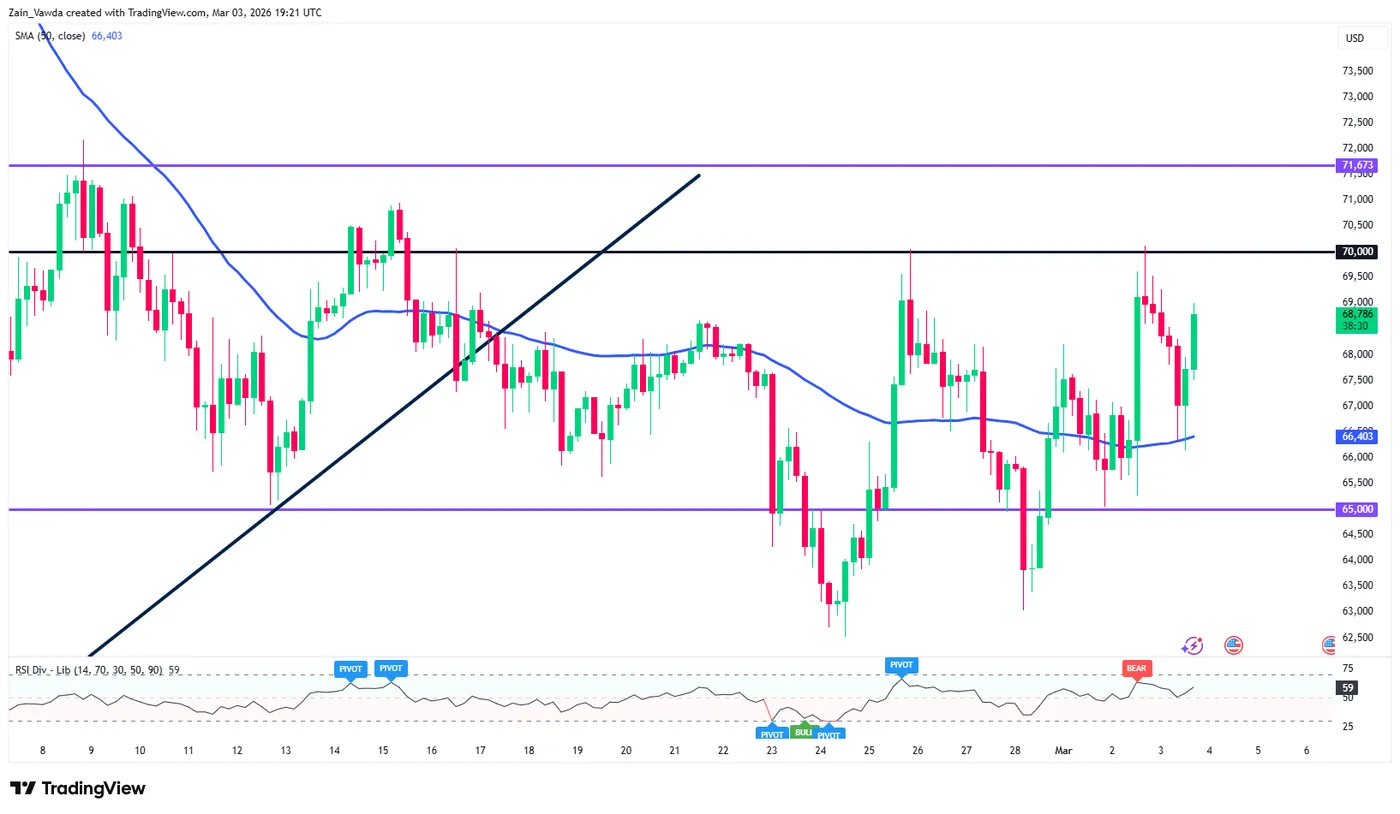
Source: TradingView.com (click to enlarge)
The long-term forecasts, however, present a starkly divided view:
The Bearish Correction: Elliott Wave is flashing a warning that Bitcoin may be entering a "Wave 2" correction. This model suggests a potential "bull trap" relief rally back toward $100,000, followed by a final, painful crash to the $40,000–$50,000 range to wash out late-cycle leverage.
The Bullish Divergence: Contrarily, the "Harmonic Oscillator" and Bitcoin’s valuation relative to gold. With Bitcoin currently trading at a significant discount compared to gold’s market cap, historical Z-score data suggests that BTC could be primed for a 150% to 300% recovery within the next year, potentially targeting $150,000.
For the moment, the "Iran war" narrative is weighing heavy on the markets, keeping the $70,000 ceiling firmly in place. However, with Michael Saylor and Anthony Pompliano continuing to buy the sell-off, the "floor" for Bitcoin may be higher than many skeptics realize.
Market participants should watch the $65,000 support level closely; a daily close above $70,000 remains the key to unlocking the next phase of the bull market.
Gold’s (XAU/USD) $5000 Retest: Rate Cut Fears and Dollar Surge Lead to 5% Selloff
- Gold (XAU/USD) plunged 5%, surprisingly ignoring the escalating safe-haven demand from the Middle East conflict.
- The selloff is primarily driven by rising oil prices sparking inflation fears, which led to reduced Fed rate cut expectations and a surging US Dollar.
- The technical outlook focuses on the $5000/oz retest, will bulls return or not?
The price of gold has fallen 5% on Tuesday as a combination of profit taking and a US Dollar surge appear to be weighing on the precious metal. This is a surprise given the tension in the Middle East where regional escalation appears to be coming to fruition.
OAU Share CFDs on MT5
Middle East regional escalation
The Middle East has seen a sharp escalation in conflict following a series of coordinated strikes and diplomatic withdrawals.
On Tuesday, explosions rocked Tehran and Beirut, while Iranian drones targeted the US embassy in Saudi Arabia, resulting in a fire and minor structural damage. This follows a similar drone strike on the US mission in Kuwait, prompting Washington to shutter both embassies and order the evacuation of non-emergency personnel and their families across the region.
As the violence intensifies, the strategic scope of the war has become clearer. Despite recent ambiguous statements from President Donald Trump and Prime Minister Benjamin Netanyahu regarding the conflict's duration, sources indicate that Israel’s campaign is moving faster than its initial two-week timeline. The primary objective is reportedly the removal of Iran’s clerical leadership, a goal for which there is currently no firm deadline.
The theater of war has also expanded into Lebanon, where Hezbollah forces have engaged Israel, triggering retaliatory air strikes and the reinforcement of Israeli ground positions in the south. In Beirut, heavy smoke and constant explosions have come to define the skyline, with local authorities reporting dozens of casualties as the fighting spreads.
The conflict appears to be escalating which in theory should benefit haven demand and thus Gold prices. However, today's selloff in Gold has market participants in a state of confusion.
This begs the question, what is driving the selloff in Gold?
Rate cut expectations pared back, US dollar rises
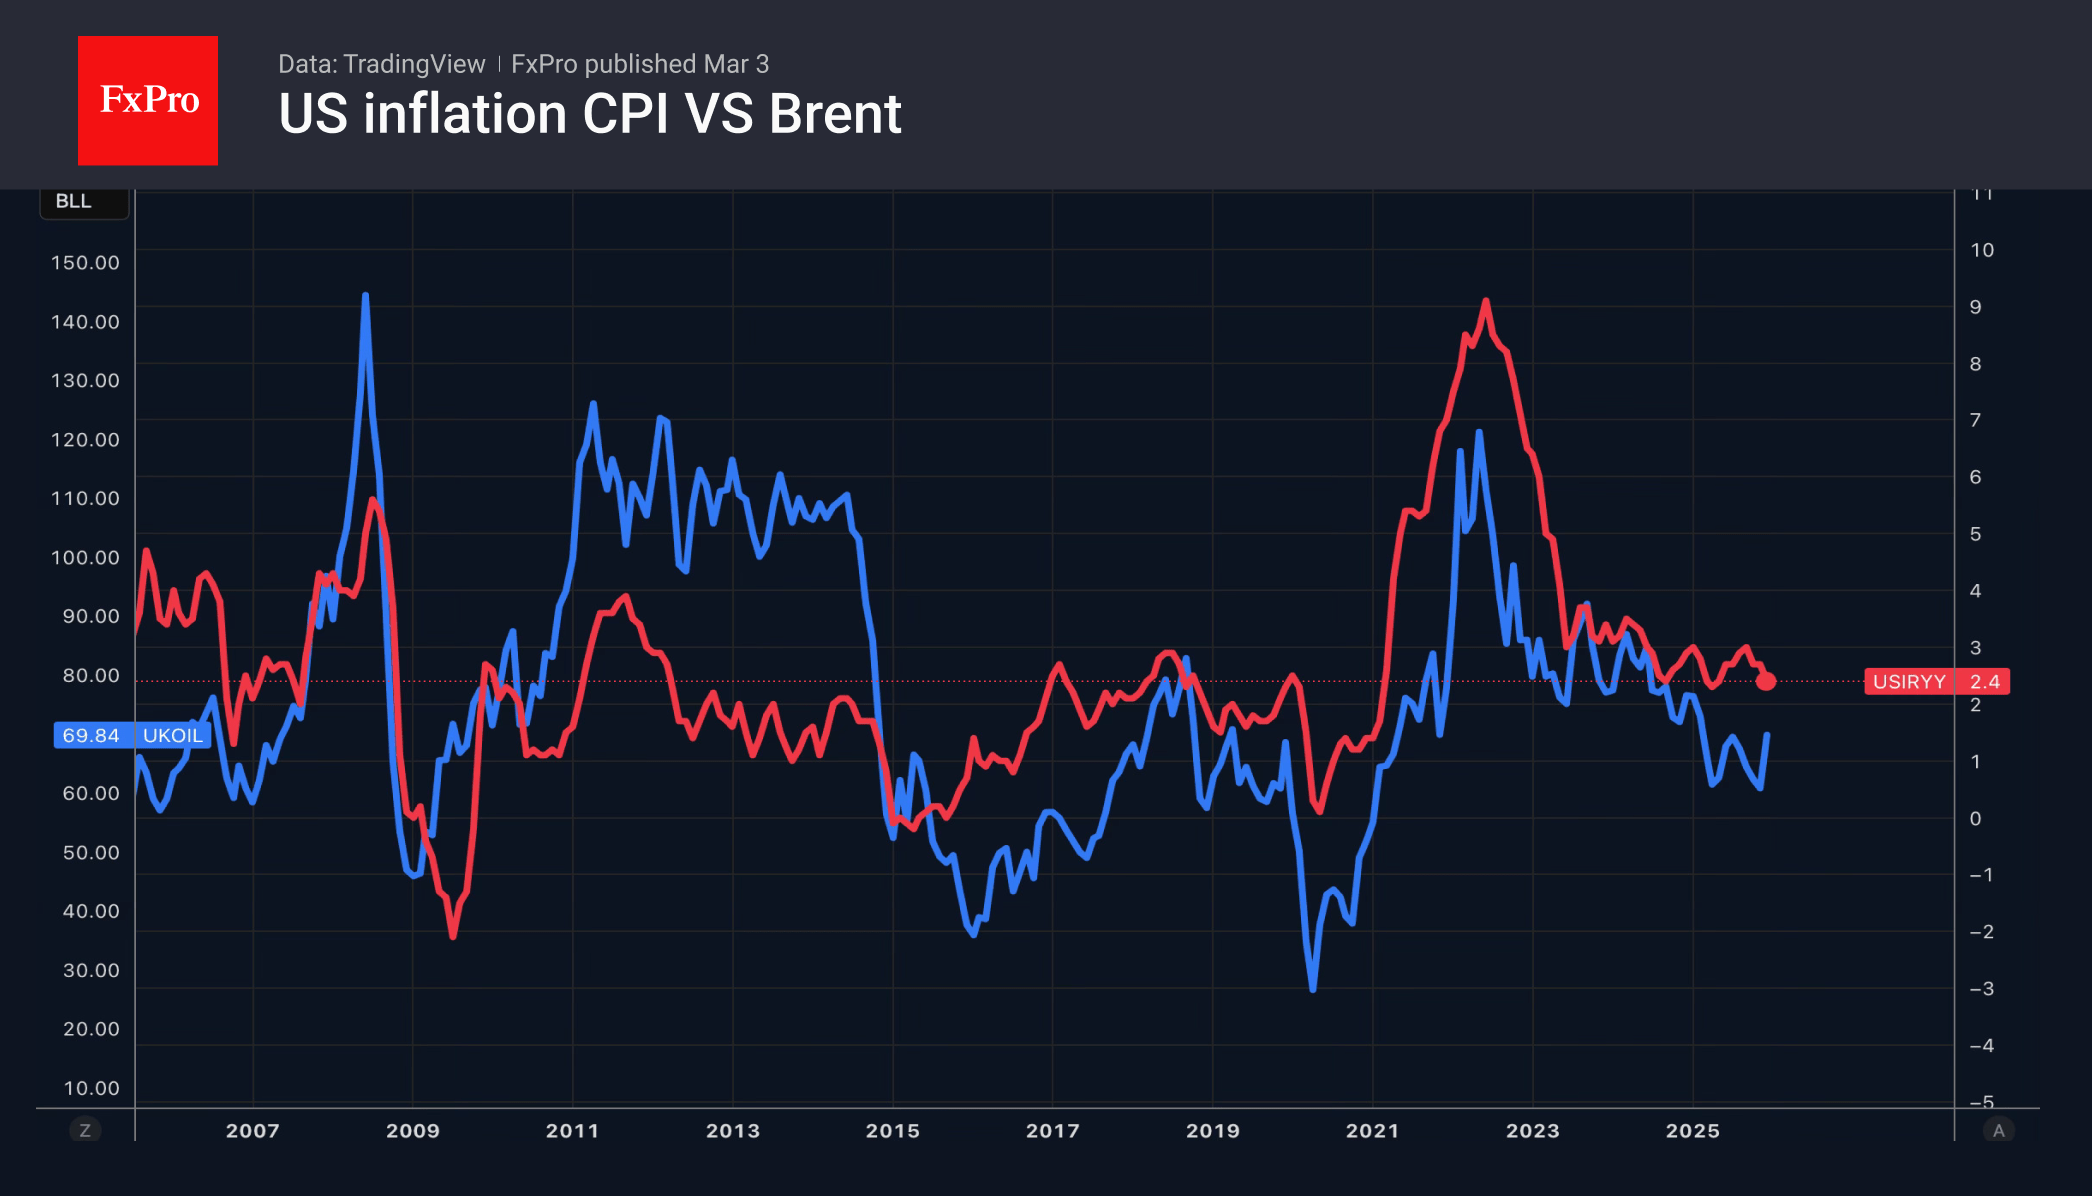
The simple answer may lie in inflationary concerns due to the rise in Oil prices.
WTI is up around 14% since the start of the week and this has led to concerns about the impact this may have on inflation down the road. Markets are paying attention to this and it is having an impact on rate cut expectations for the Federal Reserve.
Just last week markets were pricing in around 60bps of rate cuts through December 2026, that number has now dropped to around 46bps of cuts, according to the latest LSEG data. The number had dropped to around the 40bps mark earlier in the day.
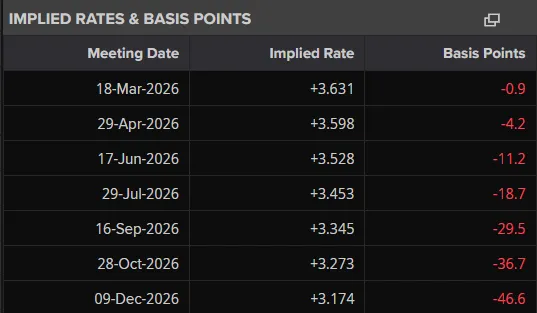
Source: LSEG
Mixed messaging from Fed officials today added to the concerns around inflation. Fed policymaker Schmid reiterated his concerns that demand is outpacing supply and that there is no room for complacency. However, Fed policymaker Williams struck a more upbeat tone, stating that recent inflation data has been reassuring.
It appears for now, inflationary concerns are driving a lot of volatility.
This coupled with the US dollar rising significantly as well appears to be weighing on the precious metal. The dollar appears to be the winner from safe haven flows at this stage as the Dollar Index (DXY) is trading at 6 week highs and approaching the psychological 100.00 level.
Another factor to consider is potential profit taking. After the surge in Gold prices after the weekend and at the start of the week, market participants could be locking in gains. This would lead to a drop off in the price of Gold as well and could be contributing to today's 5% decline.
Where to next? Technical Outlook - Gold (XAU/USD)
From a technical standpoint, looking at the H4 chart for gold below and a $5000/oz retest has taken place.
This key psychological barrier needs to hold if bulls are to return and recover some of today's losses.
We have seen a bounce already with gold trading at $5095/oz at the time of writing. This has brought the price of the precious metal back to test the 100-day MA which rests around the $5090/oz mark.
A move beyond this may find resistance at the previous swing low around the $5128/oz handle before the 50-day MA at $5179/oz comes into focus.
A move lower here will first need to record a four-hour candle close below the $5000/oz handle before a retest of support at $4965/oz and the swing low from February 17,, which rests around the $4850/oz handle.
Gold (XAU/USD) Four-Hour Chart, March 3, 2026
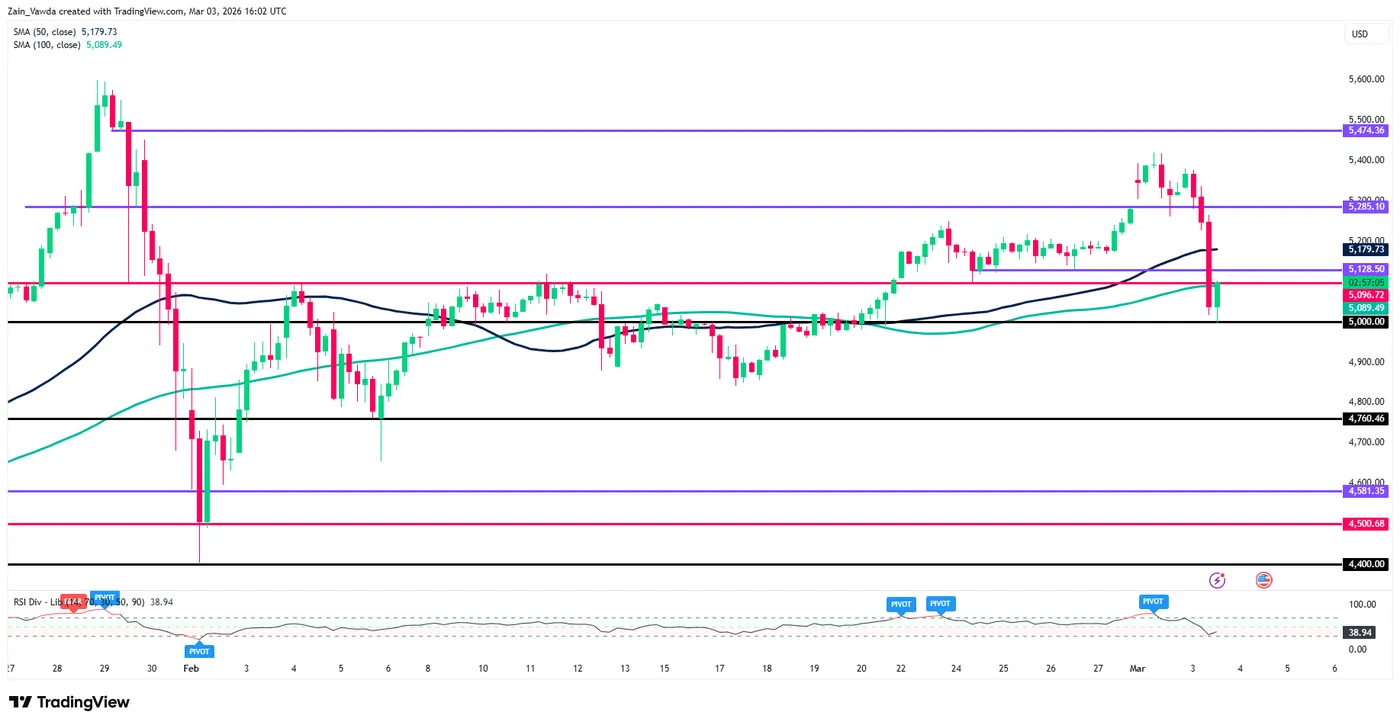
Source: TradingView (click to enlarge)
Dropping down to a 15-minute chart given how quickly price is moving at the moment may provide further insight.
Looking at the chart below, I have drawn in two descending trendlines, an outer and inner one.
These trendlines may be used in conjunction with your own analysis to track a potential rebound and find trading opportunities.
Gold (XAU/USD) 15M Chart, March 3, 2026
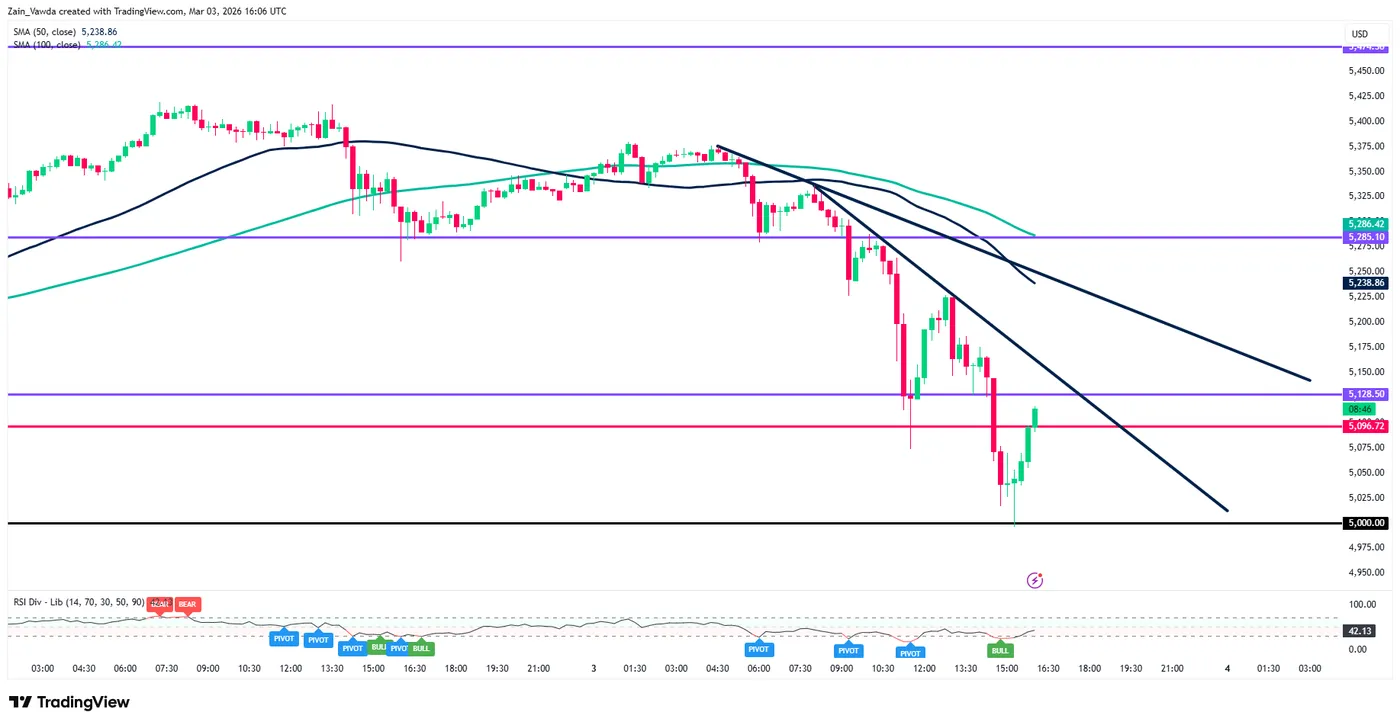
Source: TradingView (click to enlarge)
Eco Data 3/4/26
| GMT | Ccy | Events | Act | Cons | Prev | Rev |
|---|---|---|---|---|---|---|
| 21:45 | NZD | Terms of Trade Index Q4 | 3.70% | -0.20% | -2.10% | |
| 00:30 | AUD | GDP Q/Q Q4 | 0.80% | 0.70% | 0.40% | 0.50% |
| 00:30 | JPY | Services PMI Feb F | 53.8 | 53.8 | 53.8 | |
| 01:30 | CNY | NBS Manufacturing PMI Feb | 49 | 49.1 | 49.3 | |
| 01:30 | CNY | NBS Non-Manufacturing PMI Feb | 49.5 | 49.8 | 49.4 | |
| 01:45 | CNY | RatingDog Manufacturing PMI Feb | 52.1 | 50.2 | 50.3 | |
| 01:45 | CNY | RatingDog Services PMI Feb | 56.7 | 52.3 | 52.3 | |
| 05:00 | JPY | Consumer Confidence Index Feb | 40 | 38.2 | 37.9 | |
| 07:30 | CHF | CPI M/M Feb | 0.60% | 0.50% | -0.10% | |
| 07:30 | CHF | CPI Y/Y Feb | 0.10% | -0.10% | 0.10% | |
| 08:50 | EUR | France Services PMI Feb F | 49.6 | 49.6 | 49.6 | |
| 08:55 | EUR | Germany Services PMI Feb F | 53.5 | 53.4 | 53.4 | |
| 09:00 | EUR | Eurozone Services PMI Feb F | 51.9 | 51.8 | 51.8 | |
| 09:30 | GBP | Services PMI Feb F | 53.9 | 53.9 | 53.9 | |
| 10:00 | EUR | Eurozone Unemployment Rate Jan | 6.10% | 6.20% | 6.20% | |
| 10:00 | EUR | Eurozone PPI M/M Jan | 0.70% | 0.20% | -0.30% | |
| 10:00 | EUR | Eurozone PPI Y/Y Jan | -2.10% | -2.70% | -2.10% | |
| 13:15 | USD | ADP Employment Change Feb | 63K | 45K | 22K | 11K |
| 13:30 | CAD | Labor Productivity Q/Q Q4 | -0.10% | -0.10% | 0.90% | 1.10% |
| 15:00 | USD | ISM Services PMI Feb | 56.1 | 53.8 | 53.8 | |
| 15:30 | USD | Crude Oil Inventories (Feb 27) | 3.5M | 3.0M | 16.0M | |
| 19:00 | USD | Fed's Beige Book |
| 21:45 | NZD |
| Terms of Trade Index Q4 | |
| Actual | 3.70% |
| Consensus | -0.20% |
| Previous | -2.10% |
| 00:30 | AUD |
| GDP Q/Q Q4 | |
| Actual | 0.80% |
| Consensus | 0.70% |
| Previous | 0.40% |
| Revised | 0.50% |
| 00:30 | JPY |
| Services PMI Feb F | |
| Actual | 53.8 |
| Consensus | 53.8 |
| Previous | 53.8 |
| 01:30 | CNY |
| NBS Manufacturing PMI Feb | |
| Actual | 49 |
| Consensus | 49.1 |
| Previous | 49.3 |
| 01:30 | CNY |
| NBS Non-Manufacturing PMI Feb | |
| Actual | 49.5 |
| Consensus | 49.8 |
| Previous | 49.4 |
| 01:45 | CNY |
| RatingDog Manufacturing PMI Feb | |
| Actual | 52.1 |
| Consensus | 50.2 |
| Previous | 50.3 |
| 01:45 | CNY |
| RatingDog Services PMI Feb | |
| Actual | 56.7 |
| Consensus | 52.3 |
| Previous | 52.3 |
| 05:00 | JPY |
| Consumer Confidence Index Feb | |
| Actual | 40 |
| Consensus | 38.2 |
| Previous | 37.9 |
| 07:30 | CHF |
| CPI M/M Feb | |
| Actual | 0.60% |
| Consensus | 0.50% |
| Previous | -0.10% |
| 07:30 | CHF |
| CPI Y/Y Feb | |
| Actual | 0.10% |
| Consensus | -0.10% |
| Previous | 0.10% |
| 08:50 | EUR |
| France Services PMI Feb F | |
| Actual | 49.6 |
| Consensus | 49.6 |
| Previous | 49.6 |
| 08:55 | EUR |
| Germany Services PMI Feb F | |
| Actual | 53.5 |
| Consensus | 53.4 |
| Previous | 53.4 |
| 09:00 | EUR |
| Eurozone Services PMI Feb F | |
| Actual | 51.9 |
| Consensus | 51.8 |
| Previous | 51.8 |
| 09:30 | GBP |
| Services PMI Feb F | |
| Actual | 53.9 |
| Consensus | 53.9 |
| Previous | 53.9 |
| 10:00 | EUR |
| Eurozone Unemployment Rate Jan | |
| Actual | 6.10% |
| Consensus | 6.20% |
| Previous | 6.20% |
| 10:00 | EUR |
| Eurozone PPI M/M Jan | |
| Actual | 0.70% |
| Consensus | 0.20% |
| Previous | -0.30% |
| 10:00 | EUR |
| Eurozone PPI Y/Y Jan | |
| Actual | -2.10% |
| Consensus | -2.70% |
| Previous | -2.10% |
| 13:15 | USD |
| ADP Employment Change Feb | |
| Actual | 63K |
| Consensus | 45K |
| Previous | 22K |
| Revised | 11K |
| 13:30 | CAD |
| Labor Productivity Q/Q Q4 | |
| Actual | -0.10% |
| Consensus | -0.10% |
| Previous | 0.90% |
| Revised | 1.10% |
| 15:00 | USD |
| ISM Services PMI Feb | |
| Actual | 56.1 |
| Consensus | 53.8 |
| Previous | 53.8 |
| 15:30 | USD |
| Crude Oil Inventories (Feb 27) | |
| Actual | 3.5M |
| Consensus | 3.0M |
| Previous | 16.0M |
| 19:00 | USD |
| Fed's Beige Book | |
| Actual | |
| Consensus | |
| Previous | |
Sunset Market Commentary
Markets
The overall (risk-off) repricing due to the military action of the US and Israel against Iran continues along the same lines already set out yesterday. Energy availability and the potential economic damage from higher oil and gas prices are the yardstick for global markets’ trading. The European Dutch gas reference contract (TTF) this morning jumped another 30%, almost doubling from levels seen no longer than 10 days ago (currently off intraday top but still at €56p/Mwh compared to less than €30/mwh 10 days ago). Brent also extends its ascent ($84/b). Higher energy prices in the post-Covid/energy crisis era are making it difficult for central banks who are in the fine-tuning phase of easing (like the Fed or the Bank of England, also most CEE countries) to walk the final mile to neural. For others that have already reached a neutral level (including the ECB), markets ponder whether they might be forced to hike sooner than expected. Eco data in this context might be considered coming from a previous era/being outdated. Even so, higher than expected February EMU CPI’s evidently didn’t help to ease concerns. EMU headline inflation unexpectedly jumped 0.7% M/M raising the Y/Y measure to 1.9% from 1.7% (unchanged expected). Core inflation 2.4% (from 2.2%), services inflation (0.8% M/M and 3.4% from 3.2%) as well as non-energy industrial goods prices (0.7% M/M and 0.7% Y/Y from -2.4%) all accelerated. ECB chief economist Lane already openly acknowledged inflation risks from higher energy prices. ECB’s Villeroy advocated that the ECB won’t decide on interest rates based just on energy prices. Even so, markets clearly feel in what direction the monetary pendule swings. The German yield curve again bear flattens with yields adding between 11 bps (2 & 5-y) and 5 bps (30-y). Markets already price a 50% probability of an ECB rate HIKE by year-end. Something else to keep an eye on: intraday EMU spreads, which were a place of almost absolute calm of late also start widening (Greece +6 bps; France +5 bps and Italy + 7 bps vs Germany). The US yield curve shows a similar, slightly more modest flattening move adding between 8 bps (2-y ) and 5 bps (30-y). Higher inflation/risk premia and stagflationary fears hammer equities across the board. The Eurostoxx 50 (-3.8 %) already trades >7% off last week’s record. US indices this time don’t escape anymore as was the case yesterday. opening with losses of about 2%. More of the same also on FX markets. The dollar has the upper hand with DXY rising 0.9% to 99.3, nearing the YTD top (99.50 area). The yen weakens (modestly) against the dollar (USD/JPY 157.85) but outperforms the euro (EUR/JPY at 182.75 from 184). EUR/USD is (at risk of) breaking the YTD low (1.1573). On CEE markets, a risk-off correction in the likes of the CZK (EUR/CZK 24.38 from 24.27), the forint (EUR/HUF 389.5 from 380) and the zloty (EUR/PLN 4.29 from 4.24) deprives regional central banks from their room to consider further easing anytime soon. First reality check tomorrow with the NBP policy decision. In the UK Chancelor of the Exchequer Reeves today revealed a (skeleton) budget update. The OBR slightly downwardly revised the 2026 growth forecast (1.1% from 1.4%), but sees the fiscal buffer in 2029/30 slightly higher than in November at £23.6bn (from £21.7bn). Improved finances also allow the UK Treasury to reduce bond sales next fiscal year (£252.1bn from £303.7bn this year). EUR/GBP hovers in the low 0.87 area.
News & Views
The refined estimate of Czech Q4 GDP showed an upward revision from 0.5% Q/Q and 2.4% Y/Y to 0.6% Q/Q and 2.6% Y/Y. The results slightly exceeded the Czech National Bank’s MPR Winter forecasts. In 2025 as a whole, the Czech economy grew at the fastest pace since 2022 (2.6%) with the CNB expecting a slight acceleration to 3% this year. On the demand side, details showed broad-based strength. Higher final consumption expenditure (+1.3% Q/Q & +3.2% Y/Y) and gross fixed capital formation (+1.7% Q/Q & +5.3% Y/Y) were the key factors of quarterly GDP growth. External demand (exports +0.8% Q/Q & +5.1% Y/Y and imports +0.6% Q/Q & +5.3% Y/Y)) and government consumption (+1% Q/Q & +2.5% Y/Y) also had a positive contribution while a change in inventories had a negative influence. A supply-side breakdown showed especially strong contributions from manufacturing (+2.2% Q/Q) and financial and insurance activities (+2.7% Q/Q). Construction activity (-3.3% Q/Q) acted as a drag. As for price developments, the GDP deflator increased by 1% Q/Q and 3.9% Y/Y. Total employment was unchanged in Q4 to be up 1% Y/Y. Higher energy prices and risk aversion weigh on the Czech krone today with EUR/CZK testing the upper bound of the sideways range in place since the start of Q4 2025 at 24.40. The Czech 2y swap yield extends yesterday up leg to currently trade at 3.6% (vs 3.35% close on Friday).
Fed’s Williams: Further rate cuts likely if inflation cools as expected
New York Fed President John Williams reiterated that monetary policy remains appropriately calibrated, but left the door open to additional rate cuts if inflation continues to moderate. He said "further reductions in the federal funds rate will eventually be warranted" to avoid unintended tightening should price pressures follow the expected path lower.
Williams projected US economic growth of 2.5% this year, supported by fiscal stimulus, favorable financial conditions and ongoing artificial intelligence investment. He described the labor market as stable in a low-hire, low-fire equilibrium, with unemployment expected to drift lower over the coming year and into 2027.
While acknowledging that tariffs have contributed meaningfully to inflation this year, Williams expects their influence to diminish as the year progresses. He sees PCE inflation easing to around 2.5% in 2026 before returning to the Fed’s 2% goal in 2027.
He also noted that the costs of import tariffs are overwhelmingly absorbed domestically rather than by foreign producers.
Euro Spooked by Crisis
- The US dollar is rising on a flight to safe havens.
- EURUSD under pressure from soaring energy prices.
Rising oil prices and US Treasury yields have created the perfect environment for the US dollar. According to Fed research, a 10% surge in crude oil prices will push inflation up by 0.15 percentage points next year. The central bank underestimated the impact of the Brent and WTI rally before 2022. As a result, it had to later raise rates aggressively. The futures market has pushed expectations for the new Fed rate cut from June to July, causing the EURUSD to fall.
The rally in Treasury yields is driven by expectations that the Fed will keep rates high and the risks of accelerating inflation, as well as confidence in the strength of the US economy. The US is a net exporter of energy commodities, and its trade balance will benefit from rising oil and gas prices due to the armed conflict in the Middle East. Europe, on the other hand, imports these raw materials. The surge in their cost draws parallels with the energy crisis in 2021-2022, when the EURUSD briefly traded below parity.
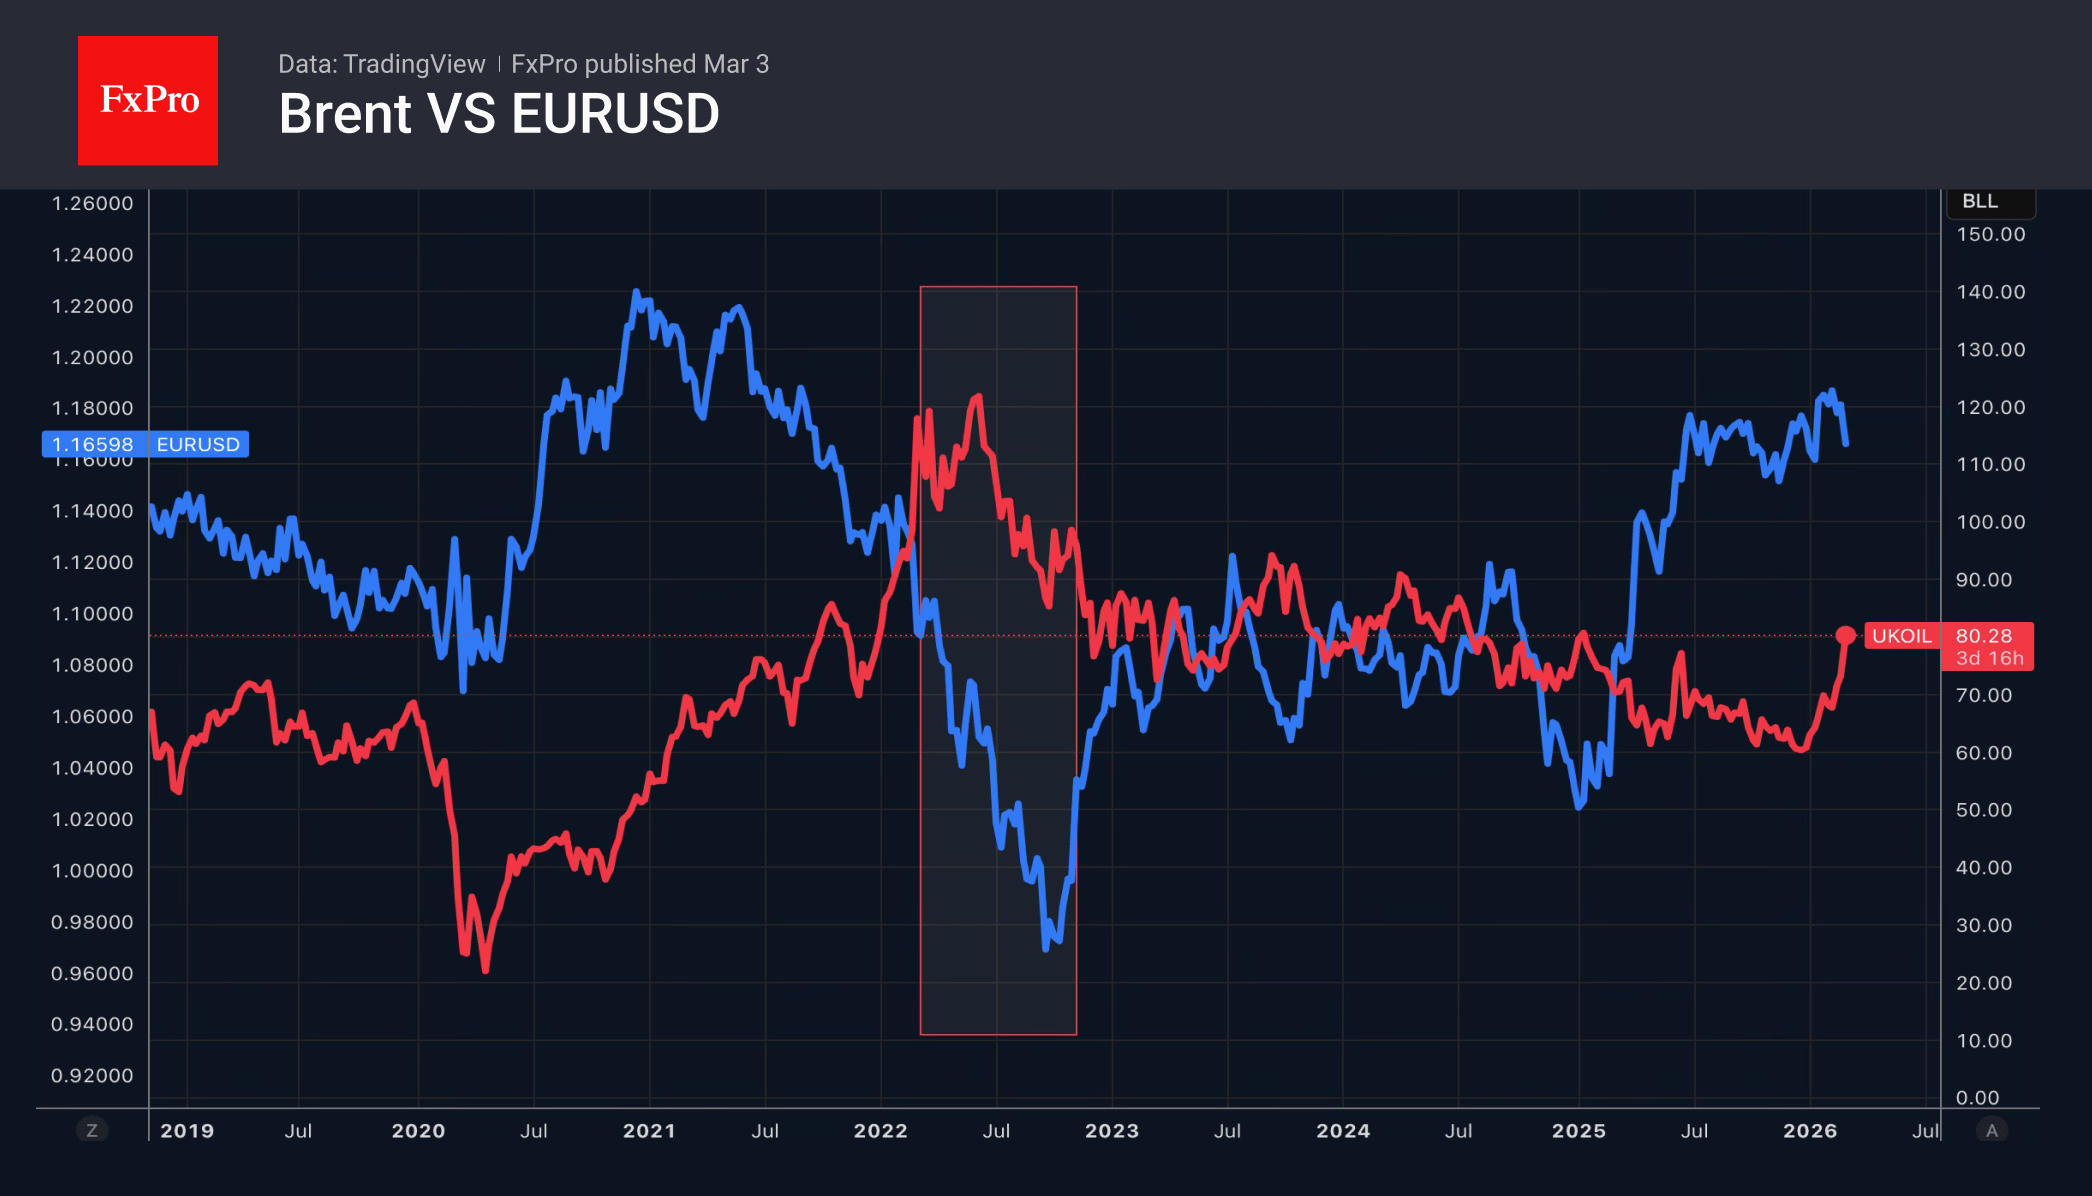
Whether or not history repeats itself will depend on developments in the Middle East. A protracted conflict with reduced oil supplies and production in the region will cause Brent to soar to $120 per barrel. The US dollar will strengthen sharply against major world currencies. European currencies, led by the euro, will be the main victims.
The strengthening of the US dollar has led to USDJPY soaring to its highest levels since January. As a result, Japanese Finance Minister Satsuki Katayama was forced to resort to verbal intervention. According to her, the government is monitoring forex movements with a sense of urgency. It will take the necessary measures, working closely and deftly with foreign authorities.
The rise in Treasury bond yields and the US dollar is creating an unfavourable environment for gold. Supported by geopolitics, the precious metal was forced to retreat and is trying to hold on to $5,300 per ounce.
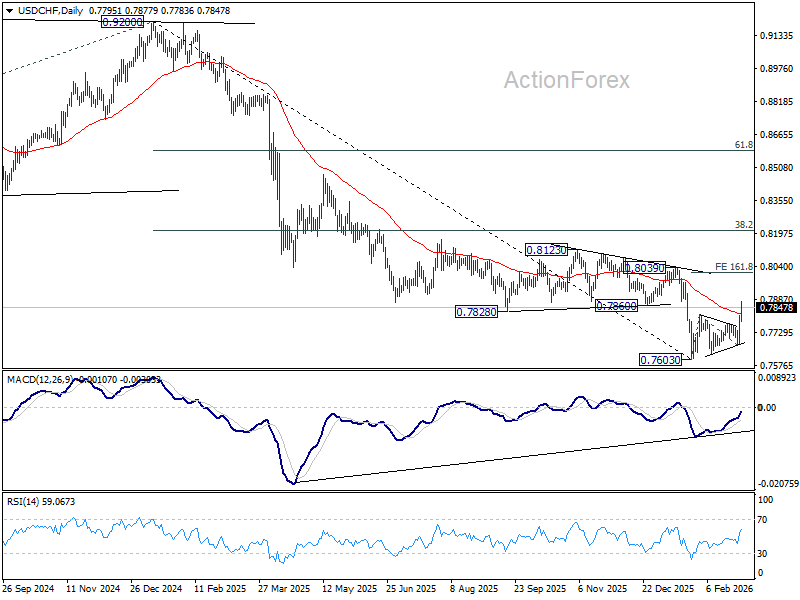
USD/CHF Mid-Day Outlook
Daily Pivots: (S1) 0.7706; (P) 0.7760; (R1) 0.7848; More….
USD/CHF's strong break of 55 D EMA (now at 0.7818) suggests that a medium term bottom could be formed at 0.7603 already. Intraday bias is back on the upside for 161.8% projection of 0.7603 to 0.7816 from 0.7671 at 0.8016. On the downside, though, below 0.7777 minor support will turn bias neutral again first.
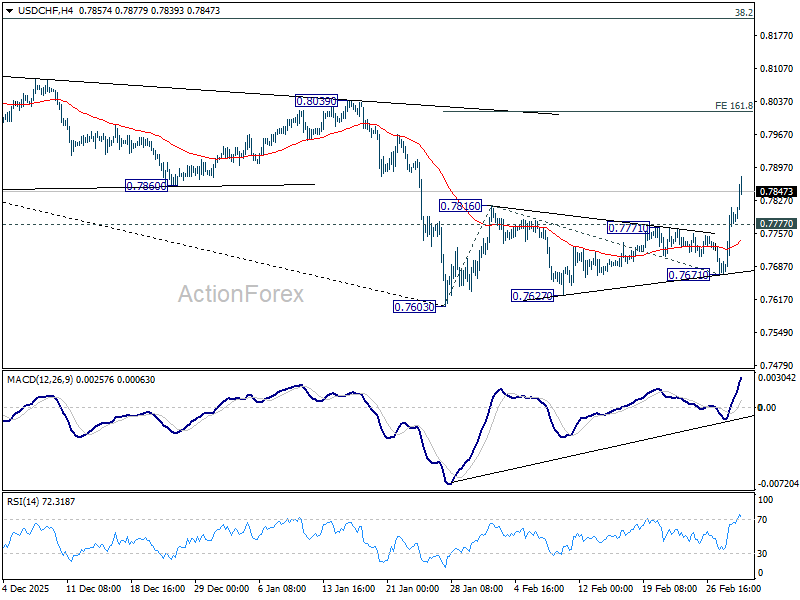
In the bigger picture, a medium term bottom could be in place at 0.7603 on bullish convergence condition in D MACD, Firm break of 0.8039 resistance will argue that it's at least correcting the down trend from 0.9002. Stronger rebound would then be seen to 38.2% retracement of 0.9200 to 0.7603 at 0.8213.
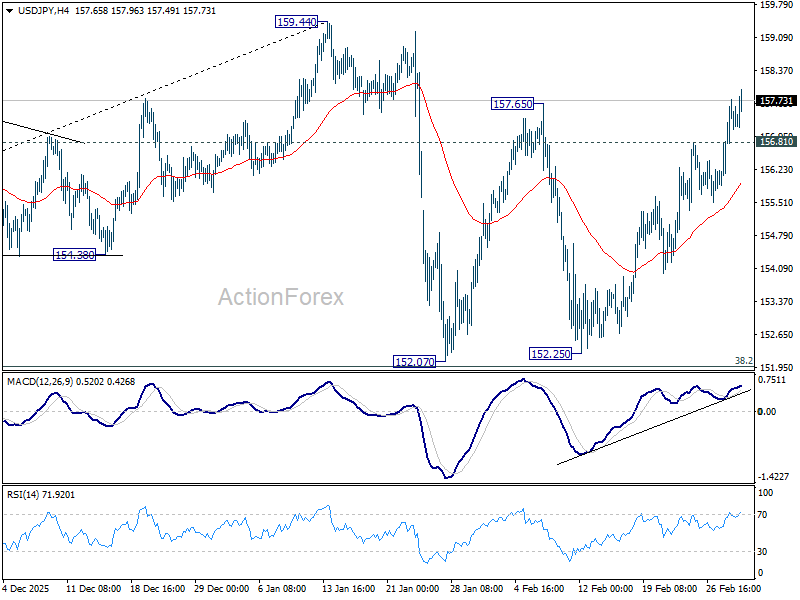
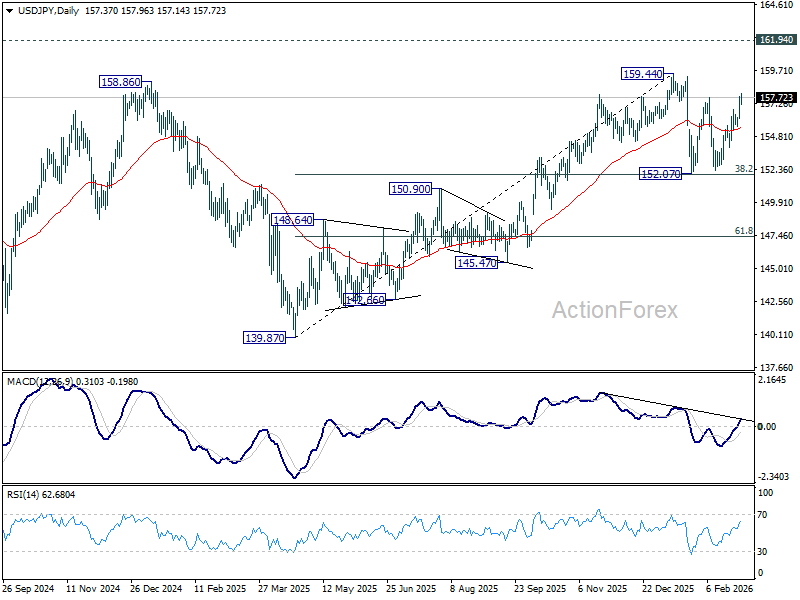
USD/JPY Mid-Day Outlook
Daily Pivots: (S1) 156.30; (P) 157.03; (R1) 158.08; More...
Intraday bias in USD/JPY remains on the upside at this point. Rise from 152.25 should now target a retest on 159.44 high. On the downside, below 156.81 minor support will turn intraday bias neutral first. Overall, price actions from 159.44 are viewed as a near term consolidation pattern. Outlook will remain bullish as long as 38.2% retracement of 139.87 to 159.44 at 151.96 holds.
In the bigger picture, outlook is unchanged that corrective pattern from 161.94 (2024 high) should have completed with three waves at 139.87. Larger up trend from 102.58 (2021 low) could be ready to resume through 161.94. This will remain the favored case as long as 55 W EMA (now at 152.16) holds. However, sustained break of 55 W EMA will argue that the pattern from 161.94 is extending with another falling leg.
GBP/USD Mid-Day Outlook
Daily Pivots: (S1) 1.3329; (P) 1.3393; (R1) 1.3470; More...
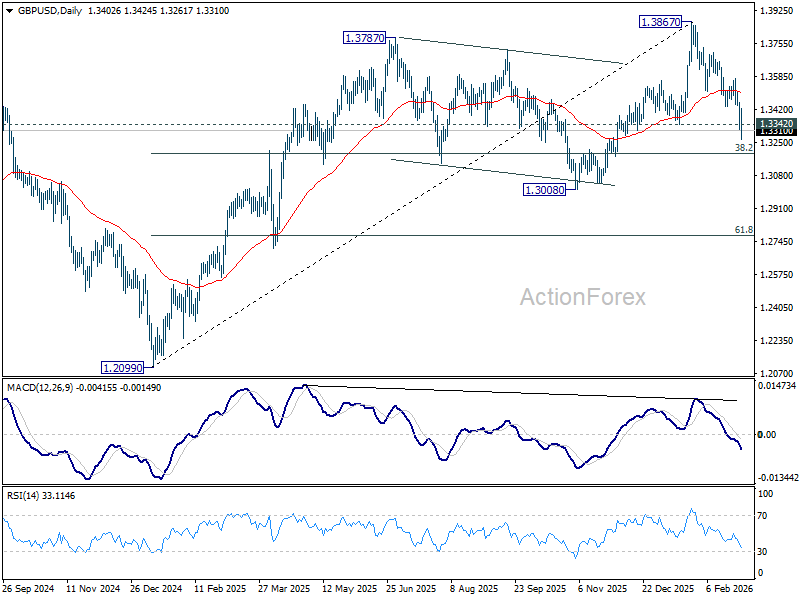
GBP/USD's break of 1.3343 support suggests that a medium term top was formed at 1.3867. Fall from there should at least be correcting the rise from 1.2009. Intraday bias stays on the downside for 38.2% retracement of 1.2099 to 1.3867 at 1.3192. Sustained break there will pave the way to 1.3008 support. For now, risk will stay on the downside as long as 1.3574 resistance holds, in case of recovery.
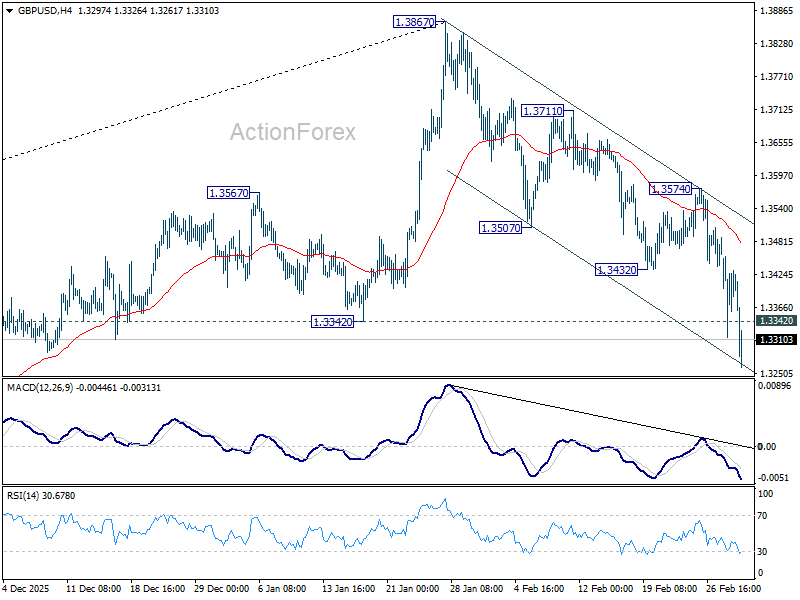
In the bigger picture, as long as 1.3008 support holds, rise from 1.3051 (2022 low) should still be in progress for 1.4284 key resistance (2021 high). Decisive break there will add to the case of long term bullish trend reversal. However, firm break of 1.3008 will raise the chance of medium term bearish reversal and target 1.2099 support next.
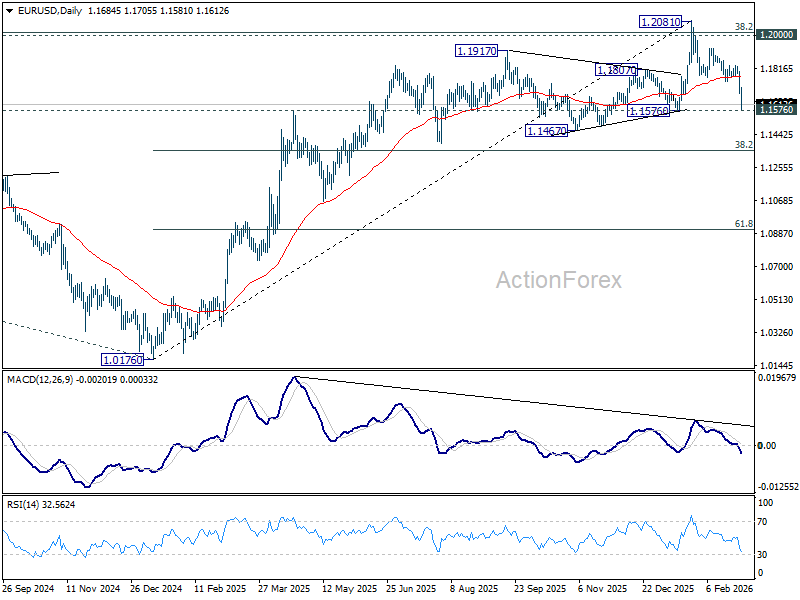
EUR/USD Mid-Day Outlook
Daily Pivots: (S1) 1.1641; (P) 1.1719; (R1) 1.1765; More….
Intraday bias in EUR/USD remains on the downside, and immediate focus is now on 1.1576 structural support. Firm break there would confirm rejection by 1.2 key psychological level. That should also confirm medium term topping on bearish divergence condition in D MACD. Further decline should be seen to 38.2% retracement of 1.0176 to 1.2081 at 1.1353 next. For now, risk will stay on the downside as long as 1.1740 support turned resistance holds, in case of recovery.
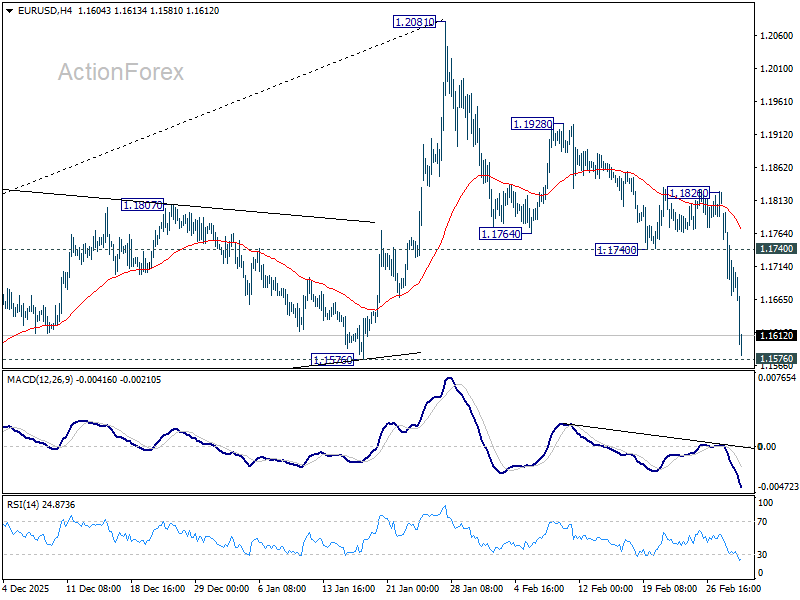
In the bigger picture, as long as 55 W EMA (now at 1.1494) holds, up trend from 0.9534 (2022 low) is still in favor to continue. Decisive break of 1.2 key psychological level will add to the case of long term bullish trend reversal. Next medium term target will be 138.2% projection of 0.9534 to 1.1274 from 1.0176 at 1.2581. However, sustained trading below 55 W EMA will argue that rise from 0.9534 has completed as a three wave corrective bounce, and keep long term outlook bearish.