

Sample Category Title
EUR/JPY Daily Outlook
Daily Pivots: (S1) 183.92; (P) 184.35; (R1) 185.04; More...
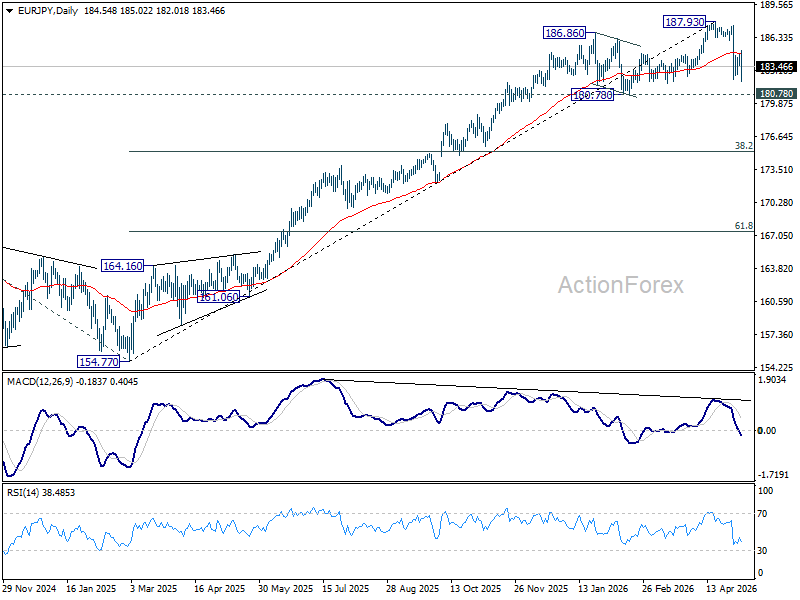
EUR/JPY's breach of 182.28 suggests that consolidation from there has completed at 185.02, and fall from 187.93 is resuming. Intraday bias is back on the downside for 180.78 support next. For now, risk will stay on the downside as long as 185.02 resistance holds, in case of recovery.
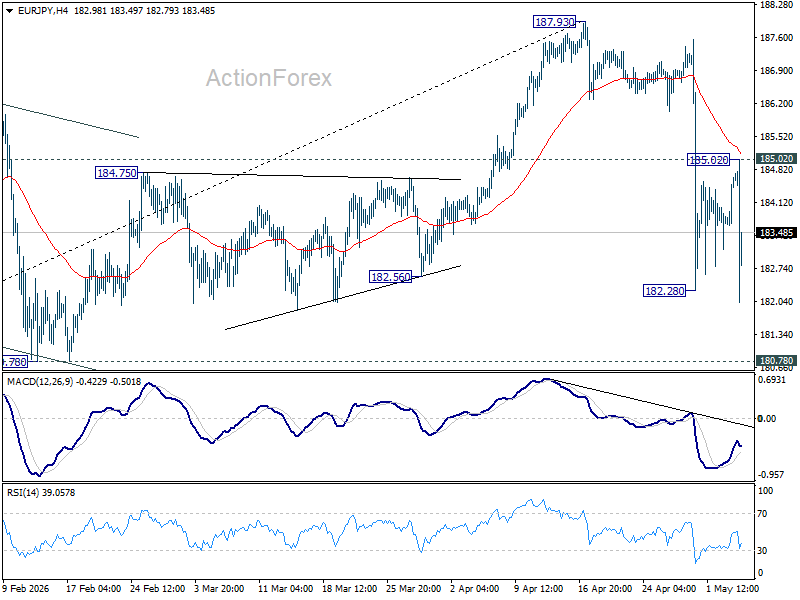
In the bigger picture, the pullback from 187.93 is steep, there is no sign of reversal yet. Uptrend from 114.42 is still expected to resume at a later stage to 78.6% projection of 124.37 (2022 low) to 175.41 (2025 high) from 154.77 at 194.88. However, sustained break of 55 W EMA (now at 177.76) will argue that it's already in a medium term down trend to 175.41 resistance turned support and below.
EUR/GBP Daily Outlook
Daily Pivots: (S1) 0.8625; (P) 0.8635; (R1) 0.8648; More…
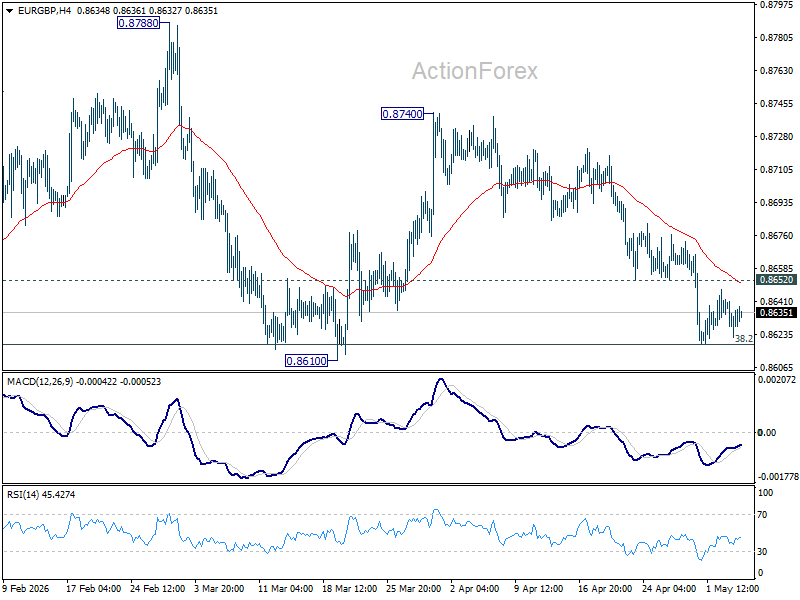
Intraday bias in EUR/GBP remains neutral for the moment, and further fall is expected with 0.8652 support turned resistance intact. . On the downside, decisive break of 0.8610 key support carry larger bearish implications and pave the way to 0.8466 fibonacci level next. However, firm break of 0.8652 will turn bias back to the upside for stronger rebound to 55 D EMA (now at 0.8677) and above.
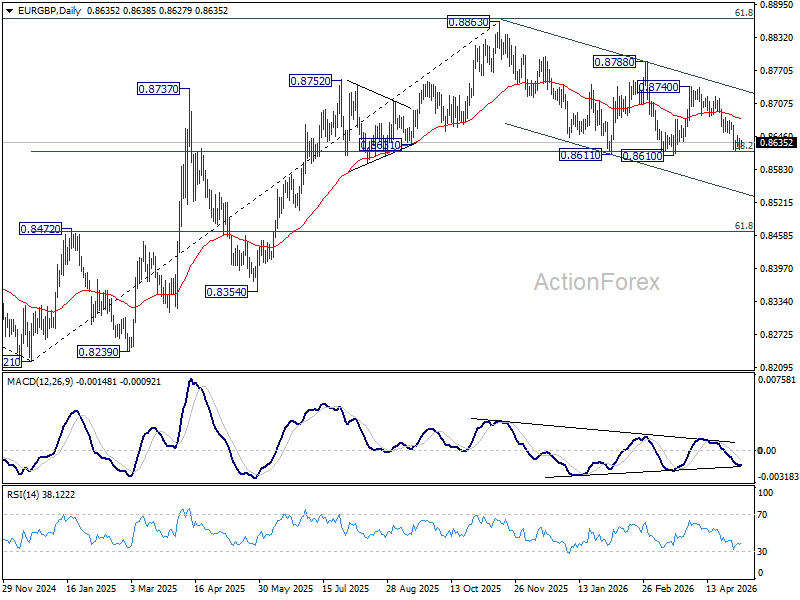
In the bigger picture, focus is back on 38.2% retracement of 0.8821 to 0.8863 at 0.8618. Sustained break there will confirm that whole rise from 0.8221 has completed at 0.8863. Deeper decline should then be seen to 61.8% retracement at 0.8466 at least. For now, risk will stay mildly on the downside as long as 55 D EMA (now at 0.8680) holds, in case of recovery.
EUR/AUD Daily Outlook
Daily Pivots: (S1) 1.6240; (P) 1.6307; (R1) 1.6347; More...
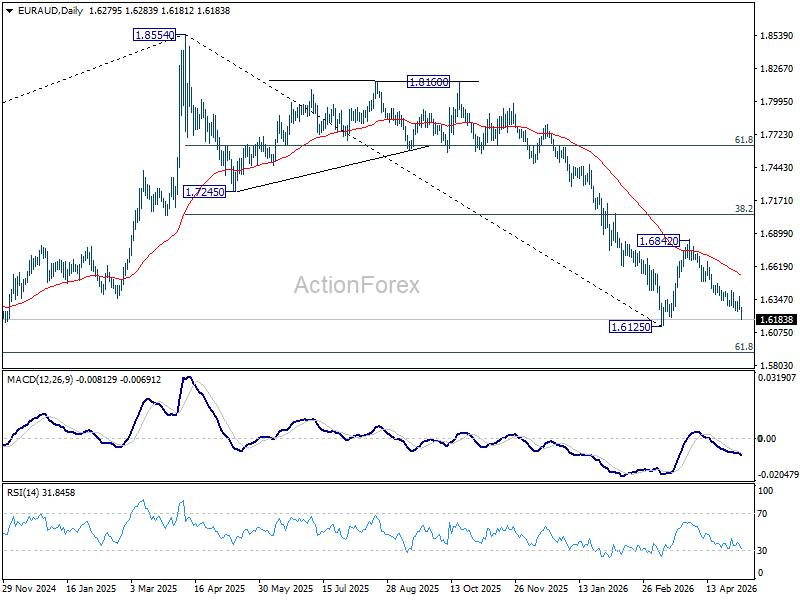
EUR/AUD's fall from 1.6824 resumed after brief consolidations and intraday bias is back on the downside. Decisive break of 1.6125 low will confirm resumption of whole down trend from 1.8554. For now, risk will stay on the downside as long as 1.6371 resistance holds, in case of recovery.
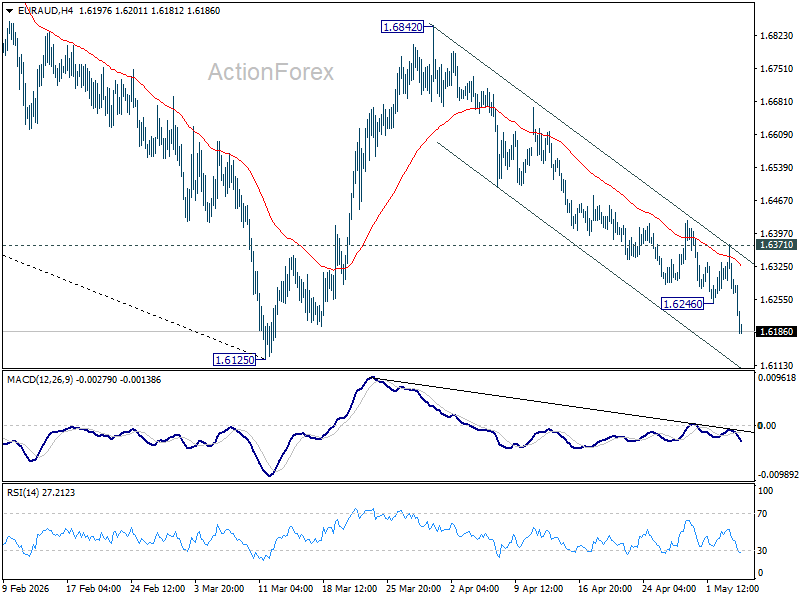
In the bigger picture, fall from 1.8554 (2025 high) is in progress and deeper decline should be seen to 61.8% retracement of 1.4281 to 1.8554 at 1.5913, which is slightly below 1.5963 structural support. Decisive break there will pave the way back to 1.4281 (2022 low). For now, risk will stay on the downside as long as 55 W EMA (now at 1.7069) holds, even in case of strong rebound.
EUR/CHF Daily Outlook
Daily Pivots: (S1) 0.9148; (P) 0.9160; (R1) 0.9171; More....
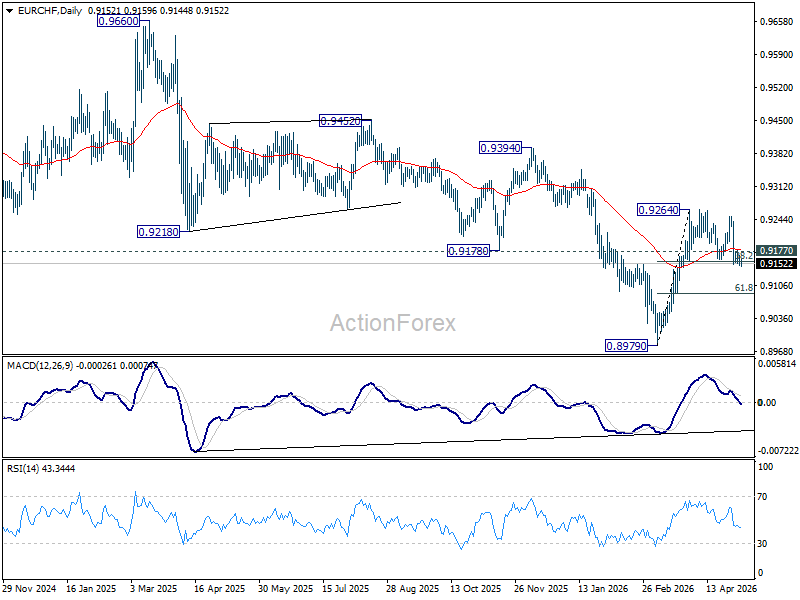
Intraday bias in EUR/CHF remains neutral first. On the upside, above 0.9177 minor resistance will bring stronger rebound back to 0.9264 resistance. However, sustained break of 0.9155 cluster support (38.2% retracement of 0.8979 to 0.9264 at 0.9155) break of 0.9155 will turn bias back to the downside for deeper pullback to 61.8% retracement at 0.9088 and possibly below.
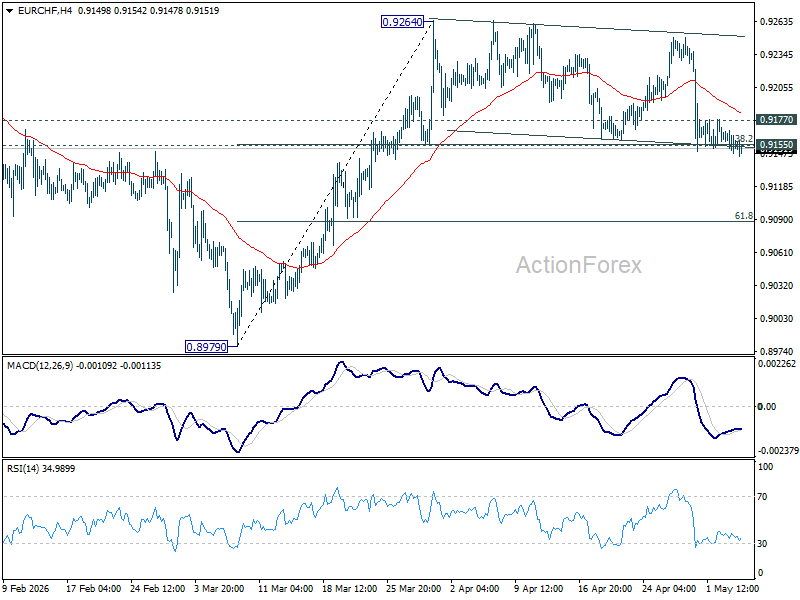
In the bigger picture, considering bullish convergence condition in W MACD, a medium term bottom should be in place at 0.8979. Sustained trading above 55 W EMA (now at 0.9268) will add more credence to this case. Further break of 0.9394 resistance will pave the way to 0.9660 resistance next. However rejection by the 55 W EMA will set up another fall through 0.8979 low at a later stage.
AUD/USD Daily Report
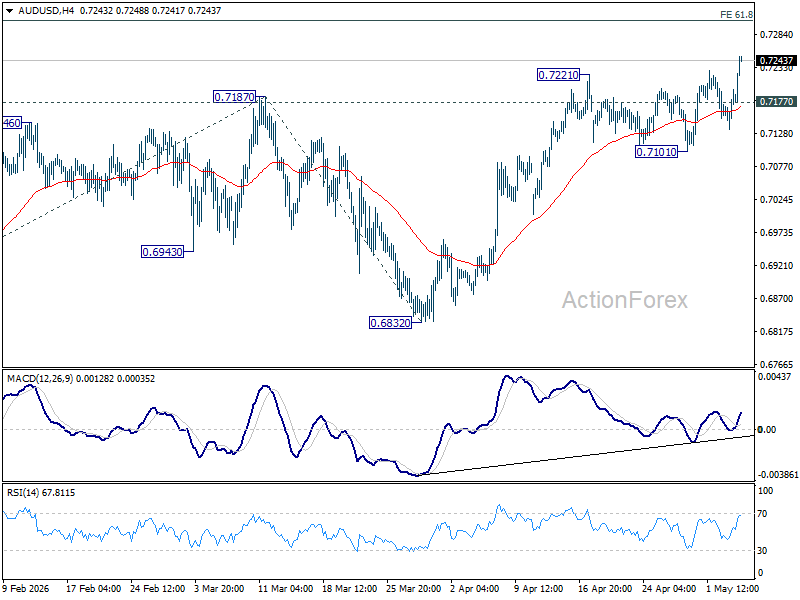
Daily Pivots: (S1) 0.7146; (P) 0.7172; (R1) 0.7210; More...
AUD/USD's rally resumed after brief consolidations and intraday bias is back on the upside. Next target is 61.8% projection of 0.6420 to 0.7187 from 0.6832 at 0.7306. On the downside, below 0.7177 minor support will turn intraday bias neutral again. But outlook will remain bullish as long as 0.7101 support holds, in case of retreat.
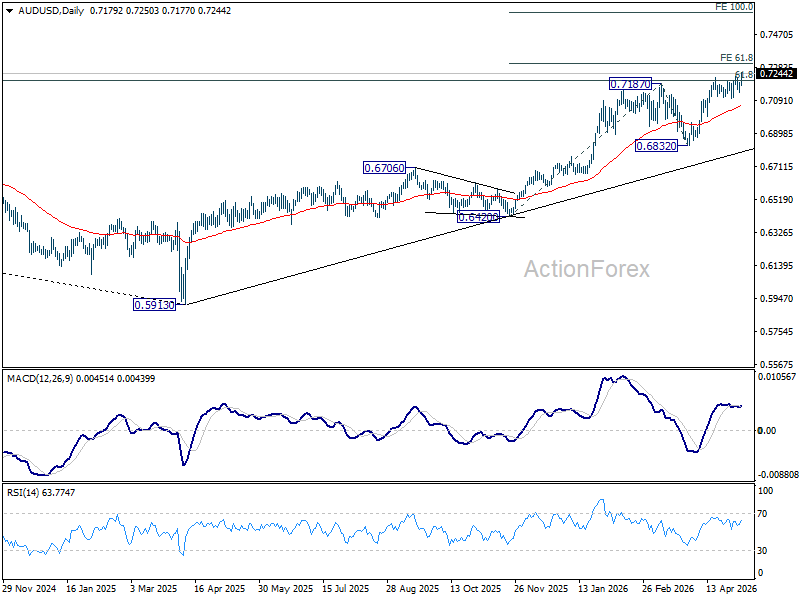
In the bigger picture, rise from 0.5913 (2024 low) is still in progress. Decisive break of 61.8% retracement of 0.8006 to 0.5913 at 0.7206 will solidify the case that it's already reversing the down trend from 0.8006 (2021 high). Further rally should then be seen to retest 0.8006. For now, outlook will remain bullish as long as 0.6832 support holds, in case of pullback.
USD/CAD Daily Outlook
Daily Pivots: (S1) 1.3606; (P) 1.3618; (R1) 1.3633; More...
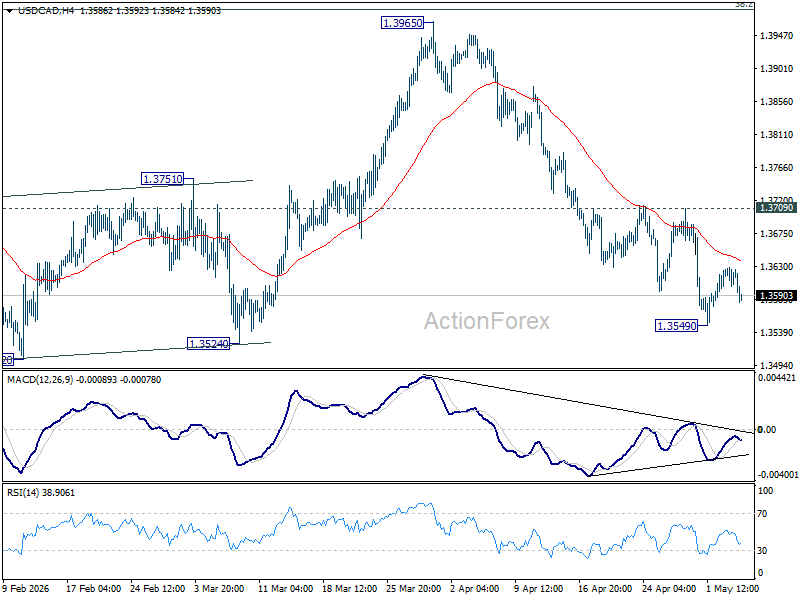
Intraday bias in USD/CAD remains neutral for consolidations above 1.3549. Further decline is expected as long as 1.3709 resistance holds. Below 1.3549 will resume the fall from 1.3965 to retest 1.3480 low. Decisive break there will resume whole down trend from 1.4791. However, firm break of 1.3709 will turn bias back to the upside for stronger rebound.
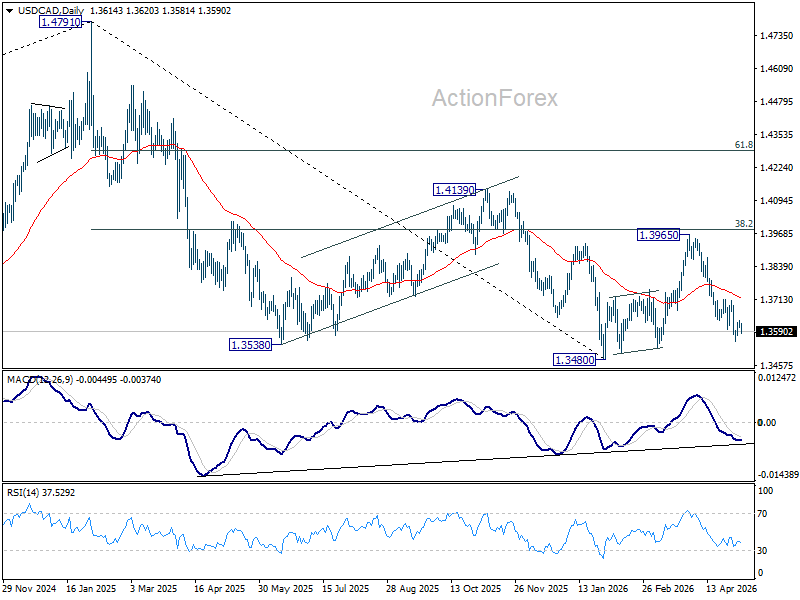
In the bigger picture, price actions from 1.4791 are seen as a corrective pattern to the whole up trend from 1.2005 (2021 low). Deeper fall could be seen, as the pattern extends, to 61.8% retracement of 1.2005 to 1.4791 at 1.3069. However, decisive break of 38.2% retracement of 1.4791 to 1.3480 at 1.3981 will argue that the correction has completed with three waves down to 1.3480 already.
EUR/USD Daily Outlook
Daily Pivots: (S1) 1.1674; (P) 1.1695; (R1) 1.1713; More….
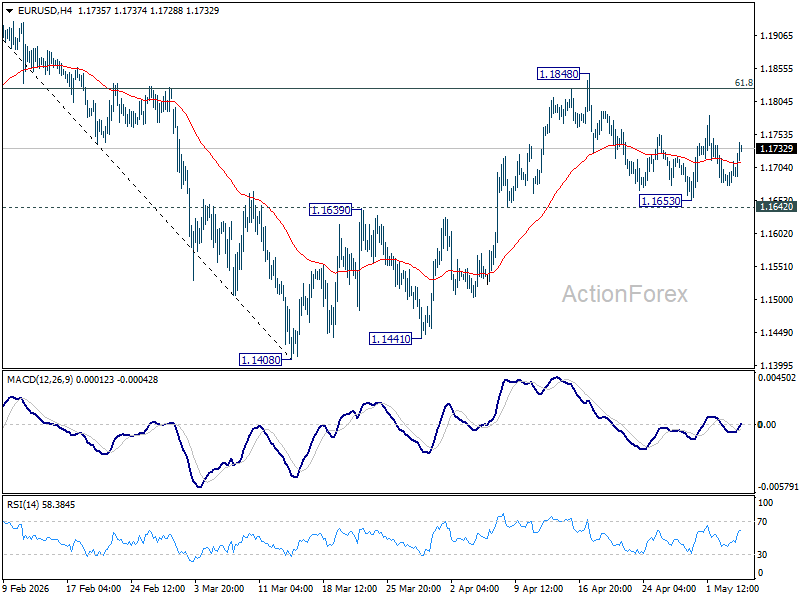
EURUSD is staying in sideway trading and intraday bias remains neutral. With 1.1642 support intact, rise from 1.1408 is expected to continue. On the upside, firm break of 1.1848 will target 1.2081 high next. However, firm break of 1.1662 support will indicate the the rebound from 1.1408 has completed, and bring deeper decline back towards this low instead.
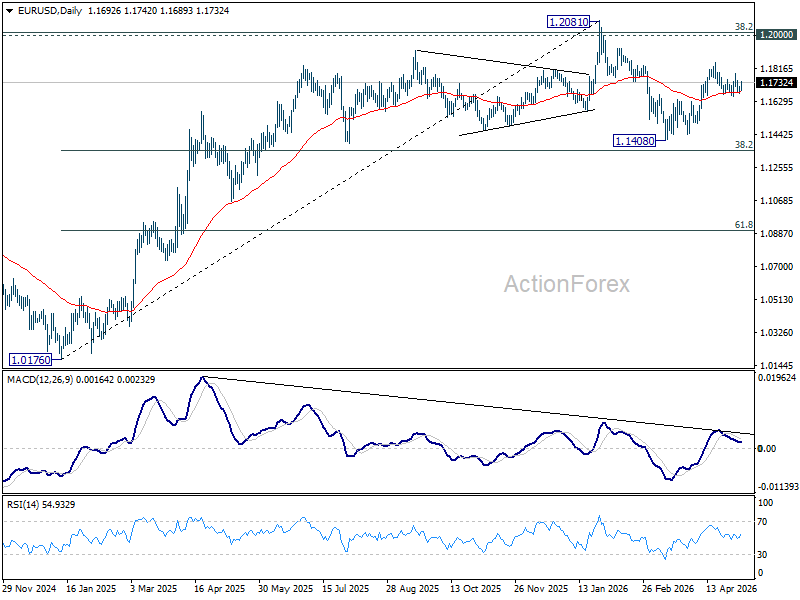
In the bigger picture, the strong support from 38.2% retracement of 1.0176 to 1.2081 at 1.1353 suggests that the pullback from 1.2081 is more likely a corrective move. Strong support was also found in 55 W EMA (now at 1.1537). Focus is back on 1.2 key cluster resistance level. Decisive break there will carry long term bullish implications. Nevertheless, break of 1.1408 support will revive the case of medium term bearish trend reversal.
USD/CHF Daily Outlook
Daily Pivots: (S1) 0.7813; (P) 0.7832; (R1) 0.7851; More….
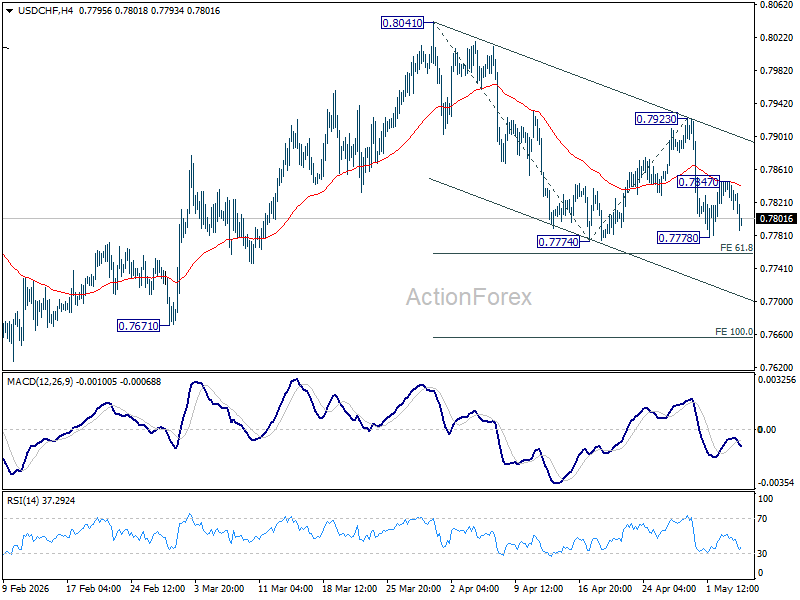
USD/CHF falls sharply after rejection at 55 4H EMA but stays above 0.7774 support. Intraday bias stays neutral first. Risk will remain on the downside as long as 0.7923 resistance holds. Firm break of 61.8% projection of 0.8041 to 0.7774 from 0.7923 at 0.7758 will extend the fall from 0.8041 to 100% projection at 0.7656. However, firm break of 0.7923 will turn bias back to the upside for stronger rebound.
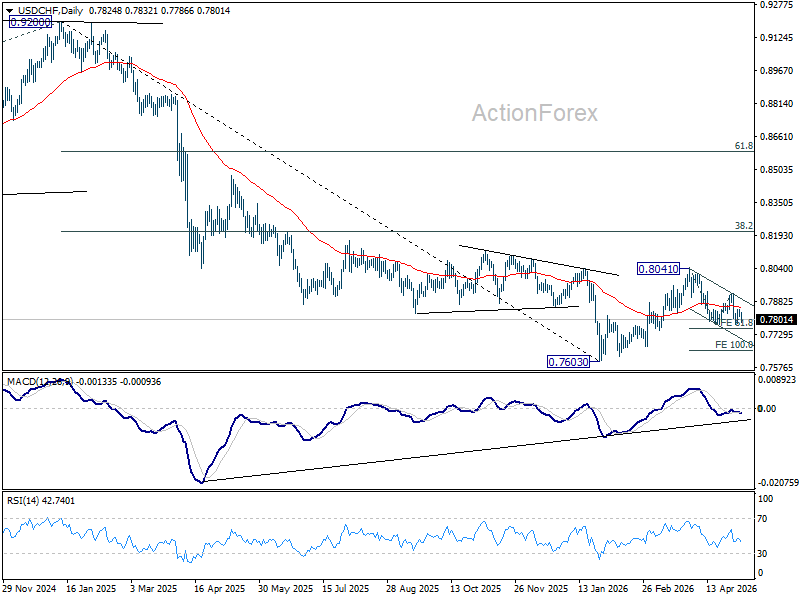
In the bigger picture, rebound from 0.7603 medium term bottom is seen as correcting the fall from 0.9200 only. Rejection by 55 W EMA (now at 0.8042) will affirm this bearish case, and setup down trend resumption to 100% projection of 1.0146 (2022 high) to 0.8332 from 0.9200 at 0.7382 at a later stage. Though, sustained break of 55 W EMA will suggest that it's probably correcting the larger scale down trend from 1.0146 (2022 high).
USD/JPY Daily Outlook
Daily Pivots: (S1) 157.35; (P) 157.63; (R1) 158.18; More...
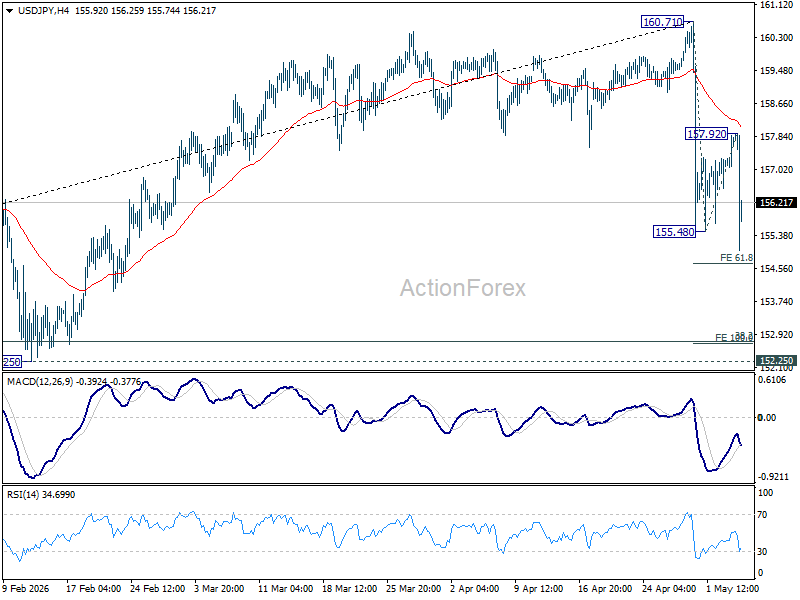
USD/JPY fell sharply after reject below 55 4H EMA (now at 158.06). The decline from 160.71 high is resuming and intraday bias is back on the downside for 61.8% projection of 160.71 to 155.48 from 157.92 at 154.68. Firm break there will target 100% projection at 152.69. That would be close to key 152.25 cluster support (38.2% retracement of 139.87 to 160.71 at 152.74). For now, risk will stay on the downside as long as 157.92 resistance holds, in case of recovery.
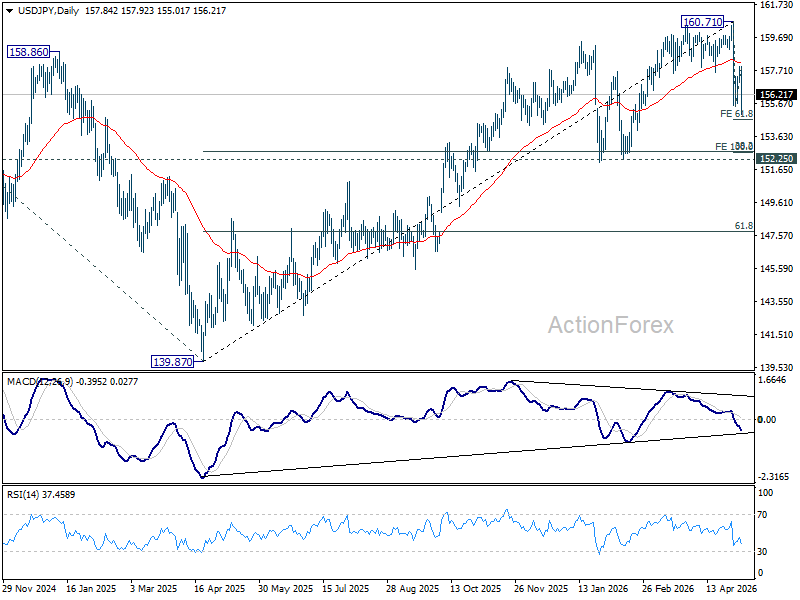
In the bigger picture, for now, corrective pattern from 161.94 (2024 high) is still seen as completed at 139.87. Rise from there is seen as resuming the long term up trend. So, break of 161.94 is expected at a later stage to resume the long term up trend. However, sustained break of 55 W EMA (now at 154.01) will dampen this view and bring deeper fall back towards 139.87 to extend the pattern from 161.94.
Markets Flip Back to Risk-On as Trump Pauses ‘Project Freedom’, Yen Exploits Dollar Weakness
The market narrative has flipped again—and this time the reversal is dramatic. Just days after investors were positioning for a dangerous escalation in the Strait of Hormuz, traders are suddenly rushing back into risk assets as Washington signals that diplomacy may still be alive.
The turning point came when US President Donald Trump abruptly paused “Project Freedom,” the US naval operation designed to escort shipping through the Iranian-controlled Strait of Hormuz. The mission had rapidly become the center of the latest confrontation, triggering missile incidents, naval clashes, and fears that the four-week-old ceasefire between the US and Iran was collapsing.
Instead of doubling down militarily, Trump announced that the operation would be suspended to facilitate a “complete and final agreement.” That single sentence completely changed market psychology. Within hours, the focus shifted away from imminent escalation and back toward the possibility of a negotiated settlement.
In many ways, markets had already started sniffing out the shift before the announcement became official. Wall Street’s overnight rally now looks less like optimism and more like early positioning. NASDAQ and S&P 500 both closed at record highs despite the geopolitical backdrop, suggesting some traders had already concluded that Washington was preparing to step back from direct confrontation.
The clues were there. During a briefing earlier in the day, Secretary of State Marco Rubio and Defense Secretary Pete Hegseth continued to speak firmly about protecting shipping routes and maintaining “Project Freedom.” But they also repeatedly stressed that the ceasefire remained intact despite recent military skirmishes. That subtle change in tone appears to have been enough for markets to start reversing defensive positioning.
The result was a sharp unwind of the “war trade.” Oil prices retreated as traders reduced the probability of an immediate supply shock through Hormuz. Safe-haven demand for Dollar evaporated quickly, pushing the greenback back under broad pressure.
Equity markets in Asia exploded higher after the pause for formally announced. South Korea’s KOSPI delivered one of the clearest signals, opening above 7093 before surging through 7300 intraday for a fresh record. The move reflected a rapid return of global risk appetite as investors once again embraced the idea that diplomacy—not escalation—would dominate the next phase.
But the most fascinating development is happening in Yen, for it is aggressively outperforming everything else. That has reignited speculation that Japan is intervening again—this time with near-perfect timing. By acting during the tail end of Golden Week holidays, when Tokyo liquidity is exceptionally thin, authorities can move the market far more efficiently. And by stepping in while Dollar is already falling globally, they effectively gain leverage from the market’s own momentum.
This is the essence of “maximum impact for minimum spend.” Japan may have realized that this brief window—falling Dollar and global yields, thin liquidity, and reduced geopolitical fear—offered the best opportunity to reset USD/JPY lower before speculative pressure toward 160 could rebuild. Rather than fighting the market, Tokyo may now be trying to guide it.
In the currency markets, Dollar is currently the worst performer for the day so far, followed by Loonie, and then Euro. Yen is leading, followed by Kiwi, and then Aussie. Swiss Franc and Sterling are positioning in the middle.
In Asia, Japan is in the last day of the Gold Week holidays. Hong Kong HSI is up 0.79%. China Shanghai SSE is up 1.27%. Singapore Strait Times is up 0.07%. Overnight, DOW rose 0.73%. S&P 500 rose 0.81%. NASDAQ rose 1.03%. 10-year yield fell -0.03 to 4.42.
NZ Labor Data Gives RBNZ Room to Stay on Hold
New Zealand’s labor market is stabilizing—but not overheating. Unemployment unexpectedly fell in Q1, yet wage growth remained subdued and participation slipped slightly. The combination eases pressure on the RBNZ to react aggressively to rising energy-driven inflation risks. Read More.
USD/JPY Daily Outlook
Daily Pivots: (S1) 157.35; (P) 157.63; (R1) 158.18; More...
USD/JPY fell sharply after reject below 55 4H EMA (now at 158.06). The decline from 160.71 high is resuming and intraday bias is back on the downside for 61.8% projection of 160.71 to 155.48 from 157.92 at 154.68. Firm break there will target 100% projection at 152.69. That would be close to key 152.25 cluster support (38.2% retracement of 139.87 to 160.71 at 152.74). For now, risk will stay on the downside as long as 157.92 resistance holds, in case of recovery.
In the bigger picture, for now, corrective pattern from 161.94 (2024 high) is still seen as completed at 139.87. Rise from there is seen as resuming the long term up trend. So, break of 161.94 is expected at a later stage to resume the long term up trend. However, sustained break of 55 W EMA (now at 154.01) will dampen this view and bring deeper fall back towards 139.87 to extend the pattern from 161.94.