
Sample Category Title
Sunset Market Commentary
Markets
ECB president Lagarde at the ECB Watchers Conference went into more detail on the central bank’s potential response to the energy shock. The strategy is based on three key principles. The first is to assess the nature, size and persistence of the shock before taking decisions on policy. The ECB must identify when higher energy costs risk spilling over into broad-based inflation – be it through indirect effects or through second-round effects via wages and inflation expectations. Lagarde admitted 2026 isn’t 2022 but its legacy lingers in the minds of consumers and businesses and this may prompt quicker pass-through effects. Yesterday’s PMIs are case in point. Secondly, the ECB focuses on risks – which may get non-linear – and not only the baseline. That translates into the third principle: having a set of options for how to respond, which depend on the intensity and duration of the shock and how it propagates. Lagarde then went on to point to three broad cases which, reading between the lines, basically correspond with the ECB’s baseline (A), adverse (B) and severe (C) scenario published last week. An energy shock limited in size and short-lived (A) would be looked through. In case of a shock leading to a large though not too-persistent overshoot of the 2% inflation target (B), some measured adjustment of policy could be warranted, also from a communication & signaling point of view. If inflation is expected to deviate significantly and persistently from target (C), the response must be appropriately forceful or persistent to prevent self-reinforcing mechanisms to kick in and risk a de-anchoring of inflation expectations. It is too soon to determine which scenario is prevailing, Lagarde noted. But in an echo to BoE’s Pill “fog of uncertainty cannot be an excuse for inaction” yesterday, the ECB president sounded resolute: “But we will not be paralyzed by hesitation: our commitment to delivering 2% inflation over the medium term is unconditional.”
Lagarde’s speech came against the backdrop of the US having ramped up diplomatic efforts to end the war with a 15-point proposal and a one-month ceasefire. Iran, however, already rejected the proposal. It has 5 conditions to begin talking about the end of the war, with “international recognition and guarantees of Iran’s sovereign authority over the Strait of Hormuz” probably not landing well in the US. Markets nevertheless take the optimistic view with stocks rebounding around 1.3% in Europe and 0.7-1.3% in the US. Brent oil fell towards the $100 barrier, down from $104.5 yesterday but up from intraday lows. European yields fell 6 bps across the curve at the open before entering a sideways trading range afterwards. Gilts hugely outperform with net daily changes varying between 8-12 bps despite above-consensus and -target February inflation numbers even before the Iran war erupted early March. The US curve bull flattens, showing declines up to 2.4 bps. Currency markets trade calm with a small US dollar bias. EUR/USD eases to sub 1.16, DXY moves higher towards 99.34. USD/JPY hovers around the recent highs just south of 160 (158.9 currently). Sterling treads water around EUR/GBP 0.865.
News & Views
In speech on purchasing power and the real cost of living in New Zealand, Reserve Bank of New Zealand Paul Conway observes that New Zealand is an expensive country, with prices for many products well above the OECD average. Since the pandemic, prices overall have risen by 26%, with prices for some essentials increasing by much more. Income per person has increased by slightly more, suggesting little change in purchasing power. Before 2020, purchasing power of wages grew faster than the OECD average, supported by strong employment growth and favourable terms of trade. Currently wage purchasing power is around the OECD average, but about 20% below the average of the more advanced economies. Monetary policy can anchor prices but can’t make New Zealand more affordable on its own. Sustained gains in purchasing power require higher productivity. Indicators suggest that the quality of structural policies in parts of New Zealand’s framework lag behind OECD best practice. On the current monetary policy stance, Conway indicated that he still sees excess capacity in the economy. At the April 8 meeting, the RBNZ will assess how much it has to lean against the wind in terms of potential rate hikes going forward. Markets see the RBNZ starting rate hikes in summer (May only 30% discounted), which might accelerate later with OCR near 3% discounted around year end. The Kiwi dollar underperformed the Aussie dollar already before and after the conflict in the Middle East started. NZD/USD eased from a peak just below 0.61 end January to currently 0.582.
BoE’s Greene Signals Inflation Concerns Without Immediate Hike Bias
BoE policymaker Megan Greene signaled that while inflation risks are rising, there is no immediate case for further tightening. At an even today, she said she “wasn’t tempted to hike” at the latest meeting, noting that higher inflation expectations increase risks but do not necessarily imply a sustained inflation cycle.
Greene emphasized that second-round effects remain uncertain. With the labor market weaker than during the 2022 inflation surge, the likelihood of strong wage-driven inflation appears lower. She also pointed to recent PMI data showing rising input costs, but cautioned that these indicators signal risk rather than a guaranteed outcome.
Despite this, Greene underscored that her primary concern is inflation rather than growth. She warned that energy prices are unlikely to fall back quickly due to damage to Gulf infrastructure, while food prices are expected to stay elevated.
EUR/USD Mid-Day Outlook
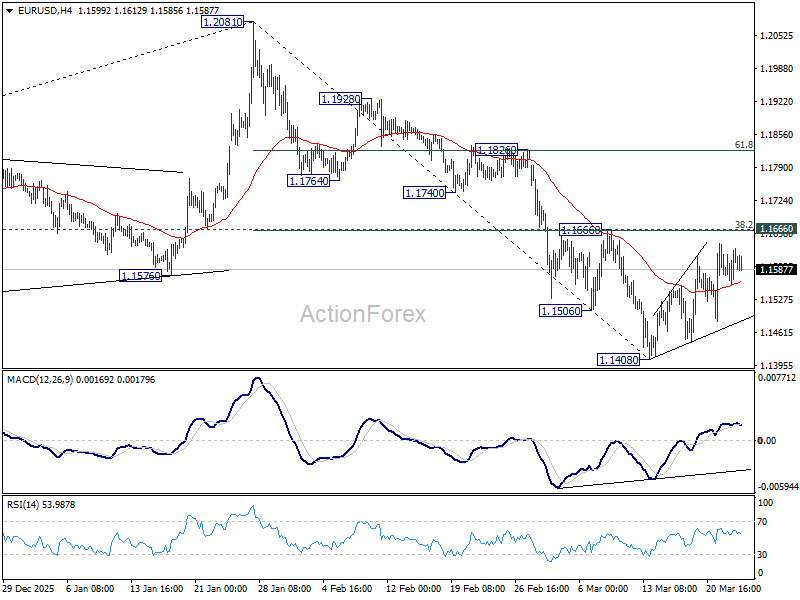
Daily Pivots: (S1) 1.1567; (P) 1.1597; (R1) 1.1638; More….
Intraday bias in EUR/USD remains neutral as consolidations continue above 1.1408. With 1.1666 cluster resistance (38.2% retracement of 1.2081 to 1.1408 at 1.1665) intact, further decline is in favor. On the downside, below 1.1408 will resume the fall from 1.2081 to 38.2% retracement of 1.0176 to 1.2081 at 1.1353. However, decisive break of 1.1666 will argue that the fall from 1.2081 has completed, and turn bias back to the upside for 61.8% retracement of 1.2081 to 1.1408 at 1.1824.
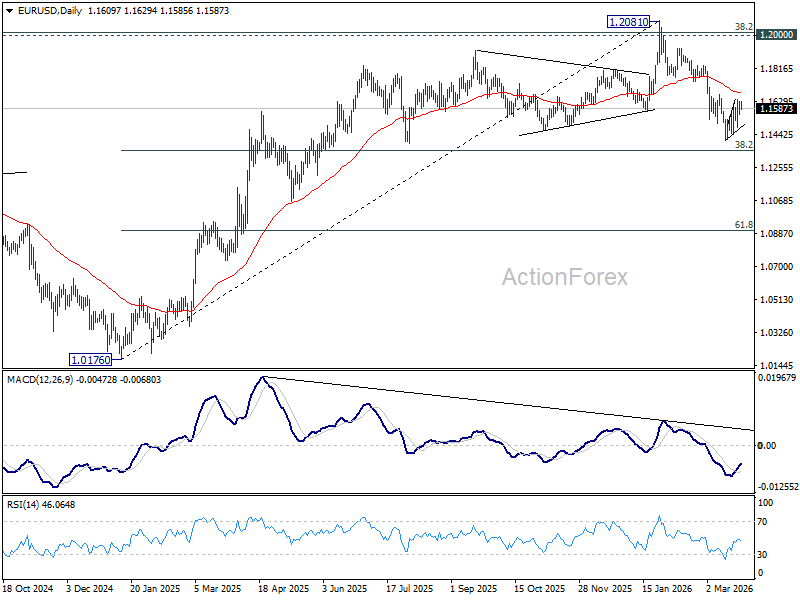
In the bigger picture, prior break of 55 W EMA (now at 1.1501) should confirm rejection by 1.2 key cluster resistance level. The whole up trend from 0.9534 (2022 low) might have completed as a three wave corrective rise too. Deeper fall is expected to long term channel support (now at 1.0528). Meanwhile, risk will stay on the downside as long as 1.2081 holds, even in case of strong rebound.
GBP/USD Mid-Day Outlook
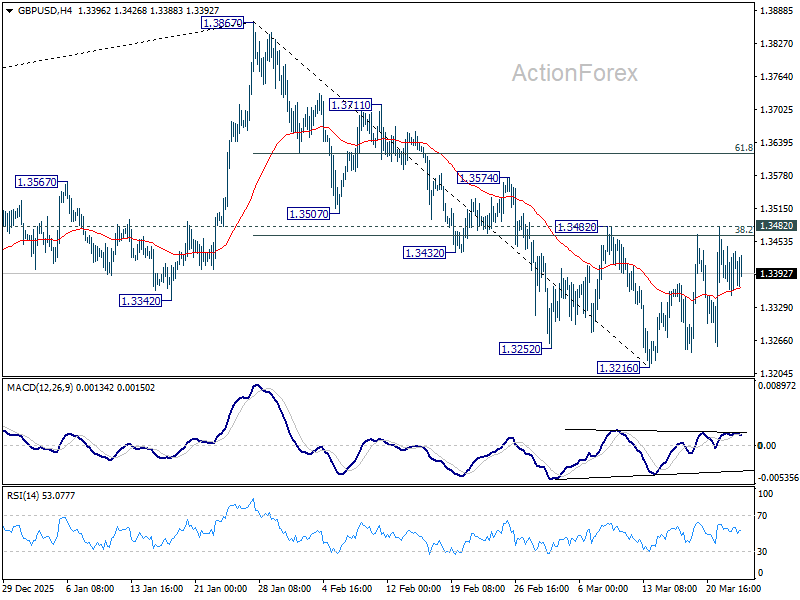
Daily Pivots: (S1) 1.3300; (P) 1.3389; (R1) 1.3522; More...
Intraday bias in GBP/USD remains neutral as range trading continues. With 1.3482 resistance intact, further decline is in favor. On the downside, below 1.3216 will resume the fall from 1.3867 to 1.3008 structural support. However, decisive break of 1.3482 will argue that the fall from 1.3867 has completed, and turn bias back to the upside for 61.8% retracement of 1.3867 to 1.3216 at 1.3618.
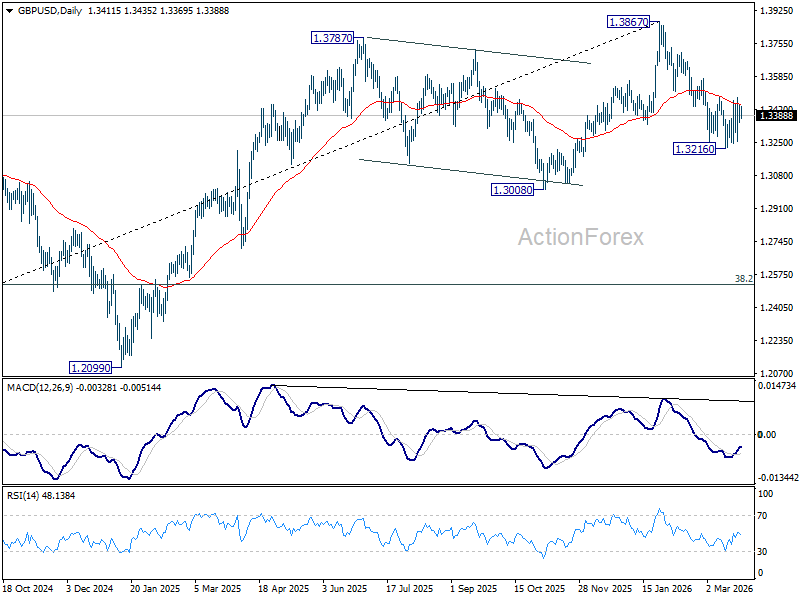
In the bigger picture, considering bearish divergence condition in both D and W MACD, a medium term top should be in place at 1.3867. Firm break of 1.3008 support will argue that fall from 1.3867 is at least correcting the rise from 1.0351 (2022 low) with risk of bearish reversal. That would open up further decline to 38.2% retracement of 1.0351 to 1.3867 at 1.2524. For now, medium term outlook will be neutral at best as long as 1.3867 resistance holds, or until further development.
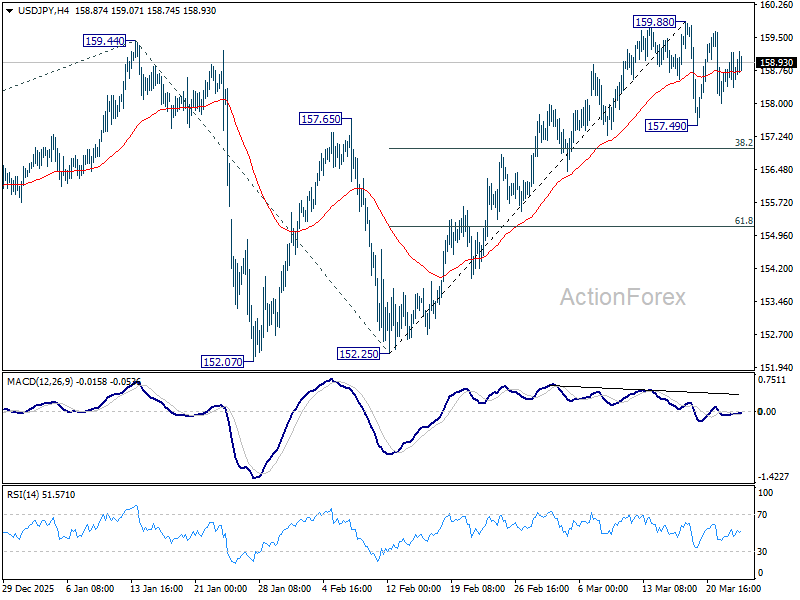
USD/JPY Mid-Day Outlook
Daily Pivots: (S1) 158.23; (P) 158.71; (R1) 159.19; More...
Intraday bias in USD/JPY stays neutral as consolidations continue below 159.88. In case of another dip, downside should be contained by 38.2% retracement of 152.25 to 159.88 at 156.96 to bring rebound. On the upside, break of 159.88 will target a test on 161.94 high.
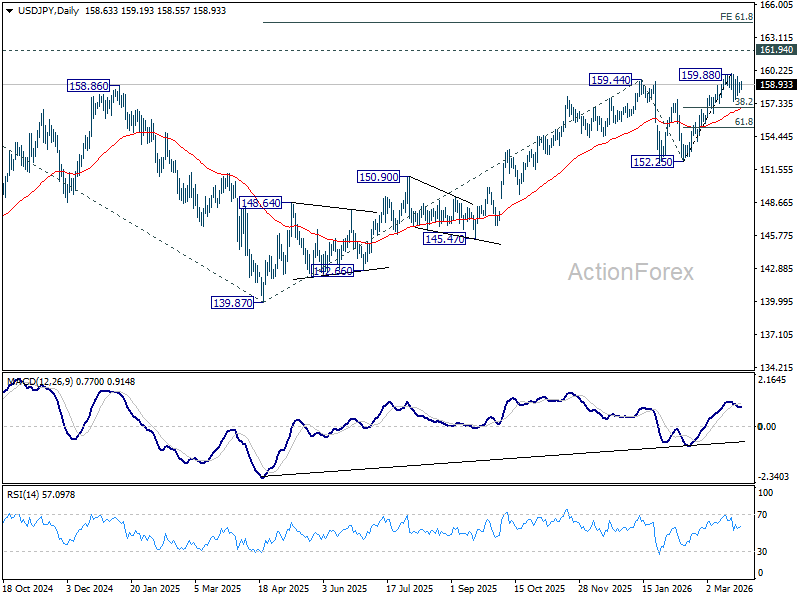
In the bigger picture, outlook is unchanged that corrective pattern from 161.94 (2024 high) should have completed with three waves at 139.87. Larger up trend from 102.58 (2021 low) could be ready to resume through 161.94. This will remain the favored case as long as 55 W EMA (now at 152.70) holds. Firm break of 161.94 will pave the way to 61.8% projection of 102.58 to 161.94 from 139.87 at 176.75.
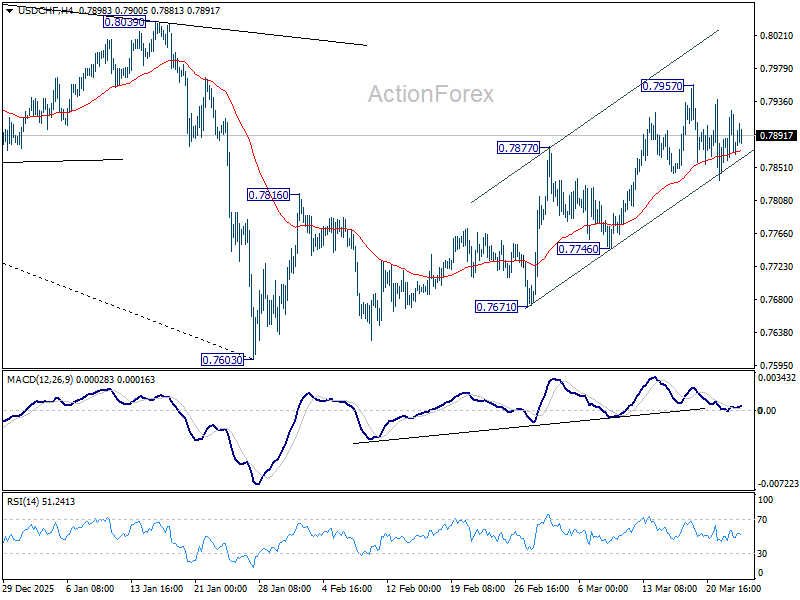
USD/CHF Mid-Day Outlook
Daily Pivots: (S1) 0.7853; (P) 0.7889; (R1) 0.7919; More….
USD/CHF is still bounded in consolidations below 0.7957 and intraday bias stays neutral. As noted before, rise from 0.7603 should be correcting whole decline from 0.9200. Above 0.7957 will target 38.2% retracement of 0.9200 to 0.7603 at 0.8213. This will remain the favored case as long as 0.7746 support holds.
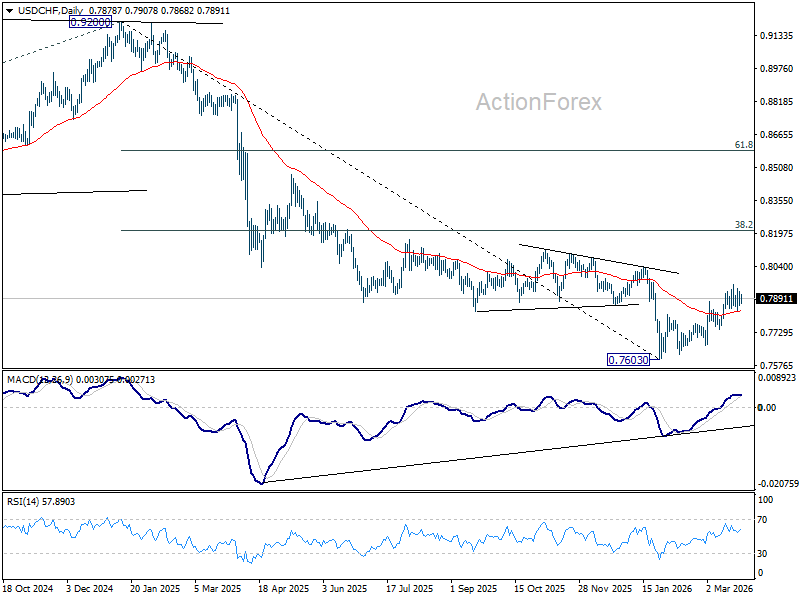
In the bigger picture, a medium term bottom should be in place at 0.7603 on bullish convergence condition in D MACD. Rebound from there is seen as correcting the fall from 0.9200 only. However, decisive break of 55 W EMA (now at 0.8085) will suggest that it's probably correcting the larger scale down trend from 1.0146 (2022 high). On the other hand, rejection by the 55 W EMA will setup down trend resumption to 100% projection of 1.0146 (2022 high) to 0.8332 from 0.9200 at 0.7382 at a later stage.
USD/CAD Mid-Day Outlook
Daily Pivots: (S1) 1.3724; (P) 1.3756; (R1) 1.3796; More...
Intraday bias in USD/CAD stays on the upside at this point. Rebound from 1.3480 is seen as correcting the whole down trend from 1.4791. Further rise should be seen to 1.3927 resistance, and probably further to 38.2% retracement of 1.4791 to 1.3480 at 3981. For now, risk will stay on the upside as long as 1.3669 support holds, in case of retreat.
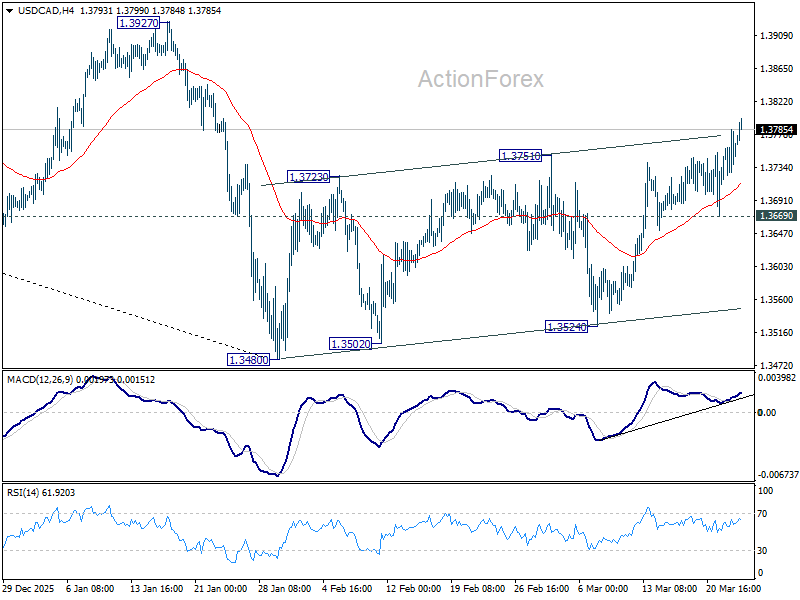
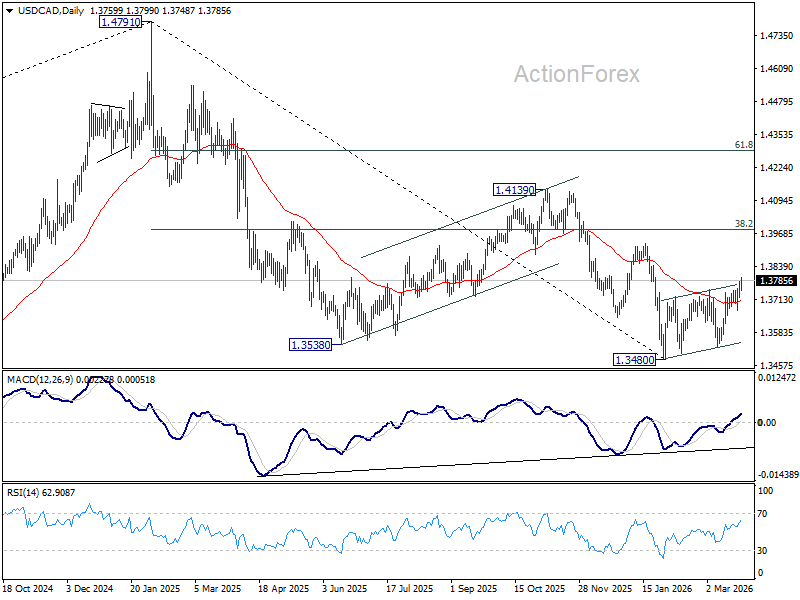
In the bigger picture, price actions from 1.4791 are seen as a corrective pattern to the whole up trend from 1.2005 (2021 low). Deeper fall could be seen, as the pattern extends, to 61.8% retracement of 1.2005 to 1.4791 at 1.3069. However, break of 1.3927 resistance will argue that the correction has completed with three waves down to 1.3480 already.
Canadian Dollar Weakens on Oil Pullback as Markets Await Ceasefire Clarity
Loonie weakened as oil prices pulled back, with markets turning cautious while awaiting clarity on ceasefire negotiations between the US and Iran. Brent crude easing to the 100 level has triggered a de-risking move in energy-linked assets, removing a key pillar of support for the Canadian Dollar.
The move reflects more than just oil price dynamics. With Canada heavily reliant on energy exports, shifts in crude prices quickly feed into currency performance. At the same time, the domestic economy remains too fragile to absorb tighter policy, limiting the Bank of Canada’s ability to follow more hawkish peers.
Beyond oil, markets are broadly in a “wait-and-hope” mode. Negotiations around a US-led 15-point ceasefire plan appear to be ongoing, while Iran has signaled that non-hostile vessels may obtain safe passage through the Strait of Hormuz under coordination. These developments offer tentative signs of de-escalation, but fall short of a confirmed resolution.
That lack of clarity is keeping overall price action muted. While sentiment has improved marginally, it has not translated into decisive risk-on positioning. Instead, markets are holding steady, with investors reluctant to commit ahead of clearer geopolitical signals.
In currency markets, divergence is becoming more pronounced. Sterling firmed modestly following the UK’s February CPI release, while Aussie and Kiwi remain under pressure, reflecting their sensitivity to global growth risks.
The UK inflation data itself offered a slightly hawkish tilt beneath the surface. While headline CPI matched expectations, core inflation edged higher, driven by services and clothing prices. This suggests that underlying price pressures remain persistent.
More importantly, the data reflect pre-escalation conditions. Since then, energy prices have surged following disruptions linked to the Strait of Hormuz. Analysts are already projecting inflation to rise toward 3.5%–4.0% by autumn as higher fuel costs feed through.
This shift is reinforcing expectations that the Bank of England may be forced back into a tightening stance. Today’s CPI release adds weight to that view, suggesting that the disinflation path may be interrupted.
Comments from BoE Chief Economist Huw Pill yesterday further support this narrative. His remark that uncertainty “cannot be an excuse for inaction” signals that the hawkish camp within the MPC remains prepared to act if inflation risks become more persistent.
In contrast, Canada’s policy outlook appears constrained. With growth already soft and oil prices retreating, the Bank of Canada is unlikely to tighten, widening the divergence with central banks such as the BoE and ECB.
For the day so far, Dollar is the strongest performer, followed by Sterling and Euro. Aussie leads losses, followed by Kiwi and Loonie, while Yen and Swiss Franc are holding in the middle.
In Europe, at the time of writing, FTSE is up 0.92%. DAX is up 1.22%. CAC is up 1.10%. UK 10-year yield is down -0.153 at 4.799. Germany 10-year yield is down -0.007 at 2.967. Earlier in Asia, Nikkei rose 2.87%. Hong Kong HSI rose 1.09%. China Shanghai SSE rose 1.30%. Singapore Strait Times rose 0.87%. Japan 10-year JGB yield fell -0.016 to 2.255.
UK Inflation Unchanged at 3.0% as Services Keep Price Pressure Elevated
UK CPI held at 3.0% while core inflation rose to 3.2%, with rising energy prices now threatening to derail the disinflation trend. Read More.
German Business Sentiment Drops as Iran War Hits Confidence
Germany’s Ifo index weakened as firms turned more pessimistic, reflecting rising geopolitical uncertainty and fading recovery prospects. Read More.
Australia Inflation Eases Pre-War, RBA Still Faces Sticky Core Pressures
Pre-war data show modest easing in Australia inflation, though underlying pressures remain firm and could rise again as energy costs increase. Read more.
USD/CAD Mid-Day Outlook
Daily Pivots: (S1) 1.3724; (P) 1.3756; (R1) 1.3796; More...
Intraday bias in USD/CAD stays on the upside at this point. Rebound from 1.3480 is seen as correcting the whole down trend from 1.4791. Further rise should be seen to 1.3927 resistance, and probably further to 38.2% retracement of 1.4791 to 1.3480 at 3981. For now, risk will stay on the upside as long as 1.3669 support holds, in case of retreat.
In the bigger picture, price actions from 1.4791 are seen as a corrective pattern to the whole up trend from 1.2005 (2021 low). Deeper fall could be seen, as the pattern extends, to 61.8% retracement of 1.2005 to 1.4791 at 1.3069. However, break of 1.3927 resistance will argue that the correction has completed with three waves down to 1.3480 already.
USD/CAD Rises to a Two-Month High
Today, the USD/CAD currency pair climbed above the 1.3787 level for the first time since late January.
- → Demand for the US dollar is being supported by concerns over escalating tensions in the Middle East. Market participants are favouring the USD as a safe-haven asset.
- → The Canadian dollar is under pressure due to domestic economic concerns. According to media reports, recent data point to weak GDP growth and a soft labour market. This increases the likelihood that the Bank of Canada will cut interest rates, while the Federal Reserve is expected to keep them unchanged.
Technical Analysis of USD/CAD
On 23 February, when the pair was trading around the 1.3700 level, we:
- → highlighted the ongoing long-term descending channel and the key support at 1.3500;
- → noted similarities with a rounding top pattern;
- → suggested a scenario in which bears might attempt to regain control and resume the longer-term downtrend.
Indeed, in the following sessions, USD/CAD showed signs of strong selling pressure, with the most pronounced move occurring on 9 March, when the pair dropped below 1.3530.
However, the onset of the Middle East conflict and other factors have significantly shifted market sentiment. The long-term descending channel has now been broken, suggesting that:
- → bulls have regained control of the market;
- → the pair may continue to develop within a newly formed ascending channel (shown in blue);
- → the 1.3700 level, which previously acted as resistance, may now serve as support going forward.
Trade over 50 forex markets 24 hours a day with FXOpen. Take advantage of low commissions, deep liquidity, and spreads from 0.0 pips (additional fees may apply). Open your FXOpen account now or learn more about trading forex with FXOpen.
This article represents the opinion of the Companies operating under the FXOpen brand only. It is not to be construed as an offer, solicitation, or recommendation with respect to products and services provided by the Companies operating under the FXOpen brand, nor is it to be considered financial advice.
Currency Market Awaits Negotiations
- The global economy is heading towards 1970s-style stagflation.
- EURUSD depends on US-Iran talks.
The world is moving towards stagflation, and the currency market risks repeating the experience of the 1970s. Back then, the oil crisis led to soaring prices and a slowdown in economic growth. The Fed yielded to pressure from the White House and started cutting rates. The result was runaway inflation and a double-dip recession. With Kevin Warsh at the helm of the central bank, this remains a possibility. However, for now, the USD continues to respond to news from the Middle East.
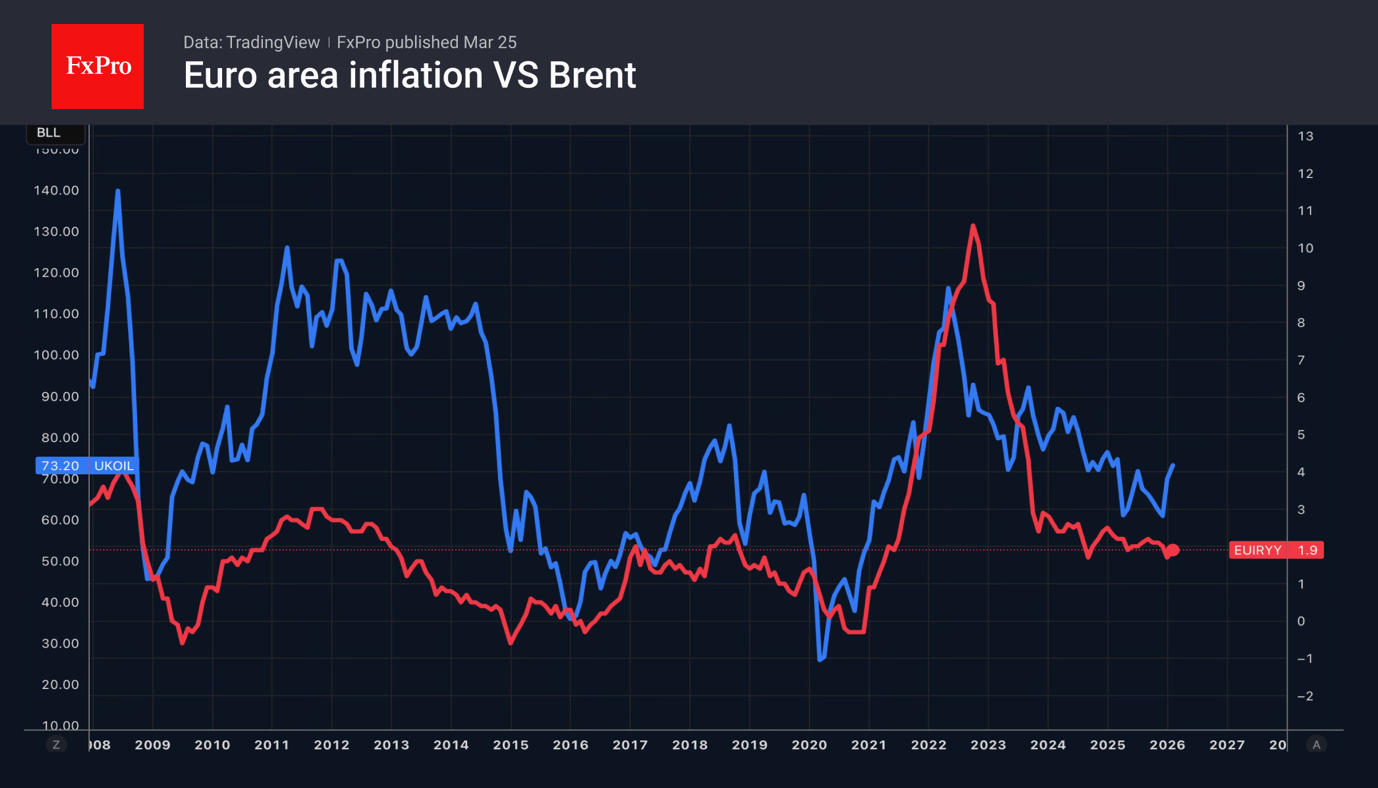
The increase in prices tied to the armed conflict is slowing European and American business activity to its lowest levels since April–May 2025. Purchasing Managers’ Indexes, by contrast, are rising swiftly. These indicate a stagflationary scenario, which is purportedly supporting the US dollar. Goldman Sachs believes the greenback will weaken if investors fear not stagflation but recession, causing capital to flow into the Swiss franc and the Japanese yen.
New talks are fuelling rumours of US-Iran negotiations. Washington has provided Tehran with a list of 15 demands, and Tehran is preparing its own list in reply. Brent is falling, stripping the dollar of the advantage that has propelled its rise in recent weeks, driven by a flight to safe-haven assets and a reassessment of the trade balances of the world’s largest economies.
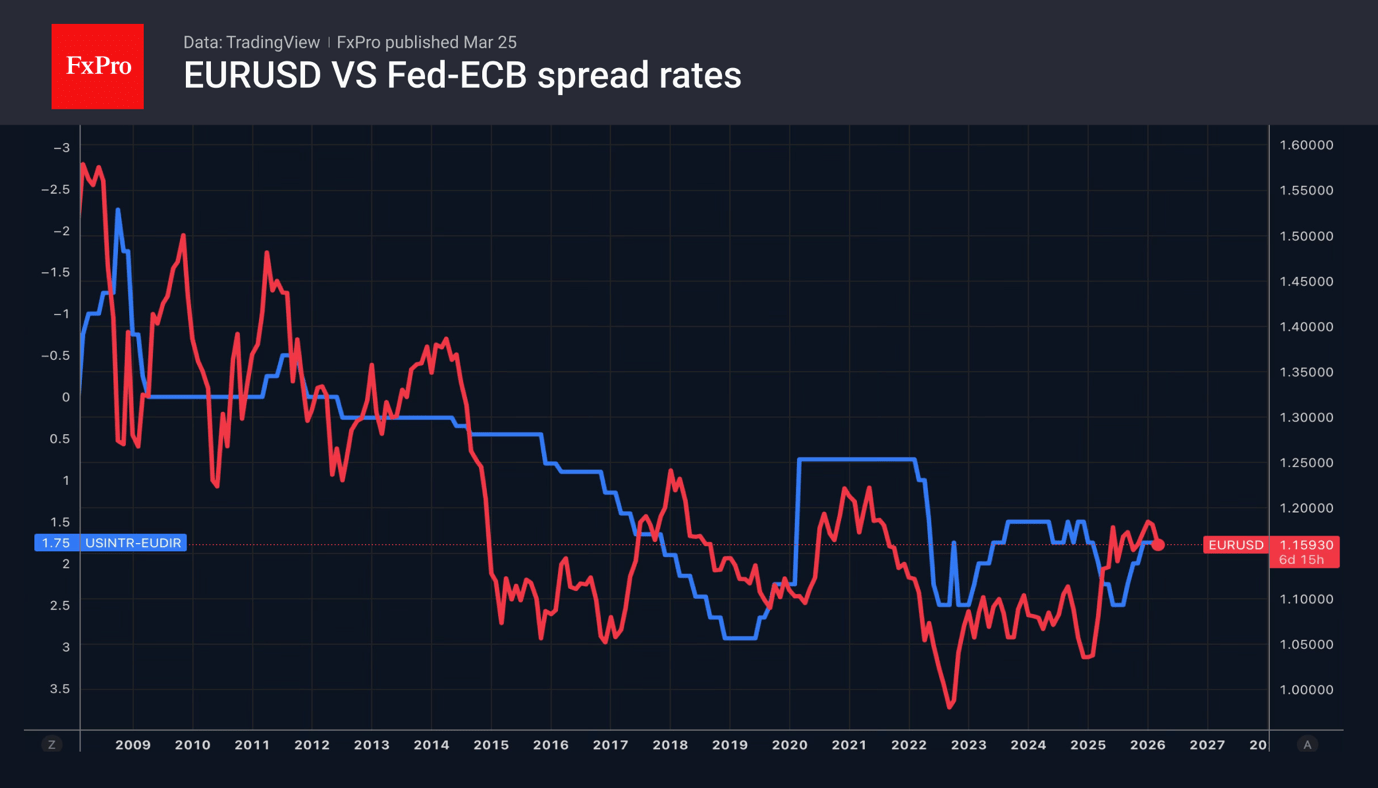
If the talks do indeed take place and are constructive, EURUSD will revert to its main drivers. Primarily, monetary policy. Divergence in this area favours the euro. The futures market anticipates the Fed will keep the federal funds rate on hold until the end of the year, with some chance of a hike. Meanwhile, the ECB can tighten monetary policy two or three times. However, this may not be necessary. If oil prices drop, the inflation spike will be brief.
It is by no means certain that progress will be made in the US-Iran talks, especially in the initial phase, given the parties’ significant differences. Bad news will put pressure on EURUSD, though a collapse is unlikely. Similarly, one should not harbour hopes that Brent prices will return to pre-war levels, regardless of how quickly the Strait of Hormuz is reopened.