Sample Category Title
Crypto Market in No Hurry to Gain Ground
Market Overview
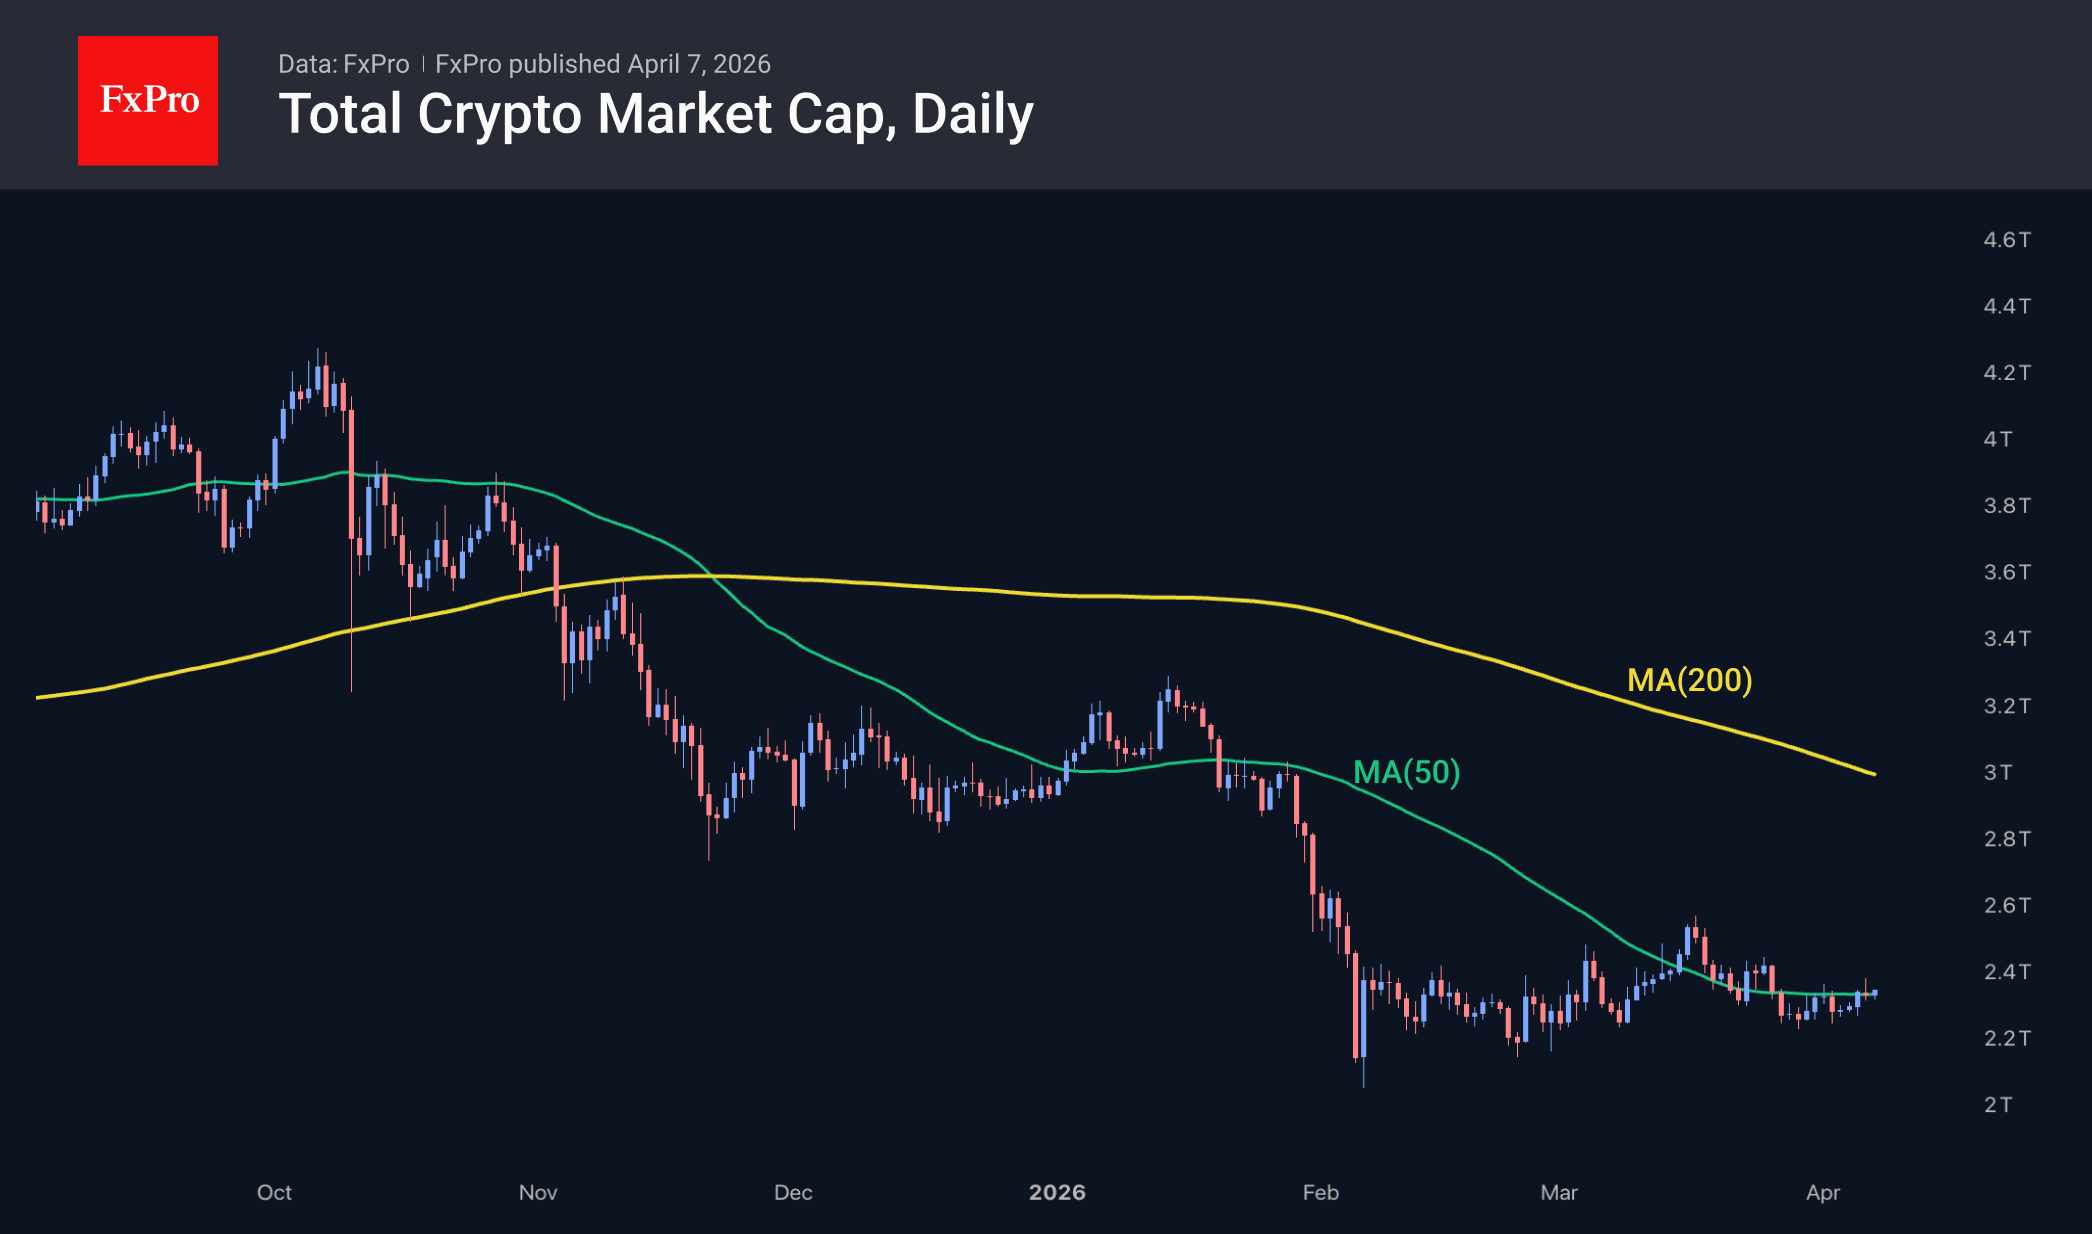
The crypto market capitalisation has fallen by 0.6% over the past 24 hours to $2.35 trillion. The market continues to hover around its 50-day moving average, reflecting a fierce battle for the medium-term trend. Top coins are predominantly down following renewed caution in traditional financial markets. The day’s leaders are Zcash (+3.1%), Filecoin (+0.9%) and Basic Attention Token (+0.6%). Among the underperformers are Avalanche (−9.7%), Algorand (−8.6%) and Ethereum Classic (−5.5%).
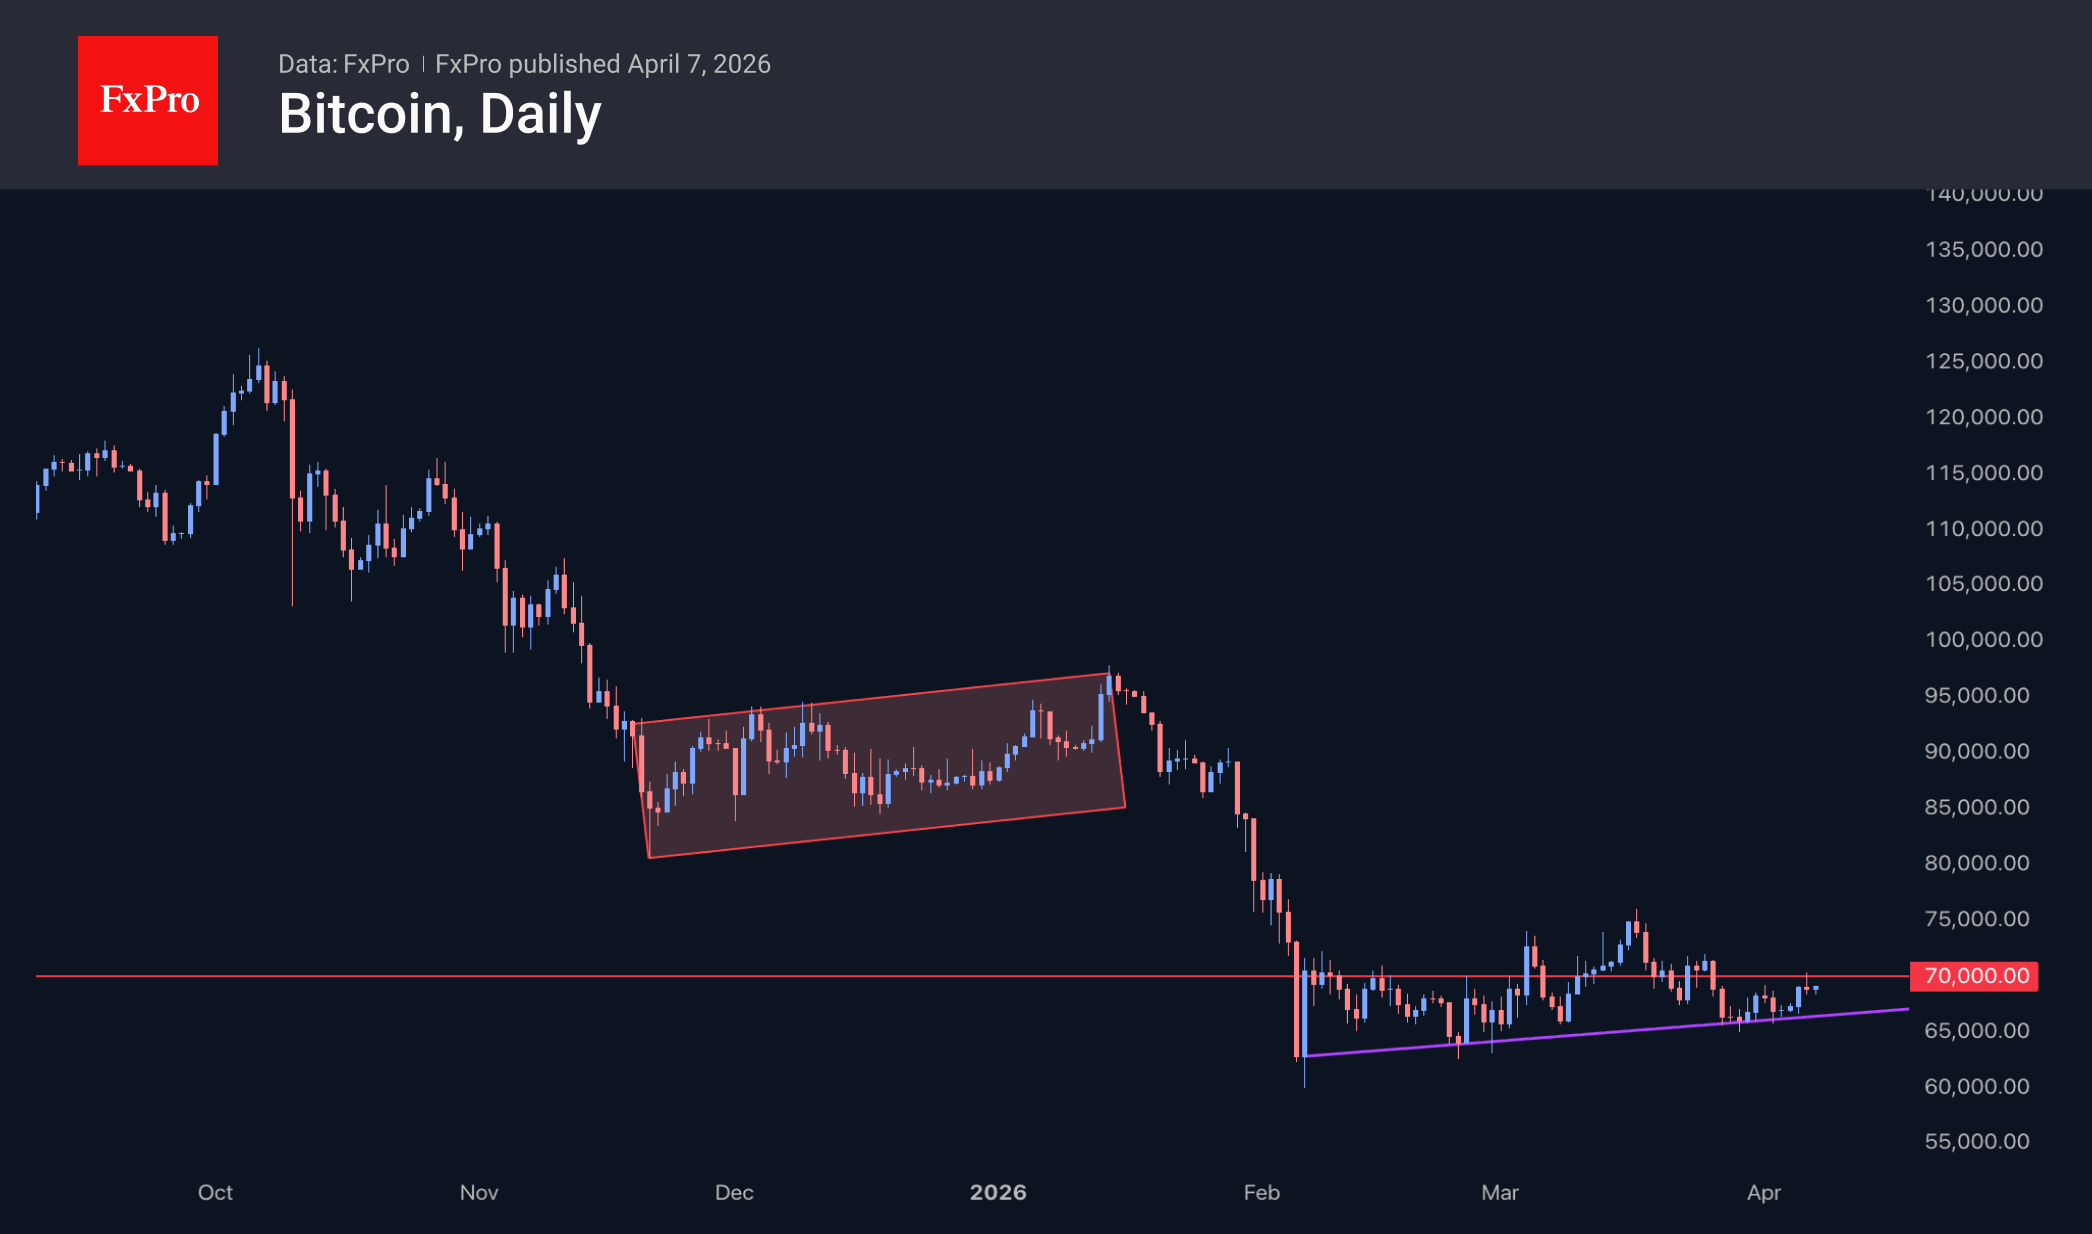
Bitcoin briefly exceeded $70K on Monday but failed to hold the level, retreating to $68.6K by Tuesday morning. This represents further fluctuations within the corrective rebound pattern in which the leading cryptocurrency has been trading for the past two months. The latest price action serves as a stark reminder of the market’s current volatility and how difficult it is to shift sentiment.
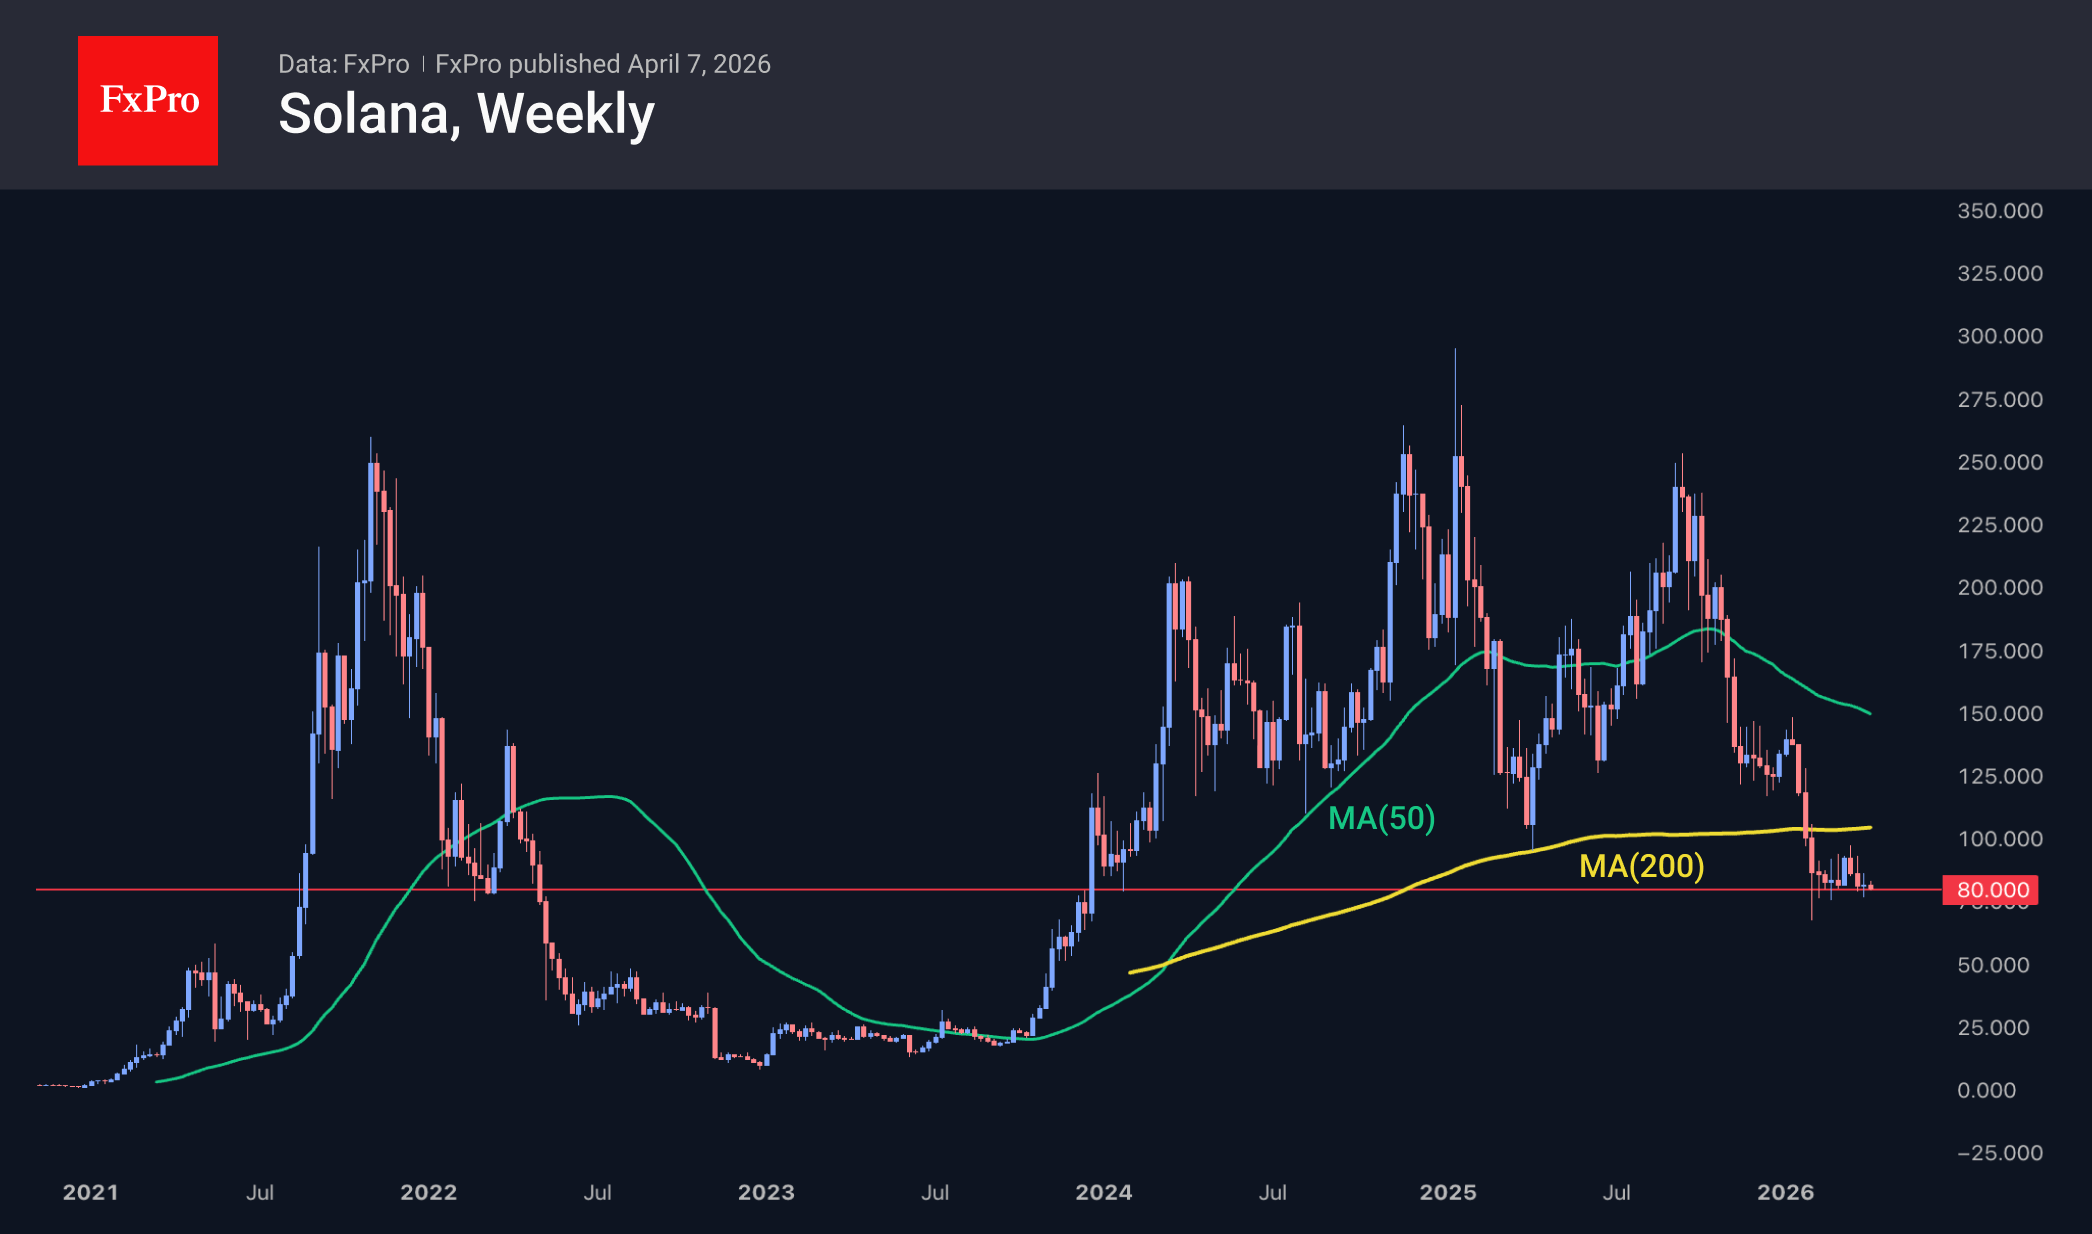
Solana is trading below $80, remaining near its lows since the start of the month and at the lower boundary of its trading range since early February. The coin has not traded consistently below this level since late 2023, and its price is now below the 50- and 200-week moving averages, which further point to a long-term bear market.
News Background
The rise in negative comments about Bitcoin on social media has reached a five-week high. This may indicate the likelihood of a trend reversal, according to Santiment.
Only a sustained move above $75K in Bitcoin will signal a recovery in structural demand and the end of the downtrend. Otherwise, BTC risks plummeting to $10K, according to Mike McGlone, senior strategist at Bloomberg Intelligence.
Bitcoin and dollar-pegged stablecoins are in a ‘symbiosis’ that mutually reinforces each other amid the growing adoption of crypto assets. This contradicts the widespread view that BTC will undermine the dollar, the Bitcoin Policy Institute notes.
According to CoinDesk, the US financial firm Charles Schwab plans to launch trading in Bitcoin and Ethereum in the second quarter. Initially, clients will not be able to transfer cryptocurrency to external wallets.
Strategy purchased a further 4,871 BTC ($329.9 million) last week at an average price of $67,700 per coin, following a week-long pause. Strategy now holds 766,970 BTC, purchased for $58 billion at an average price of $75,600 per Bitcoin.
BitMine acquired a further 71,252 ETH for $152 million over the past week. The company’s reserves have reached 4.8 million ETH, which is almost 4% of the Ethereum supply.
Pound Stays at Six-Month Low as Risks Weigh Ever Harder
GBP/USD is consolidating at 1.3232 on Tuesday. The pound remains near its lowest levels globally since late November, with growing pressure stemming from uncertainty over the Iran conflict and rising oil prices.
At the same time, the US dollar continues to draw support from strong US labour market data, which has reduced expectations of Federal Reserve easing.
US President Donald Trump has warned Iran of severe consequences if it refuses to reopen the Strait of Hormuz. However, according to US intelligence estimates, the likelihood of Tehran meeting these demands remains low.
Meanwhile, the possibility of a 45-day truce involving the US, Iran, and regional mediators is being discussed, which could partially reduce tensions.
Amid high oil prices, investors have effectively ruled out a Fed rate cut this year. In the UK, by contrast, the market is now pricing in two Bank of England rate hikes for 2026. However, BoE Governor Andrew Bailey has cautioned that such expectations may be excessive.
Technical Analysis
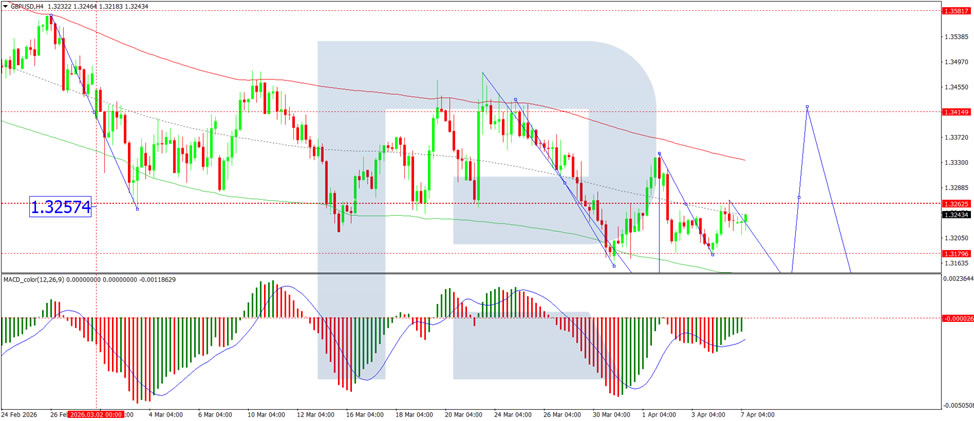
On the H4 GBP/USD chart, the market is forming a broad consolidation range around the 1.3262 level, currently extending down to 1.3180. A move towards 1.3262 is expected in the near term. Following the completion of this correction, a new consolidation range is likely to form. An upside breakout would open the way for a continuation move to 1.3411, while a downside breakout would suggest further movement to 1.3120. Technically, this scenario is confirmed by the MACD indicator, whose signal line is below zero and pointing downwards.
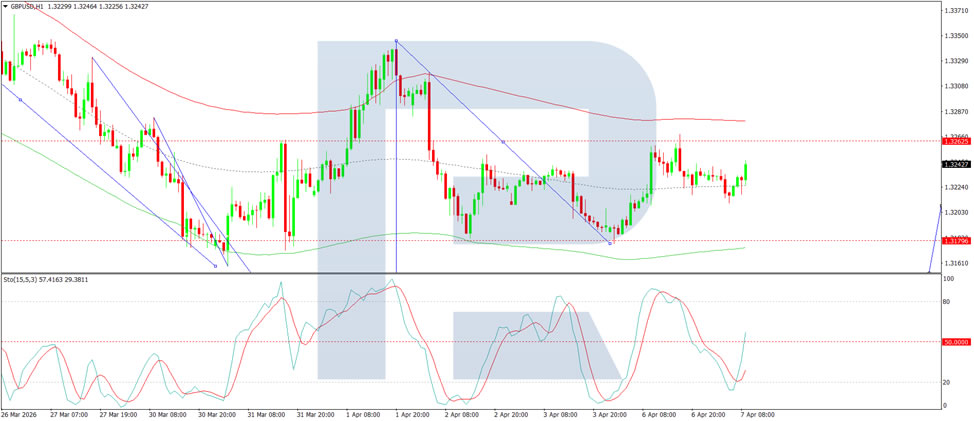
On the H1 chart, the market has formed a compact consolidation range around the 1.3222 level. A downside breakout has initiated a wave structure extending to 1.3120. Should this level be breached, further downside potential towards 1.3050 would emerge. Conversely, an upside breakout from the range could trigger a rebound to 1.3286. Technically, this scenario is confirmed by the Stochastic oscillator, with its signal line below 50 and pointing downwards towards 20.
Conclusion
GBP/USD remains pinned near six-month lows as a perfect storm of geopolitical uncertainty, rising oil prices, and diverging central bank expectations weighs heavily on sterling. While strong US labour data has bolstered the dollar by pushing Fed rate cut expectations further out, the UK market's pricing of two BoE rate hikes for 2026 appears increasingly optimistic, especially given Governor Bailey's own caution. The possibility of a 45-day truce offers a glimmer of hope for de-escalation, but US intelligence suggests Iranian compliance remains unlikely. Technical indicators point firmly lower, and unless geopolitical tensions ease substantially, the pound faces continued headwinds.
Eurozone Sentix Slumps as Recession Risk Returns and Inflation Fears Surge
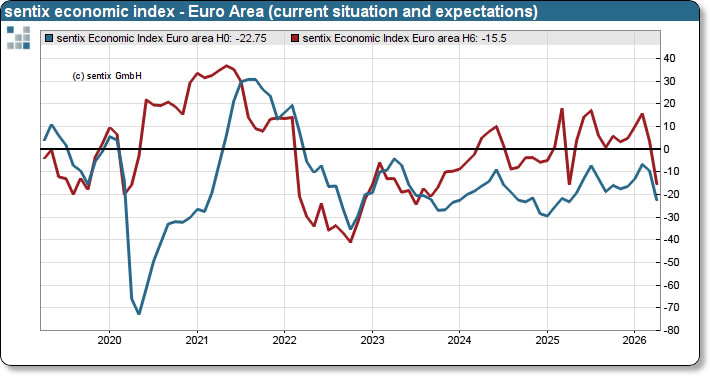
Eurozone investor sentiment deteriorated sharply in April, with data signaling that the risk of another recession is coming back into focus just as inflation concerns surge again on elevated oil prices. Sentix Investor Confidence dropped from -3.1 to -19.2, well below expectations of -7.5, and marking the weakest reading since April 2025.
The breakdown in sentiment was broad-based. The Current Situation Index plunged from -9.5 to -22.8, while the Expectations Index fell from 3.5 to -15.5, highlighting a rapid shift in outlook. According to Sentix, the slump has accelerated in just four weeks as the impact of the Iran war feeds through financial markets and economic expectations.
At the core of the downturn is the sustained surge in energy prices. Crude oil holding above USD 110, combined with supply bottlenecks in the Strait of Hormuz, is weighing heavily on sentiment. Disruptions to shipping and attacks on energy infrastructure have amplified uncertainty, reinforcing concerns that growth will be constrained further.
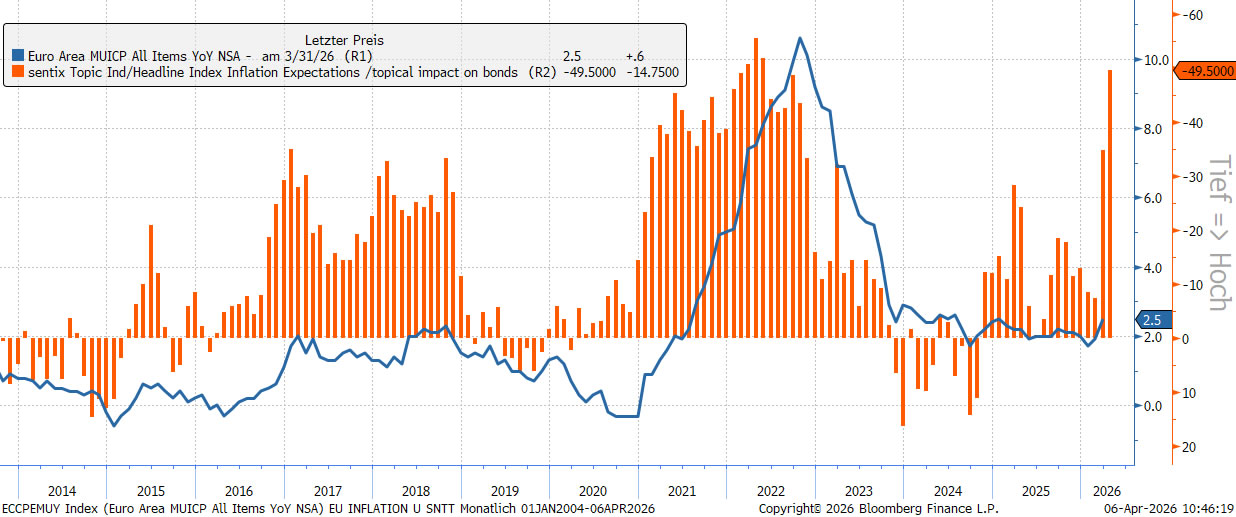
Inflation risks are also accelerating. Sentix’s inflation barometer showed another sharp rise in price concerns, driven by energy market disruptions and higher oil prices. The combination of weakening growth and rising inflation is reinforcing stagflation fears, with investors increasingly concerned that the Eurozone could face both a downturn and persistent price pressures in the months ahead.
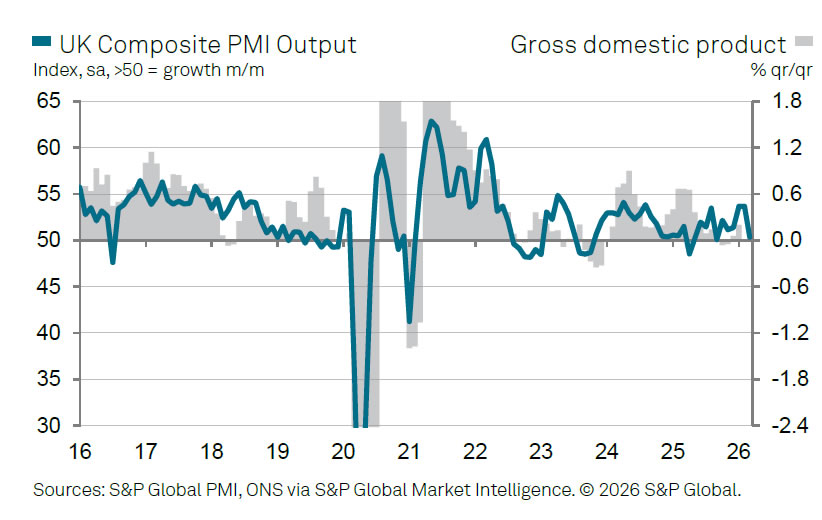
UK PMI Signals Economic Growth Slowdown and Sharp Inflation Surge
UK economic activity slowed markedly in March while inflation pressures accelerated sharply, reinforcing growing stagflation risks. PMI Services dropped from 53.9 to 50.5, the lowest since April 2025. PMI Composite fell from 53.7 to 50.3, pointing to the slowest pace of overall expansion in six months.
The sharp loss of momentum reflects a deterioration in demand conditions. According to Tim Moore, rising geopolitical tensions have "encouraged greater risk aversion", with both businesses and consumers cutting back spending and delaying investment decisions. As a result, output growth in the services sector has weakened significantly.
At the same time, cost pressures are intensifying. Input cost inflation accelerated sharply in March, reaching its strongest level in 11 months, driven primarily by higher fuel, transportation, and broader supply chain costs. Firms reported widespread pass-through from suppliers.
The combination of slowing growth and rising prices is weighing heavily on sentiment. Business optimism has fallen sharply from a 15-month high in January, with firms citing fragile domestic conditions and concerns over higher borrowing costs.
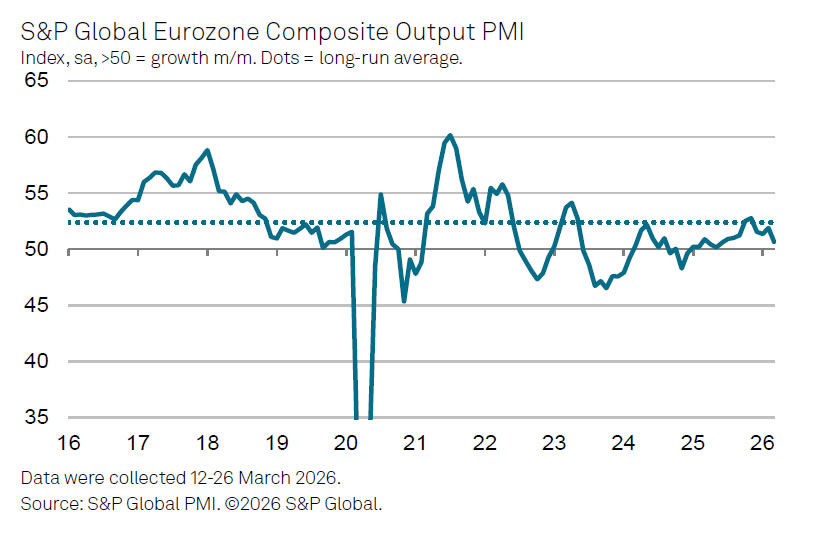
Eurozone PMI Signals Rising Q2 GDP Contraction Risk as War Shock Hits Growth
Eurozone growth is losing momentum rapidly, with March PMI data pointing to rising risks of GDP contraction in the second quarter as the Middle East war feeds through the economy. PMI Services was finalized at 50.2 in March, down from February's 51.9, a 10-month low. PMI Composite slipped from 51.9 to 50.7, a 9-month low.
The data suggests that the modest recovery seen earlier this year has been effectively erased. According to Chris Williamson, the economy has already been “hit hard” by surging energy prices, supply chain disruptions, and financial market volatility, all of which are now weighing on activity and demand.
A key warning sign is the deterioration in forward-looking indicators. New orders fell in March for the first time since last July. At the same time, supply bottlenecks linked to the conflict are constraining output while pushing prices higher. This combination is reinforcing stagflation risks. The prospect of a more hawkish response from the European Central Bank to prevent inflation from is becoming entrenched.
The outlook is deteriorating quickly. PMI data now points to only around 0.2% GDP growth in Q1, with clear signals that the economy could contract in Q2 without a swift resolution to the conflict.
Gold Price Eyes 4,500 Springboard as Break Above 4,800 Targets 5,000+
Gold price is stabilizing after last week’s rebound stalled below 4,800, and the focus is now shifting to whether a dip toward 4,500 could act as a "springboard" for the next rally toward 5,000 and beyond. The move lower after failing to break 4,800 suggests that while buyers are present, they are not yet strong enough to fully reverse the broader trend.
Still, the key takeaway is not the rejection at 4,800, but the resilience above 4,500. That level is emerging as an important line in the sand. It signals that institutional buyers are stepping in early, rather than waiting for deeper pullbacks, and are willing to defend the market after the earlier drop to 4,100.
This sets up a clear scenario. If Gold dips toward 4,500 and finds strong demand again, it would confirm that a base is forming. In that case, the recent retreat would look more like a pause than a reversal, turning 4,500 into a "springboard" for a renewed push higher.
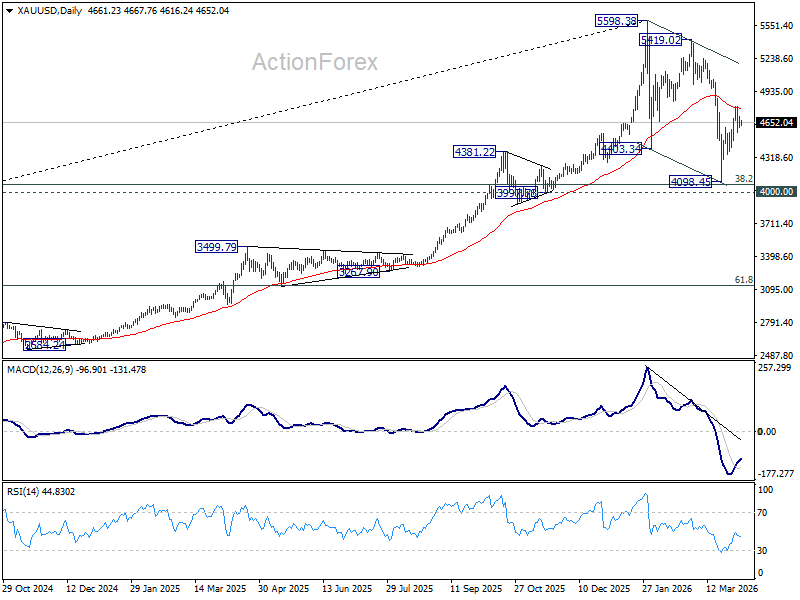
Such a move would strengthen the view that the correction from the record high near 5,600 has already run its course after defending the 4,000 psychological level. A strong rebound from 4,500 would then open the door for a decisive break above 4,800 and a move toward 5,000.
However, the macro backdrop still matters. Gold’s upside remains tied to interest rates, and the rally would likely need support from falling Treasury yields. Without that “yield relief,” gains could remain capped even if the technical setup improves.
Technically, near-term bias is mildly on the upside as long as 4,482.53 minor support holds. Firm break of 4,800.26 would resume the rise from the 4,098.45 short term bottom, confirming that momentum is rebuilding.
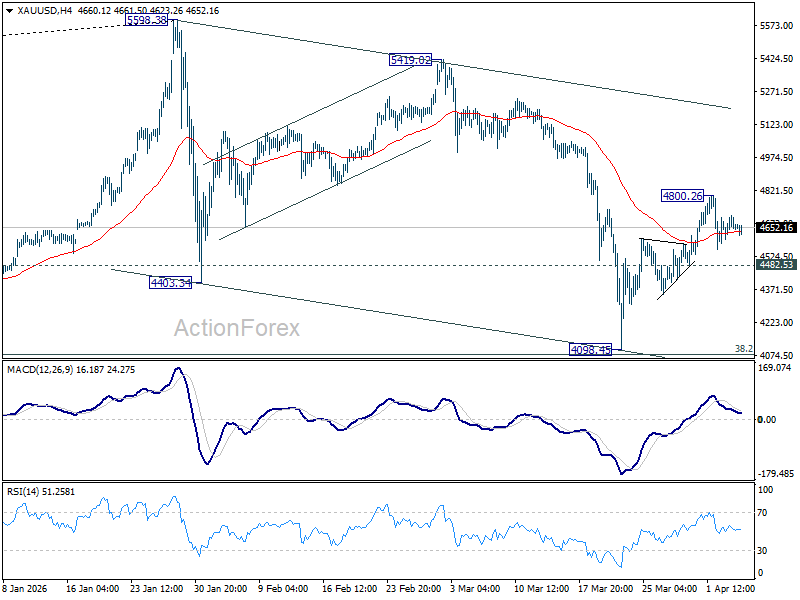
More importantly, sustained trading above 55 D EMA (now at 4,779.91) should confirm that the corrective decline from 5,598.38 has completed in a three-wave structure down to 4,098.45. That would reinforce the springboard scenario and target the 5,419.02–5,598.38 resistance zone.
On the downside, however, a break below 4,482.53 would weaken the setup and risk another move back toward the 4,000 area.
US Equity Markets Illustrate investors’ Rather Agnostic Wait-and-See Bias
Markets
The long Easter weekend brought…: another deadline rescheduling by US president Trump for Iran to comply to a deal with the US. The US President wants such a deal to include freedom of navigation through the Strait of Hormuz to be concluded by 8 PM US ET today (02 00 AM CET tomorrow). Otherwise the US might start destroying Iranian infrastructure, including energy facilities and bridges. At the same time, US president Trump indicated that talks are continuing. Iran warned that it might retaliate by new attacks on other energy infrastructure in the Gulf region. For markets, in the meantime, it has become almost impossible to assess the potential outcome of this ‘new’ development in the conflict. Even so, at least it only intensifies dislocations across the oil market. Brent this morning again trades well north of $110/b (111.5). The WTI contract was squeezed sharply higher already before the weekend now even trading above Brent ($115.6/b). Other indicators of immediate delivery (Dated Brent at $141/b) show signs of ever growing stress. The reaction on other (US) markets yesterday again was a bit mixed. Probably we again should label this as some kind of ‘agnosticism’ in the first place. The US yield curve yesterday bear flattened with yields rising between 5.2 bps (2-y) and 0.7 bps (30-y). US data, including a sharp rise in the services ISM price series and fears for multiple supply bottlenecks (see below) probably added to the rise in yields. Despite all the uncertainty regarding President Trump’s new deadline, US equity markets illustrated investors’ rather agnostic wait-and-see bias. The S&P even closed marginally higher (0.44%). On FX markets, the dollar trades near the top of established ranges (DXY 100.1, USD/JPY 159.8 & EUR/USD 1.1535), but currently lacks the power to force any convincing break higher.
Asian markets this morning also trade with a guarded bias as visibility with respect to the next step in the Middle East conflict remains close to non-existent. One can expect this pattern to continue in US and European markets going in the overnight deadline. Even so, especially interest rate markets currently further err to the side that supply disruptions in oil but also other commodities have reach a degree that force the likes of the ECB into defending their inflation credibility not only with words, but with hard action in the very near future. First indications this morning again point to higher EMU and also US yields. Eco data in the current context probably are second tier. Even so, we continue to keep a close eye on indicators of inflation expectations. Today, the NY Fed inflation expectations (one year ahead) are another reference in this respect (expected to rise from 3% to 3.5%).
News & Views
US Payrolls (Friday) and the services ISM (yesterday) were published during the long Easter break. The US economy added a consensus-smashing 178k jobs in March (vs 65k estimate), with only a minor 7k downward revision to the previous two months’ figures. The three-month moving average increased to 68k, the strongest since April of last year and taking into account 133k jobs cuts in February. The health care sector added 76k jobs after a 4-week, 31k-worker, strike by nurses and health professionals in California and Hawaï ended. Leisure and hospitality added 44k jobs and is expected to keep contributing in coming months as the US hosts the football world cup together with Mexico this summer. Construction, transportation and manufacturing all rebounded from job cuts in February. The unemployment rate ticked lower (4.2% from 4.3%), but it coincided with a shrinking labour force (61.9% from 62%). Wage growth surprised on the downside, rising by 0.2% M/M and 3.5% Y/Y.
Growth in the US services sector slowed in March according to the ISM which went from 56.1 to 54. Details were mixed, but show an impact from the war in the Middle East with concerns around employment and prices paid. New orders and businesses activity continued to point to growth in coming months, but the pace slowing further. The employment gauge fell to 45.2, the first contraction in four months. Prices paid surged to their highest level since 2022 (70.7) in the largest one-month increase in over 13 years. There were 20 commodities reported up in price, 0 reported down in price, and 7 reported in short supply. Both the ongoing war and the US eco data flipped US money market bets from erring on the side of a rate cut by year-end last Thursday to more even positioning/small rate hike bets by yesterday’s close..
GBP/JPY Daily Outlook
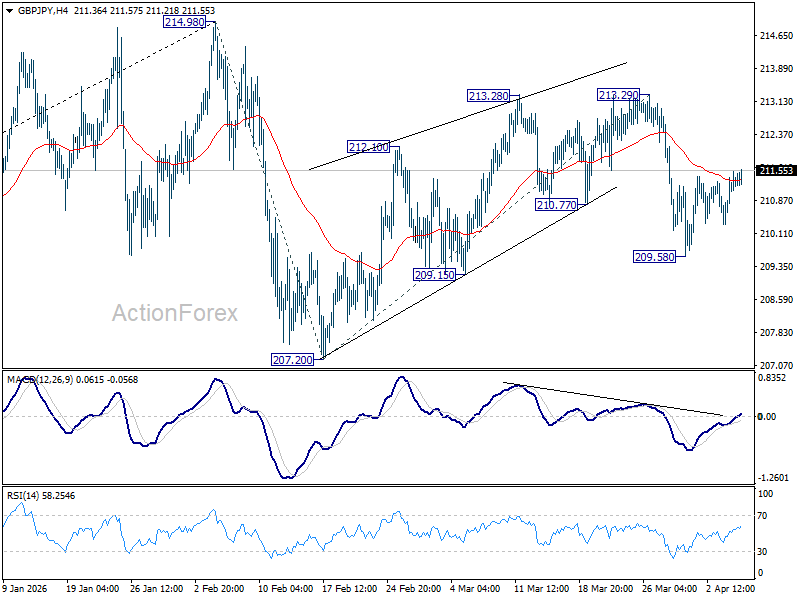
Daily Pivots: (S1) 210.66; (P) 211.10; (R1) 211.80; More...
Intraday bias in GBP/JPY remains neutral and more consolidations could be seen above 209.58. Risk remains on the downside with 213.29 resistance intact. Corrective pattern from 214.98 should be in the third leg. Break of 209.58 will target 207.20 and below. However, firm break of 213.29 will bring further rise to retest 214.98 high.
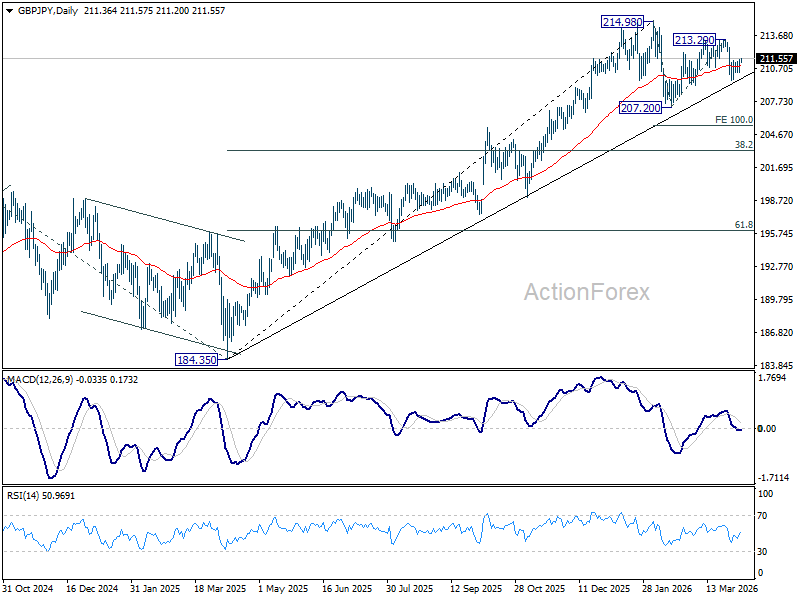
In the bigger picture, up trend from 123.94 (2020 low) is still in progress. Firm break of 214.98 will target 61.8% projection of 148.93 (2022 low) to 208.09 (2024 high) from 184.35 at 220.90. This will remain the favored case as long as 55 W EMA (now at 203.13) holds, even in case of another deep pullback.
EUR/JPY Daily Outlook
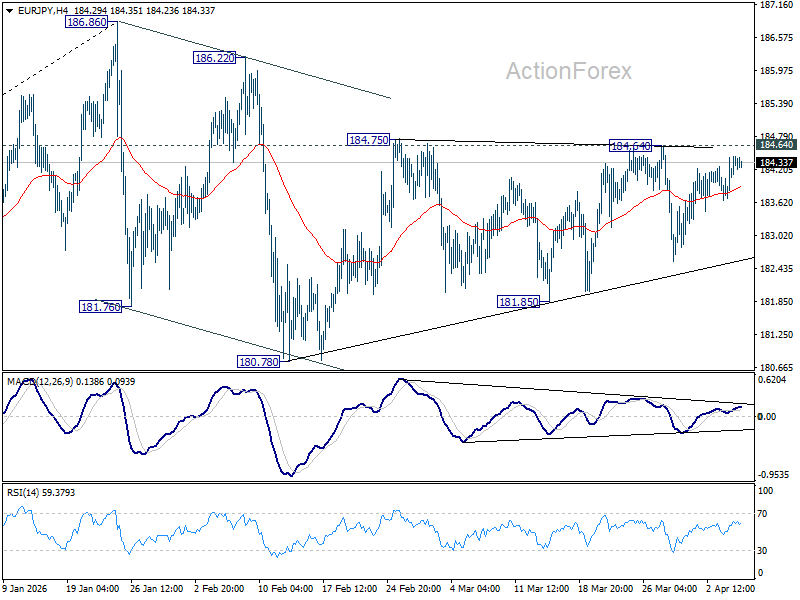
Daily Pivots: (S1) 183.85; (P) 184.16; (R1) 184.62; More...
Intraday bias in EUR/JPY remains neutral for the moment. On the downside, firm break of 181.85 support should confirm that the correction from 186.86 is already in the third leg. Deeper fall should be seen to 180.78 and below. However, break of 184.75 resistance will bring stronger rally to retest 186.86 high instead.
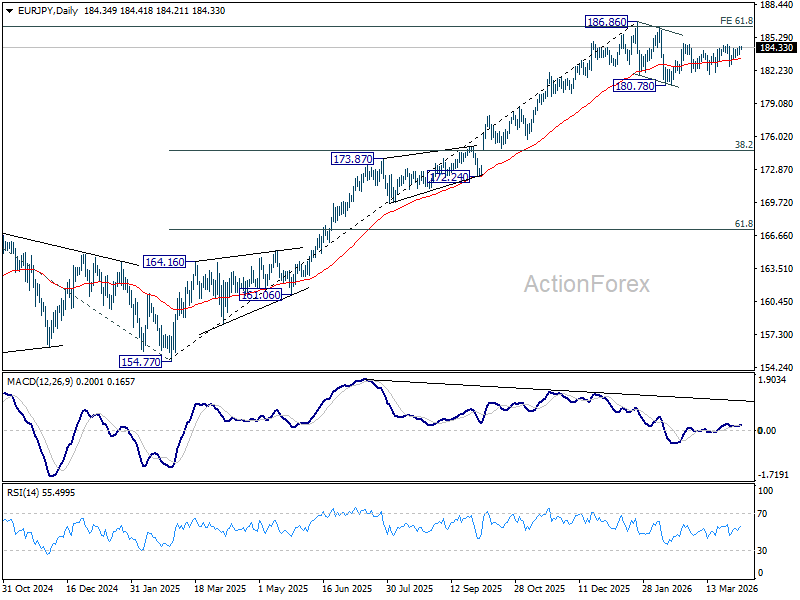
In the bigger picture, a medium term top could be in place at 186.86 and some more consolidations would be seen. Nevertheless, as long as 55 W EMA (now at 176.21) holds, the larger up trend from 114.42 (2020 low) remains intact. Firm break of 186.86 will pave the way to 78.6% projection of 124.37 (2022 low) to 175.41 (2025 high) from 154.77 at 194.88 next.
EUR/GBP Daily Outlook
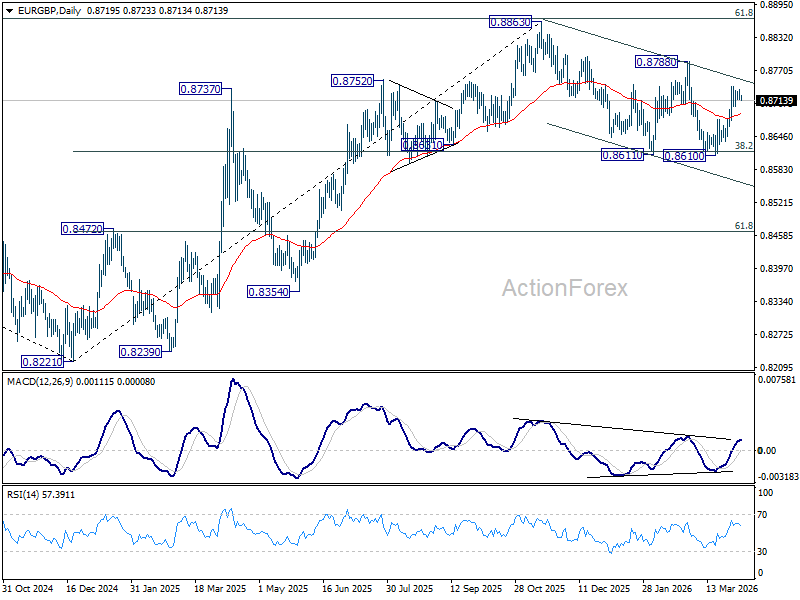
Daily Pivots: (S1) 0.8713; (P) 0.8724; (R1) 0.8733; More…
Intraday bias in EUR/GBP remains neutral and more consolidations would be seen below 0.8740. On the upside, above 0.8740 will resume the rebound from 0.8610 short term bottom to 0.8788 resistance next. However, break of 0.8675 will bring retest of 0.8610 low instead.
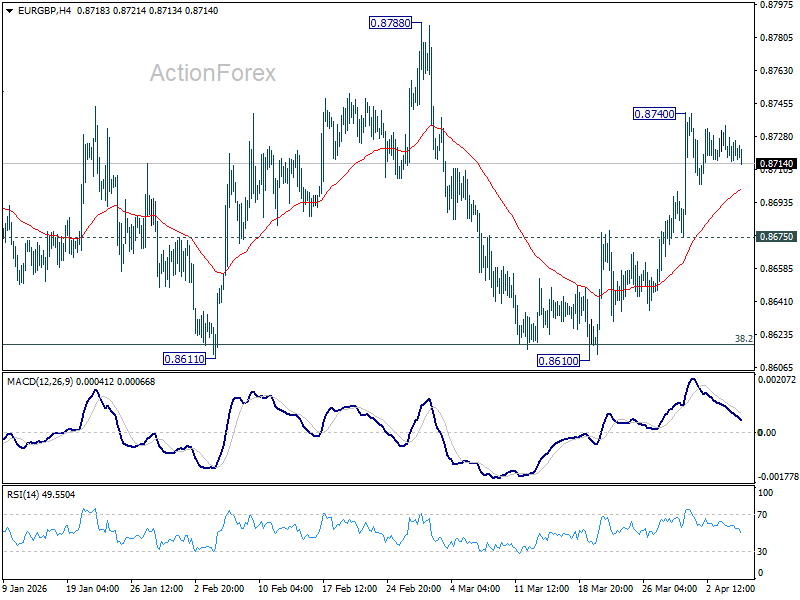
In the bigger picture, strong support was seen again from 38.2% retracement of 0.8821 to 0.8863 at 0.8618. Break of 0.8788 resistance will argue that larger rise from 0.8221 might be resume to resume through 0.8863. Nevertheless, sustained trading below 0.8618 should confirm reversal, and bring deeper fall to 61.8% retracement at 0.8466 at least.