
Sample Category Title
Chart Alert: Japan’s Nikkei 225 Flashing Bearish Breakdown Conditions Below 50-Day MA
Key takeaways
- Shift from outperformance to weakness: The Nikkei 225 has reversed sharply since late February, turning into one of the worst-performing indices amid rising stagflation fears driven by elevated oil prices and prolonged US–Iran tensions.
- Macro headwinds intensifying: Japan’s heavy reliance on oil imports, coupled with a weakening corporate earnings outlook (falling earnings revision index), is reinforcing bearish sentiment and downside pressure on equities.
- Bearish technical structure in play: The index remains trapped in a descending triangle below key resistance; a break below 52,070 may extend losses toward 50,160 and potentially the 200-day moving average, unless 54,095 is reclaimed.
Japan’s stock market has continued to wobble since the start of the US-Iran war on 28 February 2026, fading its initial bullish sparkle seen at the start of the year, where the Nikkei 225 was one of the top performers with a gain of 17% from 1 January 2026 to 27 February 2026.
Stagflation fear dragged down the Nikkei 225 to become an underperformer
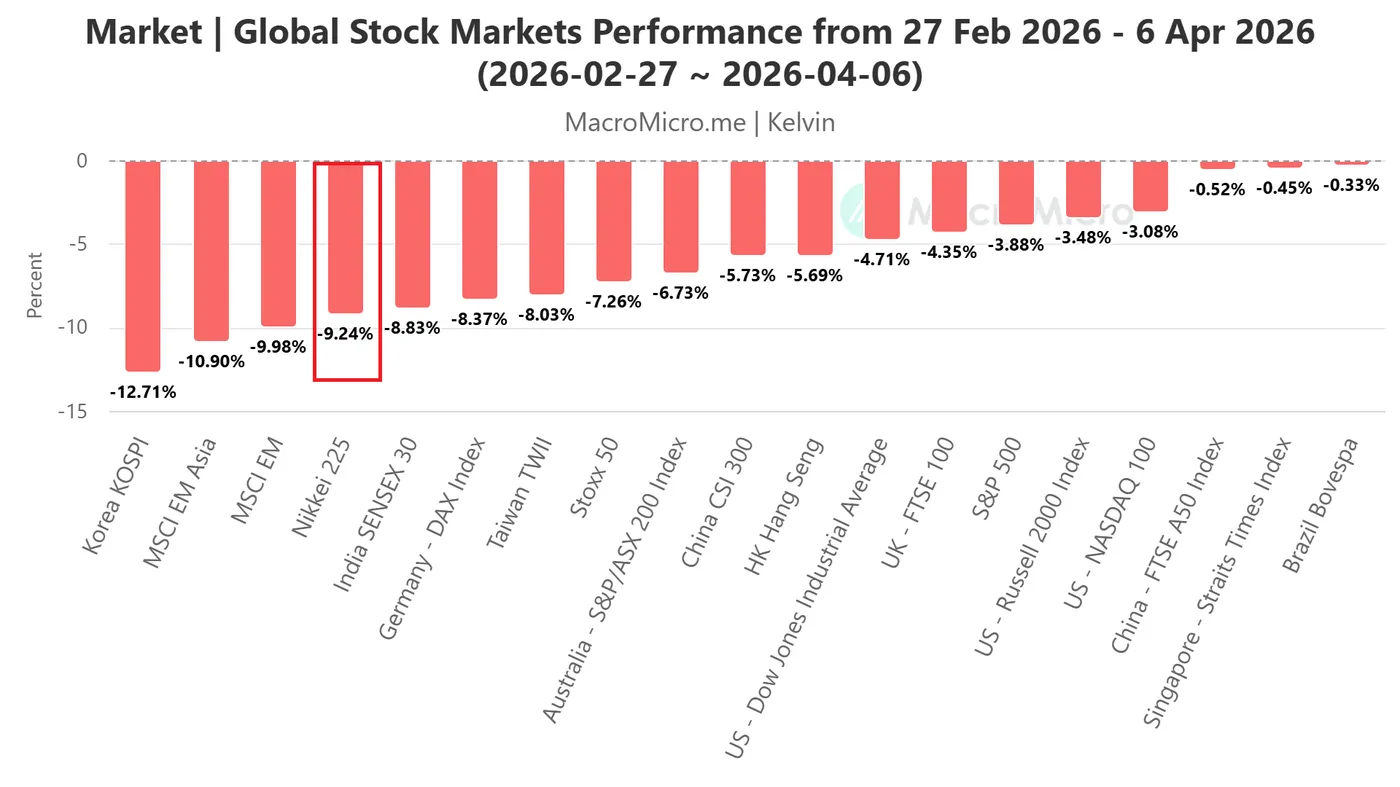
Fig. 1: Key global stock indices performances from 27 Feb 2026 to 6 Apr 2026 (Source: MacroMicro).
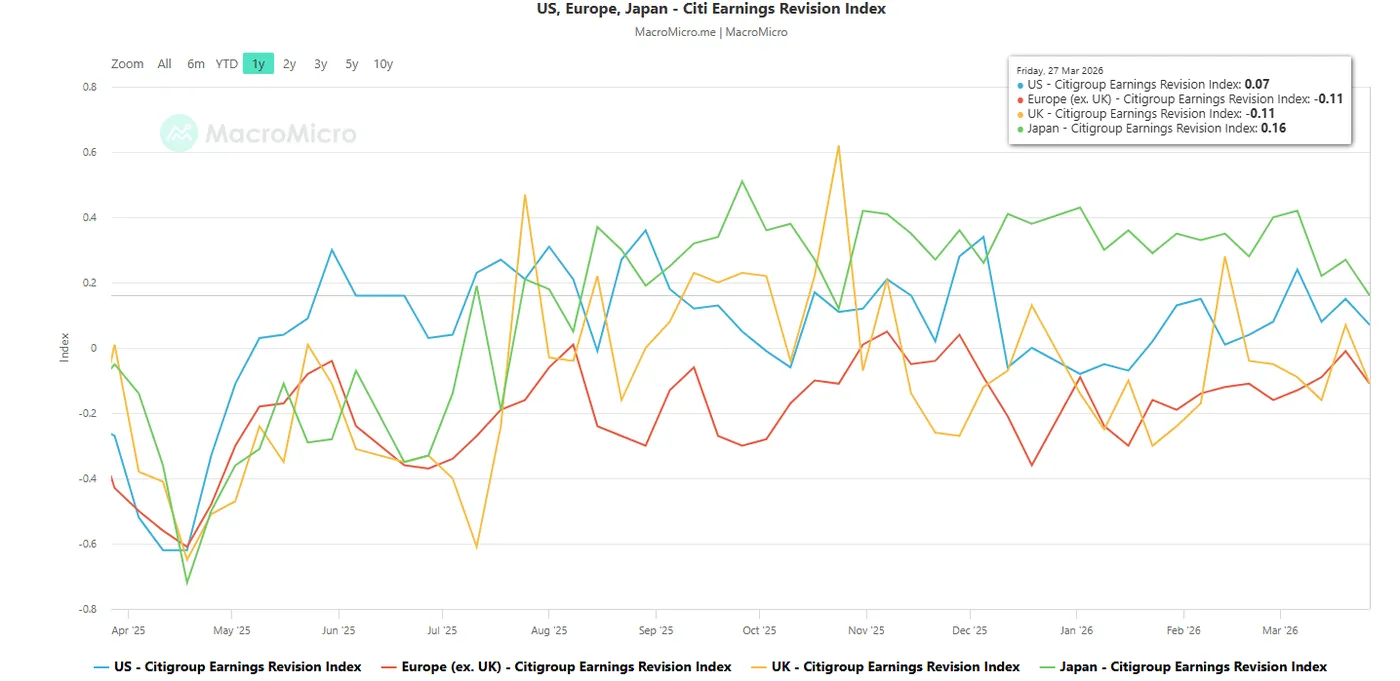
Fig. 2: Citigroup Earnings Revision Index for Japan, US & Europe as of 27 Mar 2026 (Source: MacroMicro).
In a reversal of fortune, Nikkei 225 has now fallen to the bottom, becoming one of the worst-performing stock indices, with a loss of 9.2% recorded from February 28, 2026, to April 6, 2026 (see Fig. 1).
Japan is a major oil importer, and the current US-Iran war, which is entering its 39th day, is not showing any clear signs of de-escalation at this juncture. Iran rejected a ceasefire deal yesterday after US President Trump’s latest deadline demand due today, Wednesday, 7 April at 8.00 p.m. Eastern time for Iran to open the Strait of Hormuz before US strikes on Iranian energy plants and key infrastructures.
Benchmark crude oil prices continue to trade firmly above $100/barrel, and trend-following market participants may trigger a bullish herding behaviour to continue bidding up the prices of oil.
The West Texas crude oil may rally towards the next intermediate resistances of $124.40 and $131.30/132.67.
Hence, further rallies in oil prices above $100/barrel increase the stagflation risk narrative, in turn, triggering a negative feedback loop into the Japanese economy, creating further bearish sentiment in the Nikkei 225.
In addition, the Citigroup Earnings Revision Index for Japan has slipped to a 5-month low of 0.16 as of 27 March 2026 from 0.42 printed on 6 March 2026, suggesting that sell-side analysts on average are less optimistic about the Japanese corporate earnings outlook (see Fig. 2).
Let’s now look at the technical factors to determine Nikkei 225’s potential short-term trajectory (1 to 3 days).
Nikkei 225 – Oscillating within a minor “Descending Triangle” range
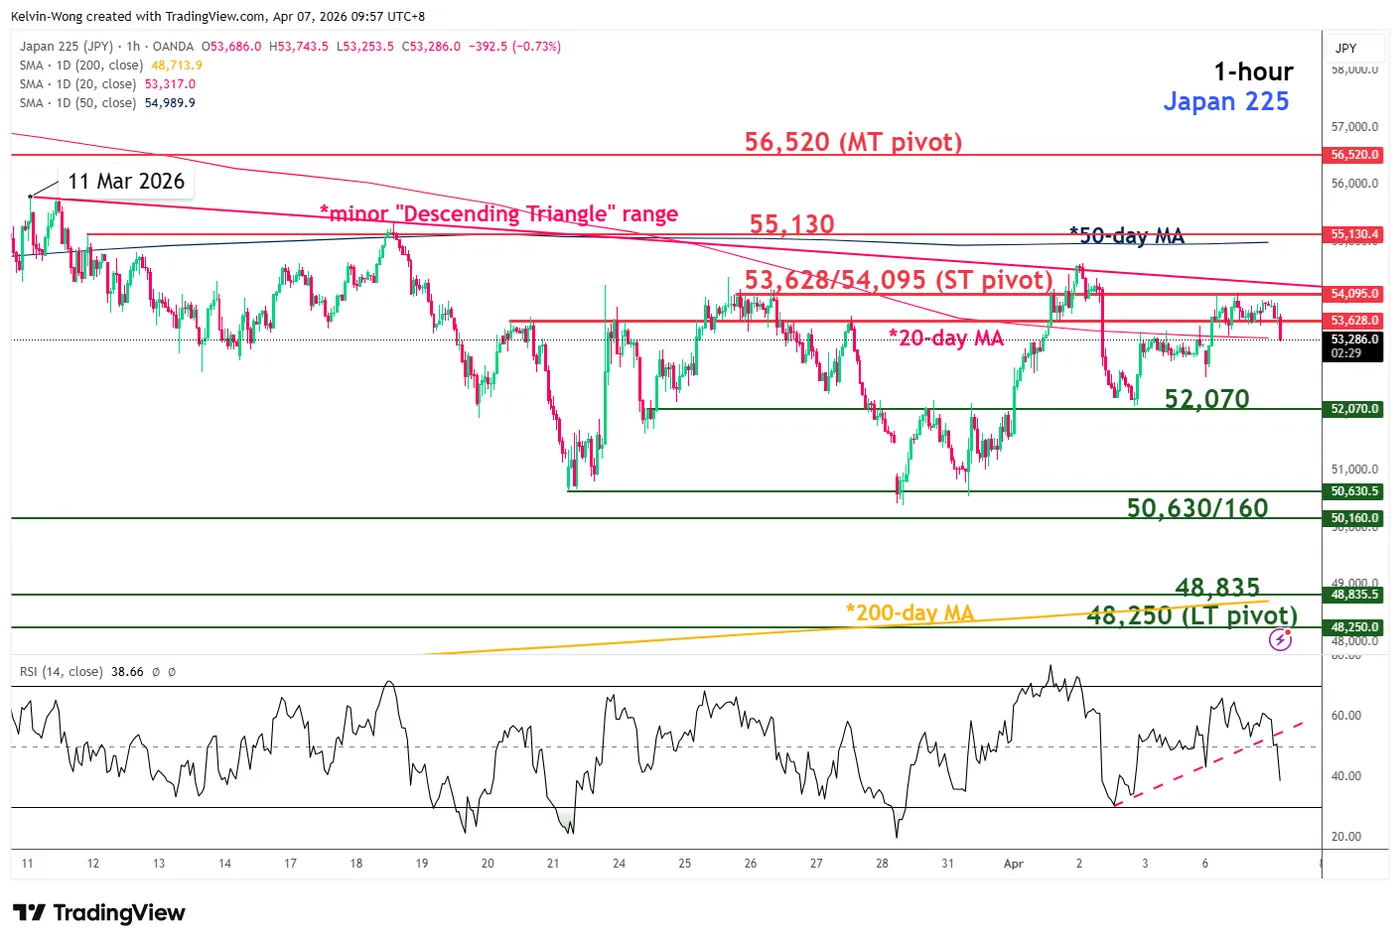
Fig. 3: Japan 225 CFD index minor trend as of 7 Apr 2026 (Source: TradingView).
Since the 11 March 2026 minor swing high, the price actions of the Japan 225 CFD index have been oscillating within a minor bearish continuation “Descending Triangle” range configuration.
The recent rebound of 8% seen from the 30 March 2026 low to 2 April 2026 high has stalled at the upper boundary of the “Descending Triangle” (see Fig. 3).
Watch the 53,628/54,095 short-term pivotal resistance zone for potential bearish reversal back down to retest the “Descending Triangle” range bottom. A break below 52,070 increases the odds of exposing the next intermediate support at 50,630/50,160 in the first step.
Below 50,160 opens scope for a bearish breakdown of the “Descending Triangle” range for a further potential down move towards the 48,835/48,250 long-term pivotal support zone (also the key 200-day moving average).
On the flip side, a clearance with an hourly close above 54,095 invalidates the bearish scenario for another leg of corrective rebound towards the next intermediate resistance at 55,130 (also the 50-day moving average).
Key elements to support the near-term bearish bias on the Nikkei 225
- The hourly RSI momentum indicator has just staged a bearish breakdown below its ascending support at the 50 level.
- The price actions of the Japan 225 have printed a “lower high” right below the “Descending Triangle” range resistance.
WTI Crude Oil Eyes Major Breakout, Surge Could Ignite Powerful Rally
Key Highlights
- WTI Crude Oil prices regained traction and cleared the $105 resistance.
- A key bullish trend line is forming with support at $106 on the 4-hour chart of XTI/USD.
- Gold is facing a major hurdle near $4,820.
- EUR/USD seems to be consolidating above the 1.1500 support.
WTI Crude Oil Price Technical Analysis
WTI Crude Oil prices started a fresh increase above $98 and $100 against the US Dollar. The price cleared many hurdles near $102 to re-enter bullish zone.
Looking at the 4-hour chart of XTI/USD, the price settled well above the 100 simple moving average (red, 4-hour) and the 200 simple moving average (green, 4-hour). On the upside, immediate resistance is near the $115.50 level.
The first key hurdle for the bulls could be $118.00. A close above $118.00 might send Oil prices toward $120.00. Any more gains might call for a test of $125.00 in the near term.
On the downside, the first major support sits near the $108.20 zone. The next support could be $106.00. There is also a key bullish trend line forming with support at $106, below which the price could dive and test $102.00.
A daily close below $102.00 could open the doors for a larger decline. In the stated case, the bears might aim for a drop toward $98.00 and the 100 simple moving average (red, 4-hour).
Looking at Gold, there was a decent increase, but the bulls need to push the price above $4,820 for upside continuation.
Economic Releases to Watch Today
- Euro Zone Services PMI for March 2026 – Forecast 50.1, versus 50.1 previous.
- UK Services PMI for March 2026 – Forecast 51.2, versus 51.2 previous.
- US Durable Goods Orders for Feb 2026 – Forecast -0.5% versus 0% previous.
Inflation “Going Toward Red,” Fed Officials Warn as Stagflation Risks Rise
US inflation risks are intensifying again, with Fed officials warning that price pressures are no longer easing but turning higher as oil shocks and tariffs continue to feed through the economy. Speaking in a joint interview, Austan Goolsbee said inflation is now “going toward red,” highlighting a shift toward more persistent and troubling dynamics.
Goolsbee described the outlook as “at least orange… going from orange to red lately,” pointing to rising gasoline prices and what he called a new stagflationary shock layered on top of existing pressures. He noted that tariff-driven price increases had been expected to fade but “kind of didn’t go away,” adding to concerns that inflation could remain elevated.
Beth Hammack echoed those concerns, emphasizing that inflation has been above target for five years and largely "moving sideways" over the past two. She characterized current conditions as a “vibrant orange,” underscoring persistent price pressures that are proving difficult to bring down.
On the labor market, however, both officials pointed to relative stability. Hammack said the unemployment rate near 4.3% is close to full employment, describing conditions as a “fragile balance” in the yellow-to-green range. Goolsbee was more cautious and gave it a "yellow", noting a “low hiring, low firing” environment driven by uncertainty, but still not weak enough to force policy easing.
The color framework used here offers a simple guide to Goolbee's and Hammack's thinking: green signals an economy on track, yellow reflects balance with some caution, orange points to elevated concern, and red implies conditions that risk getting out of control. With inflation now shifting from orange toward red while the labor market remains closer to yellow, the Fed is facing a clear imbalance—rising price risks without sufficient weakness in employment to justify easing.
Markets Watch for End of War as Oil Stays Above $100 and Stocks Rise
Markets had another volatile week, with headlines around Donald Trump and tensions with Iran moving markets. Early in the week, sentiment improved as Trump talked about easing tensions, which helped U.S. stock markets move higher during the shortened holiday period.
At the same time, oil prices continued to rise, with WTI moving above the $100 level and staying there as the fighting in Iran continued. Higher oil prices helped push USD/JPY above 160, with no clear signs of intervention from the Bank of Japan. U.S. employment data was also much stronger than expected, but the market reaction was limited due to low liquidity during the holiday week.
Comments from Jerome Powell helped ease some inflation concerns and supported sentiment. However, uncertainty around Iran remained, keeping markets cautious overall and volatility high across both oil and stock markets.
Markets This Week
U.S. Stocks
The Dow Jones Industrial Average moved higher last week and broke its recent downtrend as investors started to expect that the conflict with Iran may not get worse. This brought buyers back into the market and improved overall sentiment. Some analysts are now more positive on stocks, saying that unless the situation becomes much worse, large downside moves are less likely. The focus has shifted from selling rallies to looking for buying opportunities on dips. From a technical view, as long as the market stays above the 10-day moving average, buying remains the better approach. If this level holds, short-term momentum should stay positive. Resistance levels are at 47,000, 47,500, and 48,000. Support is seen at 46,000, 45,000, 44,500 and 44,000.
Japanese Stocks
The Nikkei 225 has been volatile recently, moving within a wide range. One of the main concerns is higher oil prices, which could negatively impact the Japanese economy and keep inflation pressure high. At the same time, U.S. equities have started to look more positive, which may help support Japanese stocks in the short term. However, the yen is unlikely to weaken significantly, which could limit further upside in the Nikkei. Overall, with mixed signals from global markets and domestic risks, range trading may be the best approach this week rather than expecting a strong trend in either direction. Resistance is seen at 54,500, 56,000 and 57,000, while support is at 52,000, 51,000, 50,500, and 50,000.
USD/JPY
USD/JPY moved above 160 earlier in the week, supported by higher oil prices. However, despite no intervention, the pair later moved back below 160 as traders started to expect that the conflict with Iran may ease. At the same time, longer-term U.S. interest rates moved lower after comments from Jerome Powell, who suggested inflation may not rise as much as expected. This reduced some of the upward pressure on the dollar. The pair still remains in a slight uptrend overall, but momentum has slowed. For this week, trading the range between 158 and 160 looks like the preferred strategy. Resistance is at 160.00, 160.50, 162, and 165, while support is seen at 159.00, 158.50, 158.00, and 156.50.
Gold
Gold had a strong week as buyers came back into the market. A weaker U.S. dollar and lower long-term interest rates made gold more attractive, helping prices move higher. The short-term trend has now turned positive again after the recent drop, which is supporting more buying. The longer-term trend is still bullish, so buying is likely to continue if the conflict with Iran is expected to come to an end in the coming weeks. Resistance is at $4,800, $4,850, $5,000, and $5,100, while support is at $4,500, $4,400, $4,300, $4,200 and $4,100.
Crude Oil
WTI moved strongly higher last week, pushing well above the $100 level as Donald Trump increased pressure on Iran and concerns grew about supply risks through the Strait of Hormuz. Prices moved closer to the highs seen at the start of the conflict. The overall trend remains strong to the upside, supported by ongoing uncertainty and supply concerns. It is still difficult to predict how the situation will develop, which is keeping volatility high. In the short term, after such a strong move higher, looking for selling opportunities if there are signs the war could be coming to an end may be the easier trade. Resistance is at $120, $125, and $130, while support is at $100,00, $90, $80, $75, $70, and $67.5.
Bitcoin
Bitcoin volatility remains low as overall interest in the market is still limited, and price continues to move within a range. Technical indicators are also mostly sideways, showing no clear trend at the moment. This reflects a lack of strong momentum in either direction. For now, trading the range between $65,000 and $75,000 looks like the best strategy. Resistance is at $75,000, $80,000, and $85,000, while support is at $65,000, $60,000, and $55,000.
This Week’s Focus
- Tuesday: Japan Household Spending, E.U. HCOB Eurozone Services PMI, U.K. S&P Global Composite PMI, U.S. Durable Goods Orders
- Wednesday: Japan Current Account, U.K. S&P Global Construction PMI, U.S. FOMC Meeting Minutes
- Thursday: U.S. Core PCE Price Index and GDP
- Friday: Australia Building Approvals, China CPI and PPI, U.S. CPI, Michigan Consumer Sentiment and Factory Orders
Following the Monday holiday in the U.K. and U.S., markets have a shortened week. President Trump warned that if the Strait of Hormuz is not reopened and there is no progress on ending the conflict by 8 PM ET tomorrow, the U.S. may quickly target key infrastructure. Later in the week, U.S. inflation data will be the main focus and could drive the next move. Markets will look for a reversal if tensions ease, or more volatility if the situation gets worse.
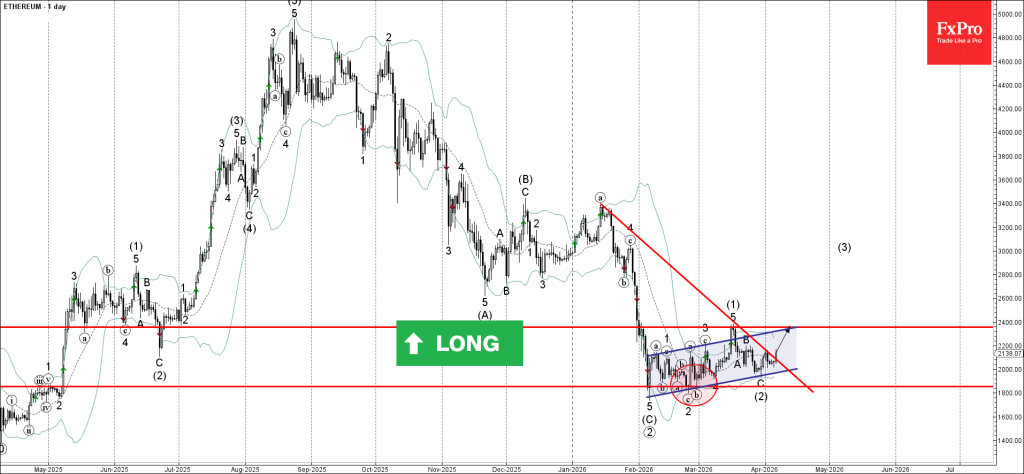
Ethereum Wave Analysis
Ethereum: ⬆️ Buy
- Ethereum reversed from support zone
- Likely to rise to resistance level 2400.00
Ethereum cryptocurrency recently reversed up from the support zone between the support level 1800.00 and the support trendline of the daily up channel from February.
The upward reversal from this support zone completed the previous intermediate ABC correction (2).
Given the improved sentiment across the crypto markets and the strength of the support level 1800.00, Ethereum can be expected to rise to the next resistance level 2400.00 (top of wave (1)).
Eco Data 4/7/26
| GMT | Ccy | Events | Act | Cons | Prev | Rev |
|---|---|---|---|---|---|---|
| 23:30 | JPY | Overall Household Spending Y/Y Feb | -1.80% | -0.70% | -1.00% | |
| 00:00 | AUD | TD-MI Inflation Gauge M/M Mar | 1.30% | -0.20% | ||
| 05:00 | JPY | Leading Economic Index Feb P | 112.4 | 112.4 | 112.4 | 112.1 |
| 07:00 | CHF | Foreign Currency Reserves (CHF) Mar | 721B | 710B | ||
| 07:50 | EUR | France Services PMI Mar F | 48.8 | 48.3 | 48.3 | |
| 07:55 | EUR | Germany Services PMI Mar F | 50.9 | 51.2 | 51.2 | |
| 08:00 | EUR | Eurozone Services PMI Mar F | 50.2 | 50.1 | 50.1 | |
| 08:30 | EUR | Eurozone Sentix Investor Confidence Apr | -19.2 | -7.5 | -3.1 | |
| 08:30 | GBP | Services PMI Mar F | 50.5 | 51.2 | 51.2 | |
| 12:30 | USD | Durable Goods Orders Feb | -1.40% | -1.00% | 0.00% | |
| 12:30 | USD | Durable Goods Orders ex Transport Feb | 0.80% | 0.50% | 0.40% | |
| 14:00 | CAD | Ivey PMI Mar | 49.7 | 57.2 | 56.6 |
| 23:30 | JPY |
| Overall Household Spending Y/Y Feb | |
| Actual | -1.80% |
| Consensus | -0.70% |
| Previous | -1.00% |
| 00:00 | AUD |
| TD-MI Inflation Gauge M/M Mar | |
| Actual | 1.30% |
| Consensus | |
| Previous | -0.20% |
| 05:00 | JPY |
| Leading Economic Index Feb P | |
| Actual | 112.4 |
| Consensus | 112.4 |
| Previous | 112.4 |
| Revised | 112.1 |
| 07:00 | CHF |
| Foreign Currency Reserves (CHF) Mar | |
| Actual | 721B |
| Consensus | |
| Previous | 710B |
| 07:50 | EUR |
| France Services PMI Mar F | |
| Actual | 48.8 |
| Consensus | 48.3 |
| Previous | 48.3 |
| 07:55 | EUR |
| Germany Services PMI Mar F | |
| Actual | 50.9 |
| Consensus | 51.2 |
| Previous | 51.2 |
| 08:00 | EUR |
| Eurozone Services PMI Mar F | |
| Actual | 50.2 |
| Consensus | 50.1 |
| Previous | 50.1 |
| 08:30 | EUR |
| Eurozone Sentix Investor Confidence Apr | |
| Actual | -19.2 |
| Consensus | -7.5 |
| Previous | -3.1 |
| 08:30 | GBP |
| Services PMI Mar F | |
| Actual | 50.5 |
| Consensus | 51.2 |
| Previous | 51.2 |
| 12:30 | USD |
| Durable Goods Orders Feb | |
| Actual | -1.40% |
| Consensus | -1.00% |
| Previous | 0.00% |
| 12:30 | USD |
| Durable Goods Orders ex Transport Feb | |
| Actual | 0.80% |
| Consensus | 0.50% |
| Previous | 0.40% |
| 14:00 | CAD |
| Ivey PMI Mar | |
| Actual | 49.7 |
| Consensus | 57.2 |
| Previous | 56.6 |
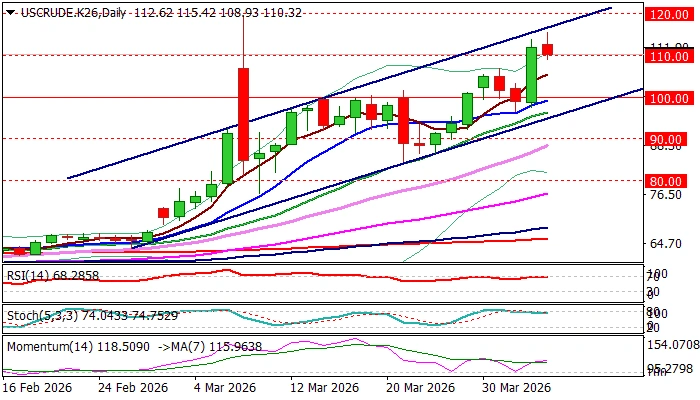
WTI Oil: Bulls Pause Under One-Month High
WTI oil price edged lower on Monday after hitting new marginally higher high ($115.42) on a partial profit taking from over 13% rally in the previous trading session on Thursday.
Traders were cautiously optimistic and awaited more details about potential peace talks between the USA and Iran but remain on high alerts on threats of more negative impact from prolonged supply disruption, in the scenario of failure of peace talks and escalation of the conflict.
Technical picture remains bullish overall on daily and weekly charts, with large bullish weekly candle adding to supportive factors, although overbought conditions warn of further headwinds bulls may face on the way towards initial targets at $120 zone.
Consolidation with limited dips (to be ideally contained at $105/$104 zone) is needed to keep broader bulls intact and mark a healthy correction of the latest upleg ($84.49/$115.42) ahead of fresh push higher.
Caution on dips below psychological $100 support (also 50% retracement of $84.49/$115.42) which may trigger deeper pullback and expose next key support at $97.00 (bull-channel support line).
Res: 113.94; 115.42; 117.08; 120.00.
Sup: 108.93; 106.82; 103.60; 100.00.
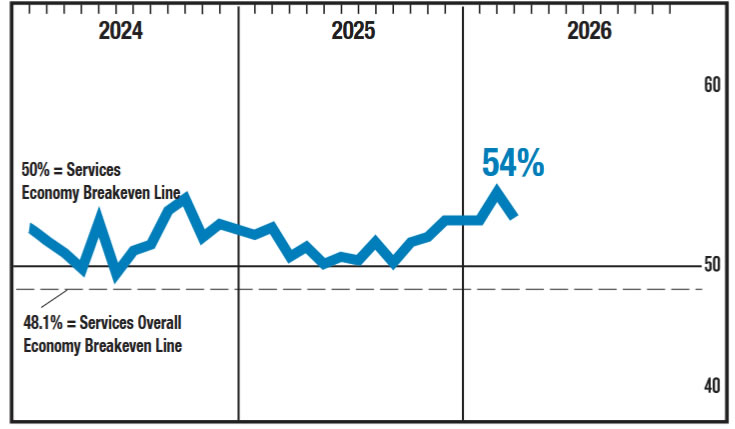
US ISM Services Misses as Prices Jump to 2022 High, Jobs Contract on Iran Oil Shock
US ISM Services PMI slowed in March, but the bigger signal came from inflation, with prices surging to the highest level since 2022 as the Iran-driven oil shock feeds through the economy. The headline index fell from 56.1 to 54.0, missing expectations of 55.0, pointing to moderating growth even as cost pressures intensify.
Under the hood, activity softened notably. Business Activity/Production dropped from 59.9 to 53.9, its lowest level since September 2025. Employment fell from 51.8 to 45.2, slipping back into contraction for the first time in four months. This suggests firms are becoming more cautious on hiring even as demand conditions remain mixed.
At the same time, demand has yet to roll over. New Orders rose from 58.6 to 60.6, indicating resilience in underlying consumption. However, the divergence between strong orders and weakening employment highlights growing uncertainty among businesses as cost pressures rise.
The inflation side was the standout. Prices jumped sharply from 63.0 to 70.7, the highest reading since October 2022, driven by rising fuel and transportation costs linked to the Middle East conflict. ISM noted that “the predominant commentary this month was about impacts and adjustments due to the conflict with Iran,” with companies reporting higher gas and diesel prices and building inventories to guard against disruptions.
Supply chains are also feeling the strain. Supplier Deliveries rose from 53.9 to 56.2, reflecting slower deliveries amid shipping disruptions and flight issues.
Overall, while the index still points to around 1.9% annualized GDP growth, the mix of cooling activity and surging prices reinforces a stagflation signal.
Silver Flushes Weak Hands, Finds Floor at 70, But 80 Remains Out of Reach
Silver didn’t just survive last Thursday’s selloff—it revealed something important. The nearly 9% plunge was a stress test, and the market’s response—holding firmly above 70—signals that the defense of 70 is more than technical noise. It may mark the point where control shifted from weak to strong hands.
The selloff could have delivered a clean positioning reset. Leveraged longs were forced out in size, with weak hands flushed out in a single session. But what followed was just as critical: strong hands stepping in quickly, absorbing supply and preventing a deeper breakdown.
Crucially, the market refused to wait for 60. That level remains the most important value zone, yet buyers chose to act early, stepping in at 70 instead. This behavior reflects a change in mindset—less patience, more urgency—as participants position ahead of tightening supply conditions and persistent geopolitical uncertainty.
Those structural factors are still in play. With supply deficits extending into a fifth consecutive year, Silver has a fundamental cushion underneath it. This doesn’t guarantee a rally, but it strengthens the case that the downside is increasingly supported, especially after such a sharp flush lower.
However, the upside story remains incomplete. Silver continues to face yield-driven pressure, with its non-yielding asset sensitivity limiting gains in a high-rate environment. A move toward 80 will need yield relief, likely through falling US 10 yield from the current 4.3% towards 4.2%. Until that happens, rallies—while possible—are likely to stall below key resistance, leaving 80 just out of reach for now.
Technically, for now, further rise is expected as long as 66.70 support holds. Break of 76.29 will resume the rebound from 60.97 towards 38.2% retracement of 121.83 to 60.97 at 84.21. However, break of 66.70 will likely bring another test of 60.97, or probably even a brief breach of 60 psychological level, before Silver forms a durable bottom.
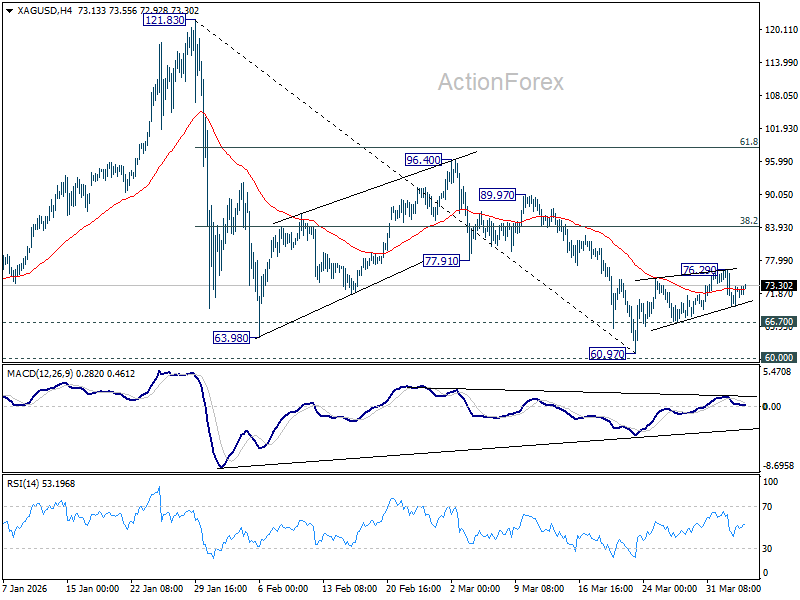
Chart Alert: WTI Crude Oil Whipsawed Above 20-day MA Ahead of Trump’s Speech and US-Iran Ceasefire Hopes
Key takeaways
- Volatility driven by ceasefire uncertainty: WTI crude surged above $102.25 to as high as $116 before reversing sharply, with an intraday whipsaw driven by conflicting signals around a potential US–Iran ceasefire and Trump’s rhetoric.
- Ceasefire expectations skewed to June: Prediction market assigns low odds of a ceasefire by end-April (~22.5%) but sees a higher probability (~51.5%) by end-June, keeping near-term geopolitical risk elevated.
- WTI bullish trend intact but key levels critical: The breakout above $102.25 signals a continuing bullish sequence, with upside toward $124–$132 if momentum holds, while a break below $102.25 risks a pullback toward $96–$93.
The West Texas oil CFD (a proxy of the WTI crude oil futures) has staged the expected bullish move, where it cleared above $102.25 per barrel and hit a closing level of $112.84 last Thursday, 2 April 2026, before the Easter holiday.
Market participants continue to discount the “optimism of a ceasefire deal” between the US and Iran from US President Trump’s social media posts and public speeches made in the past week.
In today’s early Asian session (Monday, 6 April 2026), the price actions of the West Texas oil CFD gapped up by 2.9% to print a current intraday high of $116.17, just shy of its 4-year high of $119.54 recorded on 9 March 2026, as the market digested the possibilities of further hostilities between US and Iran where Trump posted a social media with foul language, warning Iran’s power infrastructure will be destroyed if Tehran does not open the Strait of Hormuz by Tuesday, 7 April 2026 8.00 p.m. Eastern Time (an extension of an earlier Monday deadline).
Interestingly, the earlier gains of the West Texas oil CFD were all wiped out as it declined by 2.3% at $110.27 at the time of writing.
Ceasefire hopes are the primary driver of the current intraday whipsawing in oil prices. An Axios report stated that the US, Iran, and a group of regional mediators are discussing terms for a potential 45-day ceasefire that may lead to a permanent end to the war. In addition, US President Trump said he plans a news conference on Monday at 1.00 p.m. Eastern Time.
Prediction market is still expecting a US-Iran ceasefire in June 2026
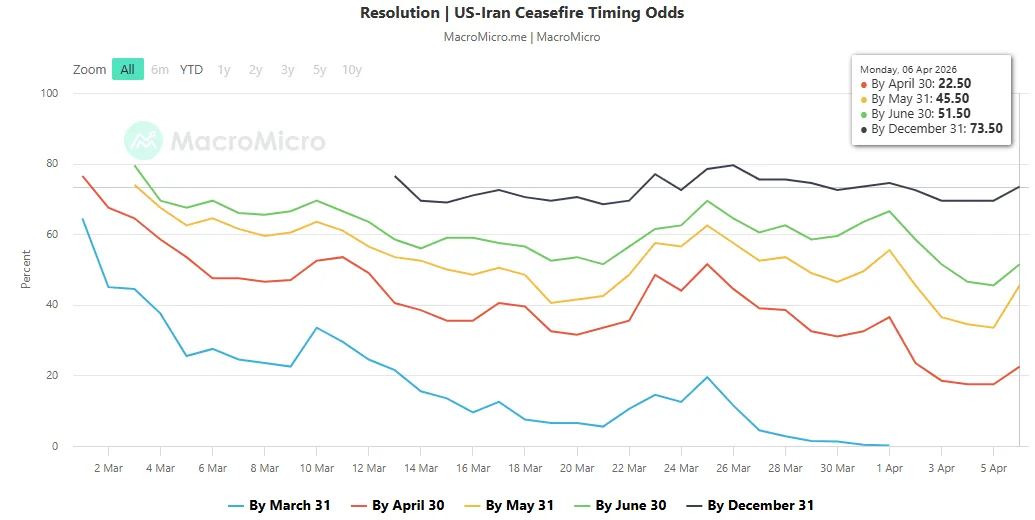
Fig. 1: Polymarket US-Iran ceasefire timing odds as of 6 Apr 2026 (Source: MacroMicro).
The above chart reflects the market-implied probability of an official ceasefire agreement between the US and Iran on various specific dates from the prediction market platform, Polymarket, where participants trade contracts based on the probability of future events.
As of Monday, 6 April 2026, the probability of a ceasefire by 30 April remains low at 22.5%, while the likelihood rises significantly to 51.5% by 30 June (see Fig. 1).
Let’s now focus on the potential short-term trajectory (1 to 3 days) of WTI crude oil from a technical analysis perspective
WTI Crude Oil – Minor bullish impulsive up sequence from 23 March 2026 low remains intact
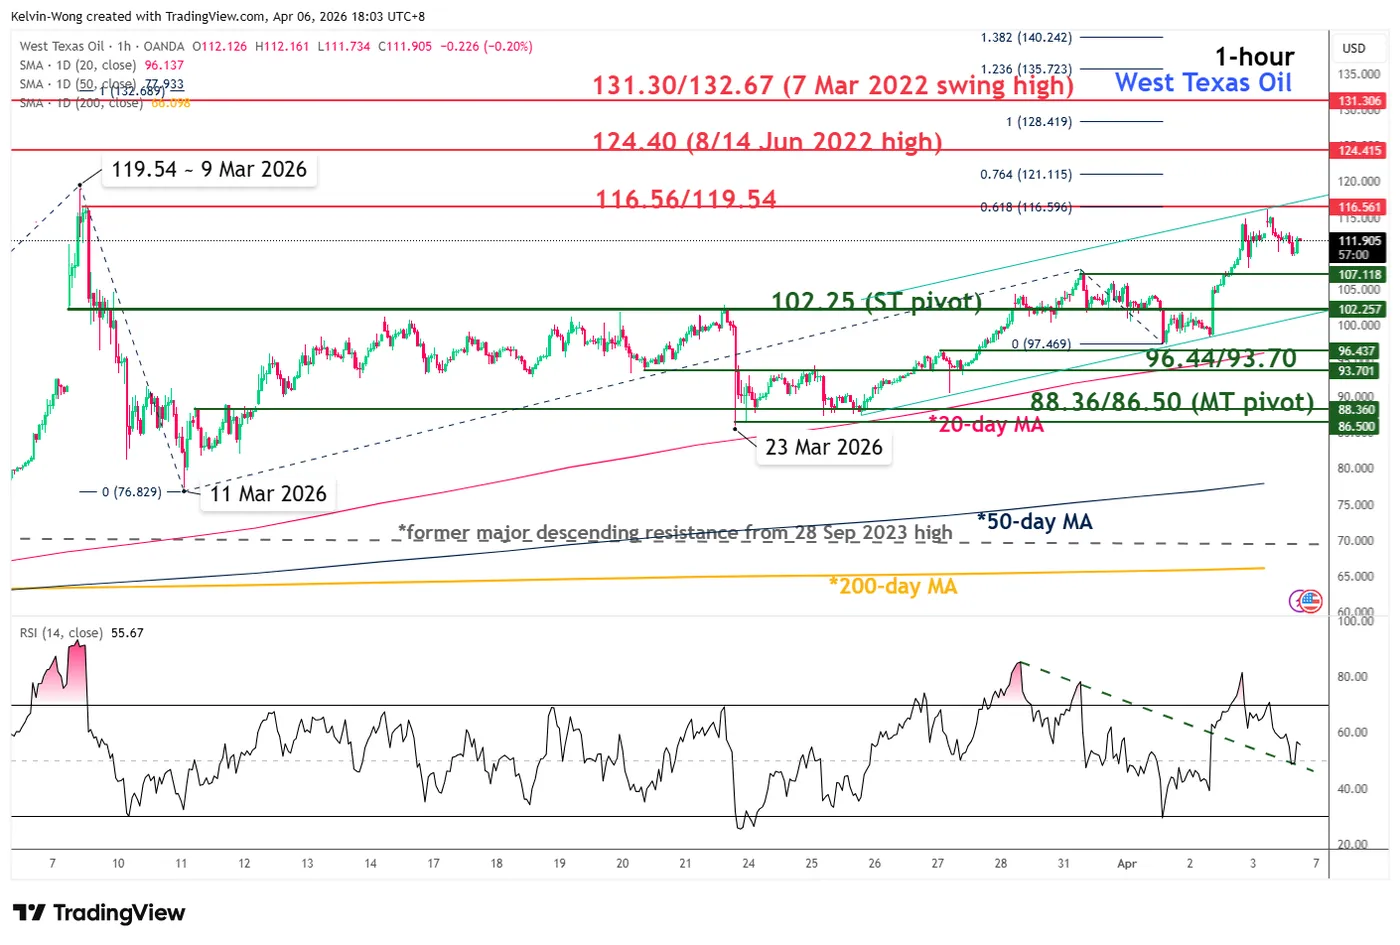
Fig. 2: West Texas Oil CFD minor trend as of 27 Mar 2026 (Source: TradingView).
The West Texas oil CFD (a proxy of the WTI crude oil futures) managed to stage a bullish breakout last Thursday, 2 April 2026, from a three-week sideways range configuration
Hence, a potential minor bullish impulsive up move sequence has kick-started from its 23 March 2026 low (see Fig. 2).
Watch the $102.25 short-term pivotal support to maintain the near-term bullish bias. A clearance above $116.56/119.54 sees the next intermediate resistances to come in at $124.40 and $131.30/132.67(also close to a Fibonacci extension cluster).
However, failure to hold at $102.25 and an hourly close below it negates the bullish tone for another round of minor corrective pull-back to retest the next intermediate support zone at $96.44/93.70 (also the 20-day moving average).
Key elements to support the near-term bearish bias on WTI crude oil
- The price actions have continued to oscillate within a minor ascending channel in place since the 23 March 2026 low, with its channel support coming in at around $102.25
- The hourly RSI momentum indicator is still holding above its pull-back support at around the 50 level.