
Sample Category Title
Summary 4/6 – 4/10
Monday, Apr 6, 2026
| GMT | Ccy | Events | Cons | Prev |
|---|---|---|---|---|
| 14:00 | USD | ISM Services PMI Mar | 55 | 56.1 |
| 14:00 | USD | ISM Services Prices Paid Mar | 63 | |
| 14:00 | USD | ISM Services Employment Mar | 51.8 |
| 14:00 | USD |
| ISM Services PMI Mar | |
| Consensus | 55 |
| Previous | 56.1 |
| 14:00 | USD |
| ISM Services Prices Paid Mar | |
| Consensus | |
| Previous | 63 |
| 14:00 | USD |
| ISM Services Employment Mar | |
| Consensus | |
| Previous | 51.8 |
Tuesday, Apr 7, 2026
| GMT | Ccy | Events | Cons | Prev |
|---|---|---|---|---|
| 23:30 | JPY | Overall Household Spending Y/Y Feb | -0.70% | -1.00% |
| 00:00 | AUD | TD-MI Inflation Gauge M/M Mar | -0.20% | |
| 05:00 | JPY | Leading Economic Index Feb P | 112.4 | 112.4 |
| 07:00 | CHF | Foreign Currency Reserves (CHF) Mar | 710B | |
| 07:50 | EUR | France Services PMI Mar F | 48.3 | 48.3 |
| 07:55 | EUR | Germany Services PMI Mar F | 51.2 | 51.2 |
| 08:00 | EUR | Eurozone Services PMI Mar F | 50.1 | 50.1 |
| 08:30 | EUR | Eurozone Sentix Investor Confidence Apr | -7.5 | -3.1 |
| 08:30 | GBP | Services PMI Mar F | 51.2 | 51.2 |
| 12:30 | USD | Durable Goods Orders Feb | -1.00% | 0.00% |
| 12:30 | USD | Durable Goods Orders ex Transport Feb | 0.50% | 0.40% |
| 14:00 | CAD | Ivey PMI Mar | 57.2 | 56.6 |
| 23:30 | JPY |
| Overall Household Spending Y/Y Feb | |
| Consensus | -0.70% |
| Previous | -1.00% |
| 00:00 | AUD |
| TD-MI Inflation Gauge M/M Mar | |
| Consensus | |
| Previous | -0.20% |
| 05:00 | JPY |
| Leading Economic Index Feb P | |
| Consensus | 112.4 |
| Previous | 112.4 |
| 07:00 | CHF |
| Foreign Currency Reserves (CHF) Mar | |
| Consensus | |
| Previous | 710B |
| 07:50 | EUR |
| France Services PMI Mar F | |
| Consensus | 48.3 |
| Previous | 48.3 |
| 07:55 | EUR |
| Germany Services PMI Mar F | |
| Consensus | 51.2 |
| Previous | 51.2 |
| 08:00 | EUR |
| Eurozone Services PMI Mar F | |
| Consensus | 50.1 |
| Previous | 50.1 |
| 08:30 | EUR |
| Eurozone Sentix Investor Confidence Apr | |
| Consensus | -7.5 |
| Previous | -3.1 |
| 08:30 | GBP |
| Services PMI Mar F | |
| Consensus | 51.2 |
| Previous | 51.2 |
| 12:30 | USD |
| Durable Goods Orders Feb | |
| Consensus | -1.00% |
| Previous | 0.00% |
| 12:30 | USD |
| Durable Goods Orders ex Transport Feb | |
| Consensus | 0.50% |
| Previous | 0.40% |
| 14:00 | CAD |
| Ivey PMI Mar | |
| Consensus | 57.2 |
| Previous | 56.6 |
Wednesday, Apr 8, 2026
| GMT | Ccy | Events | Cons | Prev |
|---|---|---|---|---|
| 23:30 | JPY | Labor Cash Earnings Y/Y Feb | 2.70% | 3.00% |
| 02:00 | NZD | RBNZ Interest Rate Decision | 2.25% | 2.25% |
| 05:00 | JPY | Eco Watchers Survey: Current Mar | 47.9 | 48.9 |
| 06:00 | EUR | Germany Factory Orders M/M Feb | 3.20% | -11.10% |
| 07:00 | CHF | Unemployment Rate M/M Mar | 3.00% | 3.00% |
| 08:30 | GBP | Construction PMI Mar | 43.6 | 44.5 |
| 09:00 | EUR | Eurozone PPI M/M Feb | -0.70% | 0.70% |
| 09:00 | EUR | Eurozone PPI Y/Y Feb | -3.00% | -2.10% |
| 09:00 | EUR | Eurozone Retail Sales M/M Feb | -0.20% | -0.10% |
| 14:30 | USD | Crude Oil Inventories (Apr 3) | -1.0M | 5.5M |
| 18:00 | USD | FOMC Minutes |
| 23:30 | JPY |
| Labor Cash Earnings Y/Y Feb | |
| Consensus | 2.70% |
| Previous | 3.00% |
| 02:00 | NZD |
| RBNZ Interest Rate Decision | |
| Consensus | 2.25% |
| Previous | 2.25% |
| 05:00 | JPY |
| Eco Watchers Survey: Current Mar | |
| Consensus | 47.9 |
| Previous | 48.9 |
| 06:00 | EUR |
| Germany Factory Orders M/M Feb | |
| Consensus | 3.20% |
| Previous | -11.10% |
| 07:00 | CHF |
| Unemployment Rate M/M Mar | |
| Consensus | 3.00% |
| Previous | 3.00% |
| 08:30 | GBP |
| Construction PMI Mar | |
| Consensus | 43.6 |
| Previous | 44.5 |
| 09:00 | EUR |
| Eurozone PPI M/M Feb | |
| Consensus | -0.70% |
| Previous | 0.70% |
| 09:00 | EUR |
| Eurozone PPI Y/Y Feb | |
| Consensus | -3.00% |
| Previous | -2.10% |
| 09:00 | EUR |
| Eurozone Retail Sales M/M Feb | |
| Consensus | -0.20% |
| Previous | -0.10% |
| 14:30 | USD |
| Crude Oil Inventories (Apr 3) | |
| Consensus | -1.0M |
| Previous | 5.5M |
| 18:00 | USD |
| FOMC Minutes | |
| Consensus | |
| Previous | |
Thursday, Apr 9, 2026
| GMT | Ccy | Events | Cons | Prev |
|---|---|---|---|---|
| 23:01 | GBP | RICS Housing Price Balance Mar | -18% | -12% |
| 05:00 | JPY | Consumer Confidence Mar | 38.4 | 40 |
| 06:00 | JPY | Machine Tool Orders Y/Y Mar F | 24.20% | |
| 06:00 | EUR | Germany Industrial Production M/M Feb | 0.70% | -0.50% |
| 06:00 | EUR | Germany Trade Balance (EUR) Feb | 18.6B | 21.2B |
| 12:30 | USD | Initial Jobless Claims (Apr 3) | 210K | 202K |
| 12:30 | USD | GDP Annualized Q4 F | 0.70% | 0.70% |
| 12:30 | USD | GDP Price Index Q4 F | 3.80% | 3.80% |
| 12:30 | USD | Personal Income M/M Feb | 0.30% | 0.40% |
| 12:30 | USD | Personal Spending M/M Feb | 0.50% | 0.40% |
| 12:30 | USD | PCE Price Index M/M Feb | 0.40% | 0.30% |
| 12:30 | USD | PCE Price Index Y/Y Feb | 2.80% | 2.80% |
| 12:30 | USD | PCE Core Price Index M/M Feb | 0.40% | 0.40% |
| 12:30 | USD | PCE Core Price Index Y/Y Feb | 3.00% | 3.10% |
| 14:00 | USD | Whole Sale Inventories Feb F | -0.50% | -0.50% |
| 14:30 | USD | Natural Gas Storage (Apr 3) | 41B | 36B |
| 23:01 | GBP |
| RICS Housing Price Balance Mar | |
| Consensus | -18% |
| Previous | -12% |
| 05:00 | JPY |
| Consumer Confidence Mar | |
| Consensus | 38.4 |
| Previous | 40 |
| 06:00 | JPY |
| Machine Tool Orders Y/Y Mar F | |
| Consensus | |
| Previous | 24.20% |
| 06:00 | EUR |
| Germany Industrial Production M/M Feb | |
| Consensus | 0.70% |
| Previous | -0.50% |
| 06:00 | EUR |
| Germany Trade Balance (EUR) Feb | |
| Consensus | 18.6B |
| Previous | 21.2B |
| 12:30 | USD |
| Initial Jobless Claims (Apr 3) | |
| Consensus | 210K |
| Previous | 202K |
| 12:30 | USD |
| GDP Annualized Q4 F | |
| Consensus | 0.70% |
| Previous | 0.70% |
| 12:30 | USD |
| GDP Price Index Q4 F | |
| Consensus | 3.80% |
| Previous | 3.80% |
| 12:30 | USD |
| Personal Income M/M Feb | |
| Consensus | 0.30% |
| Previous | 0.40% |
| 12:30 | USD |
| Personal Spending M/M Feb | |
| Consensus | 0.50% |
| Previous | 0.40% |
| 12:30 | USD |
| PCE Price Index M/M Feb | |
| Consensus | 0.40% |
| Previous | 0.30% |
| 12:30 | USD |
| PCE Price Index Y/Y Feb | |
| Consensus | 2.80% |
| Previous | 2.80% |
| 12:30 | USD |
| PCE Core Price Index M/M Feb | |
| Consensus | 0.40% |
| Previous | 0.40% |
| 12:30 | USD |
| PCE Core Price Index Y/Y Feb | |
| Consensus | 3.00% |
| Previous | 3.10% |
| 14:00 | USD |
| Whole Sale Inventories Feb F | |
| Consensus | -0.50% |
| Previous | -0.50% |
| 14:30 | USD |
| Natural Gas Storage (Apr 3) | |
| Consensus | 41B |
| Previous | 36B |
Friday, Apr 10, 2026
| GMT | Ccy | Events | Cons | Prev |
|---|---|---|---|---|
| 22:30 | NZD | Business NZ PMI Mar | 55 | |
| 23:50 | JPY | PPI Y/Y Mar | 2.30% | 2.00% |
| 01:30 | CNY | CPI Y/Y Mar | 1.20% | 1.30% |
| 01:30 | CNY | PPI Y/Y Mar | 0.50% | -0.90% |
| 06:00 | EUR | Germany CPI M/M Mar F | 1.10% | 1.10% |
| 06:00 | EUR | Germany CPI Y/Y Mar F | 2.70% | 2.70% |
| 12:30 | CAD | Net Change in Employment Mar | 12.6K | -83.9K |
| 12:30 | CAD | Unemployment Rate Mar | 6.80% | 6.70% |
| 12:30 | USD | CPI M/M Mar | 1.00% | 0.30% |
| 12:30 | USD | CPI Y/Y Mar | 3.40% | 2.40% |
| 12:30 | USD | CPI Core M/M Mar | 0.30% | 0.20% |
| 12:30 | USD | CPI Core Y/Y Mar | 2.70% | 2.50% |
| 14:00 | USD | UoM Consumer Sentiment Apr P | 52.1 | 53.3 |
| 14:00 | USD | UoM 1-Yr Inflation Expectations Apr P | 3.80% | |
| 14:00 | USD | Factory Orders M/M Feb | -0.20% | 0.10% |
| 22:30 | NZD |
| Business NZ PMI Mar | |
| Consensus | |
| Previous | 55 |
| 23:50 | JPY |
| PPI Y/Y Mar | |
| Consensus | 2.30% |
| Previous | 2.00% |
| 01:30 | CNY |
| CPI Y/Y Mar | |
| Consensus | 1.20% |
| Previous | 1.30% |
| 01:30 | CNY |
| PPI Y/Y Mar | |
| Consensus | 0.50% |
| Previous | -0.90% |
| 06:00 | EUR |
| Germany CPI M/M Mar F | |
| Consensus | 1.10% |
| Previous | 1.10% |
| 06:00 | EUR |
| Germany CPI Y/Y Mar F | |
| Consensus | 2.70% |
| Previous | 2.70% |
| 12:30 | CAD |
| Net Change in Employment Mar | |
| Consensus | 12.6K |
| Previous | -83.9K |
| 12:30 | CAD |
| Unemployment Rate Mar | |
| Consensus | 6.80% |
| Previous | 6.70% |
| 12:30 | USD |
| CPI M/M Mar | |
| Consensus | 1.00% |
| Previous | 0.30% |
| 12:30 | USD |
| CPI Y/Y Mar | |
| Consensus | 3.40% |
| Previous | 2.40% |
| 12:30 | USD |
| CPI Core M/M Mar | |
| Consensus | 0.30% |
| Previous | 0.20% |
| 12:30 | USD |
| CPI Core Y/Y Mar | |
| Consensus | 2.70% |
| Previous | 2.50% |
| 14:00 | USD |
| UoM Consumer Sentiment Apr P | |
| Consensus | 52.1 |
| Previous | 53.3 |
| 14:00 | USD |
| UoM 1-Yr Inflation Expectations Apr P | |
| Consensus | |
| Previous | 3.80% |
| 14:00 | USD |
| Factory Orders M/M Feb | |
| Consensus | -0.20% |
| Previous | 0.10% |
Non-Farm Payrolls for March Large Beat on Expectations! Markets Closed for Good Friday
The March Non-Farm Payrolls (NFP) report just dropped into a ghost town but came with a major surprise: +178K vs 60K expectations.
This completely erases the prior month's -92K release (which did get revised down to -133K – But even this got overshaded by today's release
This led to a drop in the Unemployment rate to 4.3% (from 4.4%) with the unrounded number at 4.256%
With major US equity and commodity markets fully closed for Good Friday, only Futures are opened and they are quite stuck, in an abbreviated holiday session (Open until 13:30 ET), Wall Street is left holding a massive data release with almost nowhere to trade it.
US Stock Futures and Bonds still sold off as the data pushes back against Cuts even further, as if they were even part of the discussion – The US Dollar is up slightly but its change is measly.
As the economy really seems to be picking up again, traders will have to remain careful on the possible pricing for hikes – That will have to be seen again in the next few months, as the data will progressively reflect higher energy costs.
(Gas prices have been out of this world to be fair – This will weigh on activity).
Stock Futures are selling off
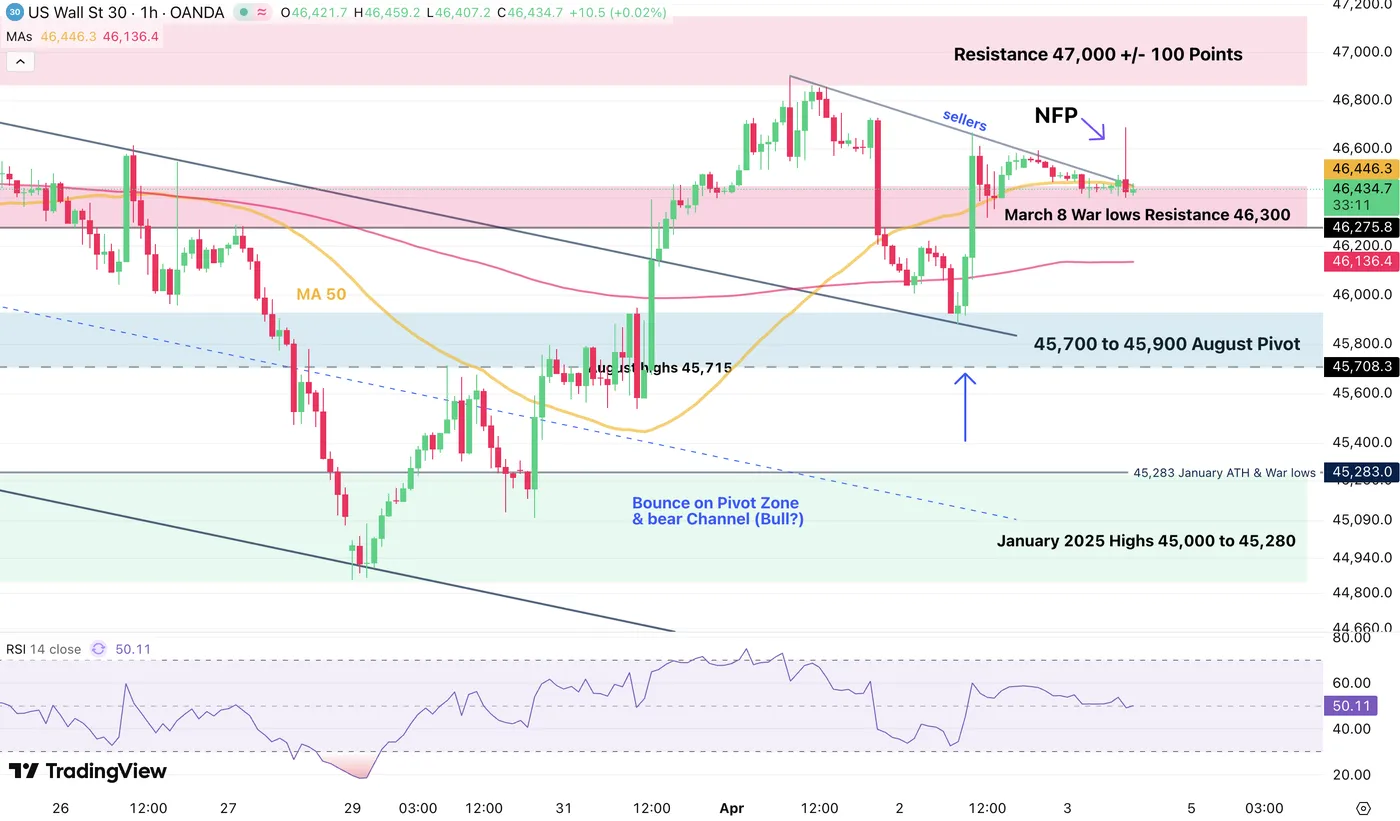
Dow Jones 1H Chart. April 3, 2026 – Source: TradingView
Some algos lost their minds at the release but this did not last long – Stocks remain below their bearish trendline.
Bonds follow suit
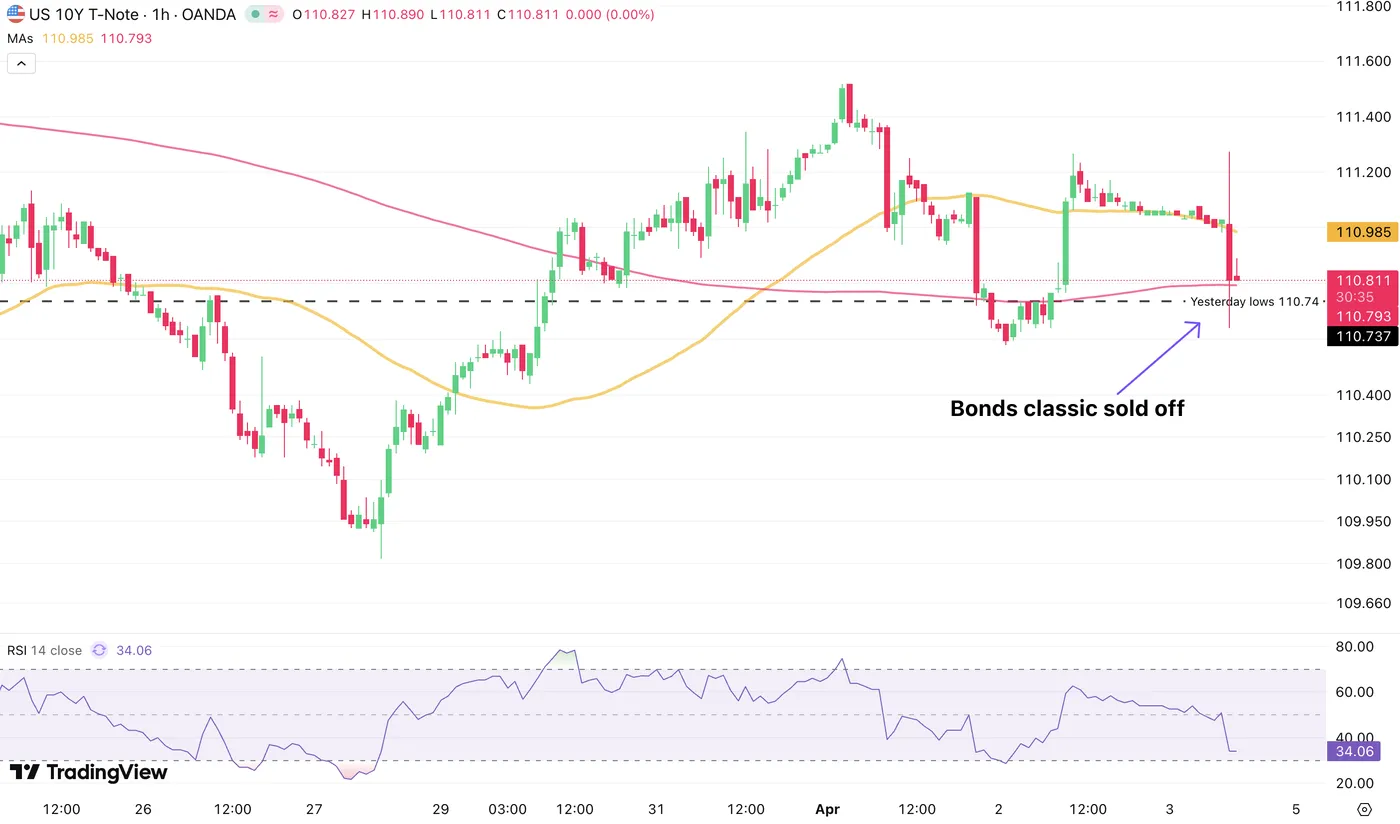
Bonds 1H Chart. April 3, 2026 – Source: TradingView
Happy Holidays and enjoy the long weekend!
Things could get very wild at the Monday re-open but could only really pick up on Tuesday, with the heaviest participants only coming back at that time
Gold: The Three-Year Rally May Not Be Over Yet
The Middle East conflict is weighing on gold prices amid expectations that central banks will raise interest rates to address rising inflation driven by oil prices. This seems like a knee-jerk reaction, as this is precisely how central banks acted in 2022. Moreover, it is widely acknowledged that this was a belated response. Another factor working against gold is the reduction in gold purchases, as well as the sale of gold from reserves to support national currencies, as India and Turkey have been doing recently. It is possible that many others are doing the same, but we are not yet aware.
This is a rather short-sighted approach, as current fuel prices are a shock to consumers, and this will be followed by a shock to the economy, requiring monetary policy to be eased, not tightened. However, we first need to hear that central banks share this view; for now, they remain focused on inflation.
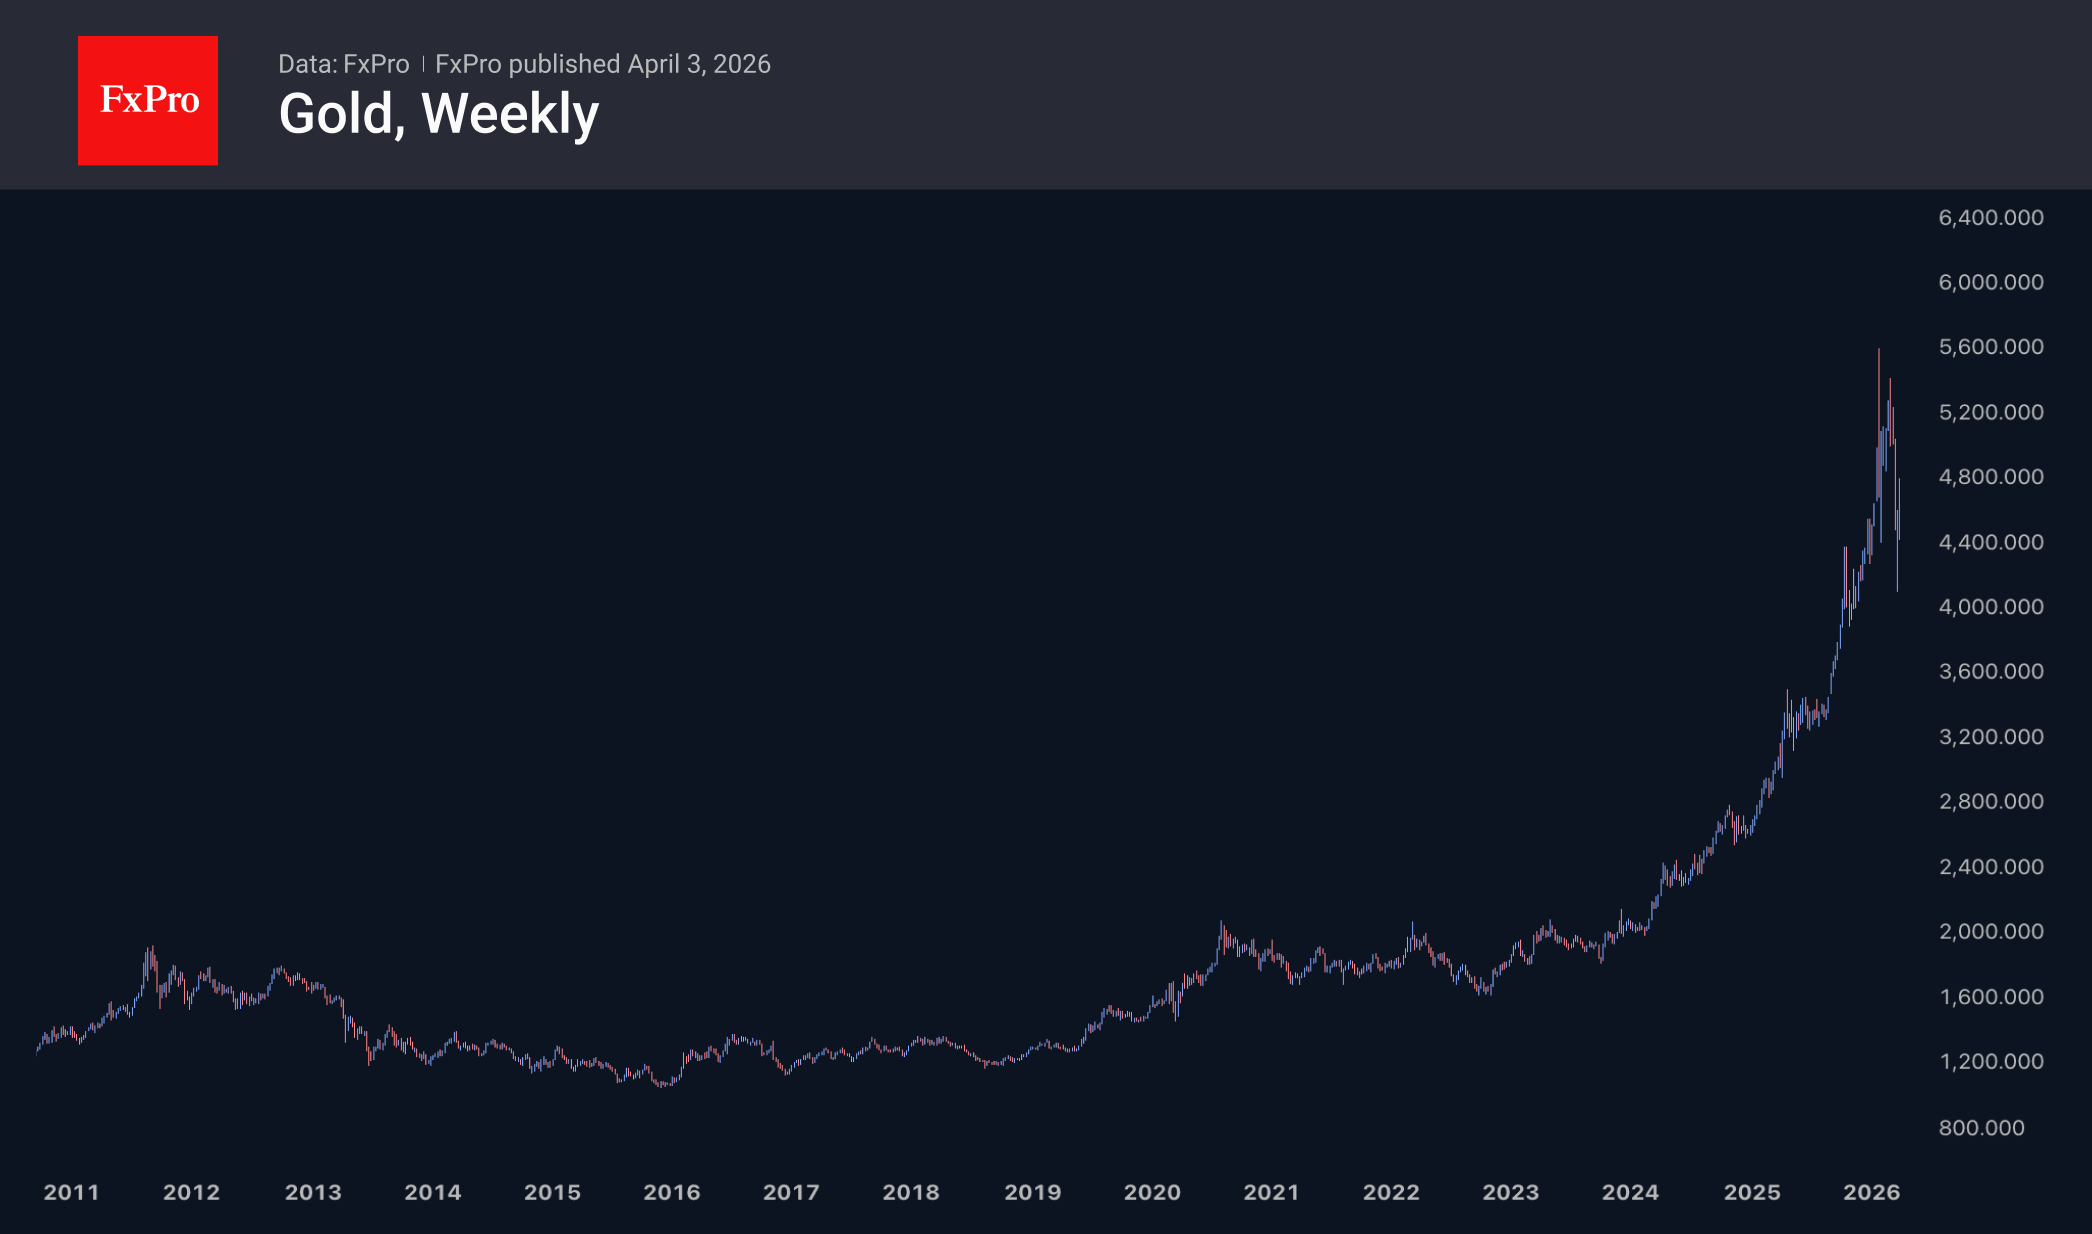
Among the medium-term price targets, $4,200 remains significant. A fall in the price of gold to this level would still be within the uptrend. A break below this level would signal a reversal of the three-year uptrend. A rebound from this level would keep alive the hope that the bullish trend in gold is not yet over.
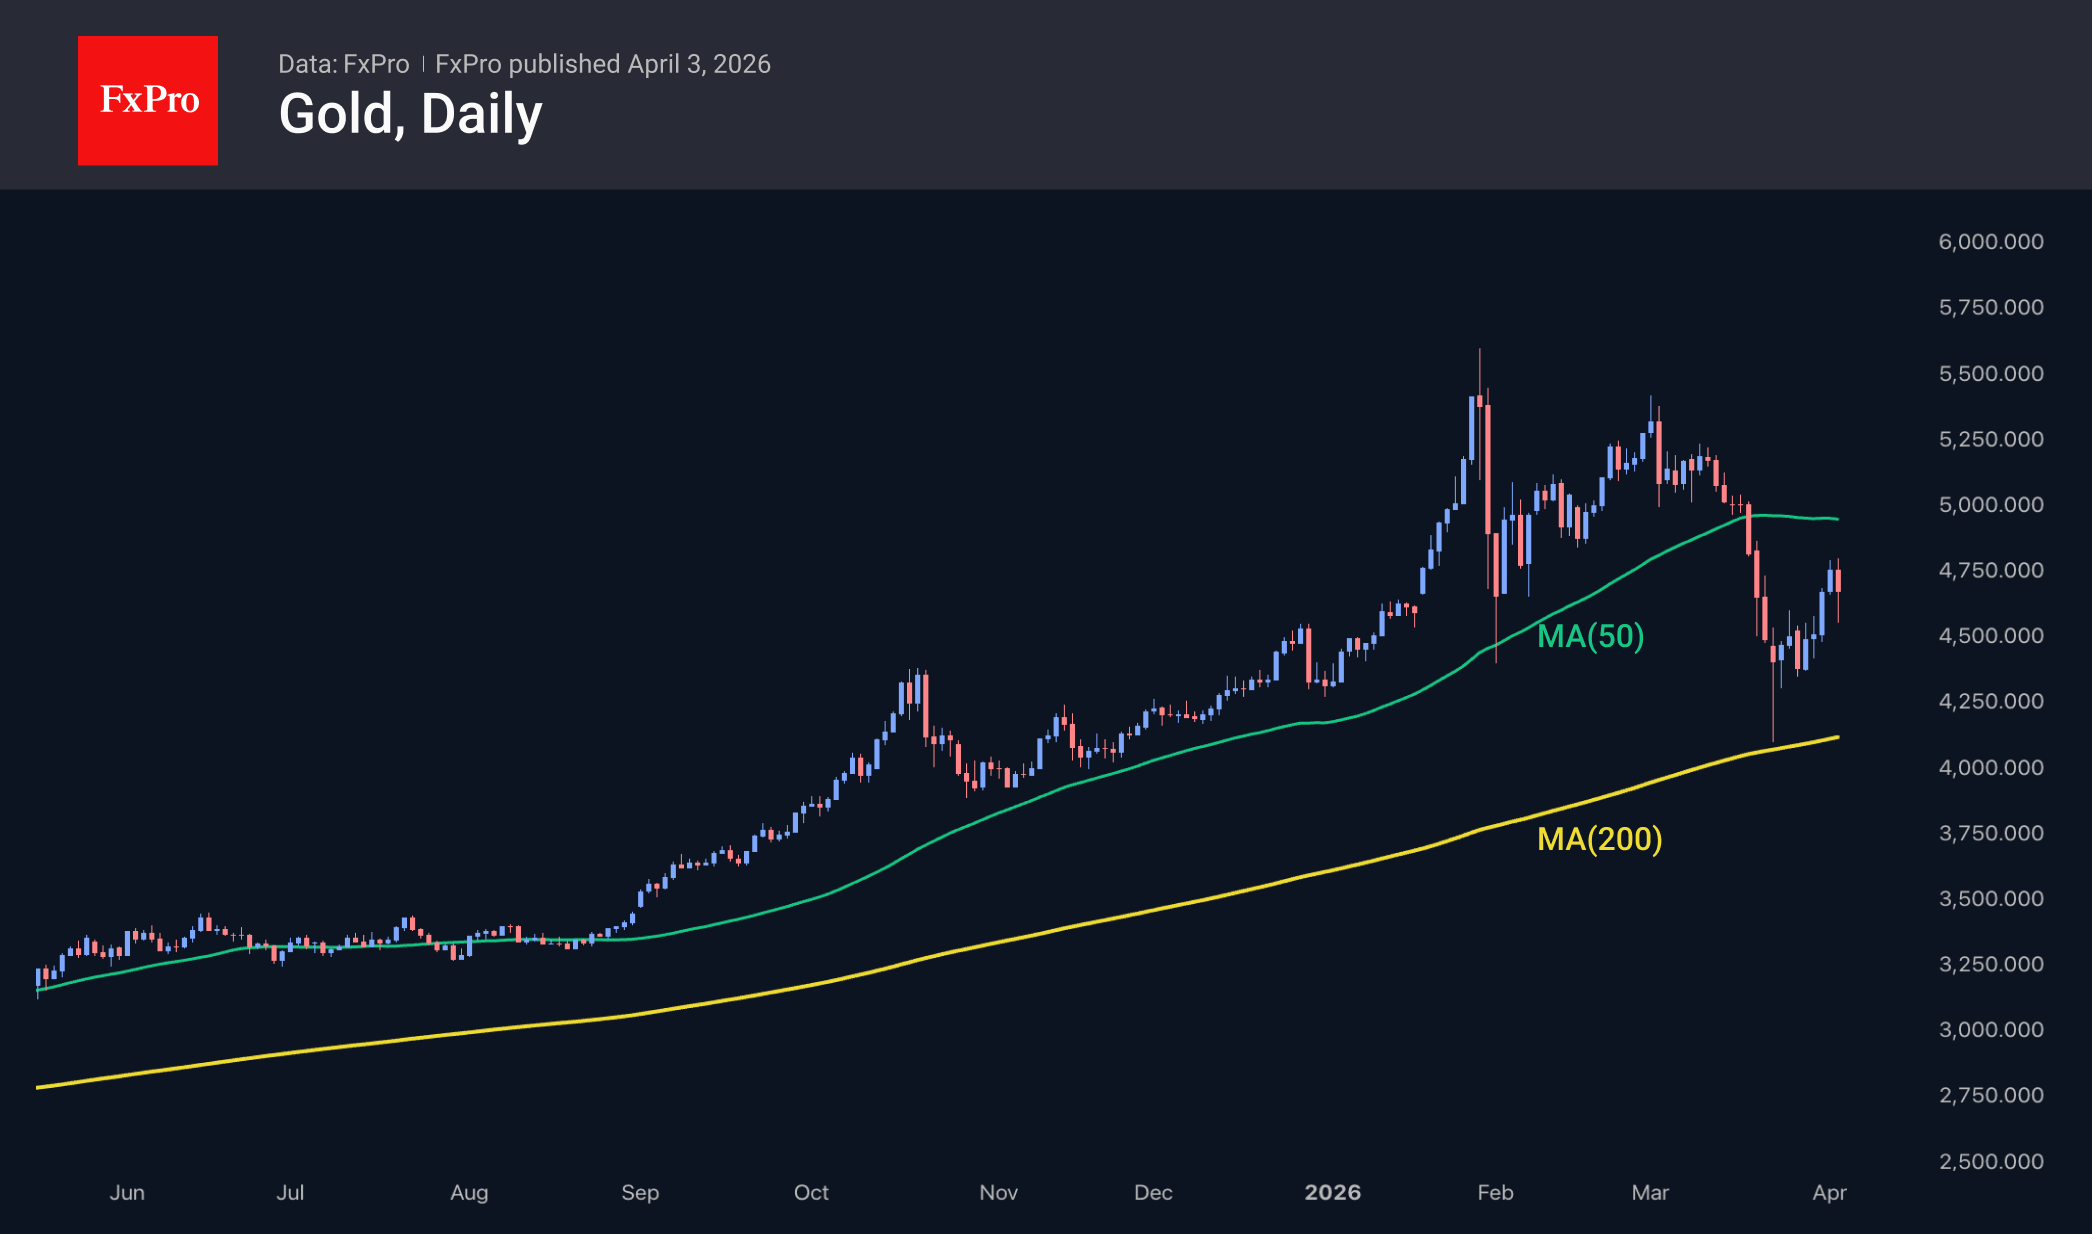
From a technical analysis perspective, last week, gold may have found support at the 200-day MA during its decline to $4,100. Strong buying continued right up until Thursday morning, when the price touched $4,800. The subsequent dip following Trump’s hawkish rhetoric did not trigger a fresh wave of selling in gold, keeping hopes alive for a return to the bullish trend.
It is quite possible that gold will test the 50-day MA near $5,000 once again next week, finally shaking off oversold conditions. This suggests a positive outlook for next week, but we remain cautiously pessimistic over the longer term, anticipating a decline to $4,200 in the medium term and a low of $3,300 for the bearish cycle we are already in.
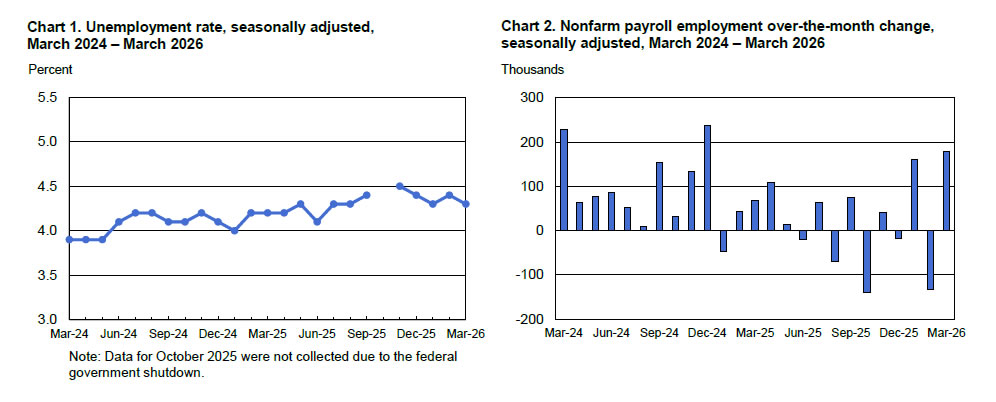
US: Payrolls Surge in March While Unemployment Rate Ticks Down to 4.3%
Nonfarm payrolls rose by 178k in March, well ahead of the consensus forecast calling for a gain of 65k. Revisions to the two prior months subtracted a total of 7k from the previously reported figures.
- Smoothing through the volatility, nonfarm payrolls averaged 68k per-month over the last three months or slightly above the breakeven rate of 30k-50k.
Private payrolls rose by an impressive 186k – its strongest monthly gain since December 2024 – following a decline of 129k in February. The bulk of the gains were concentrated in health care & social assistance (+89.9k), construction (+26k) and transportation & warehousing (+21K), though a number of other industries also added jobs on the month. Meanwhile, the federal government shed 18k jobs.
In the household survey, the labor force plummeted (-396k) by considerably more than civilian employment (-64k), pushing the unemployment rate down a tick to 4.3%. The labor force participation rate fell to 61.9% (from 62.0% the month prior), which is its lowest level since late-2021.
Average hourly earnings (AHE) rose 0.2% month-on-month (m/m), or roughly half the gain seen in February. On a twelve-month basis, AHE ticked down to 3.5% (from 3.8%).
Key Implications
Payrolls surprised to the upside in March, handily beating expectations but also more than reversing February's pullback which was impacted by strike and weather-related effects. Encouragingly, the breadth of hiring widened to its highest level since December 2023, suggesting it wasn't only a reversal of February effects driving last month's gains.
This morning's report will come as welcome news for policymakers as it helps to assuage any fear that may have arisen following February's weak employment report. Stability in the labor market should allow policymakers to sit tight and better assess the economic impacts stemming from higher oil prices over the coming months. While we still see a path for a few more rate cuts later this year, the window could be narrowing, especially if March's strength in the labor market were to persist and oil prices were to remain elevated.
US NFP Beats Strongly at 178k, Unemployment Falls as Wage Growth Misses
US labor market showed strong resilience in March, with non-farm payrolls rising 178k, far above expectations of 48k. The solid gain more than offset the downward revision in February, which was revised from -92k to -133k, while January’s figure was revised higher from 126k to 160k, reinforcing a volatile hiring trend.
The unemployment rate fell from 4.4% to 4.3%, beating expectations, although the participation rate edged lower from 62.0% to 61.9%, suggesting part of the decline was driven by a smaller labor force.
However, wage dynamics were softer than expected. Average hourly earnings rose 0.2% mom, below the 0.3% forecast, with annual growth at 3.5% yoy.
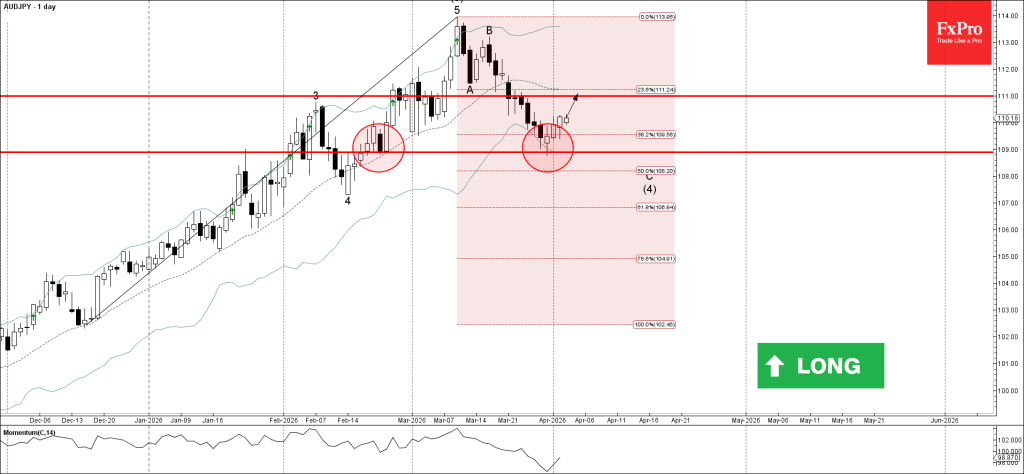
AUDJPY Wave Analysis
AUDJPY: ⬆️ Buy
- AUDJPY reversed from support zone
- Likely to rise to resistance level 111.00
AUDJPY currency pair recently reversed up from the support zone between support level 109.00, lower daily Bollinger Band and the 38.2% Fibonacci correction of the upward impulse from December.
The upward reversal from the support level 109.00 created the daily Japanese candlesticks reversal pattern Morning Star, highlighted below.
Given the strong daily uptrend, AUDJPY currency pair can be expected to rise to the next resistance level 111.00.
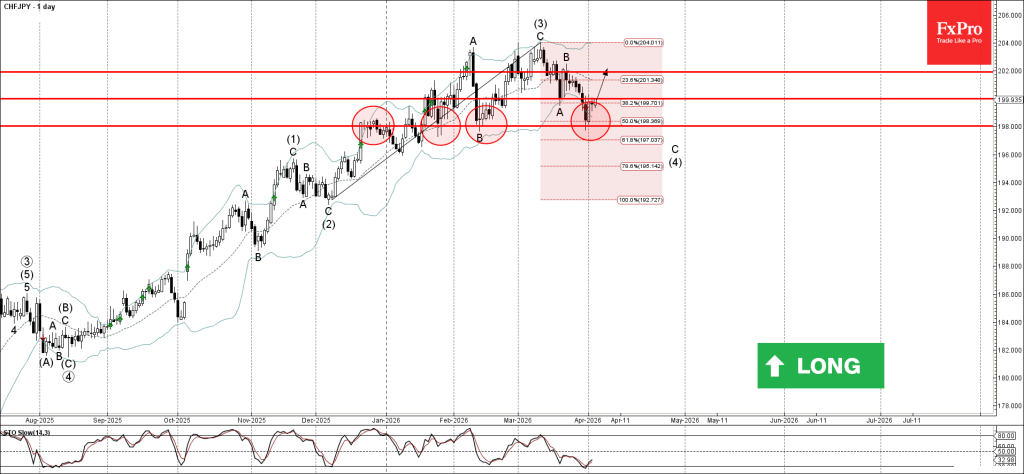
CHFJPY Wave Analysis
CHFJPY: ⬆️ Buy
- CHFJPY reversed from support zone
- Likely to rise to resistance level 202.00
CHFJPY currency pair recently reversed up from the support area located between support level 198.00 (former resistance from December, which has been reversing the pair for the last 3 months), lower daily Bollinger Band and the 50% Fibonacci correction of the upward impulse from December.
The upward reversal from the support level 109.00 created the daily Japanese candlesticks reversal pattern Bullish Engulfing.
Given the prevailing daily uptrend, CHFJPY currency pair can be expected to rise to the next resistance level 202.00 (top of earlier wave B).
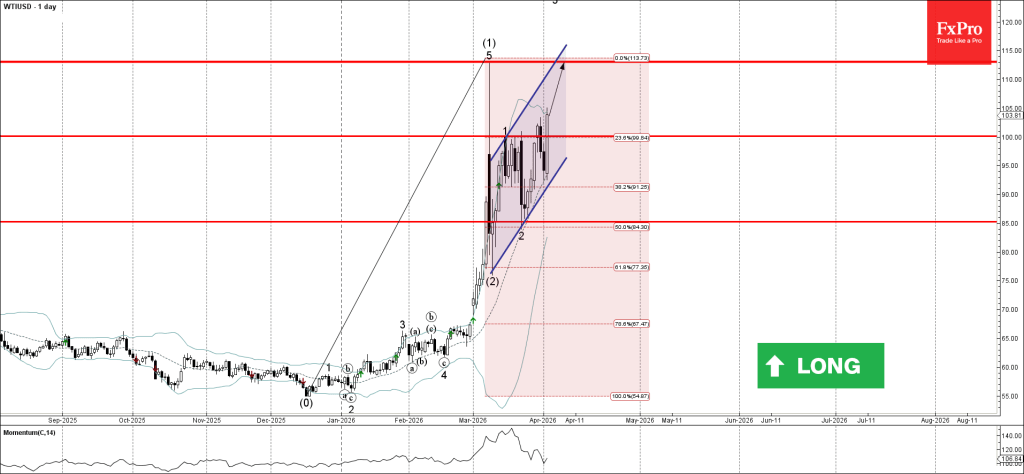
WTI Crude Oil Wave Analysis
WTI Crude Oil: ⬆️ Buy
- WTI Crude Oil broke round resistance level 100.00
- Likely to rise to resistance level 113.00
WTI Crude Oil recently broke above the round resistance level 100.00, which reversed the price multiple times in March as can be seen below
The breakout of the resistance level 100.00 continues the active short-term impulse wave 3 of the intermediate impulse wave (3) from last month.
Given the strong daily uptrend, WTI Crude Oil can be expected to rise to the next resistance level 113.00 (which stopped the previous sharp impulse wave (3)).
GBP/USD: Geopolitical Tensions Drive Pound Selling
GBP/USD stabilised around 1.3227 on Friday following a sharp decline the previous day. Rising geopolitical tensions have weighed on the pound following fresh statements from US President Donald Trump. Increased military rhetoric towards Iran and the lack of clarity regarding the reopening of the Strait of Hormuz have led to a jump in oil prices and heightened demand for the US dollar as a safe-haven asset.
Additional pressure on the pound stems from the UK's heavy reliance on energy imports and concerns about public finances. Yields on British government bonds have risen in tandem with energy prices, adding further strain on the currency.
Overall, market dynamics are unfolding in accordance with a classic risk-off scenario. Rising oil prices and heightened geopolitical risks are weighing on most assets, while the US dollar remains the key safe-haven currency.
Sterling had already fallen approximately 1.9% against the dollar in March amid fears of an energy shock.
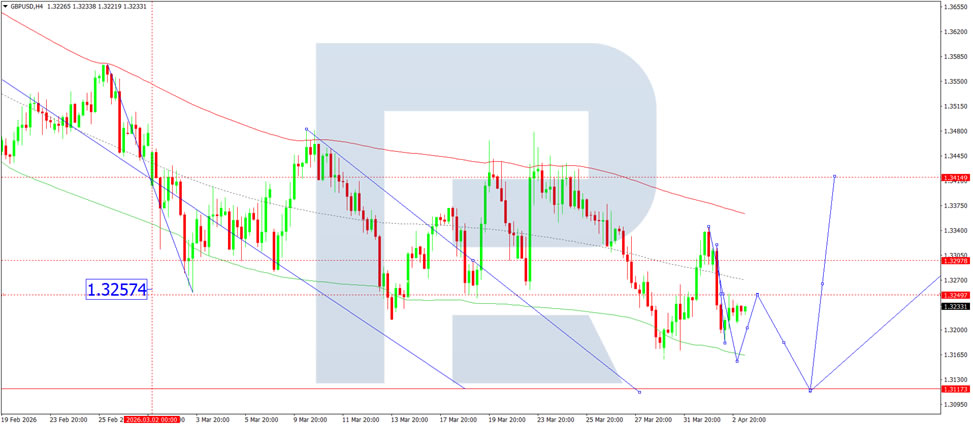
Technical Analysis
On the H4 GBP/USD chart, the market is forming a broad consolidation range around the 1.3250 level, currently extending down to 1.3180. A short-term move towards 1.3250 is expected. Following the completion of this correction, a new consolidation range is likely to form. An upside breakout would open the way for a continuation move to 1.3300, while a downside breakout would suggest further movement to 1.3100. Technically, this scenario is confirmed by the MACD indicator, with its signal line below zero and pointing firmly downwards.
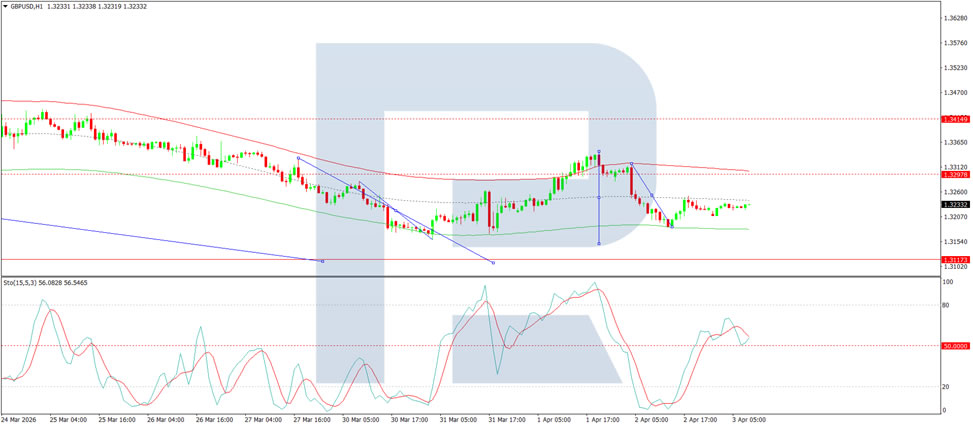
On the H1 chart, the market has formed a compact consolidation range around 1.3254. A downside breakout has initiated a wave structure extending to 1.3100. Should this level be breached, further downside potential towards 1.3050 would emerge. Conversely, an upside breakout from the range may trigger a rebound to 1.3300. Technically, this scenario is confirmed by the Stochastic oscillator, with its signal line below 50 and pointing downwards.
Conclusion
GBP/USD remains under sustained pressure as President Trump's escalated military rhetoric towards Iran and the unresolved status of the Strait of Hormuz drive oil prices higher, bolstering safe-haven demand for the US dollar. The UK's energy import dependence and fragile public finances leave sterling particularly vulnerable in this risk-off environment. Having already lost nearly 2% in March, the pound faces continued headwinds, with technical indicators pointing to further downside potential. Near-term stabilisation is possible, but any sustained recovery would likely require a tangible de-escalation in geopolitical tensions or a shift in broader risk sentiment.
Dollar Lagging Behind Oil
- Politics explains the dollar’s sluggish rise amid rising oil prices.
- USDJPY bulls have grown immune to verbal intervention.
Brent saw a sharp rally amid renewed threats from Donald Trump, but EURUSD stabilised after a decline amid expectations for the US employment report. Bloomberg experts forecast a return to growth in non-farm payrolls in March following one of the sharpest declines in February. Unemployment is expected to remain at 4.4%.
Stabilisation of the labour market will allow the Fed to focus on consumer prices. According to John Williams, President of the New York Fed, the risks to employment and inflation are balanced, allowing rates to be kept at current levels. A strengthening labour market will allow the FOMC to begin discussing a rate hike, which is good news for the dollar.
Strong oil prices are helping the dollar rise, but it is clearly lagging behind the rally in Brent and WTI. One reason is the high premiums for political uncertainty in the US, which are undermining confidence in the US currency and government bonds.
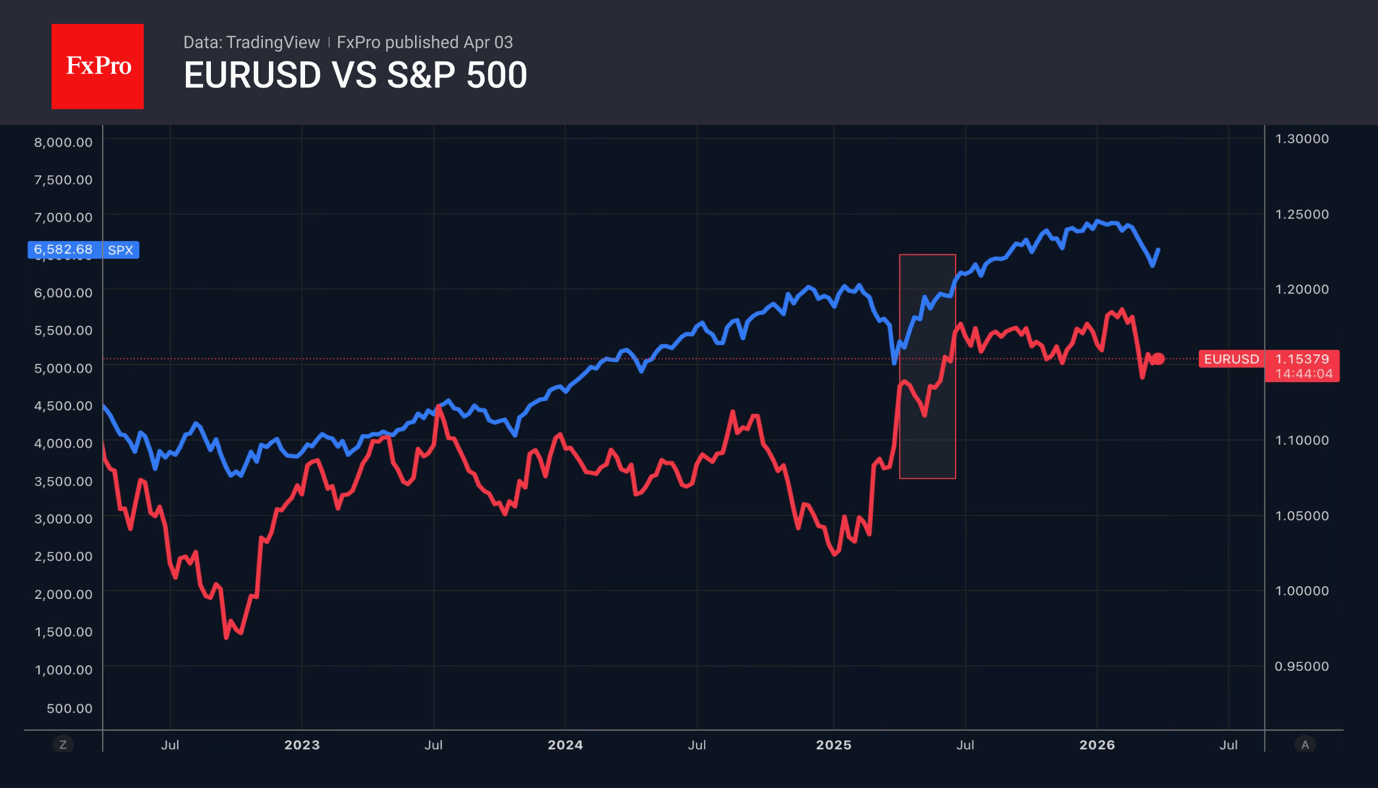
Another factor holding back the bears on EURUSD is the still-lingering hope for a swift end to the conflict in the Middle East. Investors fear missing out on a post-war rally, similar to the surge in the S&P 500 and other risk assets following Liberation Day. If these illusions fade and markets come to believe that the war will drag on for months, the US dollar will strengthen further against major global currencies.
This includes the yen, which has developed immunity to verbal interventions. Finance Minister Satsuki Katayama noted that Donald Trump’s remarks had a significant impact on financial markets. Speculative volatility is rising in both the forex market and oil futures. Her department is ready to take action on all fronts. To officials’ disappointment, such rhetoric has not halted the rise of USDJPY.