
Sample Category Title
Dollar Lagging Behind Oil
- Politics explains the dollar’s sluggish rise amid rising oil prices.
- USDJPY bulls have grown immune to verbal intervention.
Brent saw a sharp rally amid renewed threats from Donald Trump, but EURUSD stabilised after a decline amid expectations for the US employment report. Bloomberg experts forecast a return to growth in non-farm payrolls in March following one of the sharpest declines in February. Unemployment is expected to remain at 4.4%.
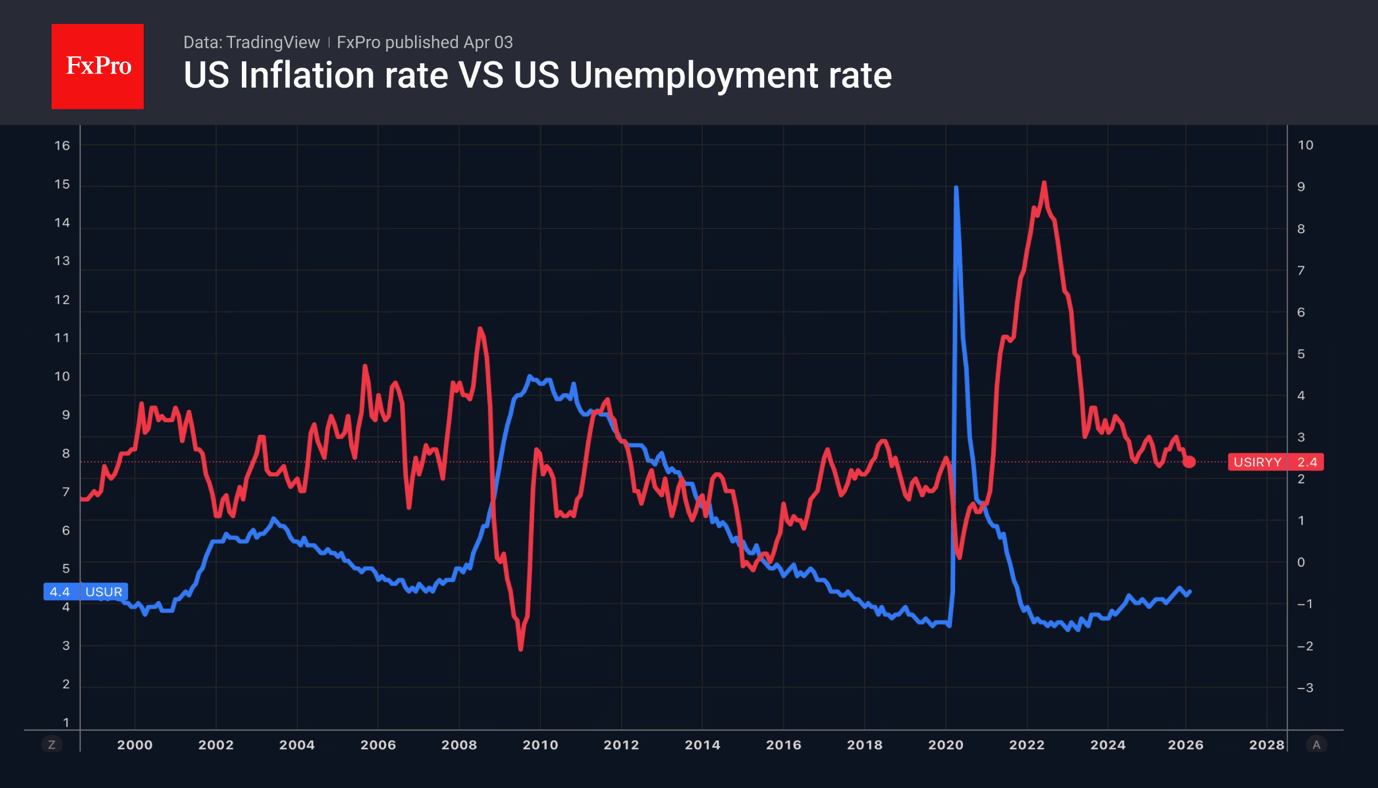
Stabilisation of the labour market will allow the Fed to focus on consumer prices. According to John Williams, President of the New York Fed, the risks to employment and inflation are balanced, allowing rates to be kept at current levels. A strengthening labour market will allow the FOMC to begin discussing a rate hike, which is good news for the dollar.
Strong oil prices are helping the dollar rise, but it is clearly lagging behind the rally in Brent and WTI. One reason is the high premiums for political uncertainty in the US, which are undermining confidence in the US currency and government bonds.
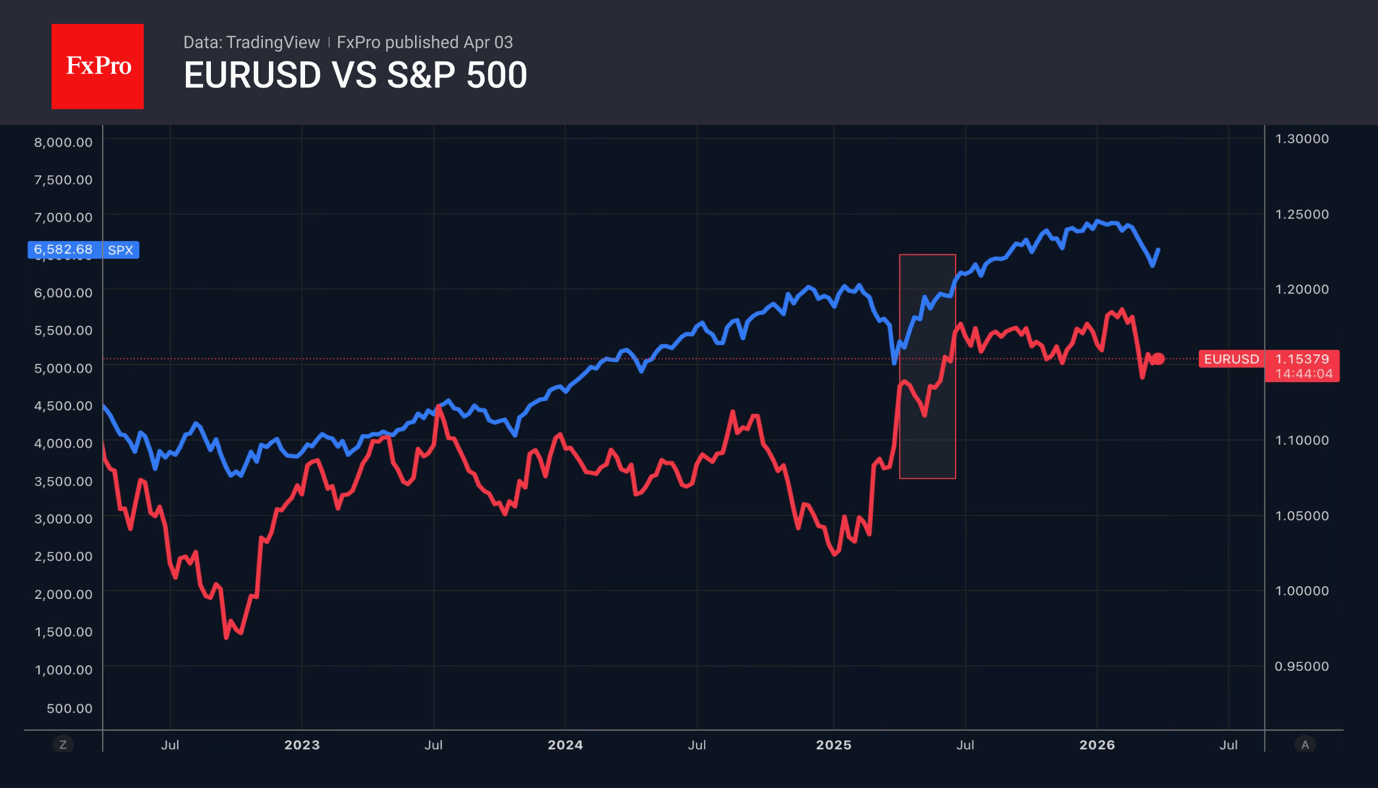
Another factor holding back the bears on EURUSD is the still-lingering hope for a swift end to the conflict in the Middle East. Investors fear missing out on a post-war rally, similar to the surge in the S&P 500 and other risk assets following Liberation Day. If these illusions fade and markets come to believe that the war will drag on for months, the US dollar will strengthen further against major global currencies.
This includes the yen, which has developed immunity to verbal interventions. Finance Minister Satsuki Katayama noted that Donald Trump’s remarks had a significant impact on financial markets. Speculative volatility is rising in both the forex market and oil futures. Her department is ready to take action on all fronts. To officials’ disappointment, such rhetoric has not halted the rise of USDJPY.
Crypto Market Being Held Down at the Month’s Low
Market Overview
The crypto market capitalisation has remained close to $2.30T for the second day running, with a wide range of performance among coins: from losers such as Uniswap (−2.7%), Immutable (−2.4%) and BNB (−0.7%) to the leaders Algorand (+20%), IOTA (+6.9%) and Cosmos (+5.3%). Meanwhile, the top five altcoins and BTC have changed in price by less than 1% over the last day.
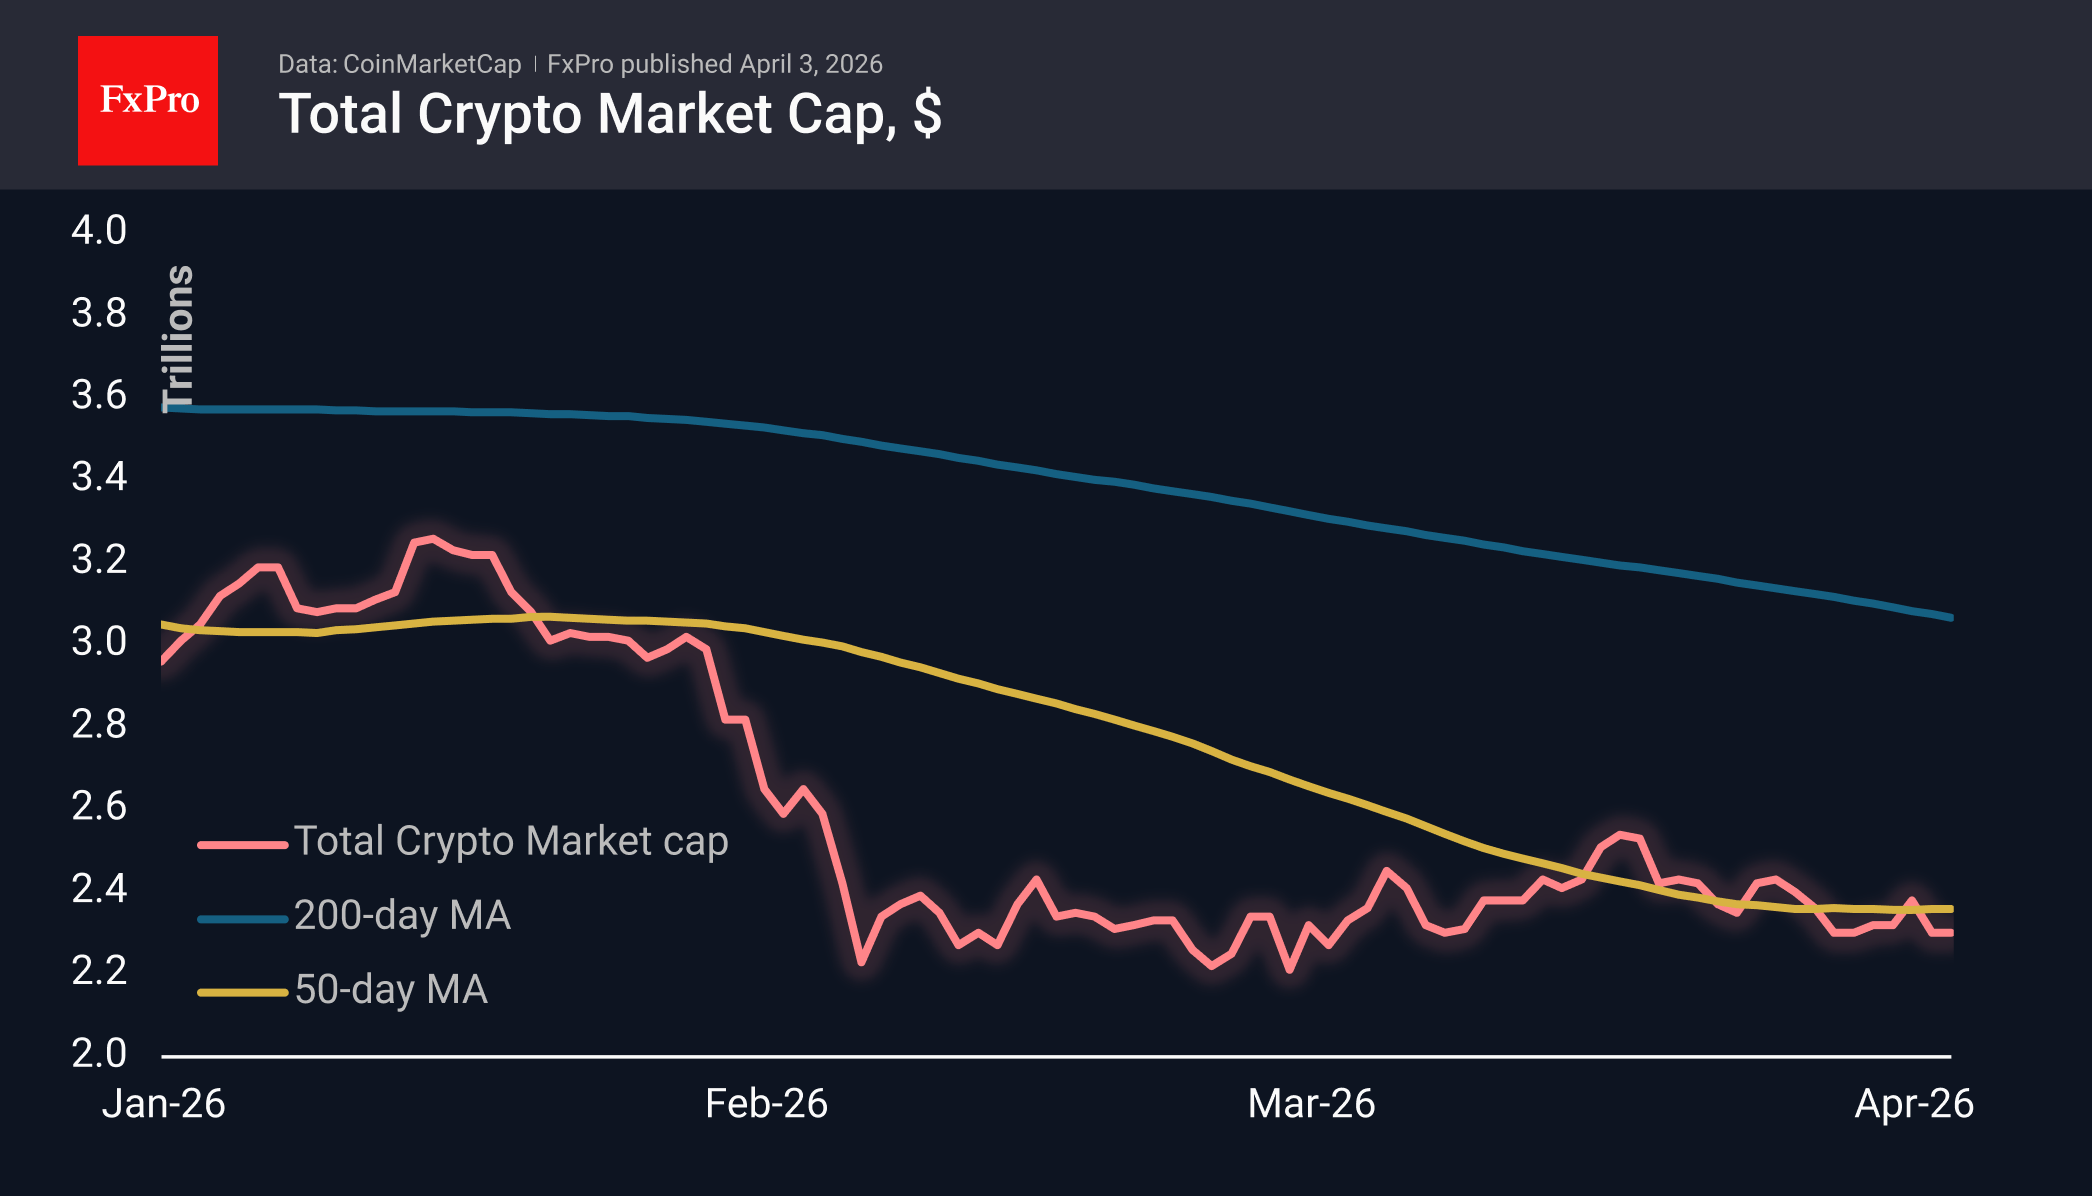
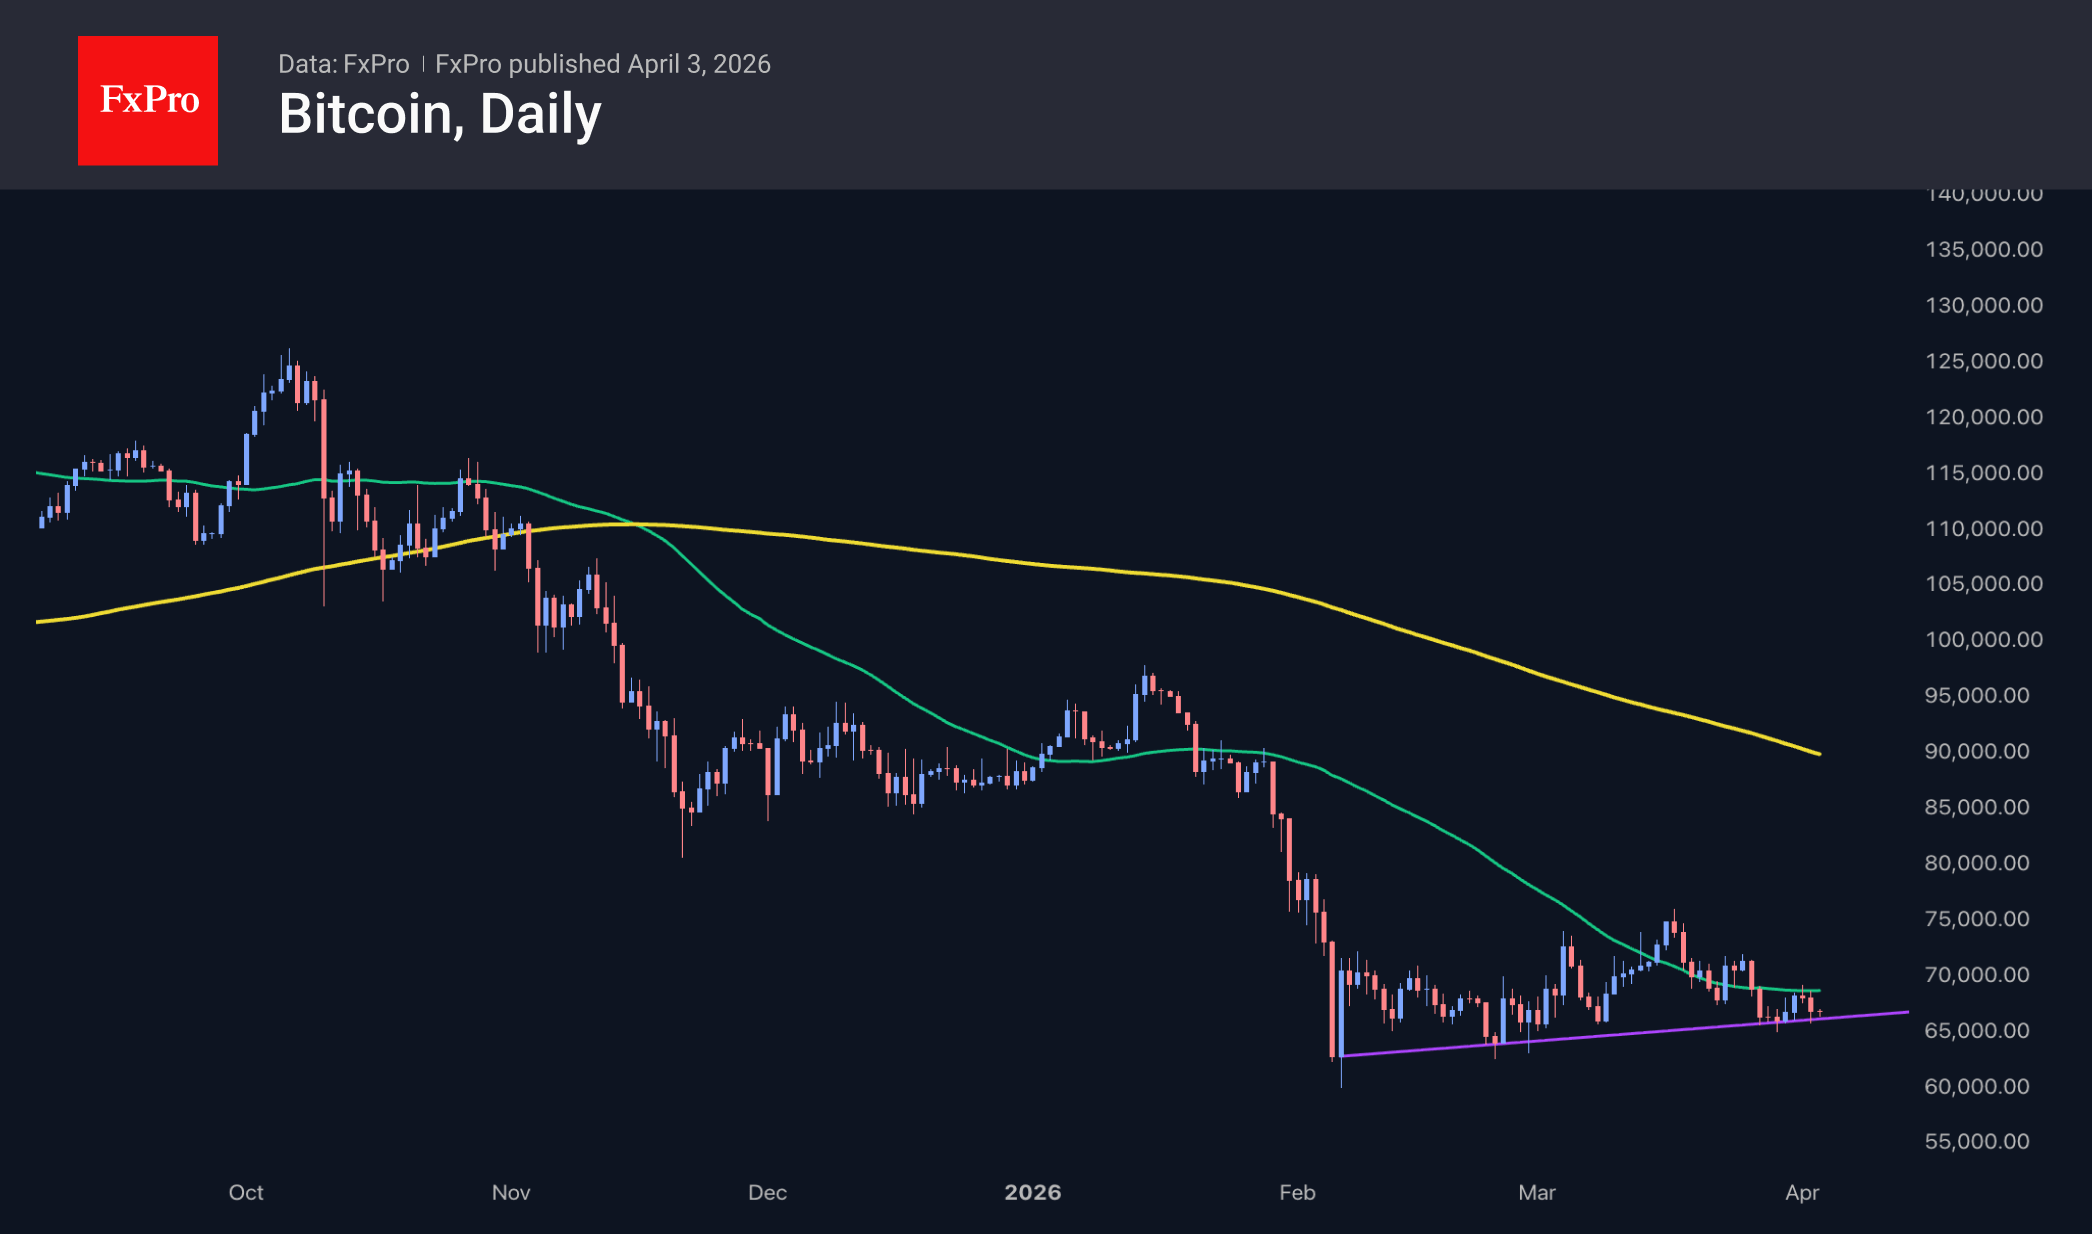
Bitcoin, at $66.5K, remains near the lower boundary of the range seen since early March, adding around $1K to Thursday’s intraday lows. With US markets closed, cryptocurrencies lack the key benchmark provided by traditional markets amid heightened geopolitical jitters. In such conditions, retail investors are reluctant to take active steps, as has been clear over the past month. We continue to monitor the $66–69K range, a breakout from which would mark the end of consolidation and set the direction for further movement.
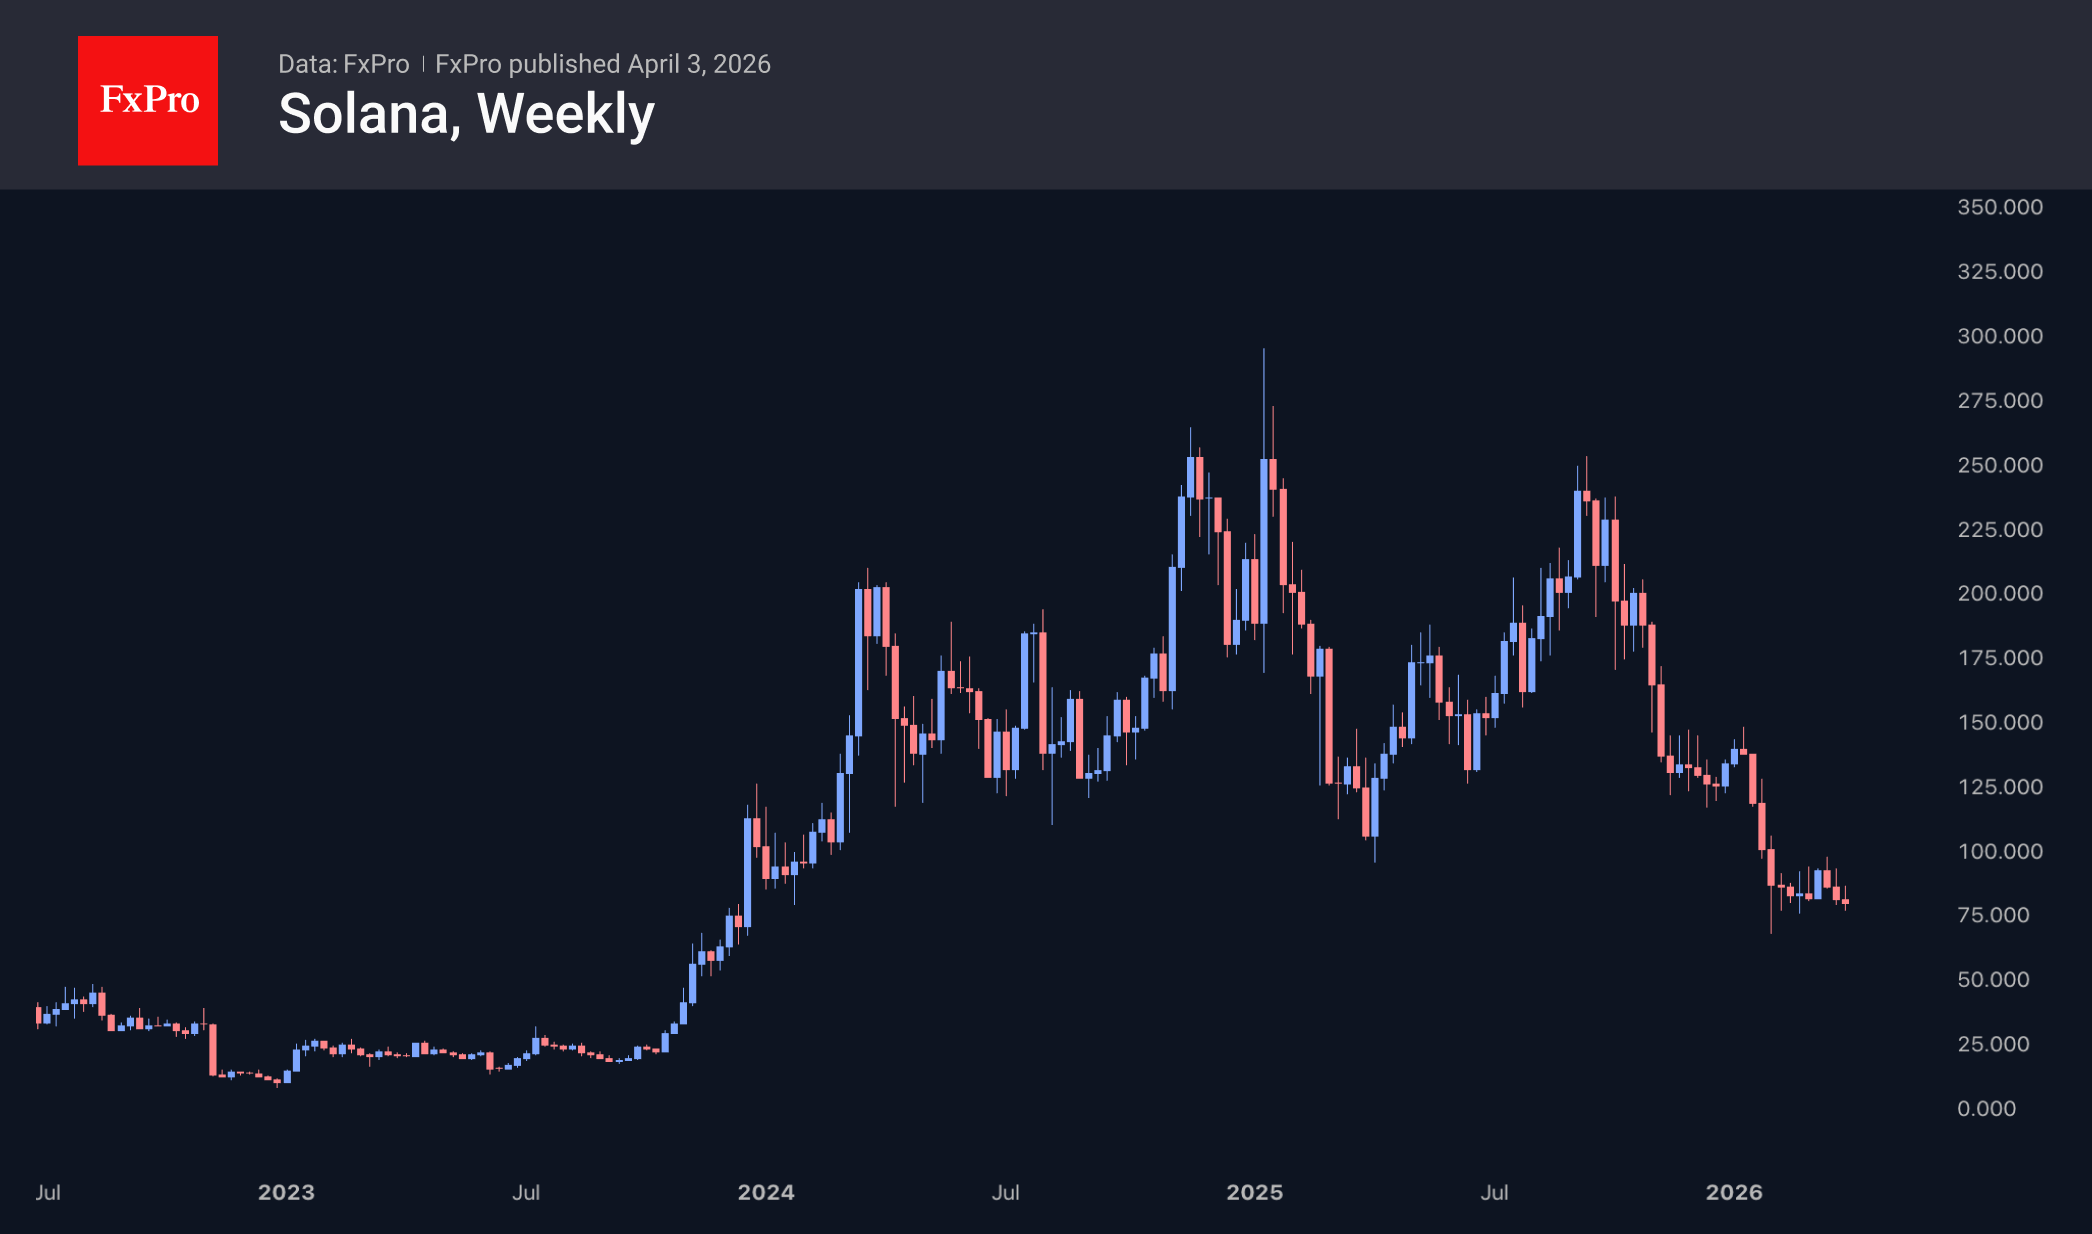
Solana has been in a downtrend for over two weeks, despite the market’s overall relative stability. As a result, the fifth-largest coin by market capitalisation (excluding stablecoins) is trading near $80, close to its February lows. It has not traded consistently below these levels since the end of 2023, having lost 70% from its peak at the start of 2025.
News Background
Large holders have shifted from accumulating Bitcoin to selling, and this trend is long-term, according to CryptoQuant. Addresses holding between 1,000 BTC and 10,000 BTC have reduced their holdings by 188,000 BTC over the past year.
At the same time, demand for Bitcoin in the US is falling. The Coinbase Premium Index has turned negative: US investors are no longer driving BTC growth through purchases.
The market is also losing corporate support. Over the past few months, at least seven corporate holders have reduced their reserves by ~22,000 BTC.
Over 40% of all bitcoins were purchased above $80K — this is one of the main obstacles to the growth of the leading cryptocurrency, according to Glassnode. Some of these 8.4 million BTC may be sold by investors either during an upward rebound to recoup some of their money or during a further decline.
Japan’s Metaplanet has increased its holdings to 40,177 BTC at an average purchase price of $104,106, becoming the third-largest Bitcoin treasury by cryptocurrency volume. In the first quarter, Metaplanet acquired 5,075 BTC for $405.5 million.
The US Department of the Treasury has begun implementing the GENIUS Act, passed in 2025. The regulator has issued its first notice and called on market participants to submit comments within 60 days.
USD/CAD Tests Key Resistance Territory After Pullback from Ytd Highs
- USD/CAD oscillates near the 1.3890-1.3930 resistance zone, tracking three‑month highs.
- Retraces 61.8% of the pullback from multi‑year highs.
- RSI and stochastics signal stalled upside momentum.
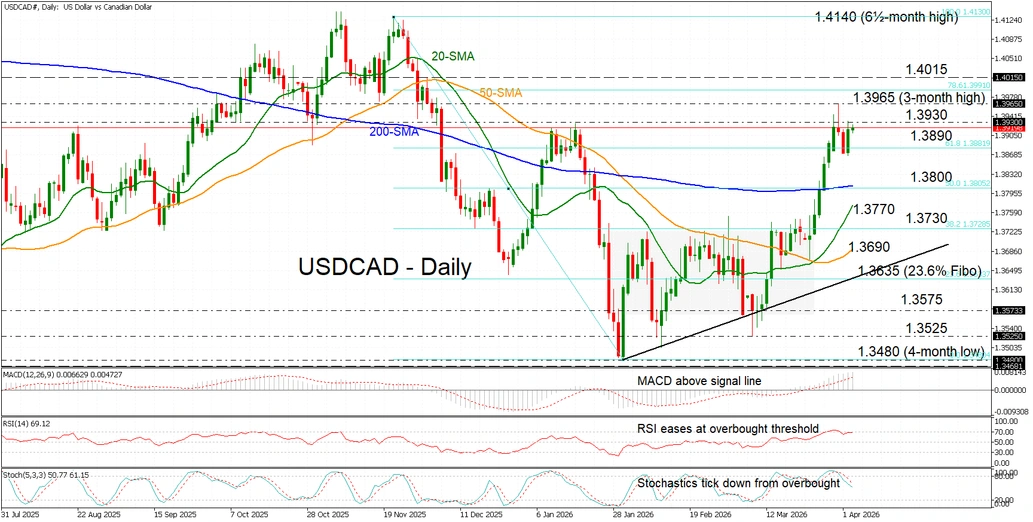
USD/CAD has been oscillating within the 1.3890-1.3930 resistance territory since the beginning of the week, repeatedly testing the upper boundary after a brief break to the three‑month and year-to-date high of 1.3965 on Tuesday.
If the pair manages to break decisively above this strong resistance zone – and further above the ytd peak, which also coincides with a major December support region – it would signal a continuation of the broader uptrend that has been forming higher lows since the January 30 bottom. The next resistance hurdle sits at the December 2 swing high near 1.4015, before the pair potentially heads toward the multi‑year peak near 1.4140.
That said, the momentum indicators show the upside stalling. The MACD remains in positive territory, but the RSI has failed to firmly enter overbought territory. Further, the stochastics are also ticking lower from overbought levels, pointing to fading momentum.
A decisive dip below the 61.8% Fibonacci retracement of the November-January pullback at 1.3890 could be followed by a break under the 200‑day simple moving average (SMA) near the 1.3800 psychological level, shifting the outlook to bearish. This would be reinforced by subsequent breaches of the upward‑sloping 20‑ and 50‑day SMAs at 1.3770 and 1.3690, respectively.
Summing up, USD/CAD is attempting to clear a key resistance zone, and a confirmed break above it would signal a resumption of the broader upside trend. However, another rejection from this region would likely keep the pair in consolidation, as long as price action remains supported by the 61.8% Fibonacci level.
Elliott Wave Signals DAX Rally Resumption Ahead
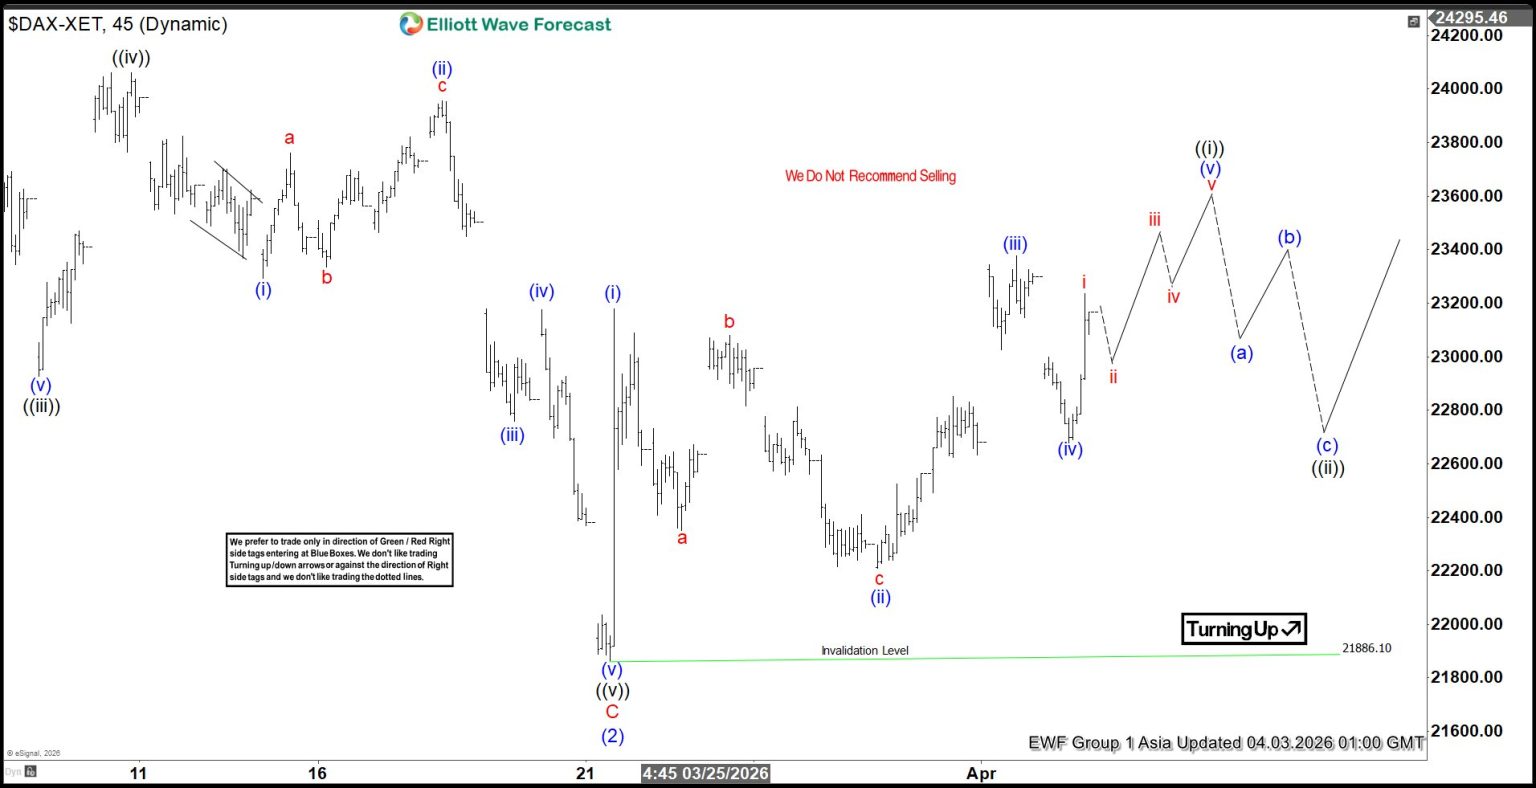
The DAX Index experienced a notable correction from the July 11, 2025 high, unfolding in a complex expanded flat Elliott Wave structure. From that peak, wave A concluded at 22,943.06, followed by a rally in wave B that terminated at 25,507.79. The index then reversed lower into wave C, which subdivided into a clear five-wave impulse. Specifically, wave ((i)) ended at 24,349.54, wave ((ii)) retraced to 25,405.97, and wave ((iii)) declined to 22,927.55. A modest recovery in wave ((iv)) reached 24,061.15, before the final wave ((v)) dropped to 21,886.1. This completed wave C of (2) at a higher degree, marking the end of the corrective phase.
From that low, the index has turned higher in wave (3). However, confirmation of a sustained bullish cycle requires a break above the prior peak of wave B at 25,507.79. Without this, the risk of a double correction remains. From wave (2), wave (i) advanced to 23,178.7, while wave (ii) pulled back to 22,209.45. The subsequent rally in wave (iii) reached 23,377.65, followed by a pullback in wave (iv) to 22,677.92. Another leg higher is anticipated to complete wave (v) of ((i)). Afterward, the index should undergo a corrective phase in wave ((ii)), addressing the cycle from the March 23, 2026 low, before resuming its upward trajectory.
In the near term, as long as the pivot at 21,886.1 remains intact, dips are expected to attract buyers. These retracements are likely to unfold in 3, 7, or 11 swings, supporting further upside potential. This structure underscores the importance of maintaining the key pivot while awaiting confirmation through a decisive break above 25,507.79
DAX 45-Minute Elliott Wave Chart
DAX Elliott Wave Video
https://www.youtube.com/watch?v=rLap3ZJk8eM
USD/JPY Holds Strong, NFP Looms as Next Big Catalyst
Key Highlights
- USD/JPY remained supported above the 158.00 pivot level.
- A bullish trend line is forming with support at 158.50 on the 4-hour chart.
- Bitcoin trimmed gains and traded below the $67,500 support.
- WTI Crude Oil prices again rallied and broke the $105 resistance.
USD/JPY Technical Analysis
The US Dollar formed a base above 158.20 against the Japanese Yen. USD/JPY started a fresh increase above 158.80 and 159.20.
Looking at the 4-hour chart, the pair cleared the 50% Fib retracement level of the downward move from the 160.46 swing high to the 158.27 low. The pair is now well above the 100 simple moving average (red, 4-hour) and the 200 simple moving average (green, 4-hour).
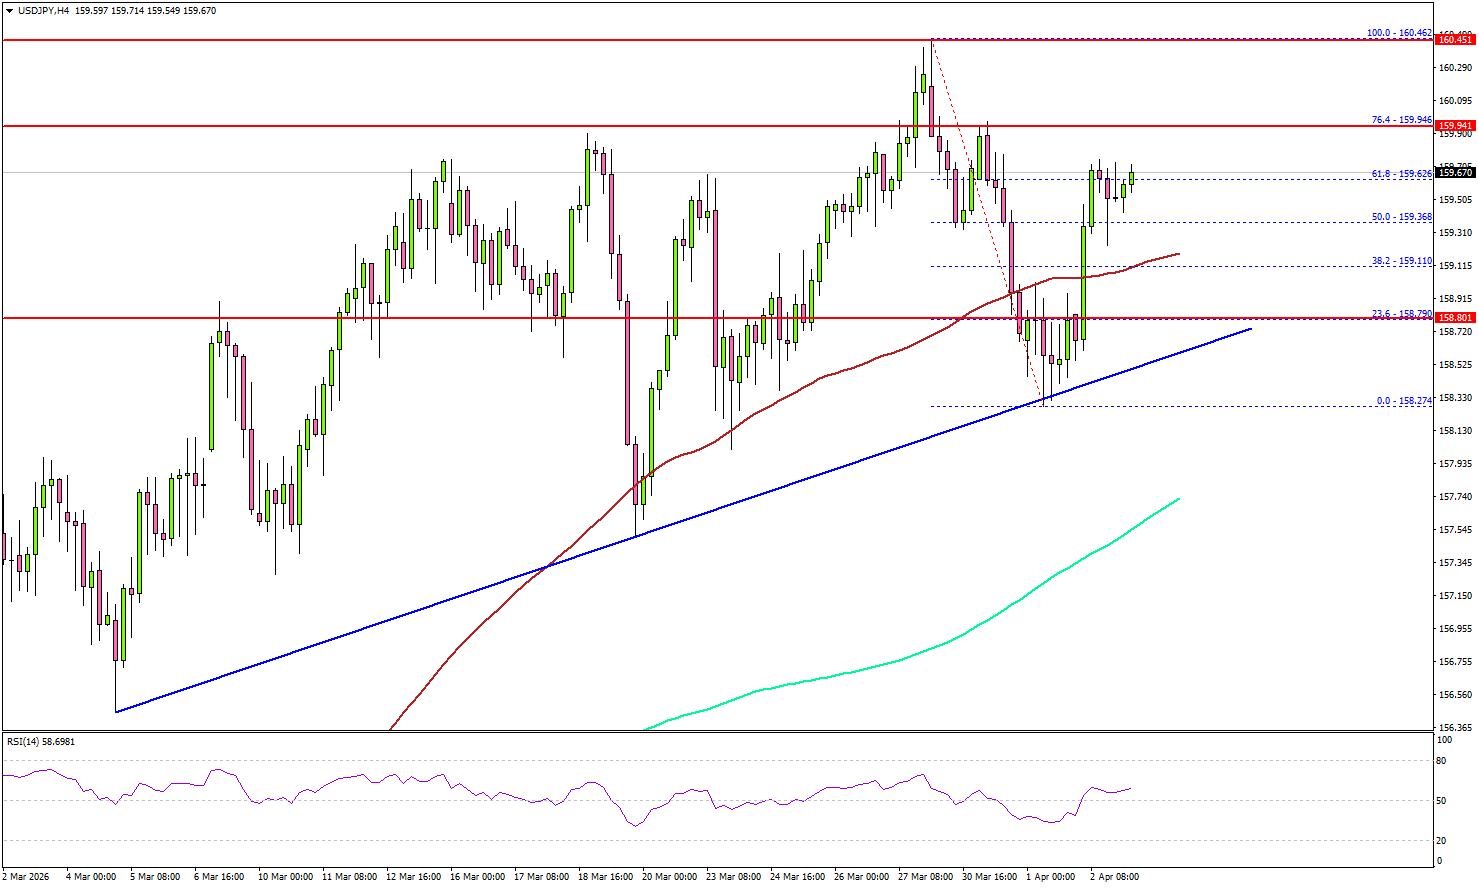
On the upside, the pair could face resistance near the 76.4% Fib retracement level of the downward move from the 160.46 swing high to the 158.27 low at 159.95.
The first major resistance sits at 160.20. The main resistance could be 160.50. A close above 160.50 could open the doors for gains above 161.20. In the stated case, the bulls could aim for a move to 162.00.
Immediate support is seen near 159.10. The first key support sits at 158.50. There is also a bullish trend line forming with support at 158.50. A close below 158.50 might call for heavy losses. In the stated case, it could even revisit 157.50 and the 200 simple moving average (green, 4-hour).
Looking at Oil, the price started a fresh surge, and the bulls were able to pump the price above the $105 barrier.
Upcoming Key Economic Events:
- US nonfarm payrolls for March 2026 – Forecast 60K, versus -92K previous.
- US Unemployment Rate for March 2026 - Forecast 4.4%, versus 4.4% previous.
The Weekly Bottom Line: Oil Prices: To the Moon and… (May Be) Back
Canadian Highlights
- The ongoing U.S.-Iran conflict continues to dominate the headlines, pushing oil prices closer to recent highs.
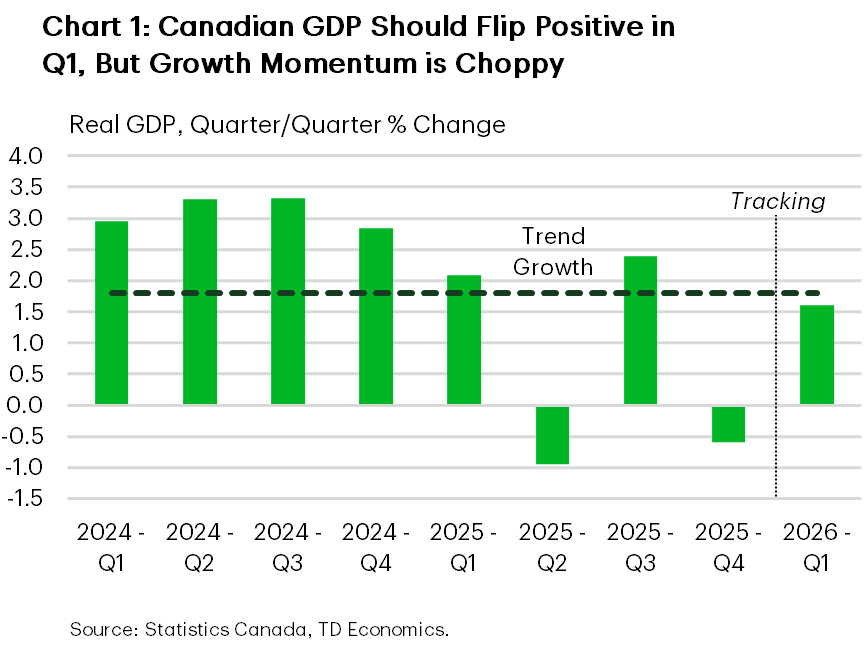
- Monthly GDP and trade data shows Canada’s economy started the year on a steadier footing.
- The Bank of Canada maintained its dovish tone in its Summary of Deliberations, but acknowledged the two-sided risks on growth and inflation stemming from the war.
U.S. Highlights
- President Trump’s speech on Wednesday dashed hopes of a swift resolution to the conflict in Iran, sending crude oil prices higher.
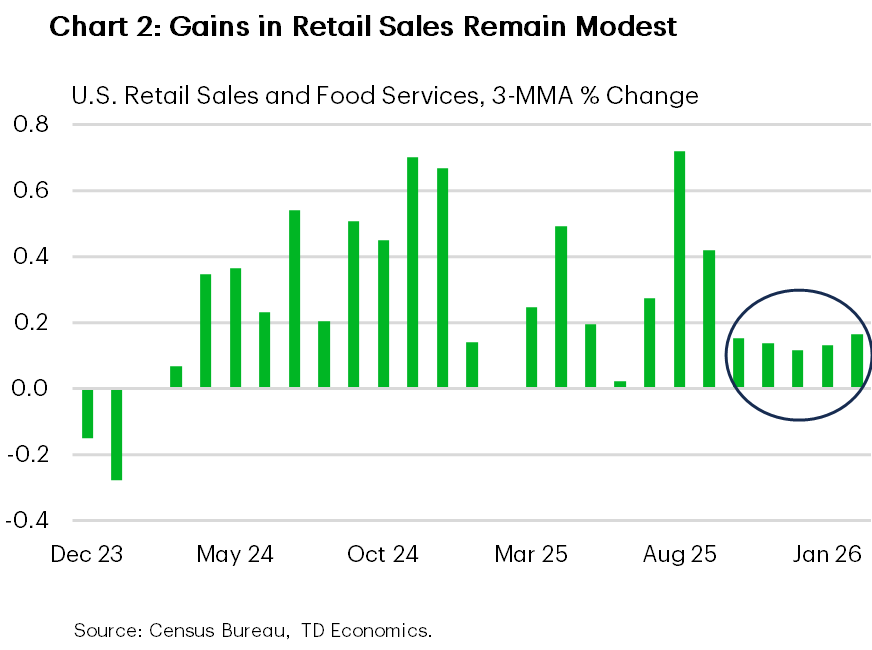
- Retail sales rebounded in February after two months of stagnation. Meanwhile, JOLTS data indicated that the labor market remained in a low-hire, low-fire mode during February.
- Unless March payroll figures surprise meaningfully on the downside tomorrow, this week’s data supports the Federal Reserve’s current cautious, wait-and-see stance.
Canada – Barreling Ahead
WTI prices surged another 20% this week to over $110/bbl amid fading hopes for a quick resolution to the U.S.-Iran war. In his speech last night, President Trump’s hawkish remarks did little to ease markets, providing no timeline for a conflict resolution and warning of a possible escalation in coming weeks. Iran also doubled down on comments that it denies seeking a ceasefire, while insisting the Strait of Hormuz will remain closed and under its control. Despite the increase in oil prices, the Canadian dollar weakened by 0.7% to 71.9 cents U.S., as safe-haven flows and strong domestic data south of the border put a bid under the U.S. Dollar. Elsewhere, Canadian yields eased slightly this week as hawkish bets for Bank of Canada rate hikes later this year were pared back slightly.
Canadian data this week gave a clearer picture of economic momentum prior to oil price shock. Industry-level GDP for the month of January showed Canada’s economy started the year on a firmer footing than many feared amid lacklustre Q4-2025 results. The reading was still on the softer side, growing by a modest 0.1% month-on-month (m/m), but it outpaced both Statistics Canada and market expectations for no growth. What’s more, early signs are pointing to an acceleration of 0.2% m/m real GDP growth in February, putting quarterly growth on track achieve trend-like results (Chart 1). Though positive on the margin, these readings may hold slightly less weight coming before the oil price shock impacted the economy.
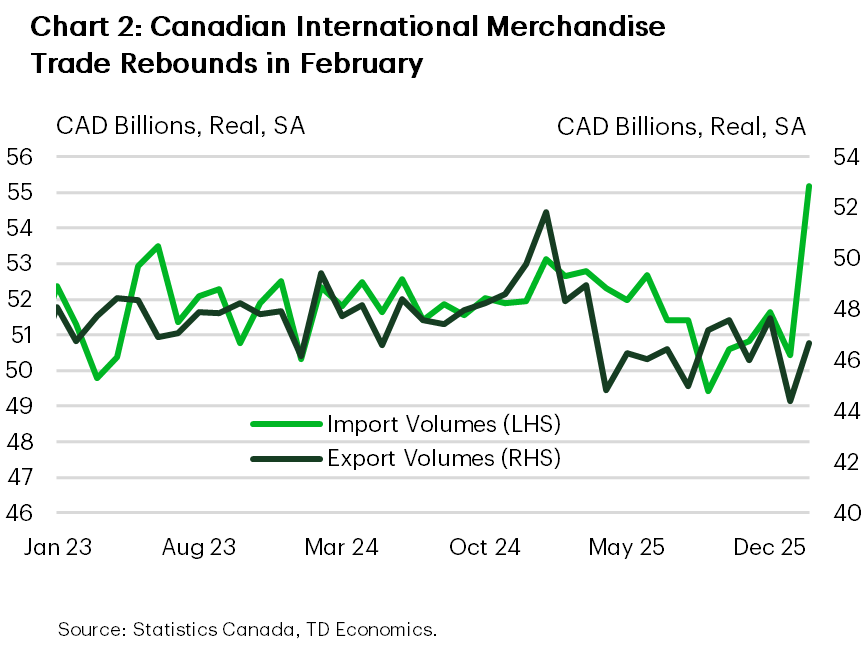
February’s international merchandise trade data also gave us another look at Q1 growth conditions. It was a sturdy month, as both exports and imports sharply reversed course from last month’s sagging activity (Chart 2). Gains on both sides of the ledger were broad-based as most subsectors booked a gain, though a bounce-back in auto-sector activity did a lot of the heavy lifting. The recent meteoric rise in oil prices will start to show up in the March data, boosting nominal trade momentum into the second quarter, which should help narrow Canada’s trade deficit. Elsewhere in trade, Canadian representatives are slowly re-engaging U.S. counterparts after a quiet few months, with hopes of smooth negotiations ahead of the July 1st CUSMA review.
The ongoing energy price shock and trade risks are still clouding the near-term outlook. In their Summary of Deliberations released this week, Bank of Canada Governing Council members recognized these challenges, but agreed to “look through” the spike in oil-driven inflation spike, opting instead of a more data-driven approach to policy setting. For now, the Bank maintains its dovish stance from the March policy meeting, given Canada’s economy remains sub par, with recent softness in core inflation and growth risks that tilt toward the downside. We expect the BoC to remain on the sidelines at their April 29th meeting, but will plan to monitor this shock carefully – weighing downside risks to growth against the upside inflationary impacts – and is prepared to act if circumstances change.
U.S. – Oil Prices: To the Moon and… (May Be) Back
Financial markets were volatile this week amid uncertainty on the duration of the Middle East conflict. The S&P 500 traded lower initially but rebounded mid-week on signs of de-escalation in the U.S.–Iran conflict. Treasury yields and crude prices also eased on the news, though the reprieve was brief. Like Artemis II, Trump’s speech on Wednesday night sent oil prices to the moon again on Thursday morning. While Trump reaffirmed a 2–3 week timeline for ending U.S. military involvement, he dashed hopes for a peace deal, promising to hit Iran “extremely hard”, and said that re-opening the Strait of Hormuz was not a U.S. goal.
Even if the U.S. reduces its military attacks soon, oil prices could stay high: ramping up production and repairing infrastructure takes time, and supply risks persist if the Strait of Hormuz remains closed or below capacity. Inflationary risks are tilted upward even as our latest report notes the latest oil shock is unlike the one in 2022 in some ways. This shock is more concentrated in oil, with natural gas and agricultural commodity prices contained.
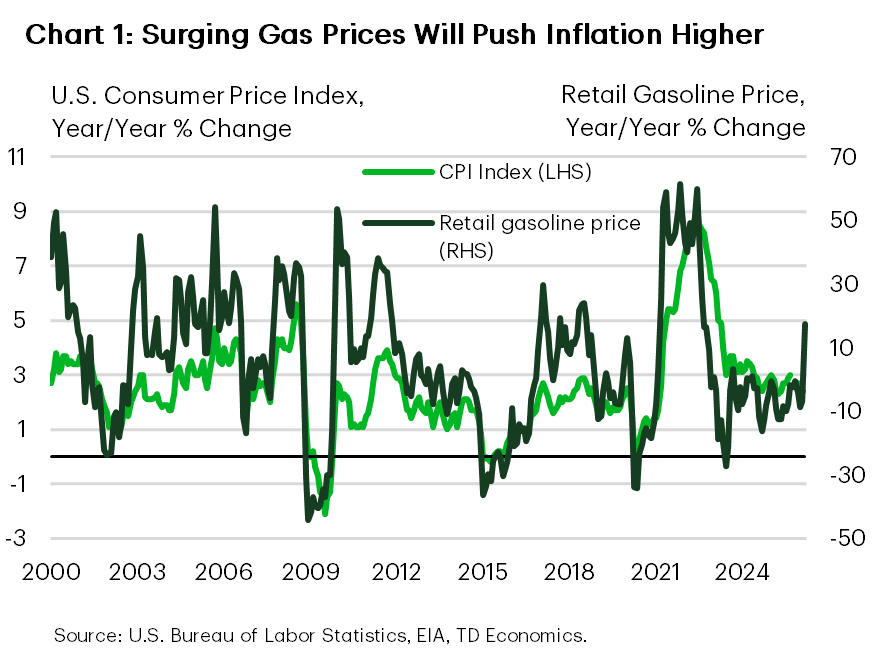
The economic backdrop is also different. Supply chains weren’t strained before the latest price shock, the labor market has cooled, and the economy isn’t firing on all cylinders. Still, with gas prices rising to $4/gallon this week, and signs that the conflict is adding pressure to other commodities, higher inflation is in the cards (Chart 1). This week’s data showed households’ inflation expectations jumped in March.
This is the fourth price shock to hit households in five years, arriving amid a slowing labor market. JOLTS data showed hiring declined in February, while job openings and layoffs were steady but low, suggesting the labor market remains in a low-hire, low-fire mode. Markets expect payrolls to rise by 65k in March, similar to the ADP print, and a partial rebound after an unexpected loss of 92k jobs in February. While not yet signaling a sharp deterioration, a cooling labor market leaves households more exposed to negative shocks.
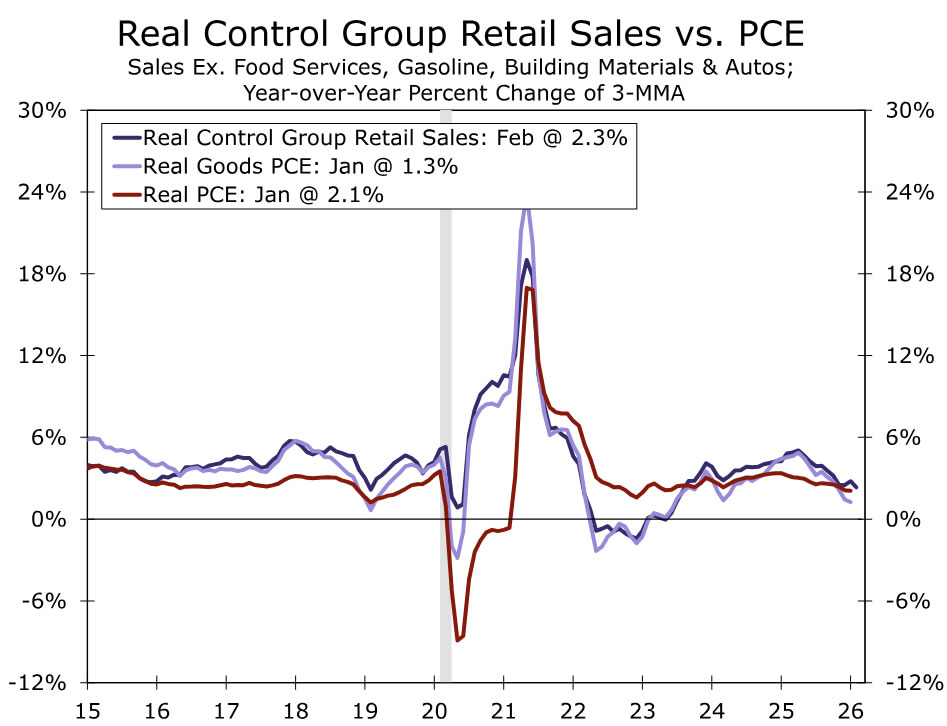
Consumer spending has stayed relatively resilient, but households are inflation-weary and showed caution even before the latest surge at the pump. Retail sales rose 0.6% m/m in February after two months of stagnation (Chart 2). Adjusted for inflation, sales volumes are up only 1% from a year ago. Larger tax refunds may help mitigate higher gas prices, but slower hiring and equities selloff could still weigh on consumption.
With stagflation fears surfacing, the Fed faces a tough balancing act. So far, it seems content to stay on hold. Earlier this week, Fed Chair Powell said oil shocks are typically short-lived and the Fed can remain patient; however, he noted the Fed would act if inflation expectations shift. NY Fed President Williams said, “the current stance of monetary policy is well positioned to balance risks to our maximum employment and price stability goals.” However, if you chase two rabbits, you likely won’t catch either. Let’s hope the Fed doesn’t find itself in that spot.
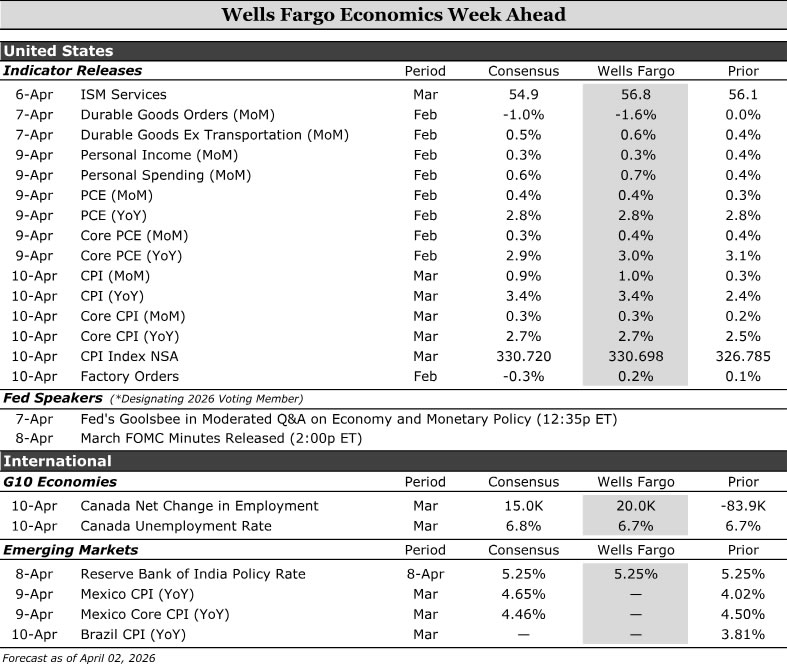
Economics Week Ahead
United States:
- Personal Income & Spending (Thursday), Consumer Price Index (CPI) (Friday)
G10 Economies:
- Canada Labor Force Survey (Friday)
Emerging Markets:
- Reserve Bank of India (Wednesday), Mexico CPI (Thursday), Brazil CPI (Friday)
U.S. Week Ahead
Personal Income & Spending • Thursday
U.S. economic data remain somewhat stale due to the lingering effects of last year’s prolonged federal government shutdown. The upcoming Personal Income & Spending report is a case in point, with next week’s release covering February activity—already about a month old. That lag feels more consequential amid ongoing tensions with Iran. High‑frequency credit‑card data through March suggest consumers remain resilient for now, but the risk of a slowdown grows the longer uncertainty persists, particularly if gasoline prices continue to climb sharply.
Looking at February, we expect personal spending to rise 0.7%. Solid retail sales—up 0.6% on the month, with the control group advancing 0.5%—point to healthy goods demand (chart), while firmer restaurant spending indicates continued momentum in services. That said, much of the nominal strength reflects higher prices. We expect the PCE deflator increased 0.4%, implying real spending rose a still‑solid but more modest 0.3%. We forecast personal income to increase 0.3%, reflecting some normalization after January’s boost from the Social Security cost‑of‑living adjustment.
Consumer Price Index (CPI) • Friday
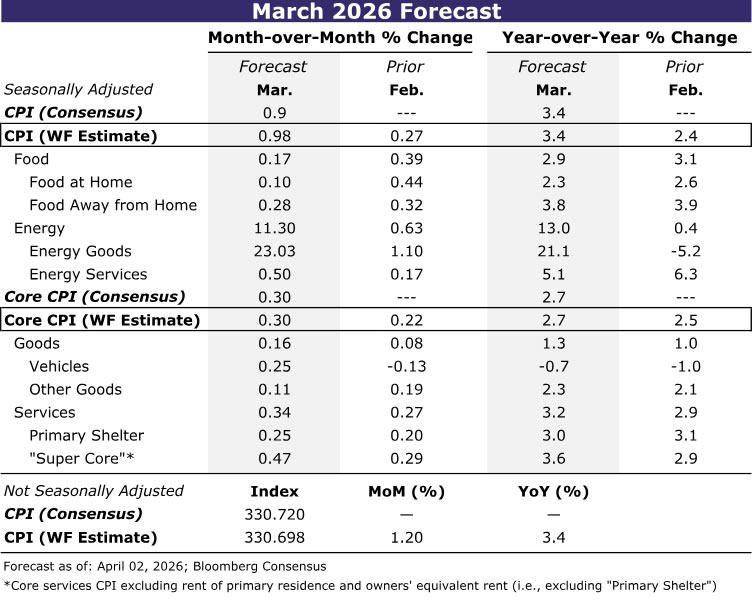
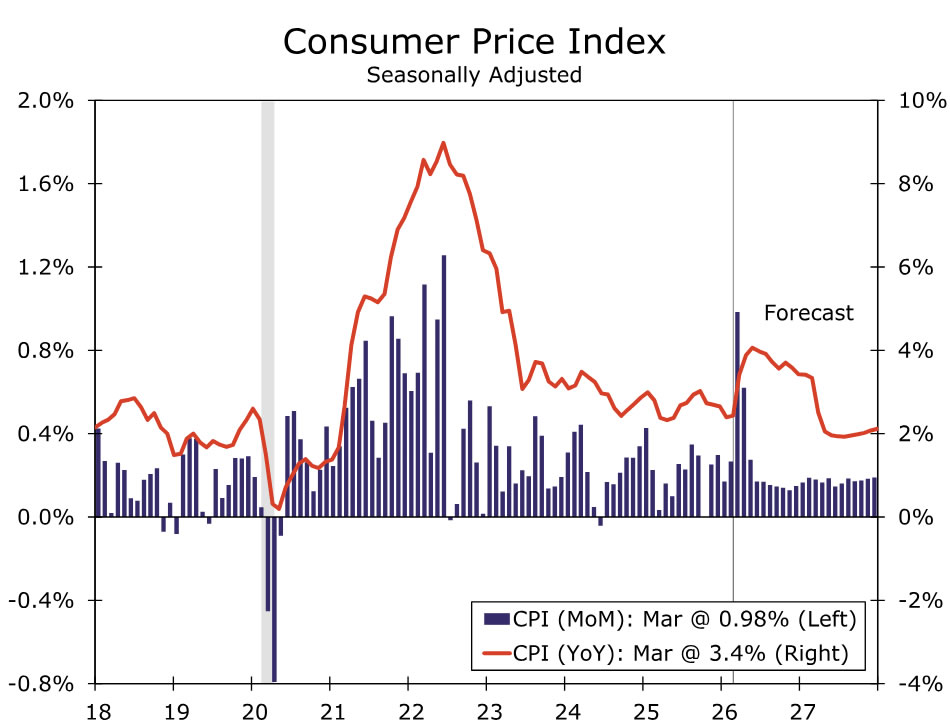
The March CPI report will put an abrupt end to the gradual disinflationary trend in place over the past two years. We estimate consumer prices rose 1.0% in March, leading to a year-over-year increase of 3.4% (table). Unsurprisingly, energy goods—largely gasoline—will account for the lion's share (~70 bps) of March's monthly increase as higher oil prices have quickly fed through to prices at the pump. Airline fares are expected to be another source of strength in March and drive public transportation prices up 7%, although we expect the recent surge in jet fuel to lead to an even larger rise in airfares in April.
We do not expect to see the effects of the Middle East conflict immediately feeding into other categories of inflation, however. Despite higher prices for LNG exports, domestic natural gas prices have been little changed, which should limit near-term energy services inflation. Meantime, food at home is likely to moderate in March thanks to giveback in the volatile fruits & vegetable component.
Within the core, we look for a modest strengthening in goods primarily due to a rebound in used auto prices. Core services is likely to match the 0.3% gain registered in February, as the expected jump in airline fares is largely offset by mean-reversion in medical care services and further softness in motor vehicle insurance. We anticipate primary shelter rose 0.25%, roughly in-line with its three-month average.
The recent oil shock is likely to dominate the view of inflation in March, but we expect the details to suggest that the modest downward trend in core CPI was already struggling to be maintained. A sustained increase in oil will further complicate progress in reducing inflation as higher production and transportation costs slowly seep into some core categories. Yet, the reduction in household purchasing power caused by higher gasoline prices is likely to limit the ability for some companies to pass on higher costs. We expect the year-over-year rate of core CPI to be stuck in the range of 2.7%–3.1% through the remainder of this year as a result (chart).
G10 Week Ahead
Canada Labor Force Survey • Friday
We look for Canada’s March Labor Force Survey (LFS) to rebound from the soft January/February prints with +20K jobs, with the unemployment rate steady at 6.7%. Risks are asymmetric: upside to the jobs number and downside to the unemployment rate. The near-term story is a labor market that’s stable, not collapsing—with the main fragility still concentrated in manufacturing and trade-exposed goods, while services, health care, energy and the public sector continue to look relatively resilient. That sector mix should be increasingly shaped by U.S. tariff exposure, the recent surge in energy prices and the impending USMCA review. Structurally, the backdrop has shifted: a shrinking population (net outflow of temporary residents) and an aging workforce are lowering labor force growth—and with it the monthly job threshold needed to keep unemployment stable. The implication is that the unemployment rate can drift lower even with only modest job creation over the coming months. A steadier labor market, in turn, likely tilts the Bank of Canada’s (BoC) focus back toward inflation. We continue to see the BoC stuck on hold as it assesses the energy-price shock and the risk of inflation persistence/feedback. April still looks far too early for a move, but the Monetary Policy Report should offer a clearer read on the BoC's reaction function. We still pencil in a Q3 (July) hike, with the risk of a later hike this year depending on the intensity and persistence of energy and commodity price pressures.
EM Week Ahead
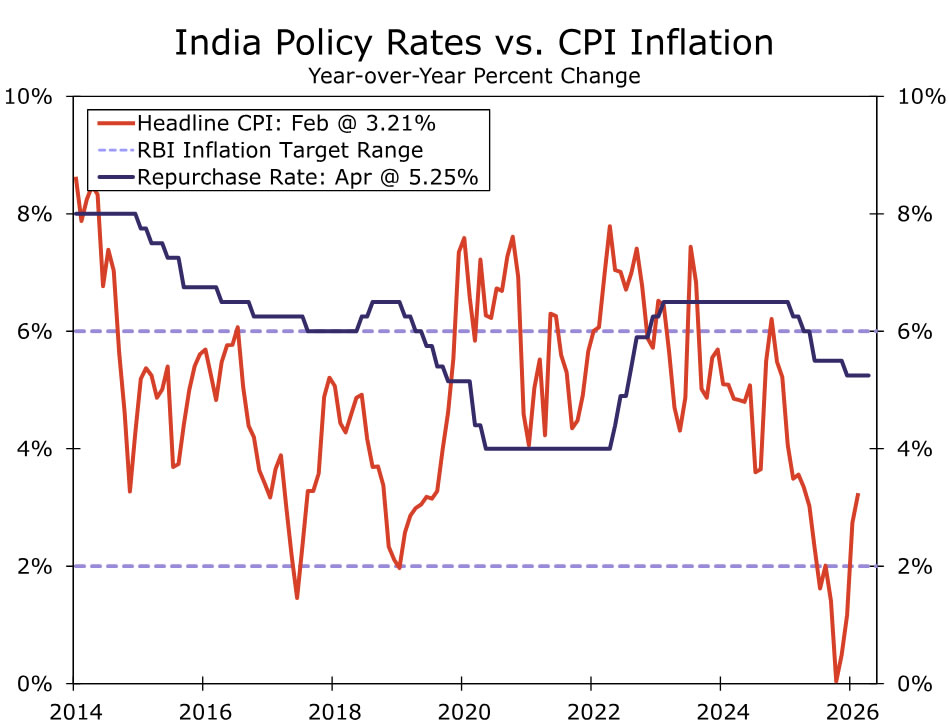
Reserve Bank of India • Wednesday
Reserve Bank of India (RBI) policymakers will assess monetary policy settings next week for the first time since the oil price shock, and we expect interest rates to be left on hold. Prior to events in the Middle East, RBI policymakers were inching closer to ending the easing cycle, but perhaps maintained a slight bias for additional rate cuts. With oil prices likely to push headline inflation sharply higher in the coming months and keep the rupee under pressure, we have our doubts the bias remains for additional rate cuts. In fact, through our forecast horizon, we believe rates in India will be kept unchanged as inflation pressures build and INR remains on the back foot.
But the RBI, like many other central banks, is caught in between an inflation and a growth shock. The age-old question will loom for the RBI: support growth or contain inflation? Inflation is likely to be the priority for policymakers, but the economy is set to soften given India's status as a major oil importer. Softening growth could keep the bias for policymakers tilted toward rate cuts. But, in our view, with the economy still likely to grow 6.5%–7% this calendar year, perhaps the need to lower policy rates is not that pressing. Either way, we will get more insight into the RBI thought process and how they consider this trade-off next week.
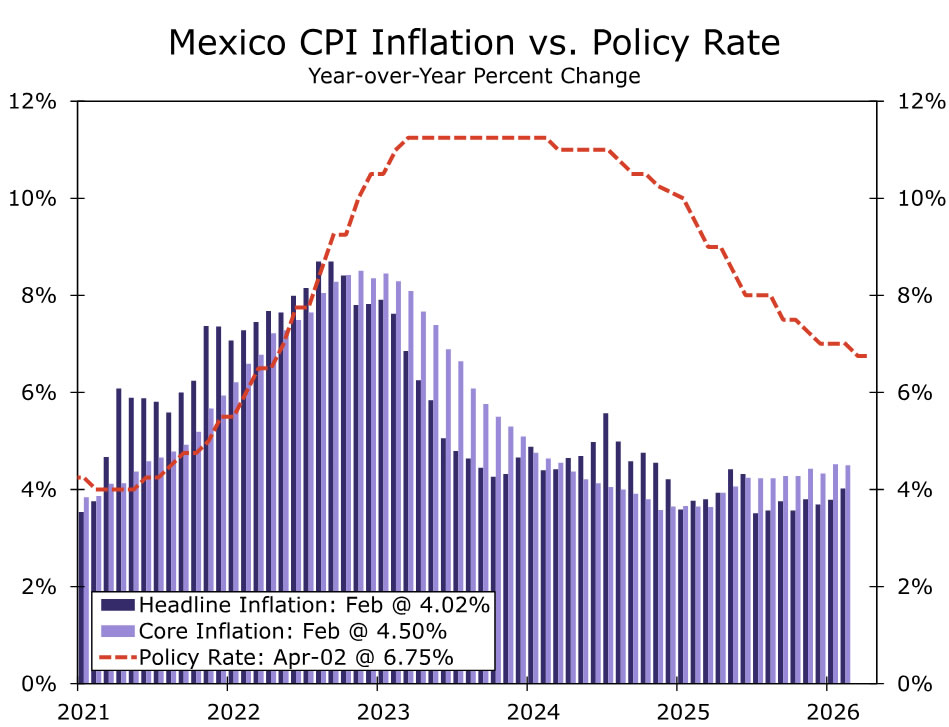
Mexico CPI • Thursday
For Mexico watchers, the path of inflation has been top of mind. Not only to get a sense of the future direction of Banxico monetary policy but also to gauge whether financial markets will deem prior Banxico easing as a policy error. March inflation should show headline CPI popping higher to reflect the spike in energy prices. At the same time, core inflation, the measure that strips out elevated energy costs, is likely to remain flat. Policymakers have been more focused on sluggish growth prospects to rationalize lowering interest rates, but another key component to justify easing monetary policy has been policymakers' view that core inflationary pressures are muted.
A flat March core inflation print combined with a softening growth outlook, in our view, should continue to give policymakers rationale to cut policy rates at least one more time. Just recently, we adjusted our Banxico outlook to reflect our view for a terminal rate of 6.50% by mid-year. For now, that forecast remains in place, but we also flagged the possibility that Banxico has lowered rates too much. Risks on the horizon such as trade and political uncertainty, could prompt capital flight as carry associated with the peso has been eroded over time. Even a further shift in risk sentiment from the oil price shock can drive a repricing of local financial markets that ultimately prompts as aggressive tightening cycle that keeps growth weighed down for an extended period of time.
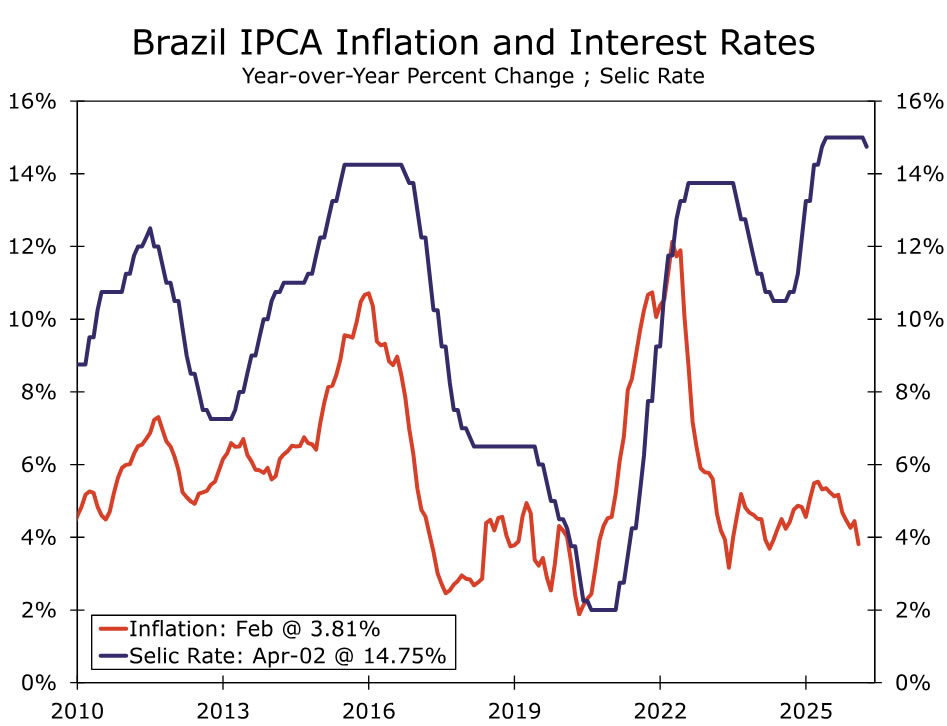
Brazil CPI • Friday
While Brazil is one of the economies a bit more shielded from higher energy prices, the inflationary impulse of a spike in energy costs will still materialize. To that point, we expect year-over-year headline inflation to rise close to, possibly back above, 4% when March data are released next week. The balance of risk is shifted toward a firmer rise in inflation, and with inflation expectations already reacting to the rise in energy prices, policymakers are also in reaction mode. To that point, fiscal authorities have already deployed policy to offset the rise in energy prices for households. And monetary policymakers are communicating more caution when considering further reductions in interest rates.
The rise in March inflation should keep fiscal and monetary policymakers busy, but also on guard going forward. For fiscal policy, President Lula is likely to deploy subsidies and other forms of financial support ahead of his re-election campaign. Brazilian Central Bankers are also likely to keep the gradual pace of rate reductions in place, possibly even keep rates steady, to defend against unanchored inflation expectations from materializing. Combined with geopolitical tensions that do not seem to be receding all that quickly, this policy mix could be in place for an extended period of time.
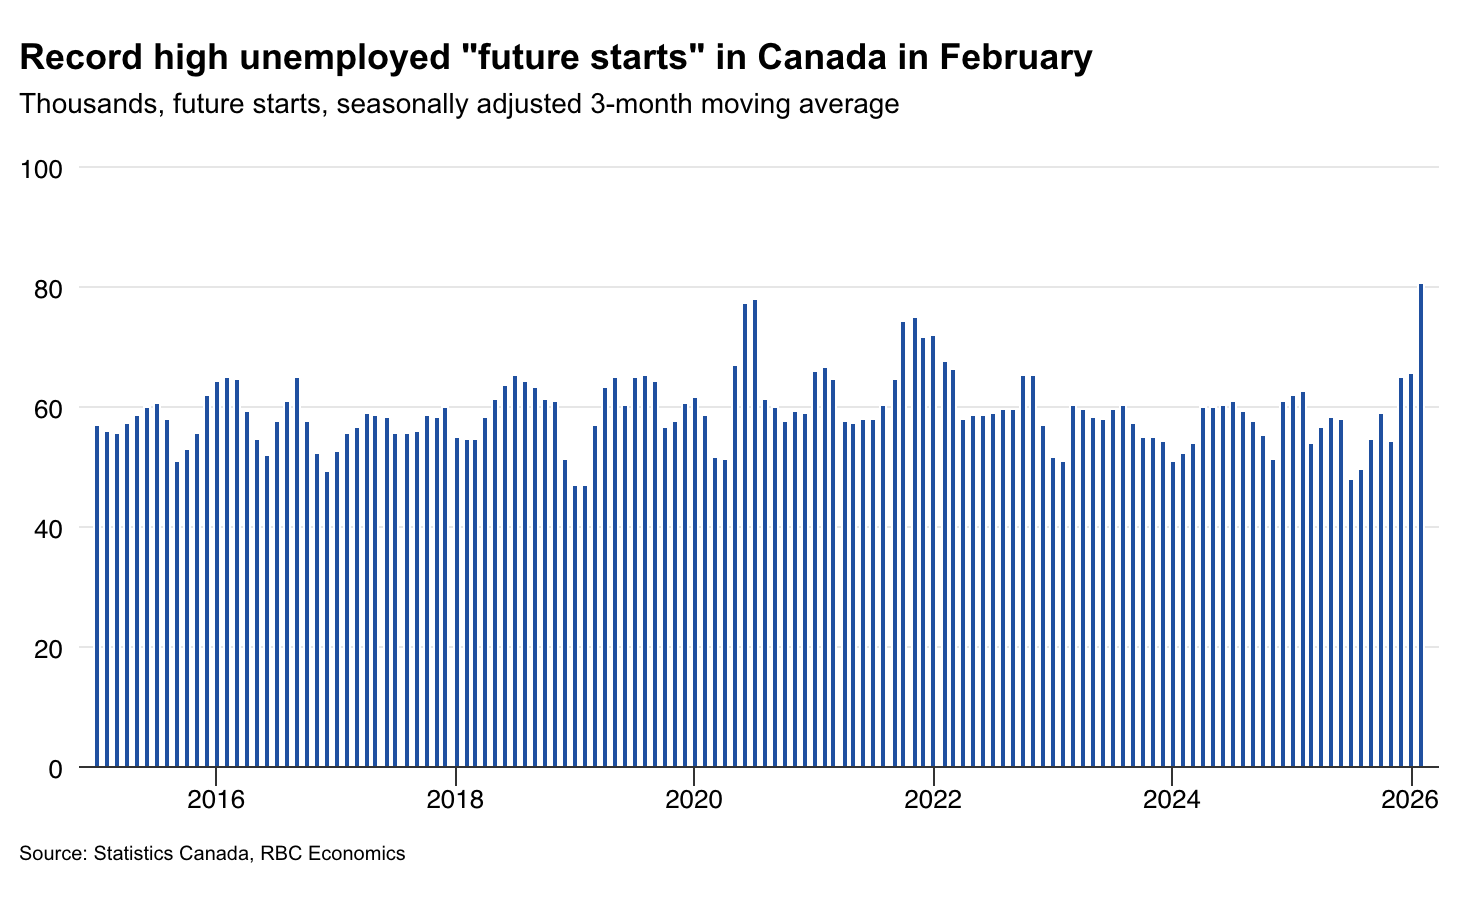
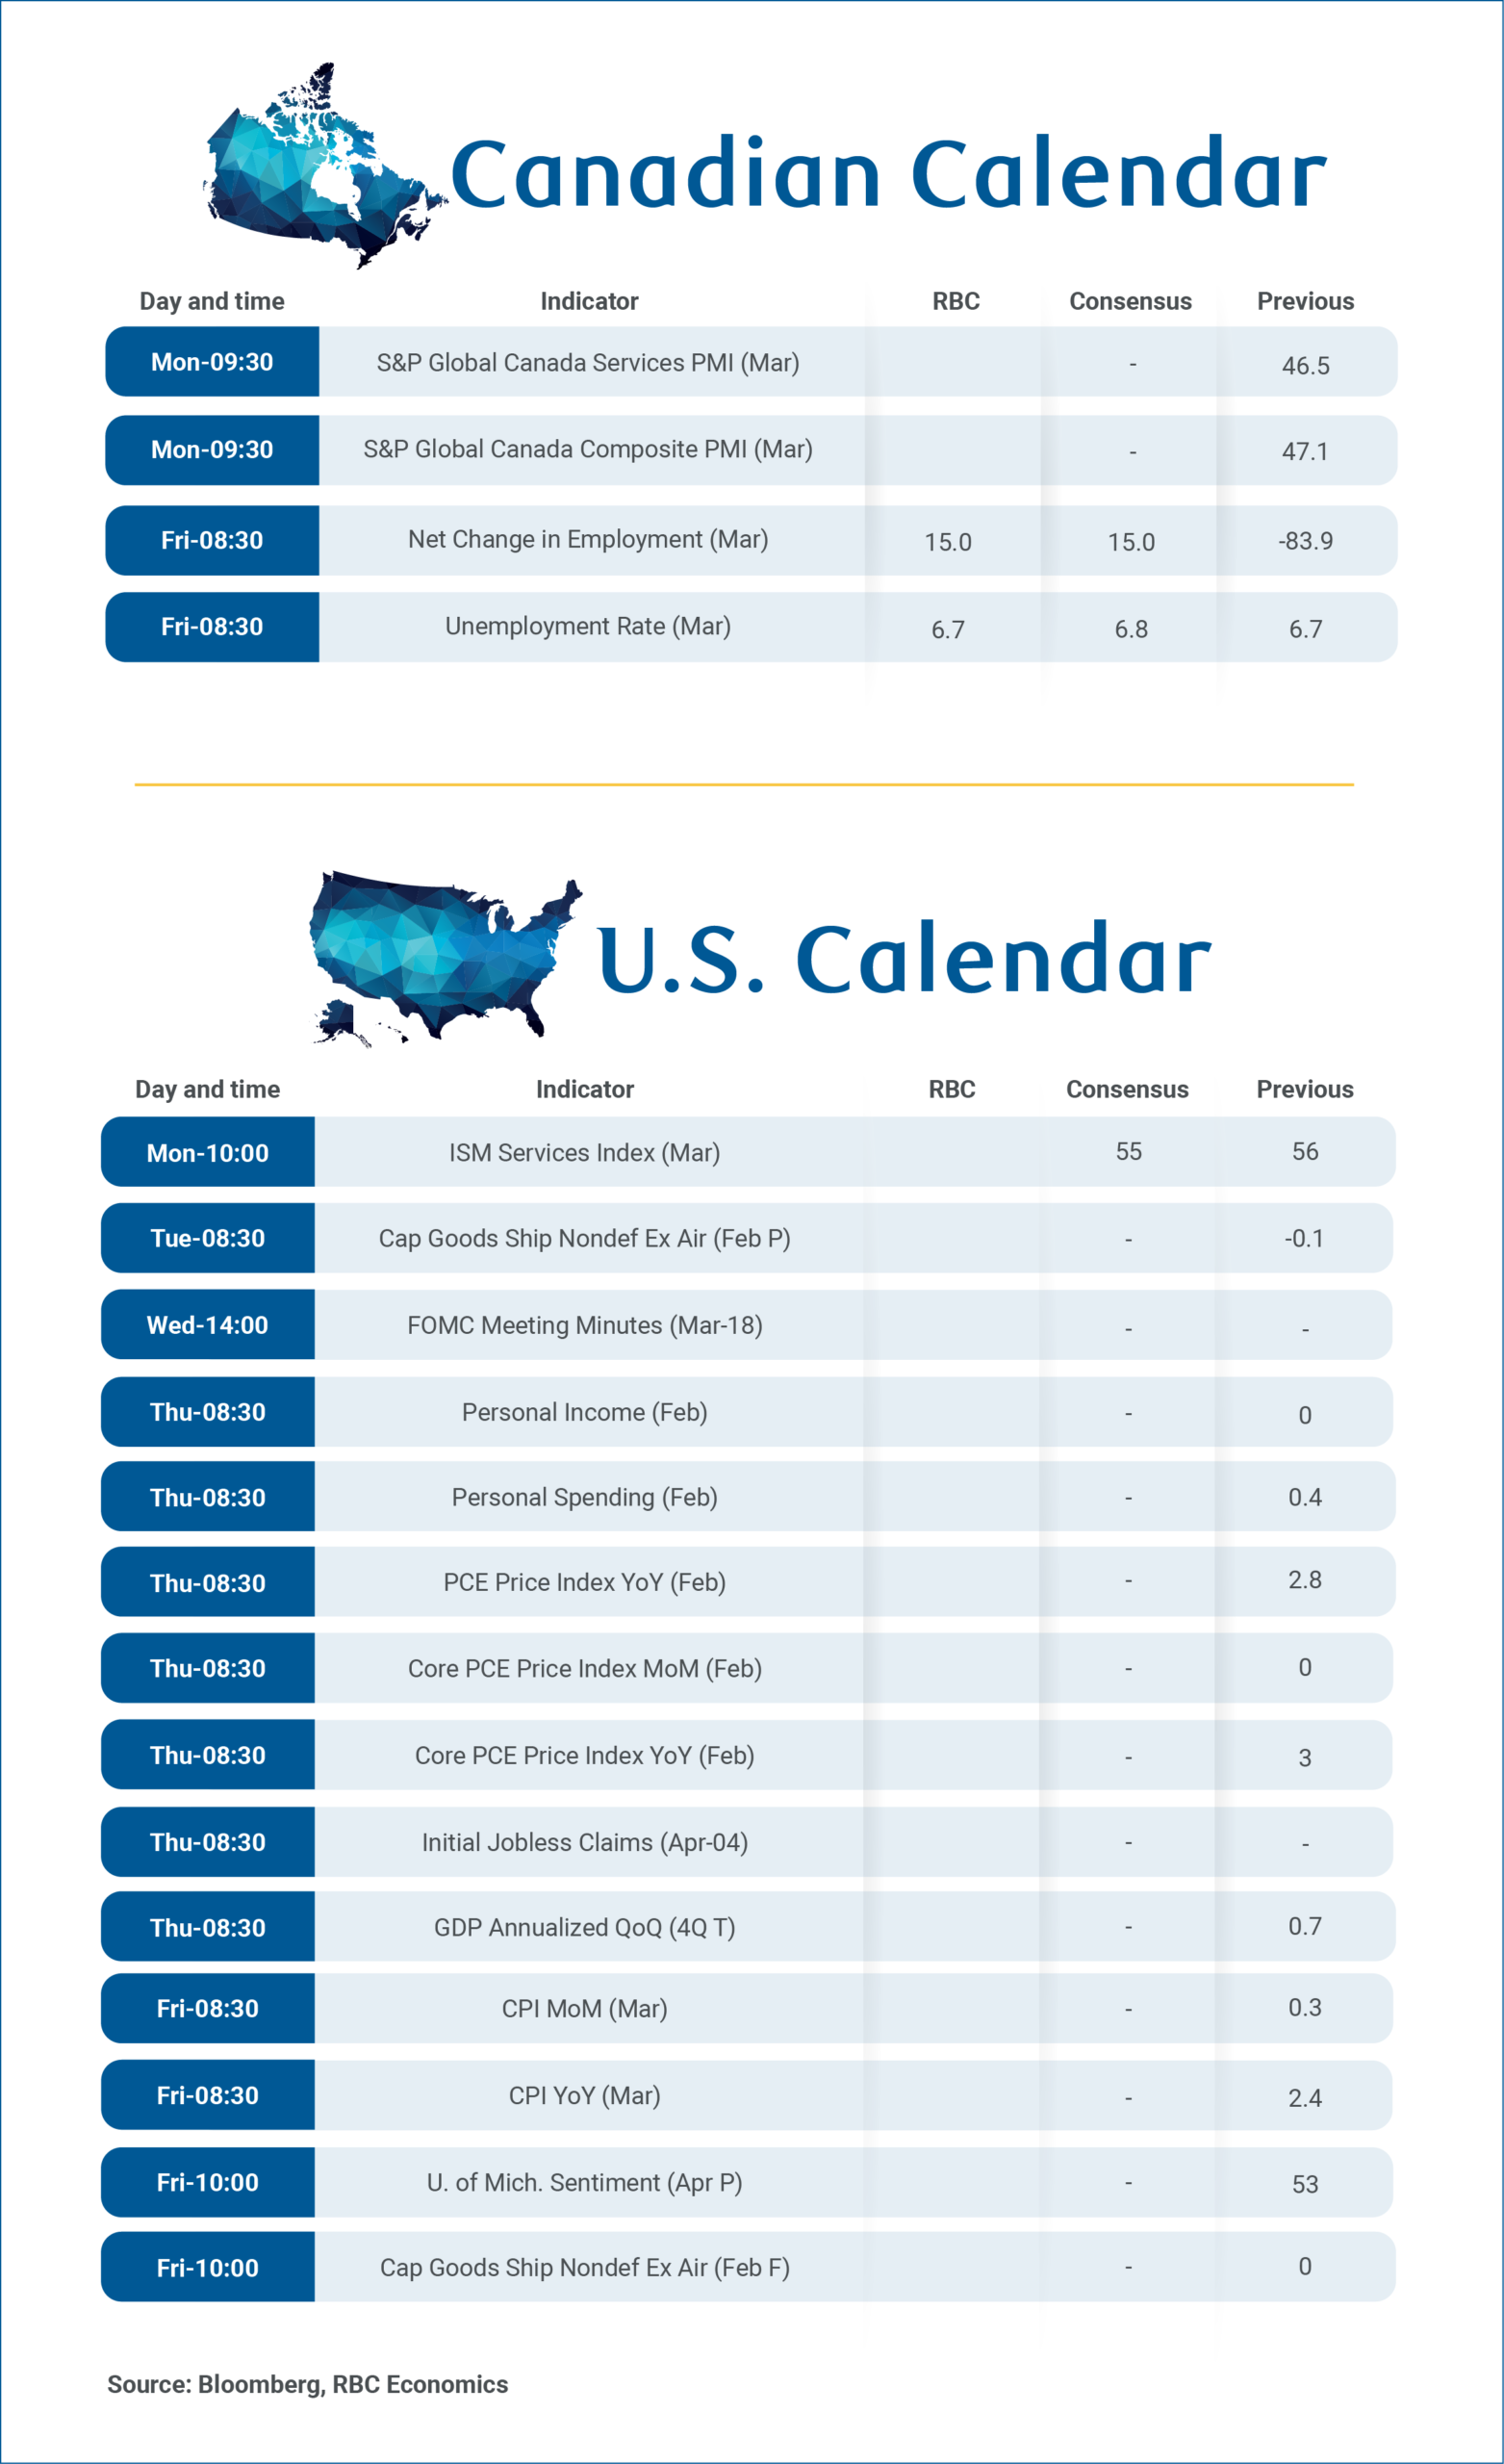
Canadian Jobs Set for Modest Rebound in March
Next Friday’s Canadian Labour Force Survey should show a partial recovery in employment in March after consecutive job losses totalling 109,000 over the prior two months.
The monthly employment data is notoriously volatile, and despite the earlier losses, the unemployment rate still ticked slightly lower over the last two months. It partially retraced a 0.3 percentage point decline in January with a 0.2 percentage point increase to 6.7% in February, still below the 6.8% average in Q4, and recent peak of 7.1% in September.
Young workers aged 15 to 24 accounted for an outsized share of the earlier job losses, representing 60% of the total despite taking up only 14% of the overall labour force. As a result, their unemployment rate increased substantially by 0.7 percentage points in February compared to the Q4 average.
By contrast, the unemployment rate among prime-age workers (aged 25 to 54) has remained relatively steady, trending lower to 5.7% in February from 5.8% in Q4 2025.
Notably, much of the latest increase in the unemployment rate (about half by our count) in February came from a rise in workers that were unemployed, but had a job lined up to start within the next four weeks (future starts). As some of these positions pass start dates, we expect a modest recovery of 15,000 jobs in March—enough to keep the unemployment rate steady at 6.7%.
The increase in future starts coincided with rising job postings in the second half of 2025 into the new year. However, recent data from Indeed.com flagged a sharp reversal in March, possibly due to rising economic uncertainty tied to escalating global geopolitical tensions dampening hiring demand. A similar plunge in job postings was seen in the United States and Australia.
Outlook for hiring remains stable amid uncertainty
Weak hiring sentiment in Canada could extend well into Q2 as geopolitical uncertainty, and ongoing tariff risks persist. However, recent gross domestic product growth numbers have looked better with Statistics Canada’s preliminary estimates pointing to 1 ½ % annualized growth in Q1 after a soft start, supported by resilient domestic demand.
Uncertainty remains elevated, but we retain our outlook that the per-worker labour market should continue to recover this year. Job growth will remain softer than historical norms given rapidly slowing population growth. However, the unemployment rate is tracking well against our prior assumption of 6.6% in Q1, and we expect it to move lower toward 6.3% by year-end.
Next Friday’s March U.S. Consumer Price Index will show a surge in headline inflation after the Middle East conflict pushed oil prices sharply higher. Core CPI, excluding food and energy, is expected to remain largely unchanged from February, driven again by pressure among core services as domestic demand remains strong. Core goods CPI will be closely watched for any tariff passthrough.
U.S. personal spending likely ticked higher in February after retail sales posted a 0.6% monthly increase following a 0.1% decline in January. The gain was driven largely by a 6% month-over-month surge in auto sales. Personal income likely continued its upward trend, as average hourly wages rose 0.3% while hours worked remained flat relative to January.
NFP Preview: Can the Labor Market Withstand “Stagflation” Storm? Implications for DXY & Dow Jones
- Consensus for the March employment report includes a historically sluggish NFP rebound (+50,000 to +65,000) and sticky Average Hourly Earnings (+0.3% to +0.4%).
- A "Stagflation Shock" (low jobs growth under 50k plus high wages over +0.5%) is the worst-case scenario for the Dow Jones, as it traps the Fed from cutting rates.
- Market reactions are split: a bullish NFP beat (>100k) could propel the DXY toward the 100.50 resistance, while a "Goldilocks" outcome (70k–90k) would be cheered by the Dow.
As the market gears up for the April 3rd Non-Farm Payrolls (NFP) release, the narrative has shifted significantly. We are no longer just looking at "hot" or "cold" labor data; we are looking at a Federal Reserve caught between a rock and a hard place, balancing a cooling labor market against a geopolitical oil shock that is threatening to reignite inflation.
Looking at the labor market picture and the chart below shows that firms were not even willing to to hire before the crisis began.
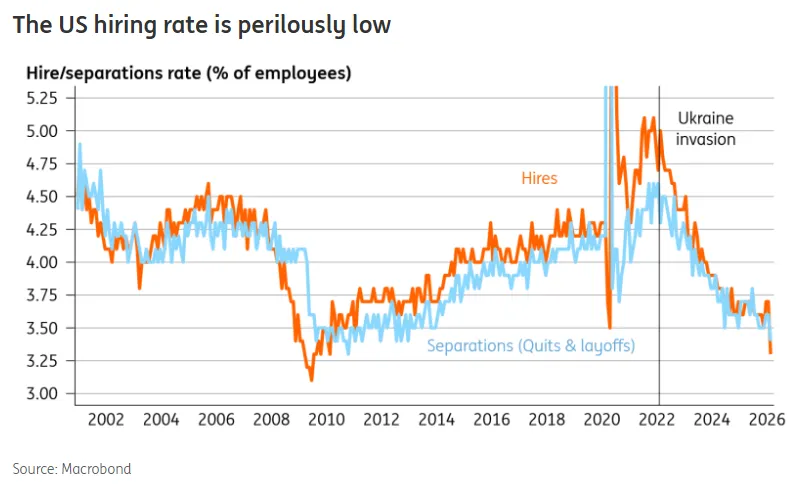
Source: ING, Macrobond
Here is my preview of what to expect from the March employment report and how the US Dollar and Dow Jones might react.
Following a jarring February print that saw a decline of 92,000 jobs, the consensus for March is looking for a modest recovery. However, with "Operation Epic Fury" in the Middle East and the closure of the Strait of Hormuz pushing Brent crude back above $100, the Fed’s focus has pivotally shifted from "supporting growth" back to "fighting energy-driven inflation."
The numbers to watch
- Headline NFP: Consensus sits around +50,000 to +65,000. While a rebound from February’s contraction, this remains a historically sluggish figure.
- Unemployment Rate: Expected to hold steady or edge up slightly to 4.4% or 4.5%.
- Average Hourly Earnings (m/m): Forecasted at +0.3% to +0.4%. This is the "danger zone", if wages remain sticky while jobs growth slows, the "Stagflation" narrative will gain serious legs.
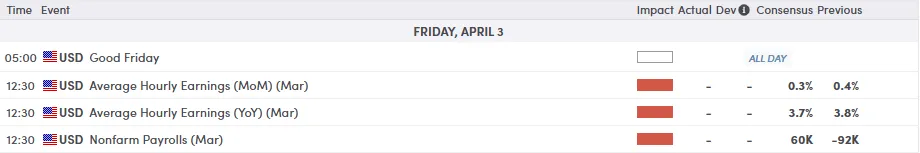
For all market-moving economic releases and events, see the MarketPulse Economic Calendar. (click to enlarge)
Market Implications: The "three-way" split
1. The US Dollar Index (DXY): Testing the Ceiling
The DXY has been oscillating within a 95.50–100.50 range, largely buoyed by safe-haven flows.
- Bullish Scenario (NFP > 100k): A surprise beat would confirm the "war economy's" resilience. Traders would likely price out any remaining 2026 rate cuts, propelling the DXY toward the 100.40–100.50 resistance barrier.
- Bearish Scenario (NFP < 30k): A significant miss would validate "hard landing" fears. We could see the DXY retreat toward the 98.00 support level as markets bet the Fed will be forced to pivot to support the economy despite the oil shock.
2. The Dow Jones (DJIA): Seeking a "Goldilocks" Save
The Dow has recently endured a "tailspin," including heavy intraday slides as the "AI honeymoon" of early 2026 meets the reality of geopolitical risk.
- The "Goldilocks" Outcome (70k–90k): Equities would cheer a moderate number. It suggests the economy is cooling enough to justify future easing without signaling a total collapse in consumer demand. Look for a push back toward the 49,000 handle.
- The Stagflation Shock (Low Jobs + High Wages): This is the worst-case scenario. If payrolls miss (under 50k) but wages jump (+0.5%), the Dow could face a fresh sell-off toward 48,000. This scenario traps the Fed—they can't cut to help the economy because wages and oil are fueling the inflation fire.
Technical Outlook & Final Thoughts
From a technical perspective, the markets are showing signs of exhaustion. The US Dollar is forming what looks like a triple top near 100.50, while the Dow is desperately clinging to psychological support levels.
With most markets closed on Friday for the Easter break, the real "fireworks" may be delayed until the Monday open.
Market participants should keep a close eye on the revisions to the February data, if that -92k figure is revised even lower, the "low-hire, low-fire" stabilization narrative might crumble, giving way to a much deeper concern about the health of the American consumer.
US Dollar Index (DXY) Daily Chart, April 2, 2026
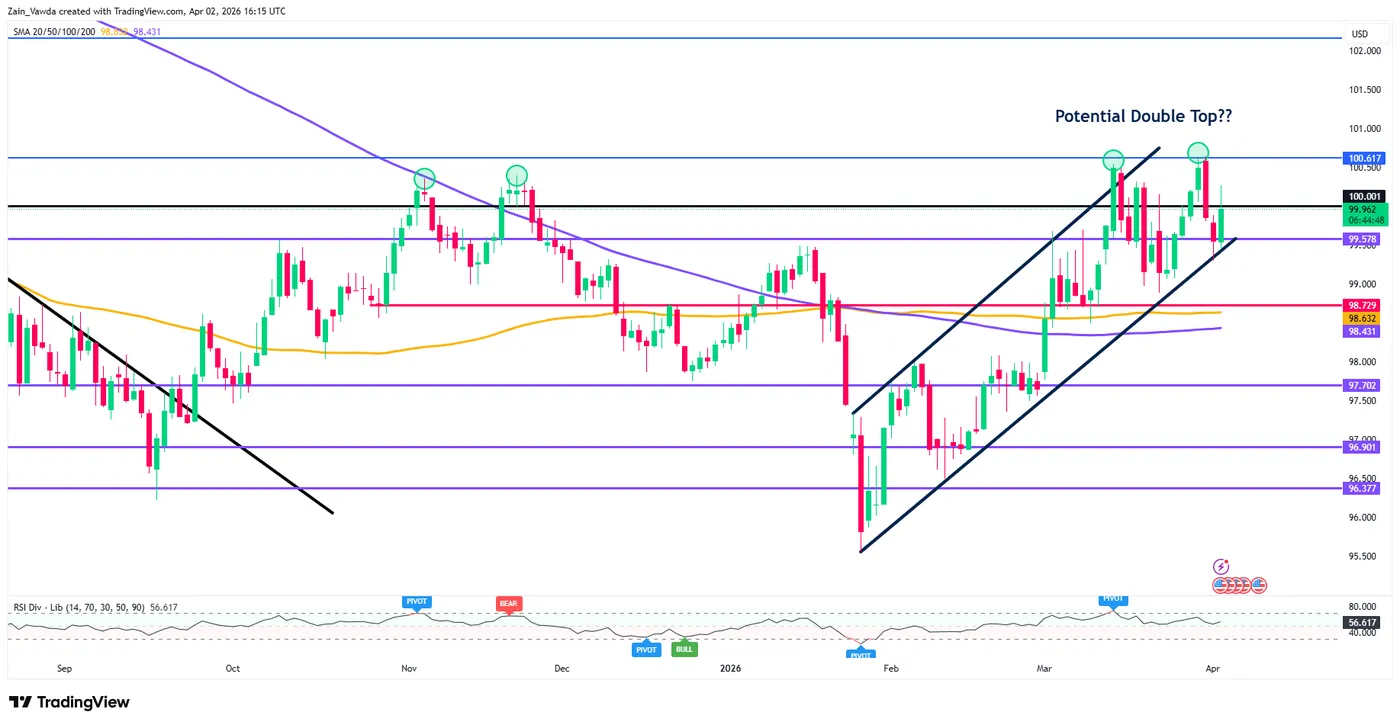
Source: TradingView (click to enlarge)
The "North Star" for the Fed is moving. If the NFP provides a hawkish surprise, the "Higher-for-Longer" mantra is back with a vengeance. If it misses, the Fed's 3.50%–3.75% hold might be shorter than they’d like to admit.
Stay disciplined, watch your levels, and keep an eye on the headlines.
Crude Oil (WTI & Brent) Keeps Playing Tricks on Markets 32 Days into the Iran War
- WTI and Brent Crude Oil Technical Analysis with key levels ahead of the long Easter weekend
- Crude Oil is once again in the center stage after yesterday's Trump address
- Volatility will remain as long as Oil does not correct below $100
President Trump has just finished speaking in yet another public address, boasting that the ongoing conflict is so efficient and revolutionary, and comparing the long-lasting historical conflicts in the United States with the current advancement in objectives.
But Markets don't care anymore. What they want to see is a proper solution for the Strait of Hormuz.
Despite strong reactions to his speeches during the first days of the War, traders and algorithms have progressively stopped reacting to any overly optimistic announcement from the Administration. As a matter of fact, reactions to them are now doing the exact opposite.
After his speech at the White House yesterday, Global Assets began to tumble from a sweep higher in Energy commodities – Crude prices rose in a flash from $100 to $114 (WTI). While Participants were becoming more hopeful that the conflict would end within the early-announced deadlines (5 weeks, then April 6), a more aggressive tone led to a Market-shaking explosion, as the party quickly finished and left a general hangover.
Combine the worsening tone with high-tier catalysts ahead, like tomorrow's Non-Farm Payrolls (check our preview!), closed Stock Markets (only Futures will be open until 1:30 PM ET), and the potential for an escalation, including a ground invasion over the long weekend, and that was enough of a hit to blow up the tires from the bull-train.
Talk won't be enough to soothe Markets in the long term – Oil is what Smart Money is looking to move their chess pieces in this gigantic geopolitical puzzle.
Hence, let's dive right into an intraday outlook for both WTI and Brent Oil, highlighting their technical levels and outlining scenarios for their breakouts or breakdowns.
Crude Oil Market Check and Technical Levels ahead of the Long Weekend
WTI 4H Chart
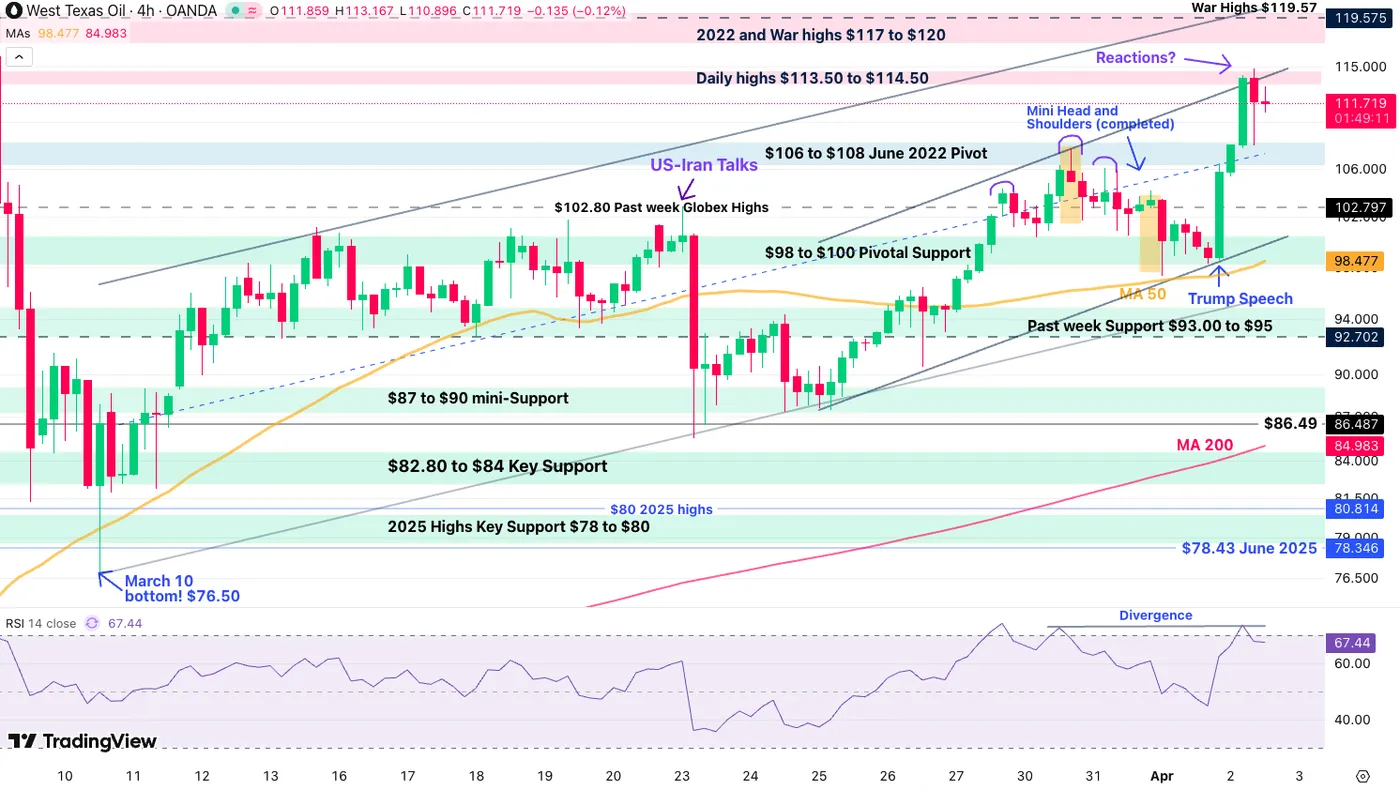
WTI Oil 4H Chart – April 2, 2026. Source: TradingView
WTI has indeed reached concerning levels after yesterday's address, the second highest since the beginning of the conflict, bouncing on the 4H 50-period Moving Average.
Evolving in two different bull channels, the larger one is less reactive but more concerning, pointing to the potential of another top at $120 if bears fail to correct prices.
The second bull channel, of smaller scale, would see a potential top having already been formed, and would see its bottom at $100 – RSI is forming a bearish divergence which could prompt this smaller channel to hold.
As long as WTI remains above $100, investors won't be able to generate much progress in sentiment. Tomorrow's Non-Farm Payrolls shouldn't have much effect on Oil but the general weekend risk will – Hence, traders will be listening closely to the advancement of the War.
WTI Technical Levels:
Resistance Levels
- Daily highs $113.50 to $114.50 (small channel top)
- 2022 and Monday highs $117 to $120 (larger channel top)
- Ukraine War Spike $120 to $124
Support Levels
- $106 to $108 June 2022 Pivot
- $98 to $100 Momentum Support & 4H 50-period MA (bearish below)
- Pivotal Support $93.00 to $95
- $82.80 to $84 Key Support
- War flows Pivot $65.00 to $66.00
Brent 4H Chart
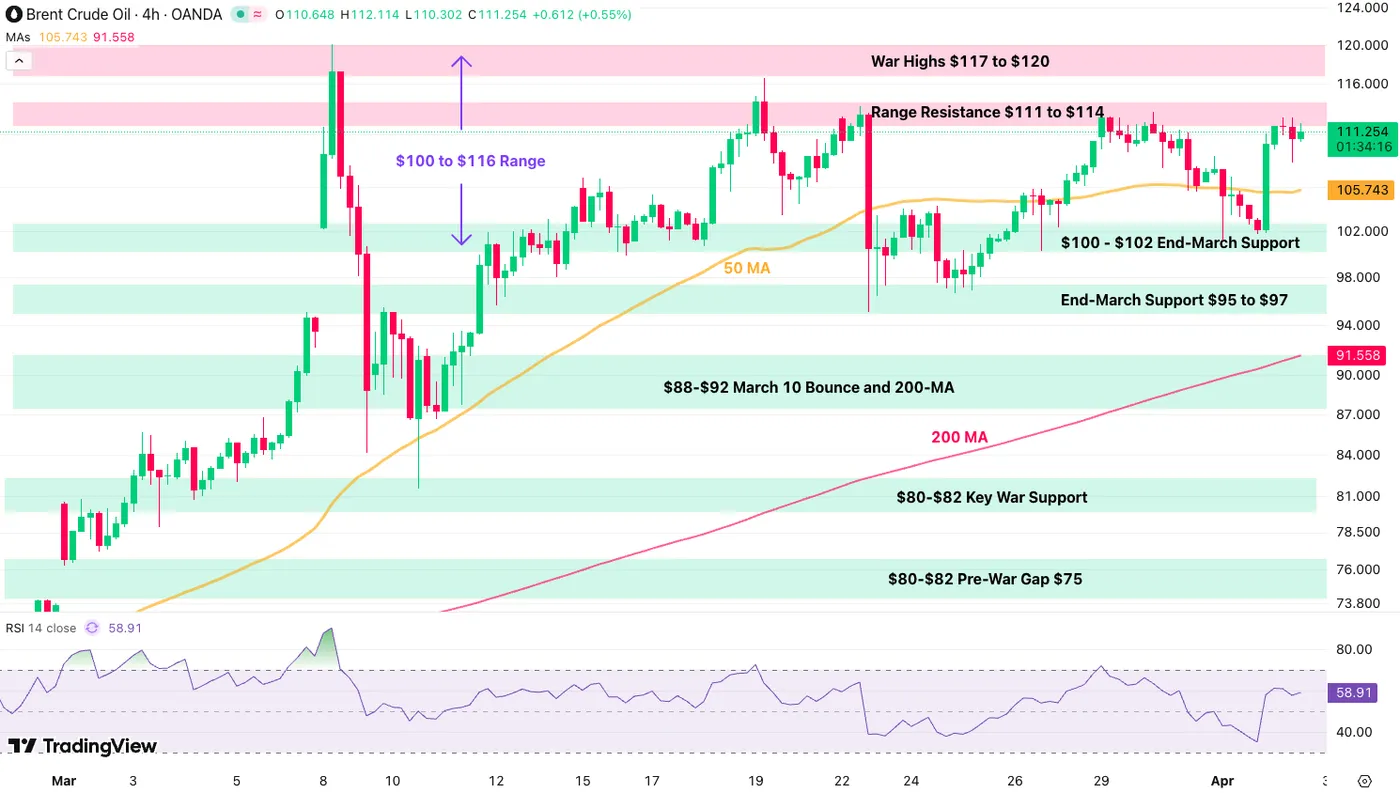
Brent Oil 4H Chart – April 2, 2026. Source: TradingView
Brent is in a much more contained price action compared to WTI, effectively stuck in a $100 to $116 range since Mid-March.
The range is now consolidating in a tighter trading between $102 to $114 which brings more definite breakout levels.
- Above the mini-range resistance ($111 to $114), expect further Market stress
- Below $100 to $102 however, expect sentiment to rebound swiftly
The worst case scenario is avoided in Markets as long as Brent does not break the War spike at $120 – After this, expect a catastrophic price action and rate hikes pricing to continue.
Brent Technical Levels:
Resistance Levels
- Range Resistance $111 to $114
- War Highs $117 to $120
- Ukraine War Spike $130 to $135
Support Levels
- $100 - $102 End-March and Range Support
- End-March minor Support $95 to $97
- $88 - $92 March 10 Bounce and 200-MA
- $80 - $82 Key War Support
- Pre-War Gap $75
Keep track of the headlines and watch out for large gaps and sweeps in coming periods (with many players absent for the Easter long weekend).
Safe Trades!